Independence Contract Drilling Inc
Independence Contract Drilling — EnerCom Denver The Energy Investment Conference 2022
43 slides from Independence Contract Drilling's conference presentation, Aug 8, 2022
Slide 1: Independence Contract Drilling, EnerCom Denver Energy Investment Conference
1 1 Independence Contract Drilling, Inc. August 8, 2022 EnerCom Denver The Energy Investment Conference
Slide 2: Forward-looking statements
2 2 2 Various statements contained in this presentation, including those that express a belief, expectation or intention, as well a s t hose that are not statements of historical fact, are forward - looking statements. These forward - looking statements may include projections and estimates concerni
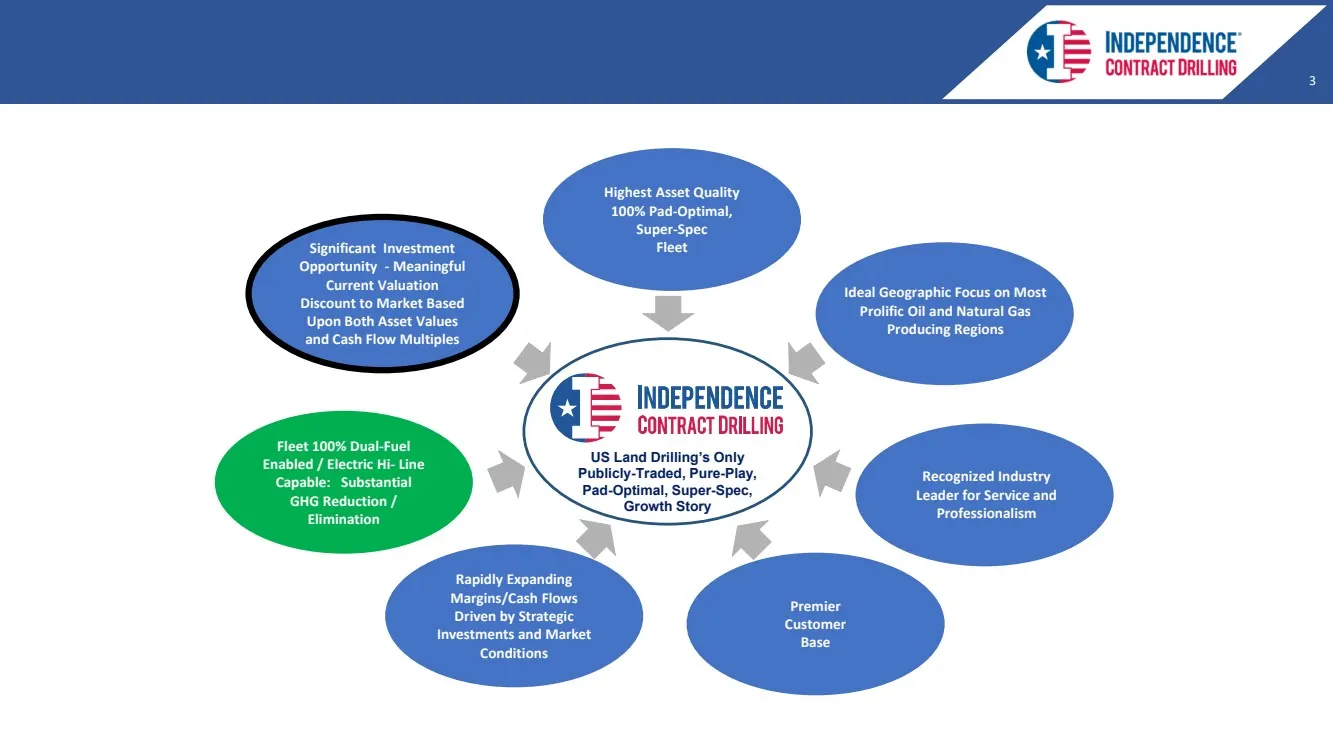
Slide 3: US Land Drilling's Only Publicly-Traded, Pure-Play Growth Story
3 3 3 US Land Drilling’s Only Publicly - Traded, Pure - Play, Pad - Optimal, Super - Spec, Growth Story Highest Asset Quality 100% Pad - Optimal, Super - Spec Fleet Premier Customer Base Rapidly Expanding Margins/Cash Flows Driven by Strategic Investments and Market Conditions Significant Investment
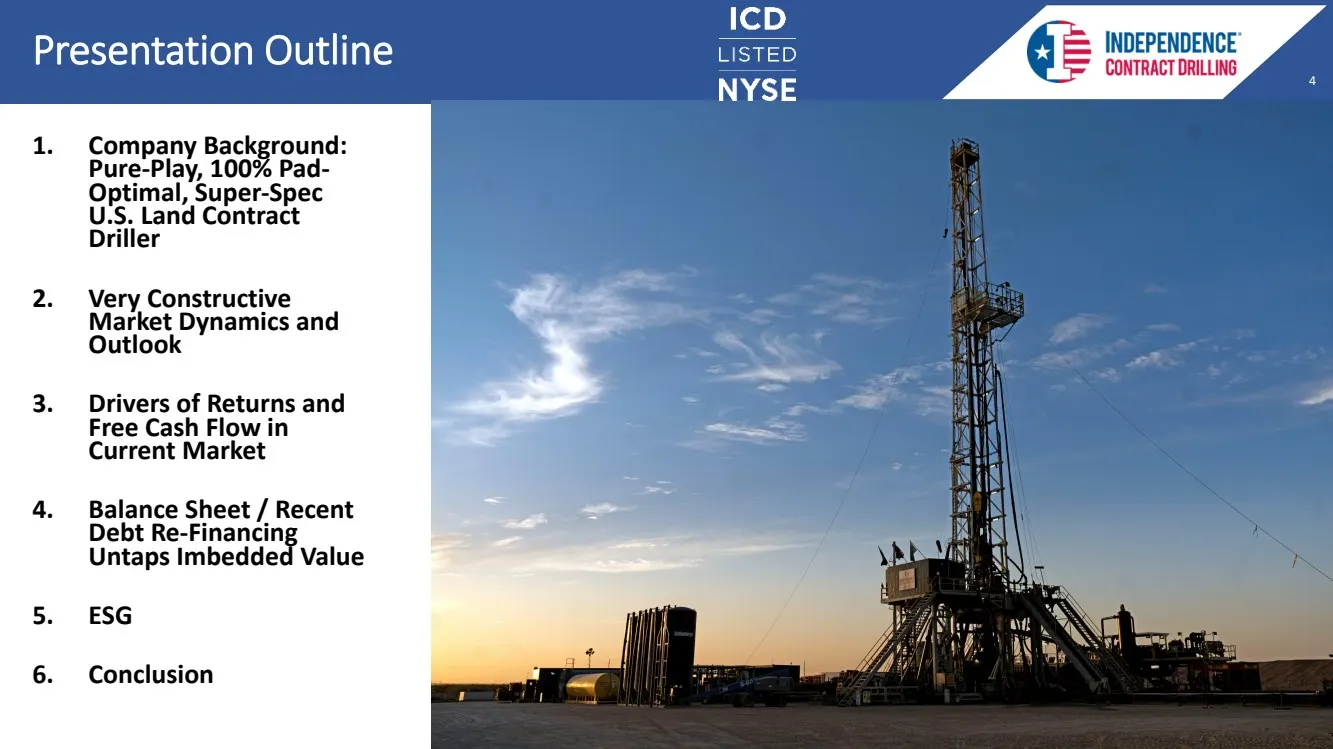
Slide 4: Presentation Outline
4 4 4 1. Company Background: Pure - Play, 100 % Pad - Optimal, Super - Spec U.S. Land Contract Driller 2. Very Constructive Market Dynamics and Outlook 3. Drivers of Returns and Free Cash Flow in Current Market 4. Balance Sheet / Recent Debt Re - Financing Untaps Imbedded Value 5. ESG 6. Conclusion
Slide 5: Company Background
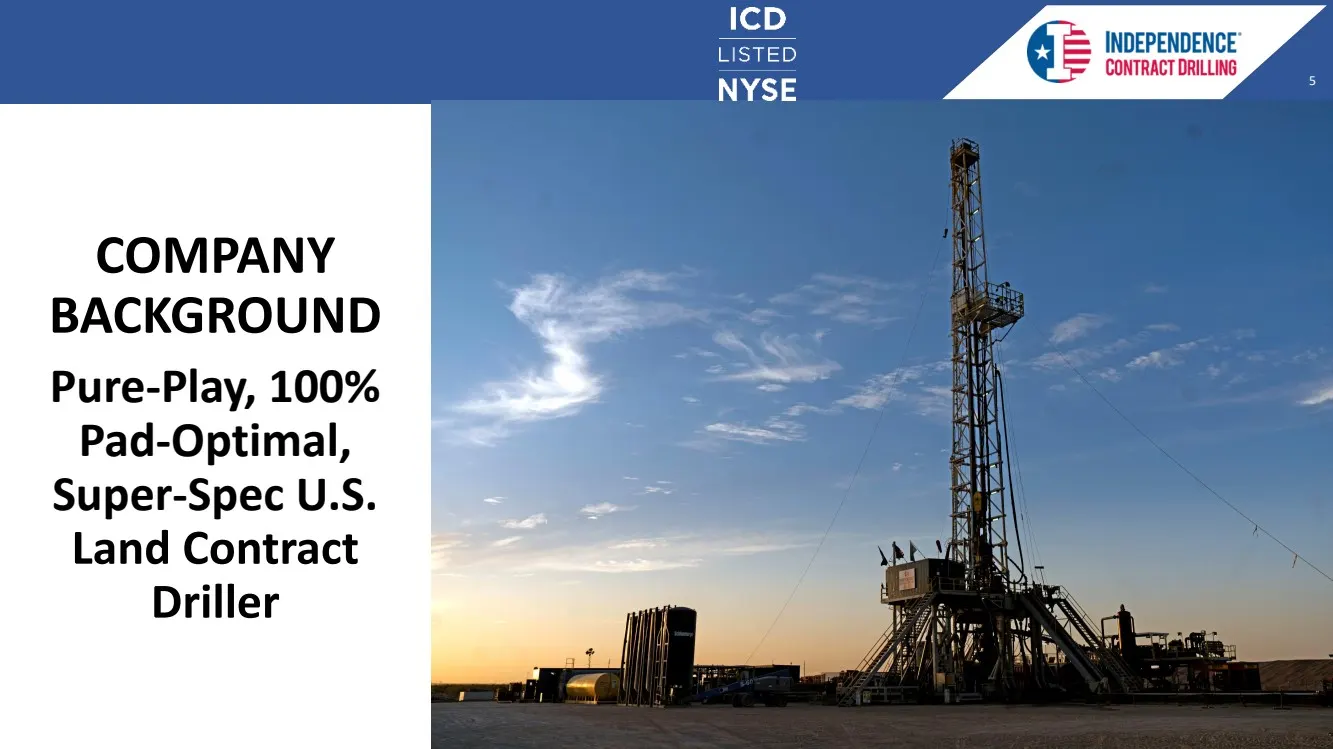
5 5 5 COMPANY BACKGROUND Pure - Play, 100% Pad - Optimal, Super - Spec U.S. Land Contract Driller
Slide 6: Introduction: ICD
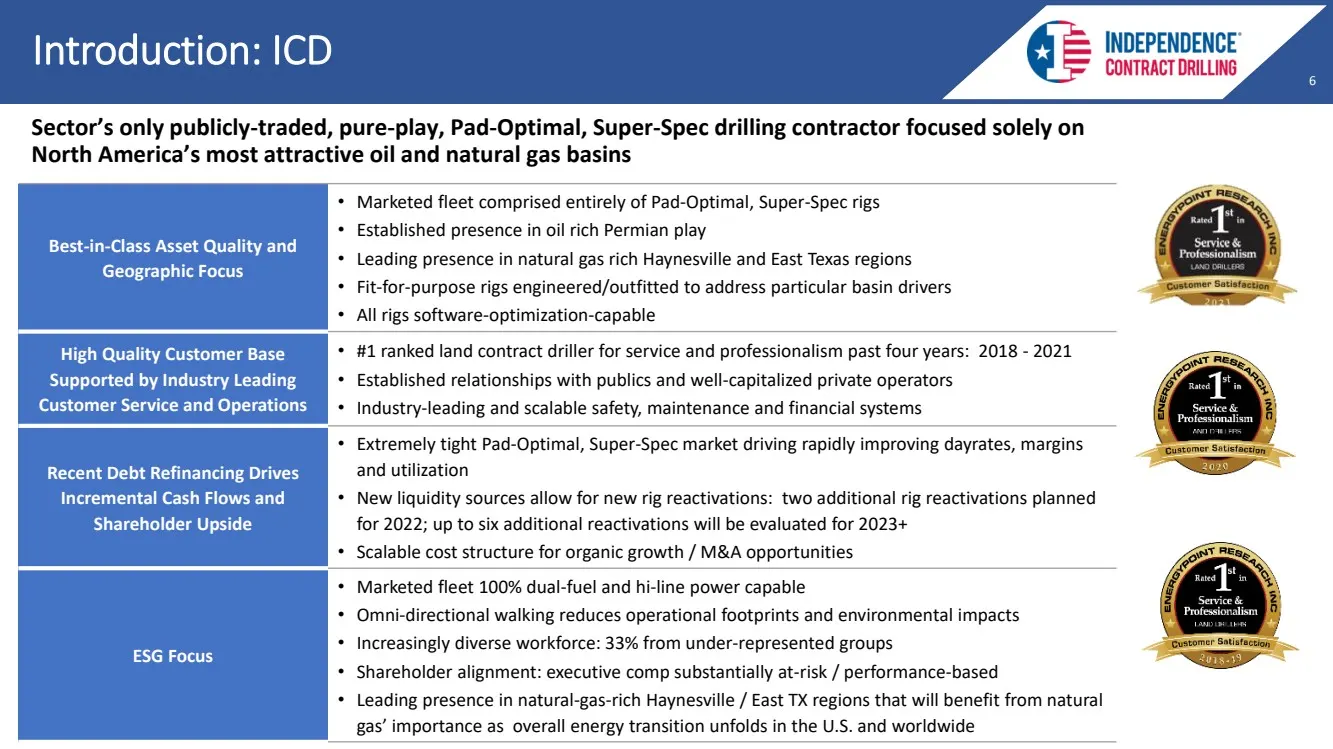
6 6 6 Introduction: ICD Best - in - Class Asset Quality and Geographic Focus • Marketed fleet comprised entirely of Pad - Optimal, Super - Spec rigs • Established presence in oil rich Permian play • Leading presence in natural gas rich Haynesville and East Texas regions • Fit - for - purpose rigs en
Slide 7: 2Q'22 Conference Call Highlights
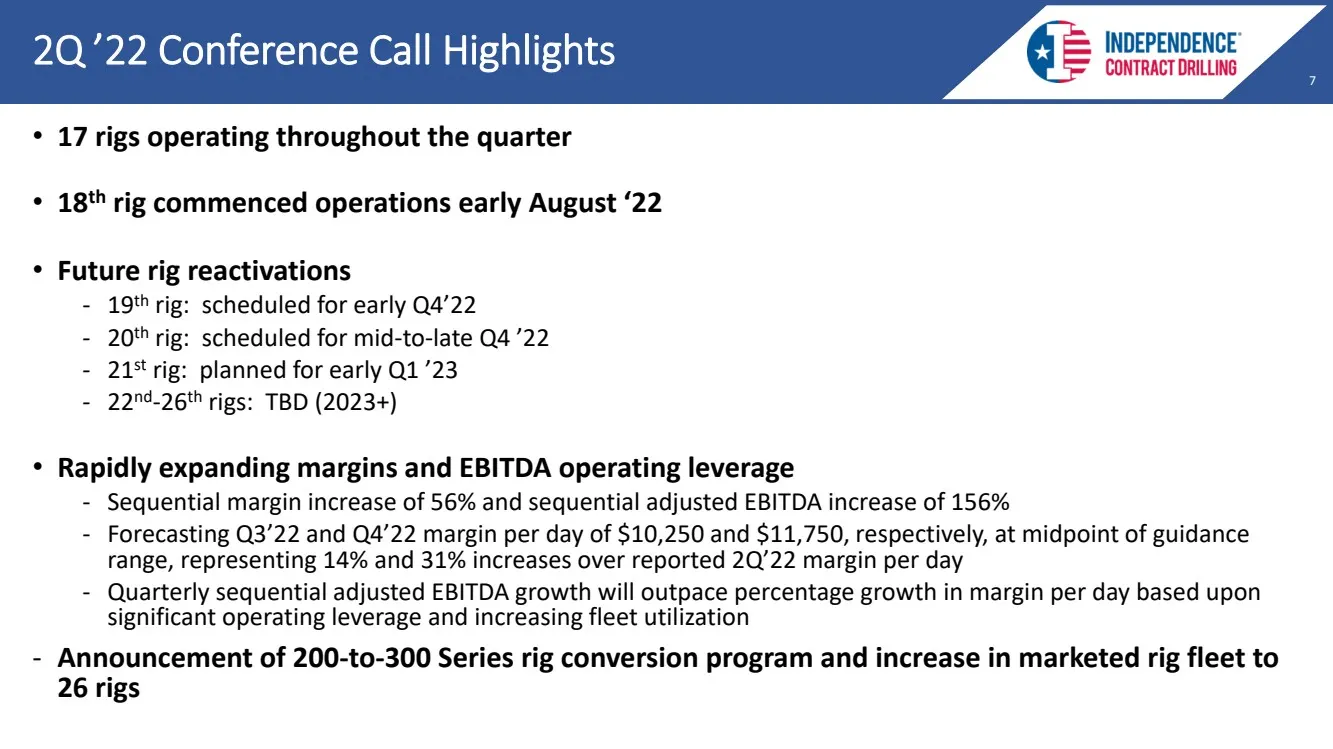
7 7 7 • 17 rigs operating throughout the quarter • 18 th rig commenced operations early August ‘22 • Future rig reactivations - 19 th rig: scheduled for early Q4’22 - 20 th rig: scheduled for mid - to - late Q4 ’22 - 21 st rig: planned for early Q1 ’23 - 22 nd - 26 th rigs: TBD (2023+) • Rapidly exp
Slide 8: Rig Fleet & Geographic Markets
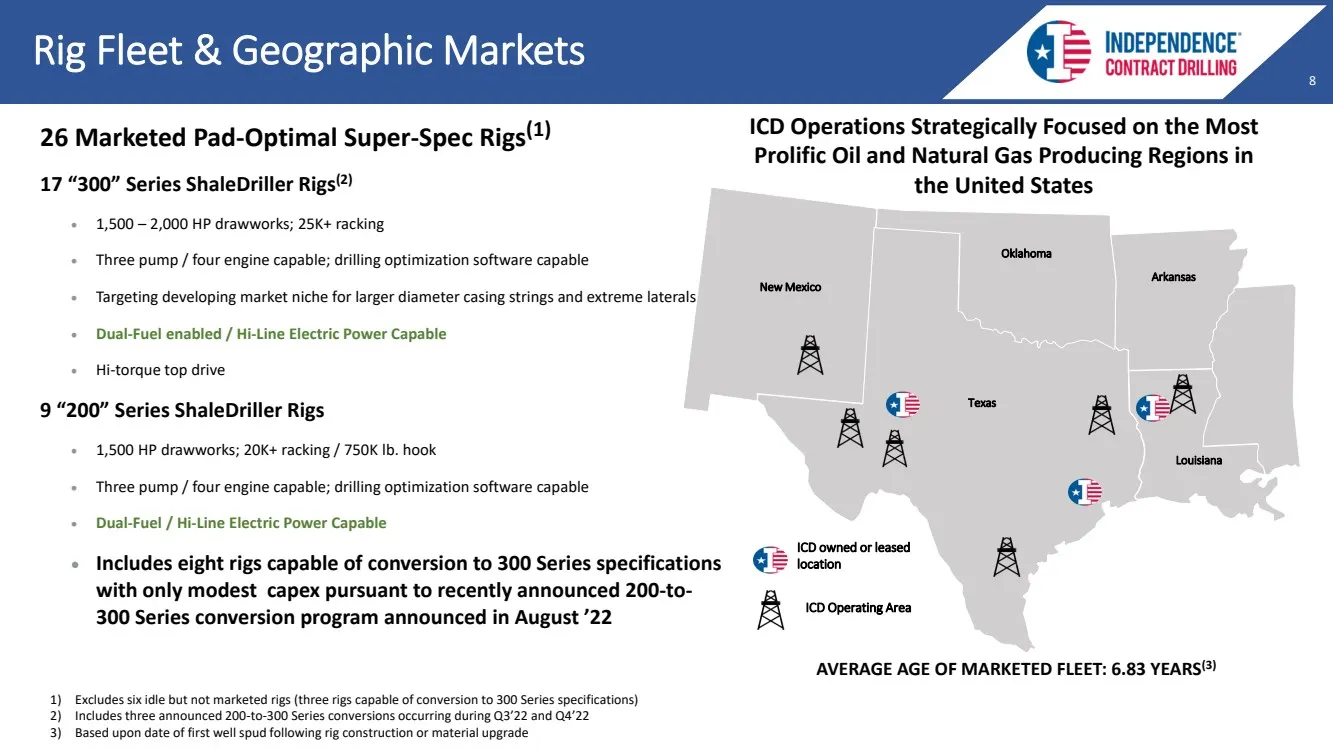
8 8 8 Rig Fleet & Geographic Markets Texas Oklahoma Arkansas Louisiana New Mexico ICD owned or leased location ICD Operating Area AVERAGE AGE OF MARKETED FLEET: 6.83 YEARS (3) 26 Marketed Pad - Optimal Super - Spec Rigs (1) 17 “300” Series ShaleDriller Rigs (2) • 1,500 – 2,000 HP drawworks ; 25K+ ra
Slide 9: 300 Series Rigs Lead Transformation of Operating Fleet
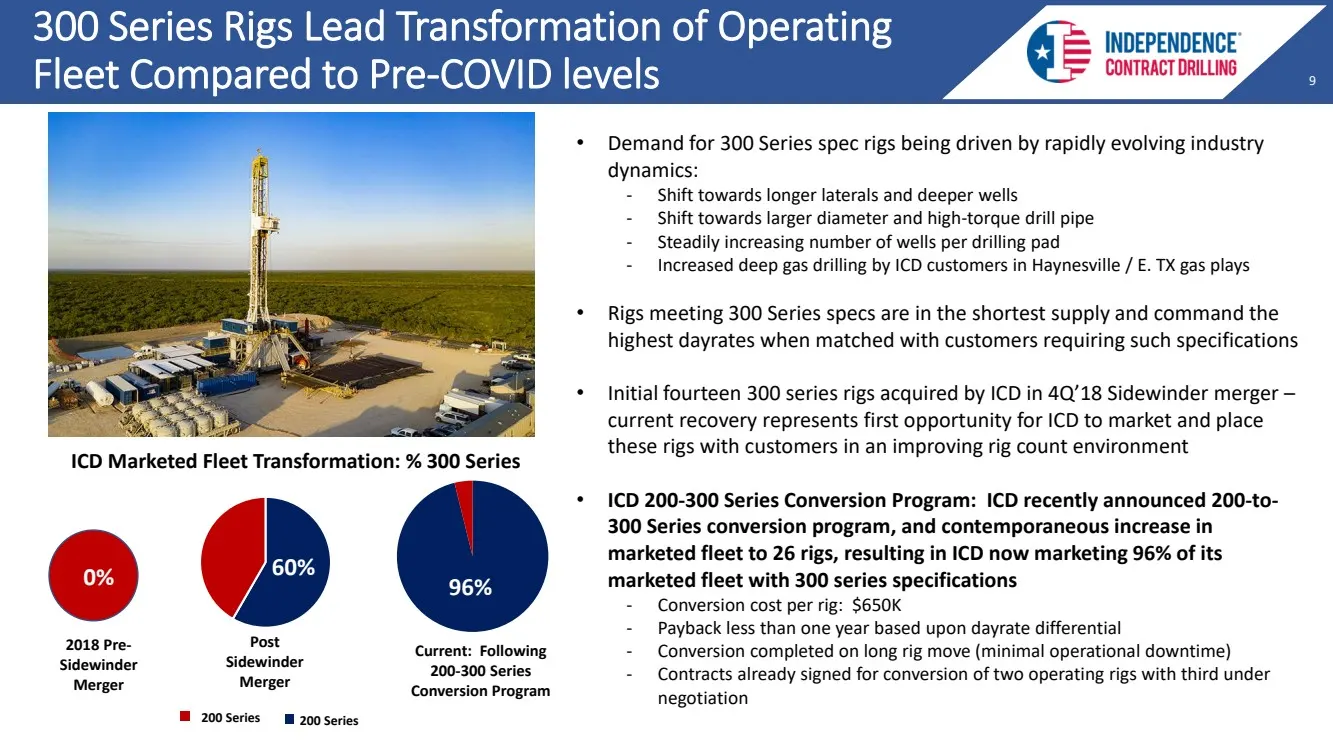
9 9 9 300 Series Rigs Lead Transformation of Operating Fleet Compared to Pre - COVID levels • Demand for 300 Series spec rigs being driven by rapidly evolving industry dynamics: - Shift towards longer laterals and deeper wells - Shift towards larger diameter and high - torque drill pipe - Steadily i
Slide 10: ICD Margins Rapidly Expanding Beyond Pre-COVID Levels
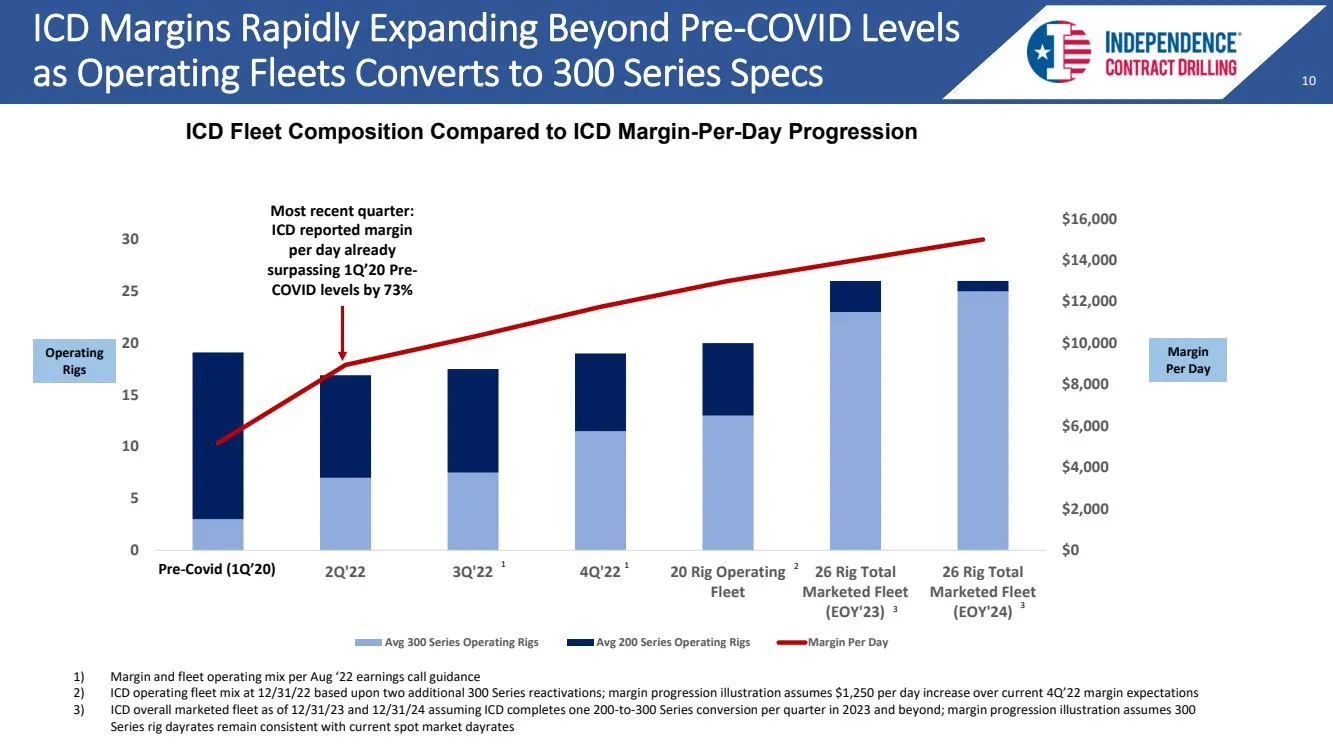
10 10 10 ICD Margins Rapidly Expanding Beyond Pre - COVID Levels as Operating Fleets Converts to 300 Series Specs ICD Fleet Composition Compared to ICD Margin - Per - Day Progression 1 1) Margin and fleet operating mix per Aug ‘22 earnings call guidance 2) ICD operating fleet mix at 12/31/22 based u
Slide 11: Strategically Marketing ICD Fleet Across Target Markets
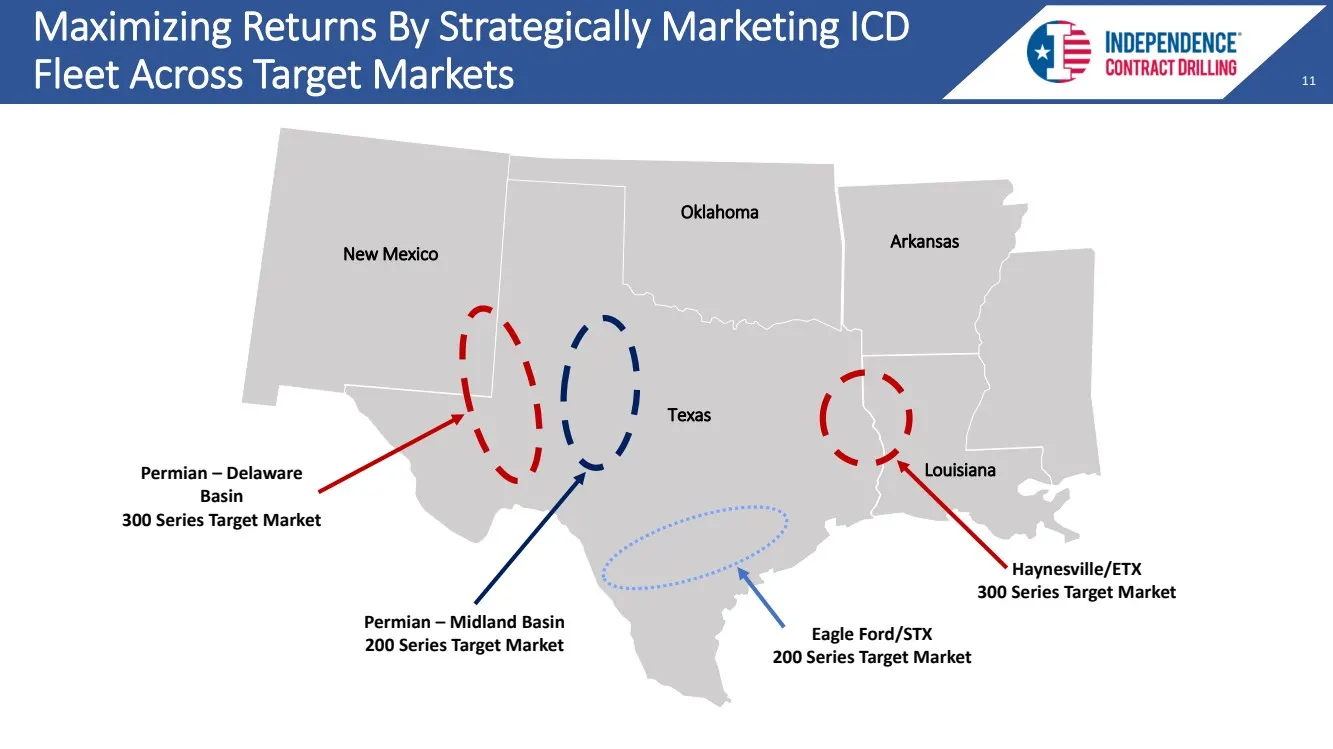
11 11 11 Maximizing Returns By Strategically Marketing ICD Fleet Across Target Markets Texas Oklahoma Arkansas Louisiana New Mexico Permian – Midland Basin 200 Series Target Market Eagle Ford/STX 200 Series Target Market Haynesville/ETX 300 Series Target Market Permian – Delaware Basin 300 Series Ta
Slide 12: Geographic Mix / Customer Relationships
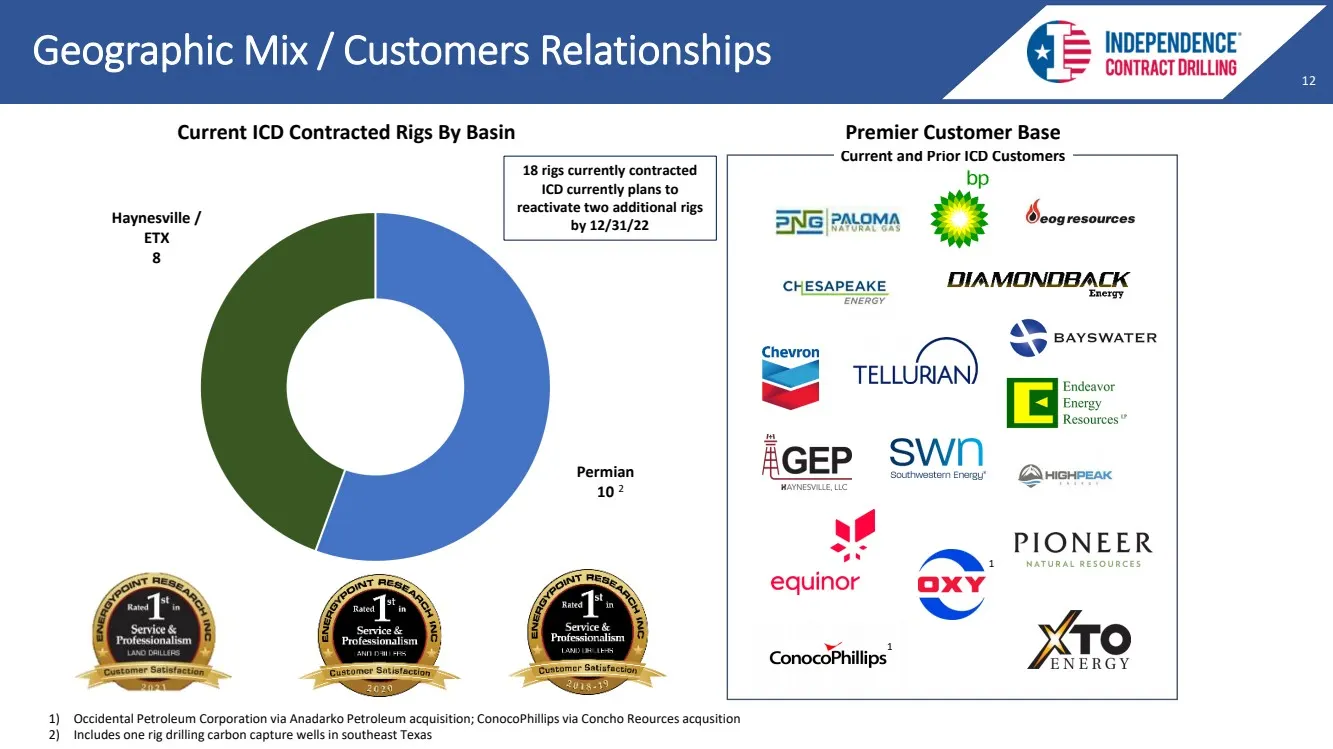
12 12 12 Geographic Mix / Customers Relationships Current and Prior ICD Customers Premier Customer Base Current ICD Contracted Rigs By Basin 1) Occidental Petroleum Corporation via Anadarko Petroleum acquisition; ConocoPhillips via Concho Reources acqusition 2) Includes one rig drilling carbon captu
Slide 13: Very Constructive Market Dynamics and Outlook
13 13 13 Very Constructive Market Dynamics and Outlook
Slide 14: Defining a Pad-Optimal, Super-Spec Rig
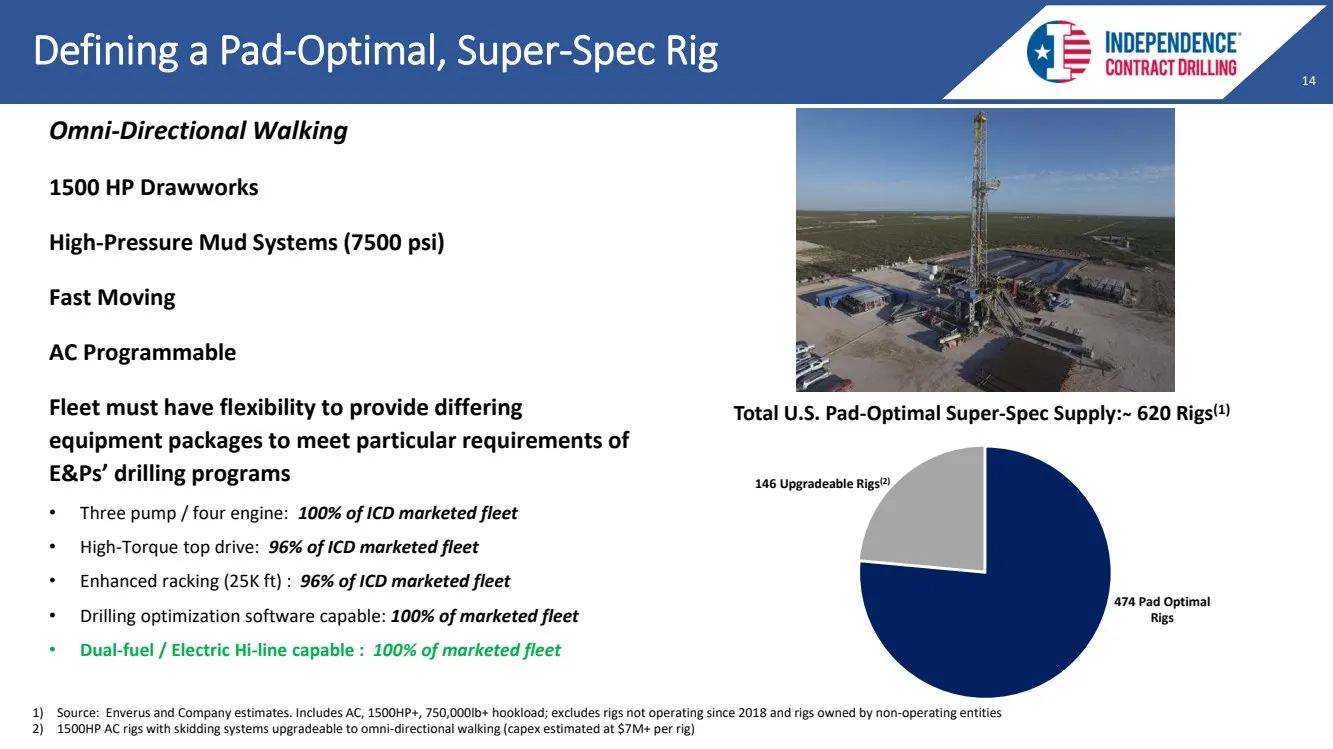
14 14 14 Defining a Pad - Optimal, Super - Spec Rig Omni - Directional Walking 1500 HP Drawworks High - Pressure Mud Systems (7500 psi) Fast Moving AC Programmable Fleet must have flexibility to provide differing equipment packages to meet particular requirements of E&Ps’ drilling programs • Three p
Slide 15: Drivers for Expected Improvements in Utilization / Dayrates
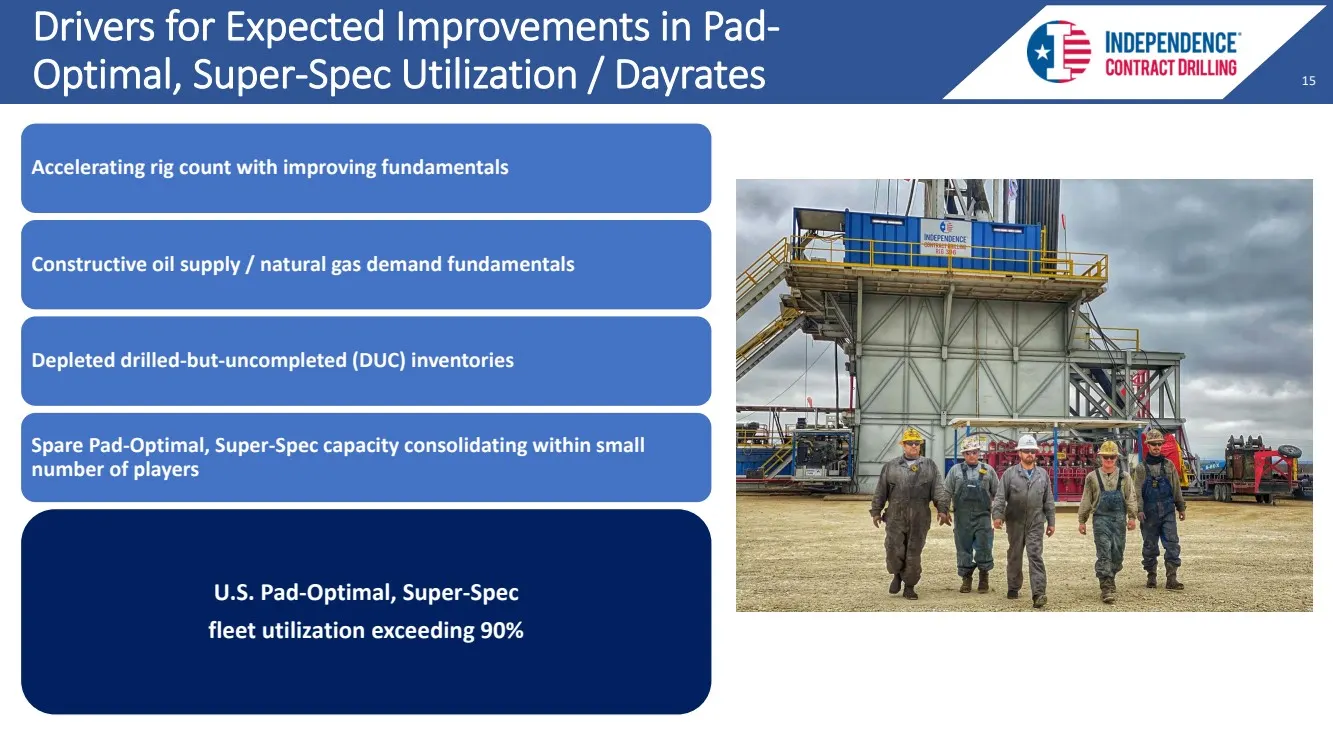
15 15 15 Accelerating rig count with improving fundamentals Constructive oil supply / natural gas demand fundamentals Depleted drilled - but - uncompleted (DUC) inventories Spare Pad - Optimal, Super - Spec capacity consolidating within small number of players U.S. Pad - Optimal, Super - Spec fleet
Slide 16: ICD Fleet Utilization Growth Outperforming Overall Market
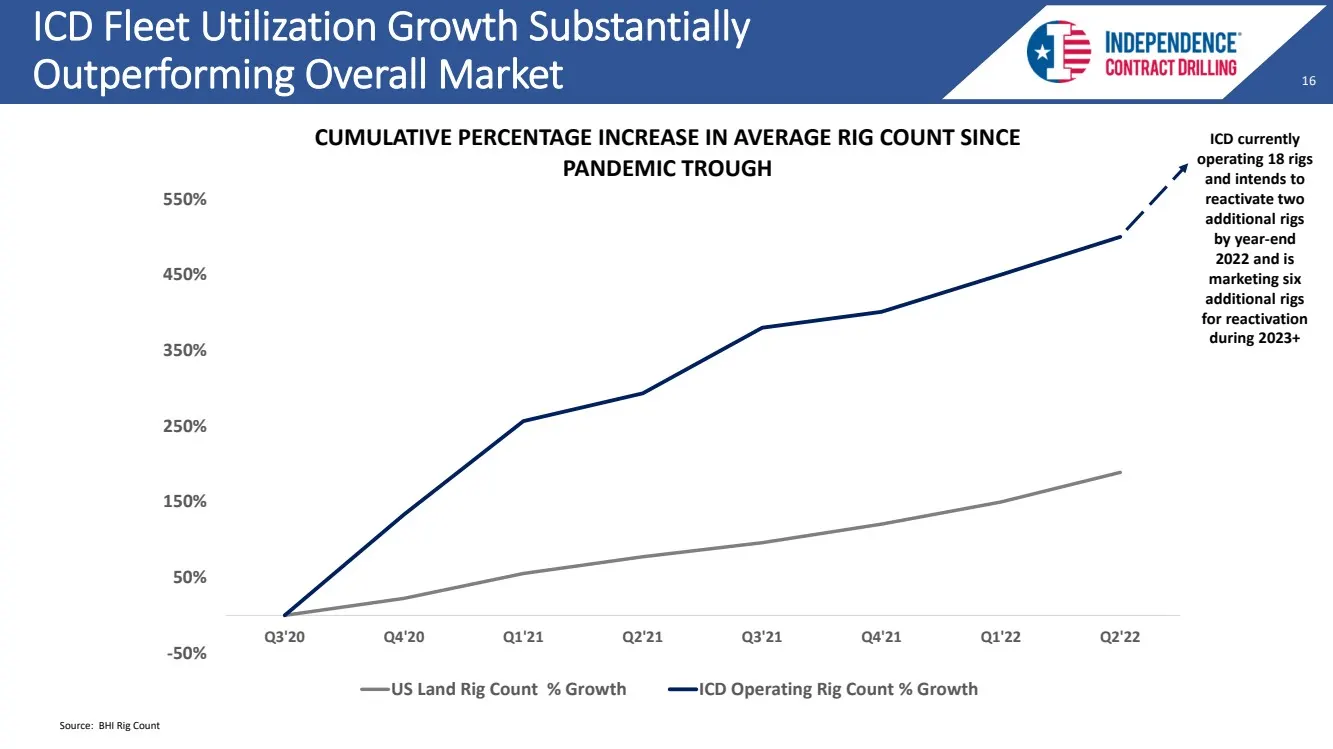
16 16 16 ICD Fleet Utilization Growth Substantially Outperforming Overall Market -50% 50% 150% 250% 350% 450% 550% Q3'20 Q4'20 Q1'21 Q2'21 Q3'21 Q4'21 Q1'22 Q2'22 CUMULATIVE PERCENTAGE INCREASE IN AVERAGE RIG COUNT SINCE PANDEMIC TROUGH US Land Rig Count % Growth ICD Operating Rig Count % Growth Sou
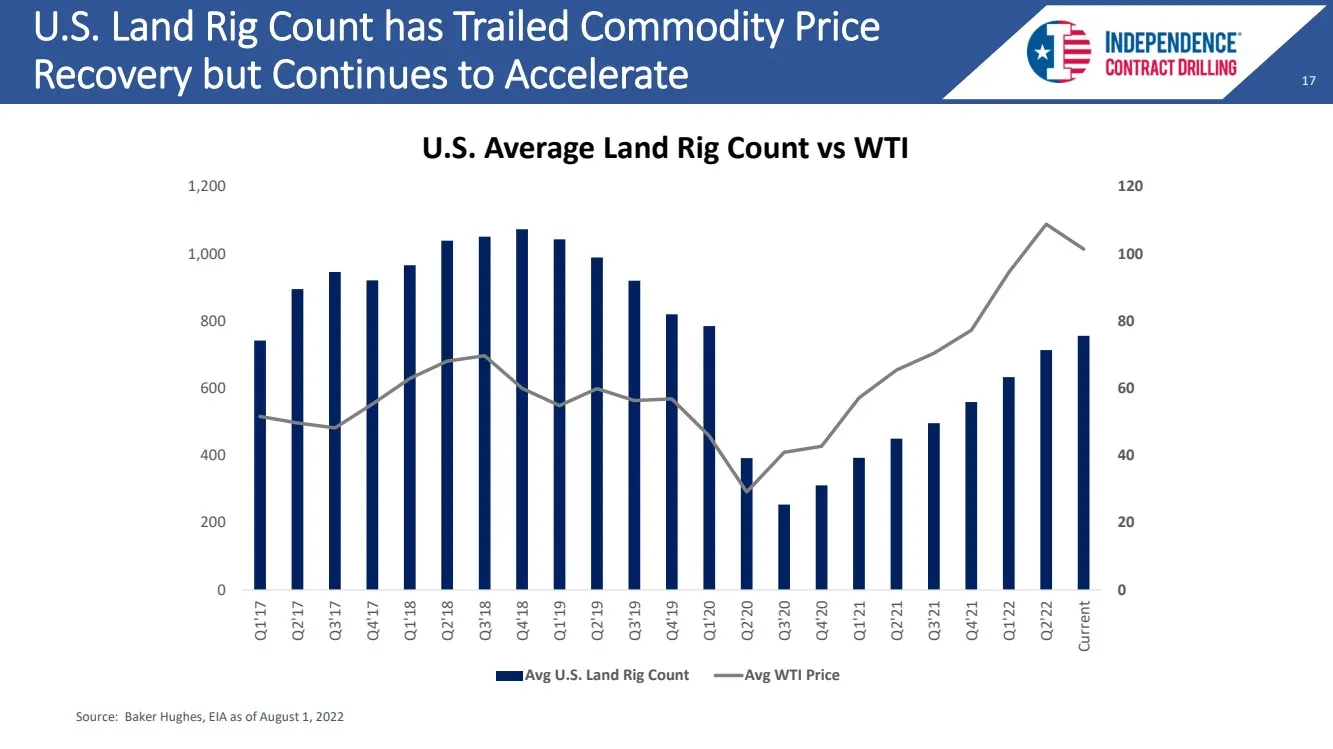
Slide 17: U.S. Land Rig Count Trailed Commodity Price Recovery
17 17 17 U.S. Land Rig Count has Trailed Commodity Price Recovery but Continues to Accelerate 0 20 40 60 80 100 120 0 200 400 600 800 1,000 1,200 Q1'17 Q2'17 Q3'17 Q4'17 Q1'18 Q2'18 Q3'18 Q4'18 Q1'19 Q2'19 Q3'19 Q4'19 Q1'20 Q2'20 Q3'20 Q4'20 Q1'21 Q2'21 Q3'21 Q4'21 Q1'22 Q2'22 Current U.S. Average L
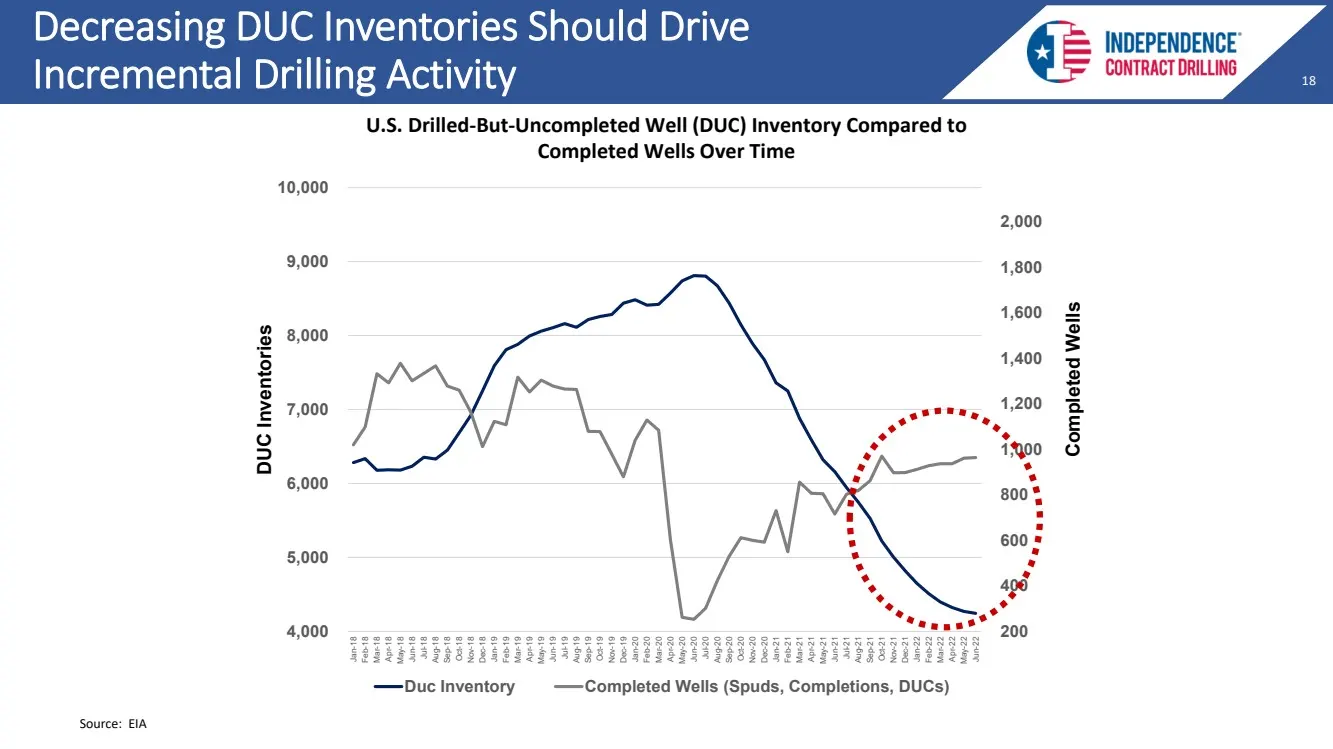
Slide 18: Decreasing DUC Inventories Should Drive Drilling Activity
18 18 18 Decreasing DUC Inventories Should Drive Incremental Drilling Activity 200 400 600 800 1,000 1,200 1,400 1,600 1,800 2,000 4,000 5,000 6,000 7,000 8,000 9,000 10,000 Jan-18 Feb-18 Mar-18 Apr-18 May-18 Jun-18 Jul-18 Aug-18 Sep-18 Oct-18 Nov-18 Dec-18 Jan-19 Feb-19 Mar-19 Apr-19 May-19 Jun-19
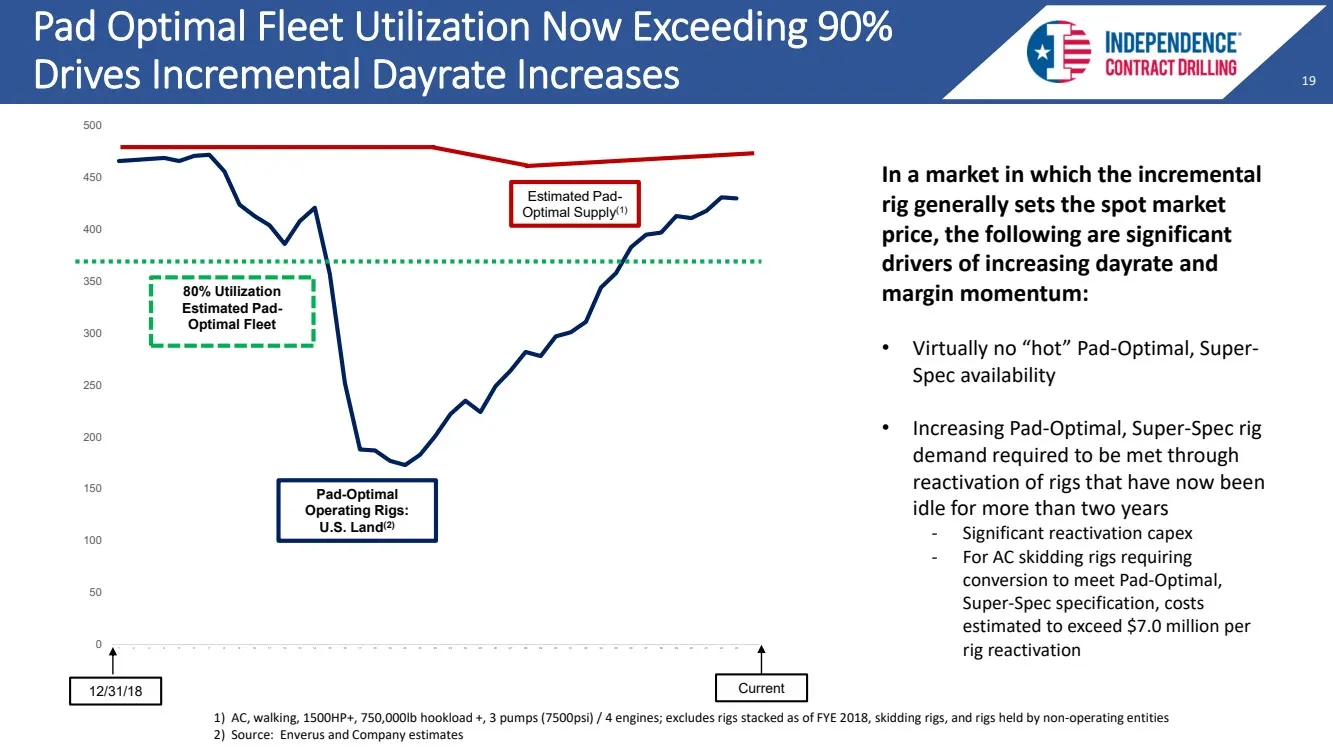
Slide 19: Pad Optimal Fleet Utilization Exceeding 90%
19 19 19 Pad Optimal Fleet Utilization Now Exceeding 90% Drives Incremental Dayrate Increases 0 50 100 150 200 250 300 350 400 450 500 1 2 3 4 5 6 7 8 9 10 11 12 13 14 15 16 17 18 19 20 21 22 23 24 25 26 27 28 29 30 31 32 34 35 36 37 38 39 40 41 42 43 80% Utilization Estimated Pad - Optimal Fleet Pa
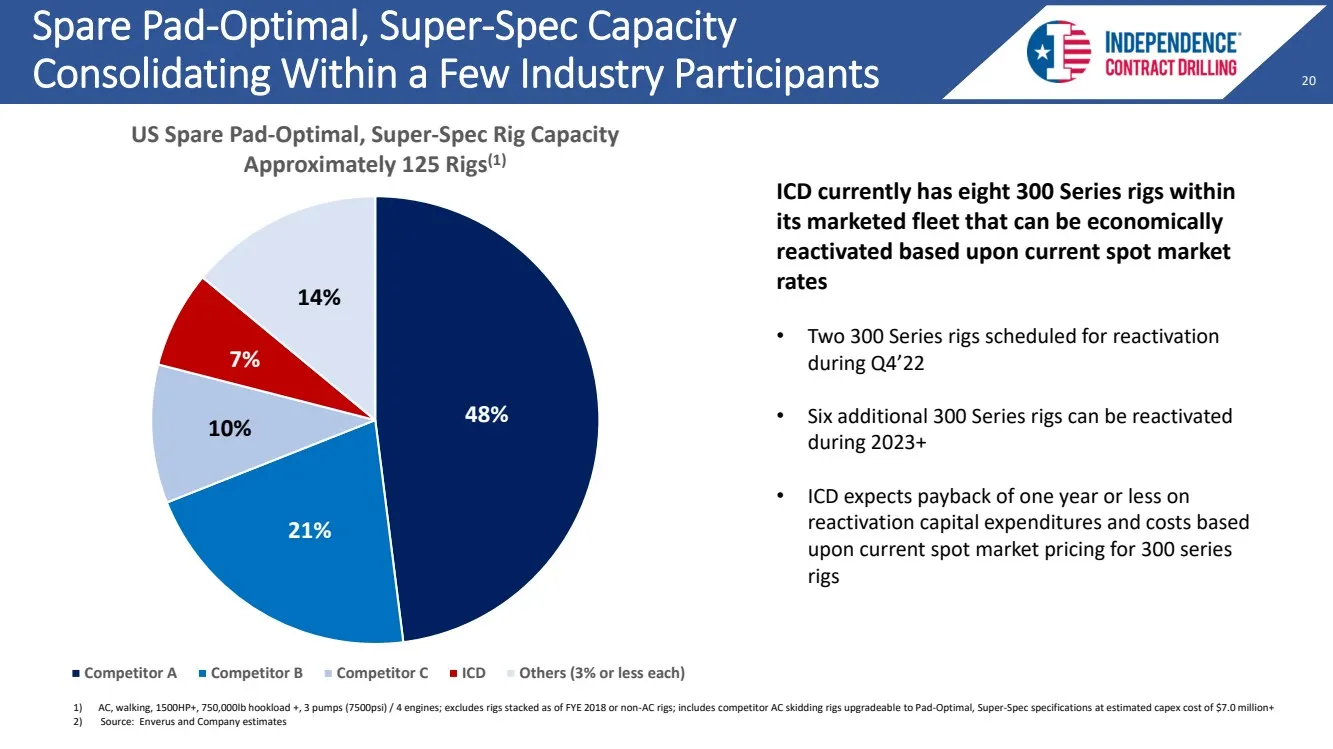
Slide 20: Spare Capacity Consolidating Within a Few Participants
20 20 20 48% 21 % 10% 7% 14% US Spare Pad - Optimal, Super - Spec Rig Capacity Approximately 125 Rigs (1) Competitor A Competitor B Competitor C ICD Others (3% or less each) Spare Pad - Optimal, Super - Spec Capacity Consolidating Within a Few Industry Participants ICD currently has eight 300 Series
Slide 21: Drivers of Returns and Free Cash Flow in Current Market
21 21 21 Drivers of Returns and Free Cash Flow in Current Market
Slide 22: Drivers of Returns/FCF Through Oil and Gas Cycle
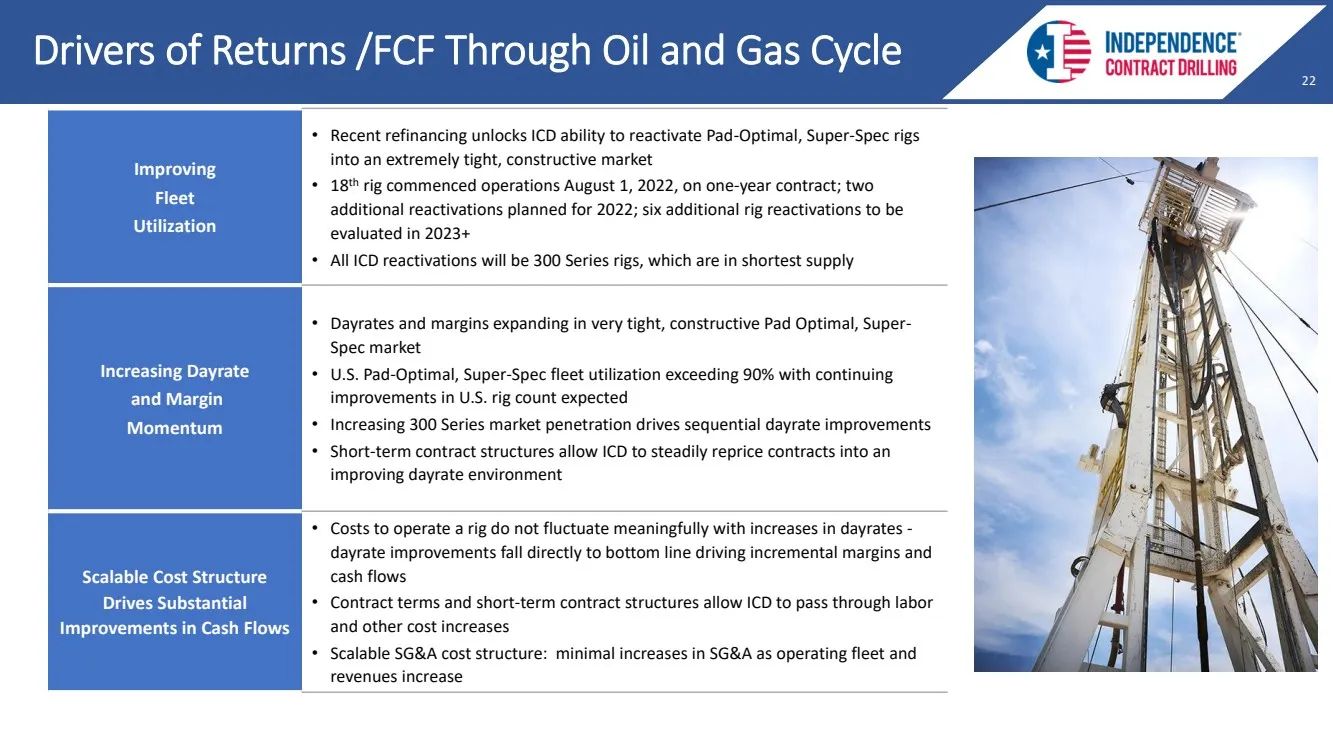
22 22 22 Drivers of Returns /FCF Through Oil and Gas Cycle Improving Fleet Utilization • Recent refinancing unlocks ICD ability to reactivate Pad - Optimal, Super - Spec rigs into an extremely tight, constructive market • 18 th rig commenced operations August 1, 2022, on one - year contract; two add
Slide 23: ICD Margins Expanding in Market Recovery
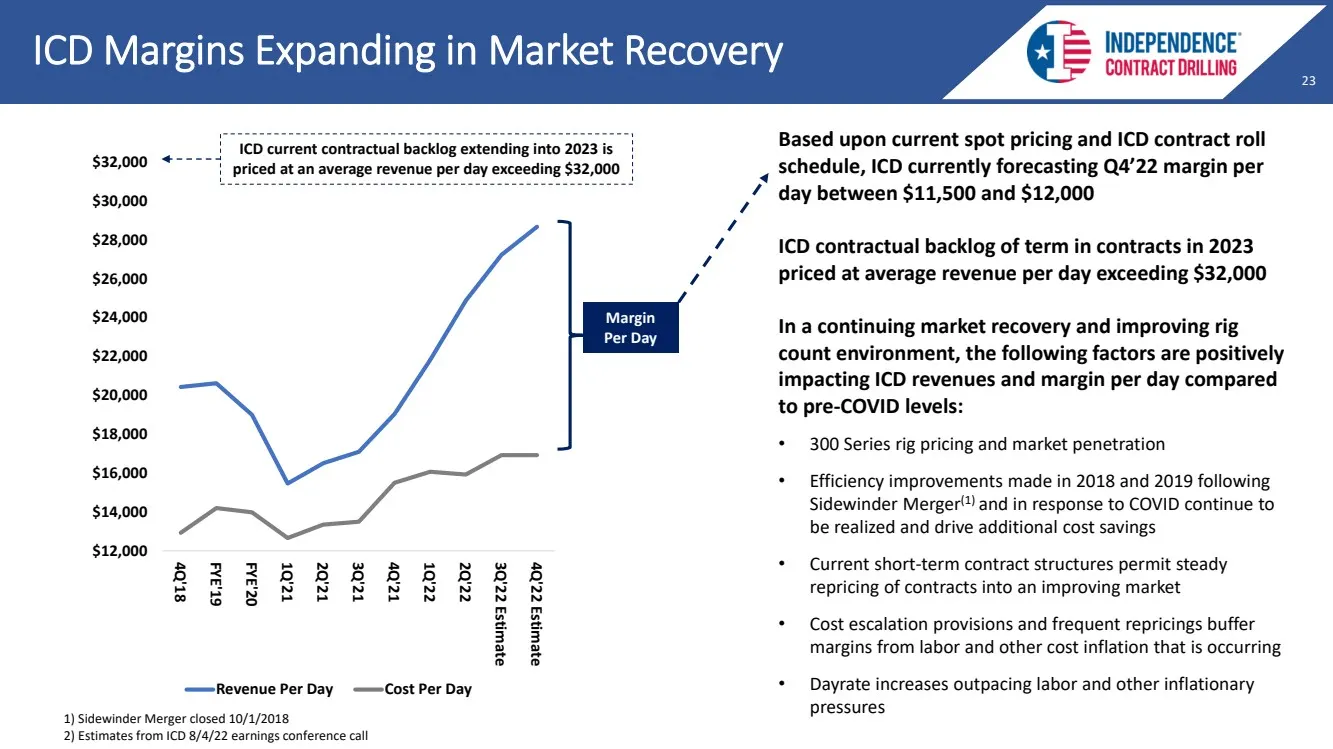
23 23 23 ICD Margins Expanding in Market Recovery Based upon current spot pricing and ICD contract roll schedule, ICD currently forecasting Q4’22 margin per day between $11,500 and $12,000 ICD contractual backlog of term in contracts in 2023 priced at average revenue per day exceeding $32,000 In a c
Slide 24: ICD Margins Closing Pre-COVID Profitability Gap vs Peers
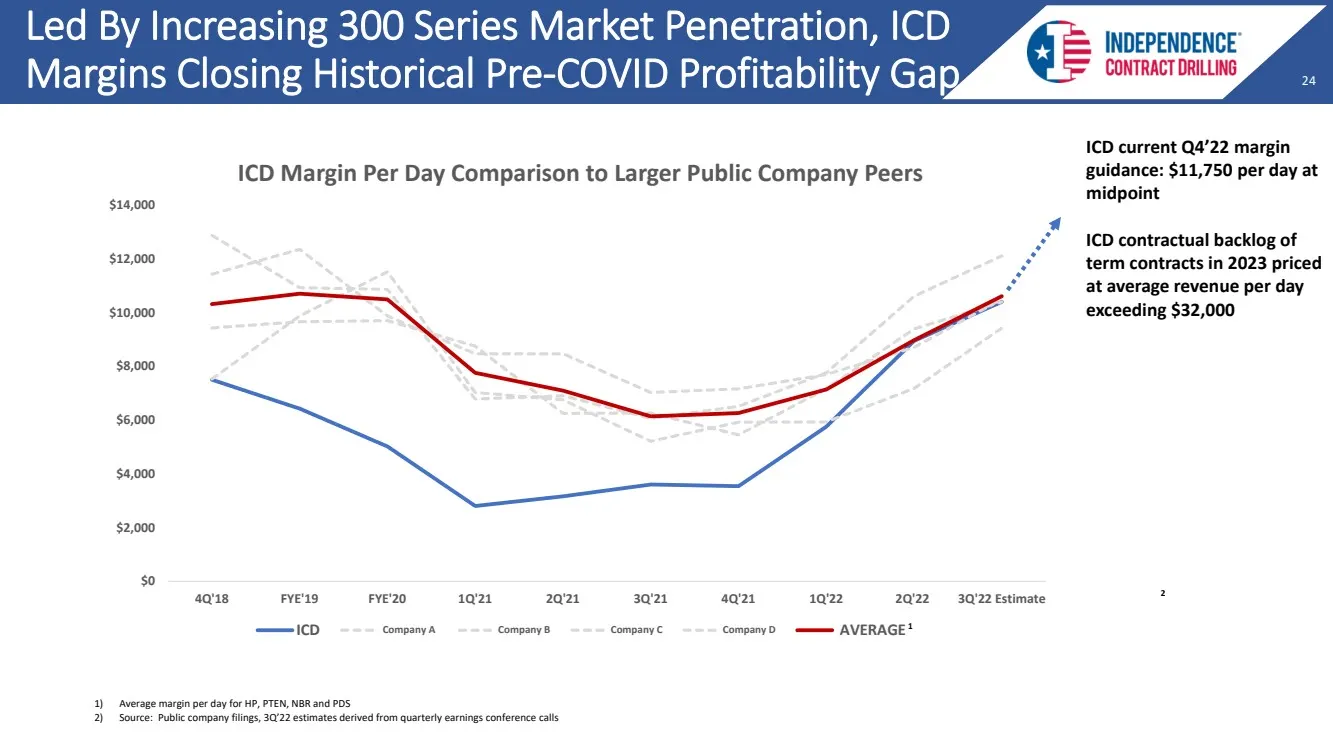
24 24 24 Led By Increasing 300 Series Market Penetration, ICD Margins Closing Historical Pre - COVID Profitability Gap $0 $2,000 $4,000 $6,000 $8,000 $10,000 $12,000 $14,000 4Q'18 FYE'19 FYE'20 1Q'21 2Q'21 3Q'21 4Q'21 1Q'22 2Q'22 3Q'22 Estimate ICD Margin Per Day Comparison to Larger Public Company
Slide 25: ICD Operating Leverage Potential in an Improving Market
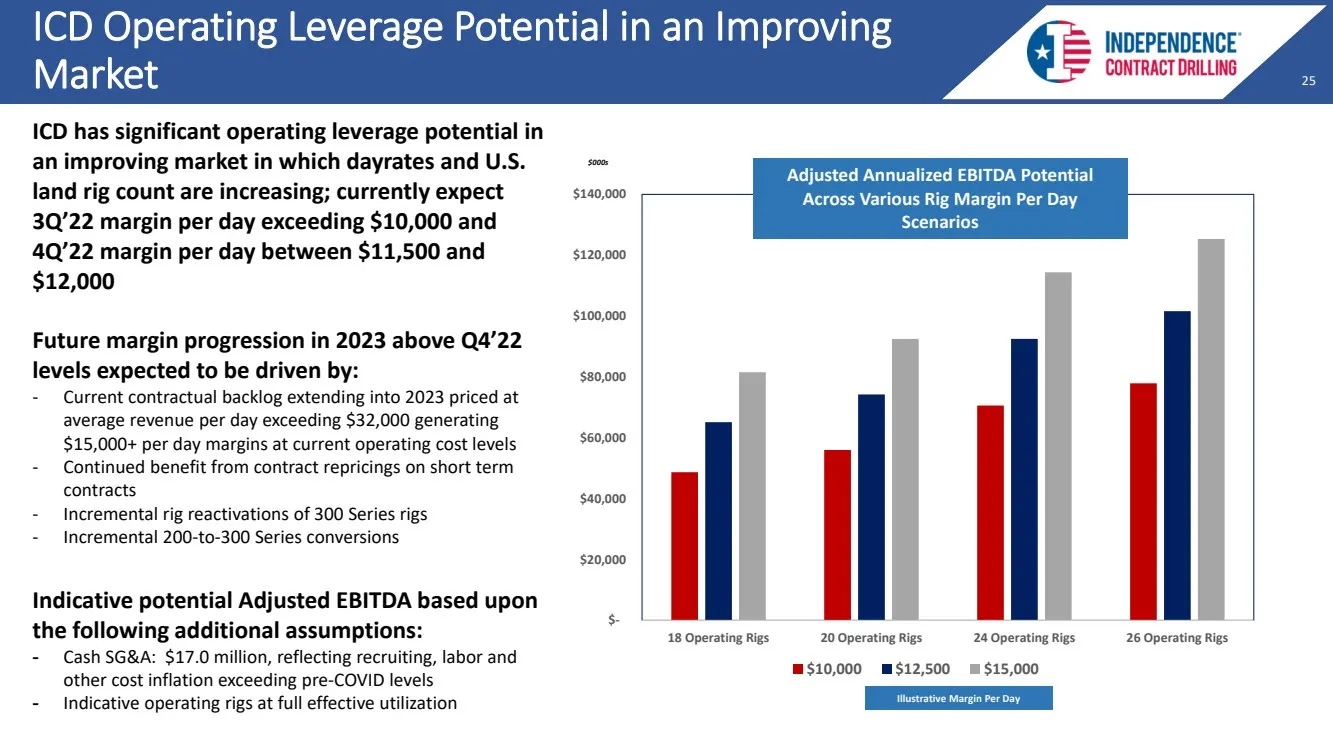
25 25 25 ICD Operating Leverage Potential in an Improving Market $- $20,000 $40,000 $60,000 $80,000 $100,000 $120,000 $140,000 18 Operating Rigs 20 Operating Rigs 24 Operating Rigs 26 Operating Rigs $10,000 $12,500 $15,000 Adjusted Annualized EBITDA Potential Across Various Rig Margin Per Day Scenar
Slide 26: Illustrative ICD Free Cash Flow Growth
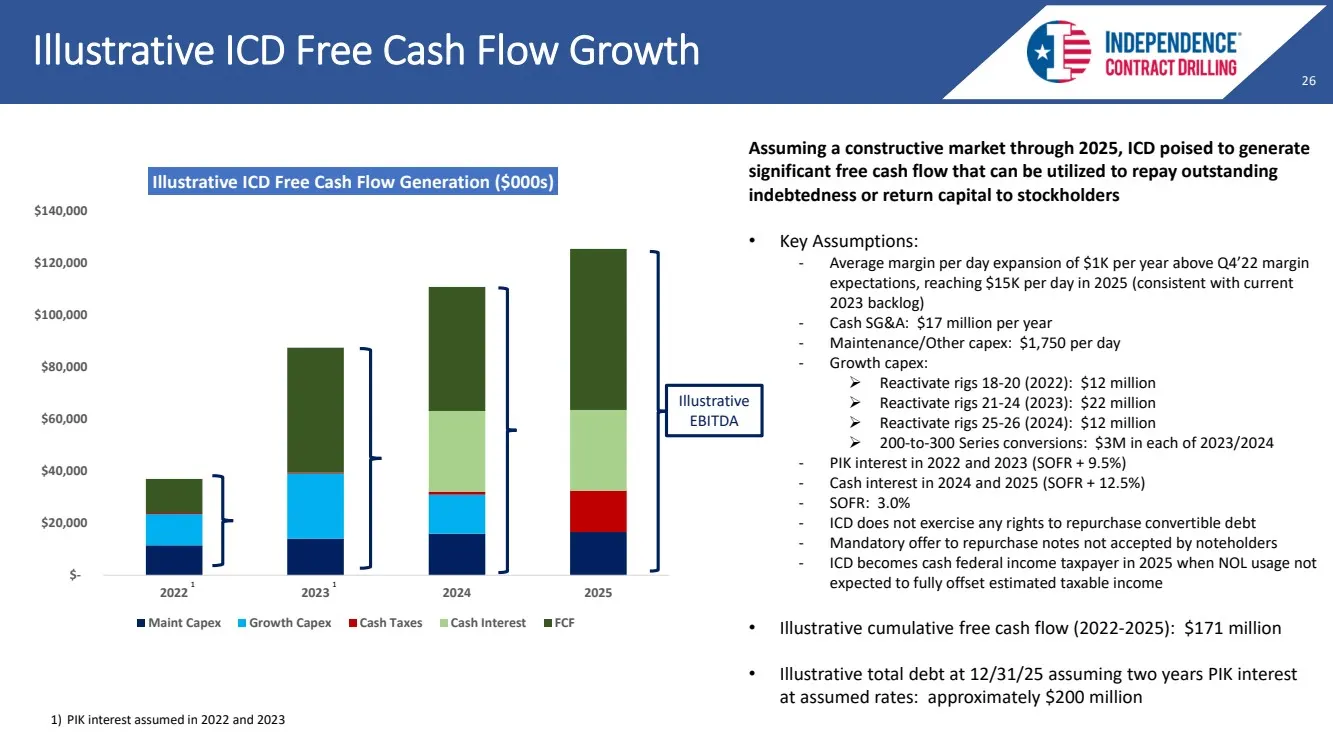
26 26 26 Illustrative ICD Free Cash Flow Growth $- $20,000 $40,000 $60,000 $80,000 $100,000 $120,000 $140,000 2022 2023 2024 2025 Illustrative ICD Free Cash Flow Generation ($000s) Maint Capex Growth Capex Cash Taxes Cash Interest FCF Assuming a constructive market through 2025, ICD poised to genera
Slide 27: Balance Sheet / Recent Debt Financing Untaps Imbedded Value
27 27 27 Balance Sheet / Recent Debt Financing Untaps Imbedded Value
Slide 28: Recent Debt Refinancing Themes
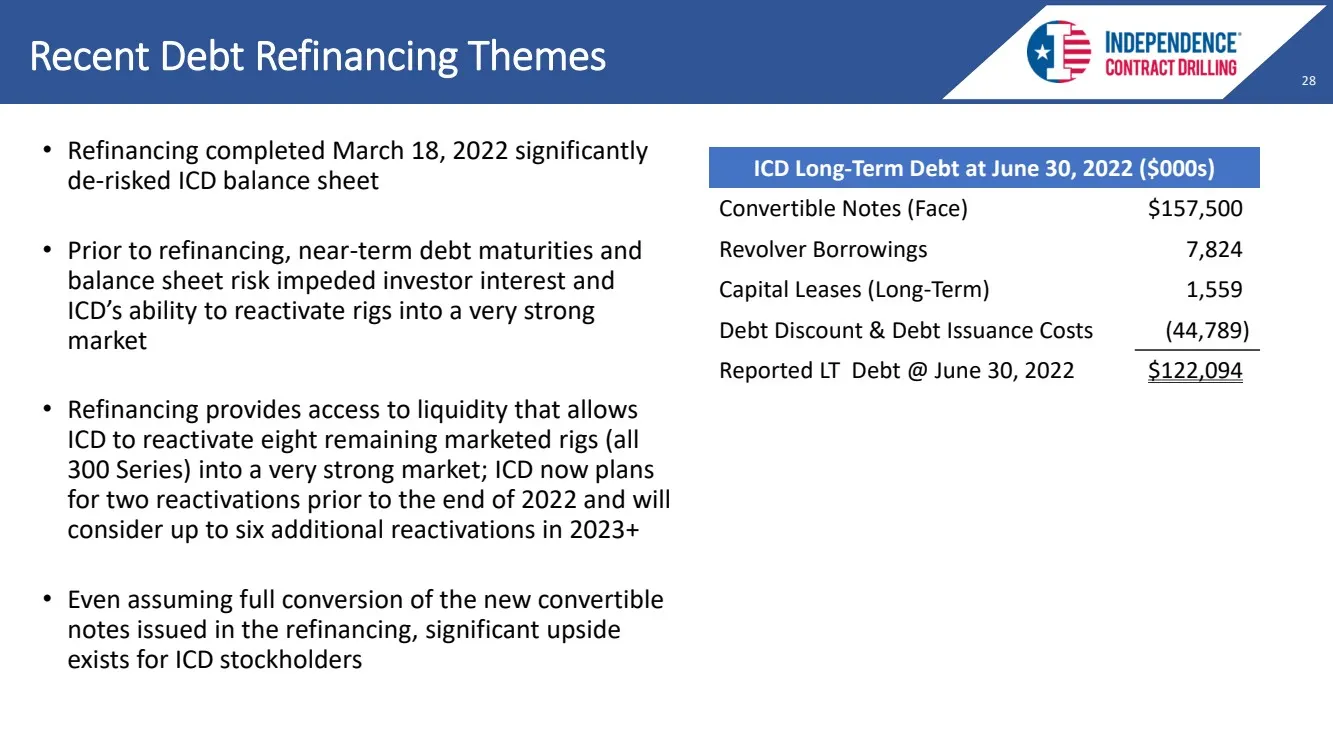
28 28 28 Recent Debt Refinancing Themes • Refinancing completed March 18, 2022 significantly de - risked ICD balance sheet • Prior to refinancing, near - term debt maturities and balance sheet risk impeded investor interest and ICD’s ability to reactivate rigs into a very strong market • Refinancing
Slide 29: Debt Terms / Refinanced Balance Sheet
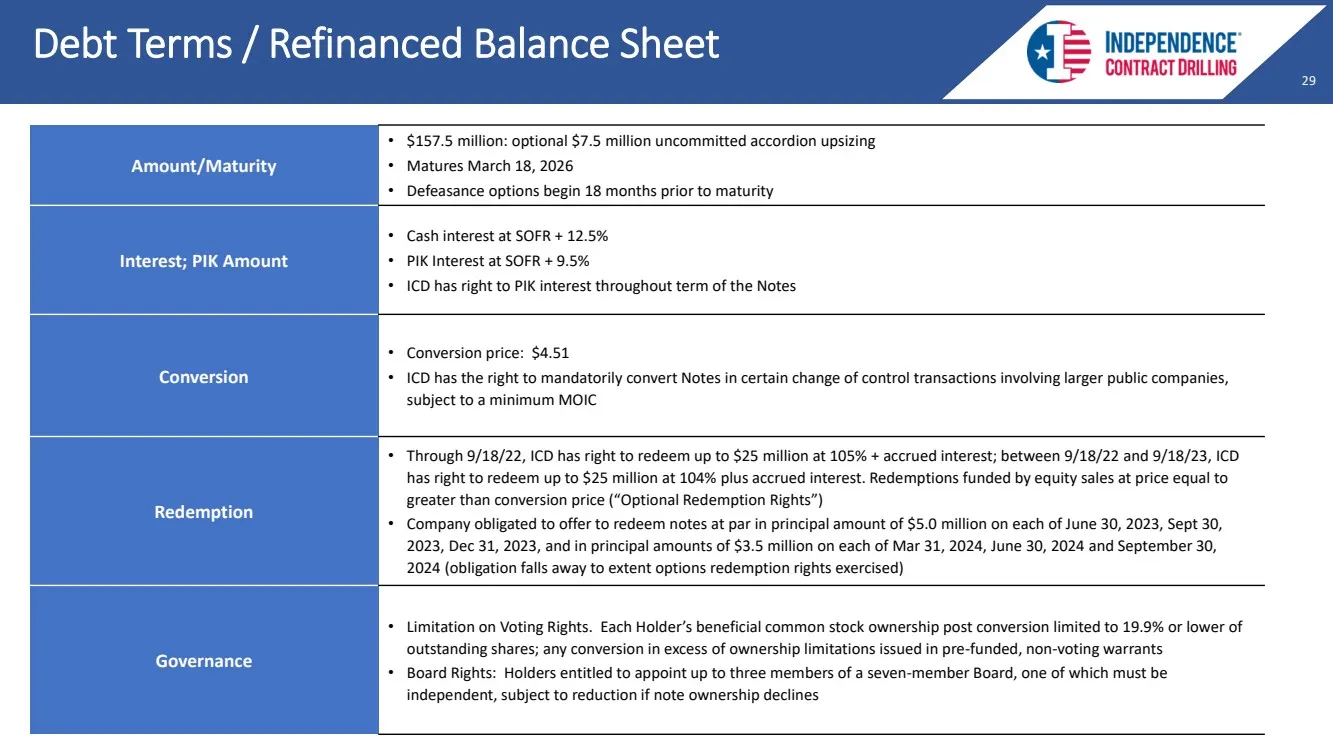
29 29 29 Debt Terms / Refinanced Balance Sheet Amount/Maturity • $157.5 million: optional $7.5 million uncommitted accordion upsizing • Matures March 18, 2026 • Defeasance options begin 18 months prior to maturity Interest; PIK Amount • Cash interest at SOFR + 12.5% • PIK Interest at SOFR + 9.5% • I
Slide 30: Refinancing Untapping Value in ICD Rig Fleet
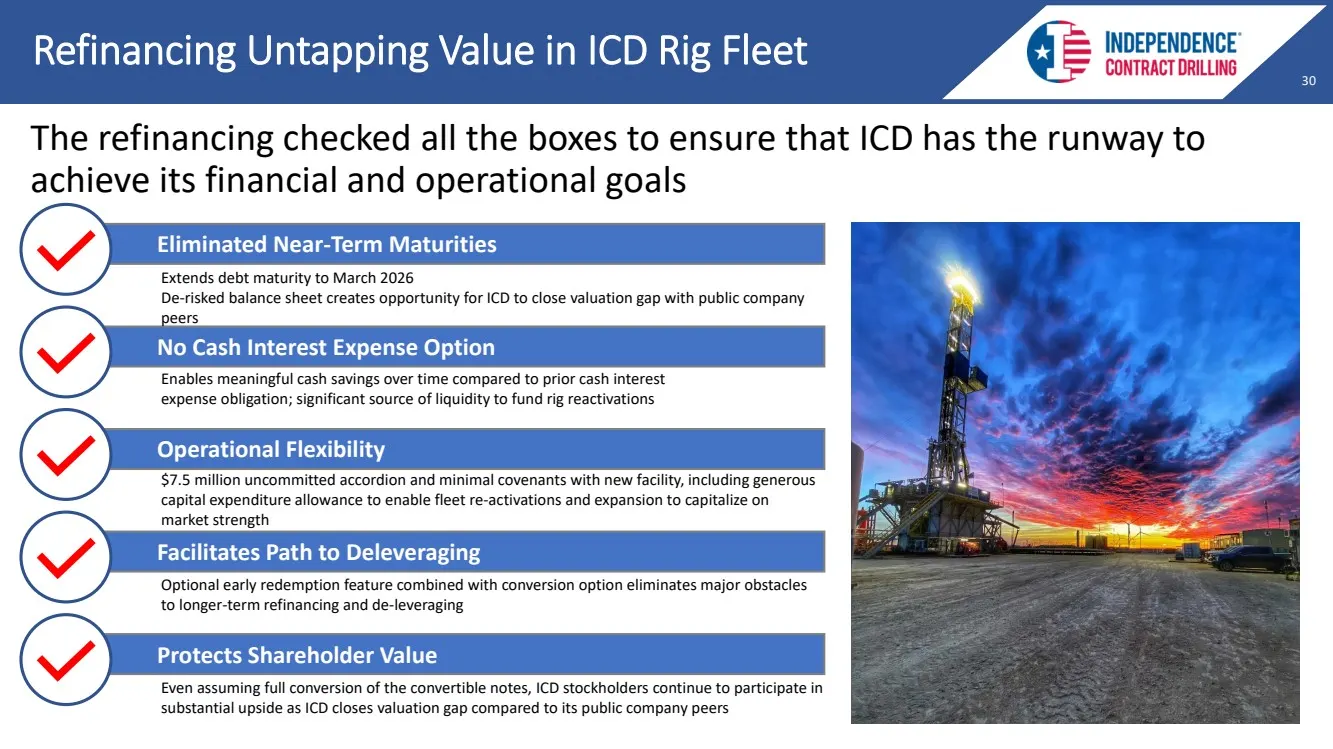
30 30 30 The refinancing checked all the boxes to ensure that ICD has the runway to achieve its financial and operational goals Refinancing Untapping Value in ICD Rig Fleet Eliminated Near - Term Maturities No Cash Interest Expense Option Operational Flexibility Facilitates Path to Deleveraging Prot
Slide 31: Significant Potential Value Uplift
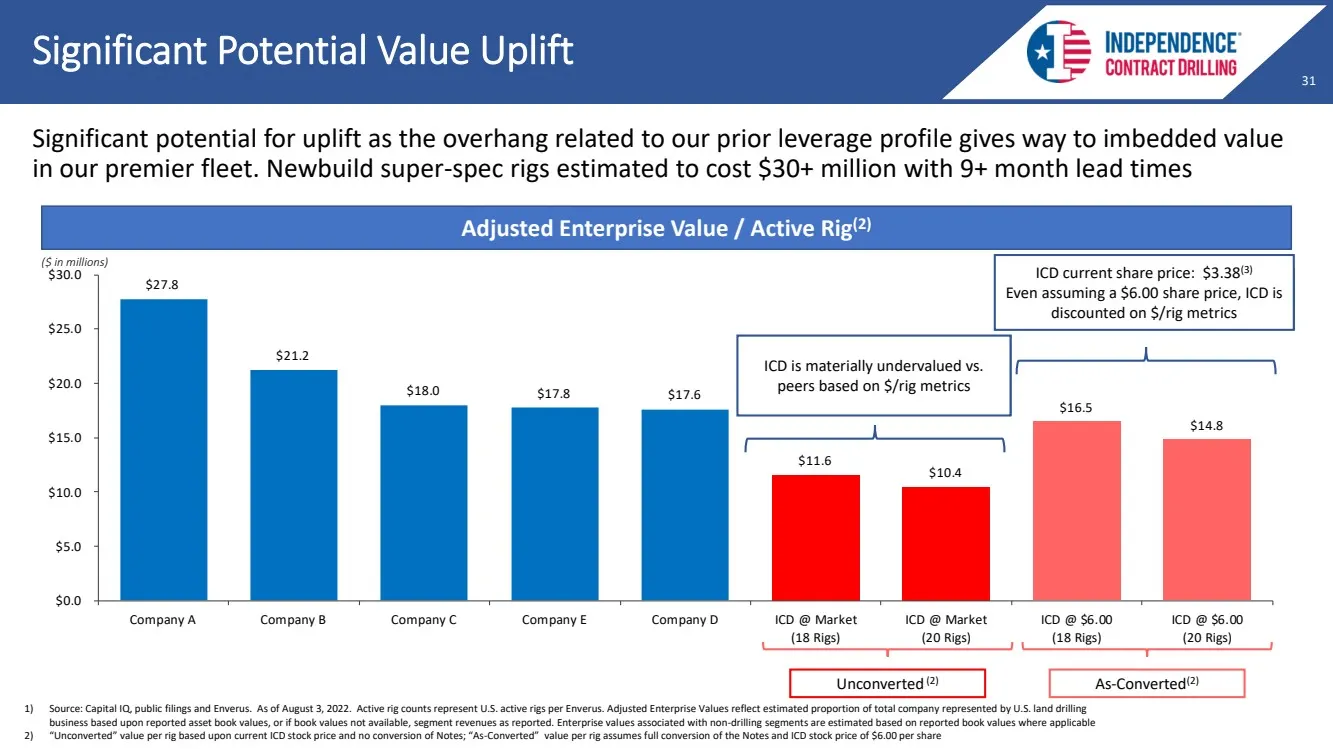
31 31 31 Significant potential for uplift as the overhang related to our prior leverage profile gives way to imbedded value in our premier fleet. Newbuild super - spec rigs estimated to cost $30+ million with 9+ month lead times Adjusted Enterprise Value / Active Rig (2) ($ in millions) Significant
Slide 32: Upside for Stockholders Assuming Full Conversion of Notes
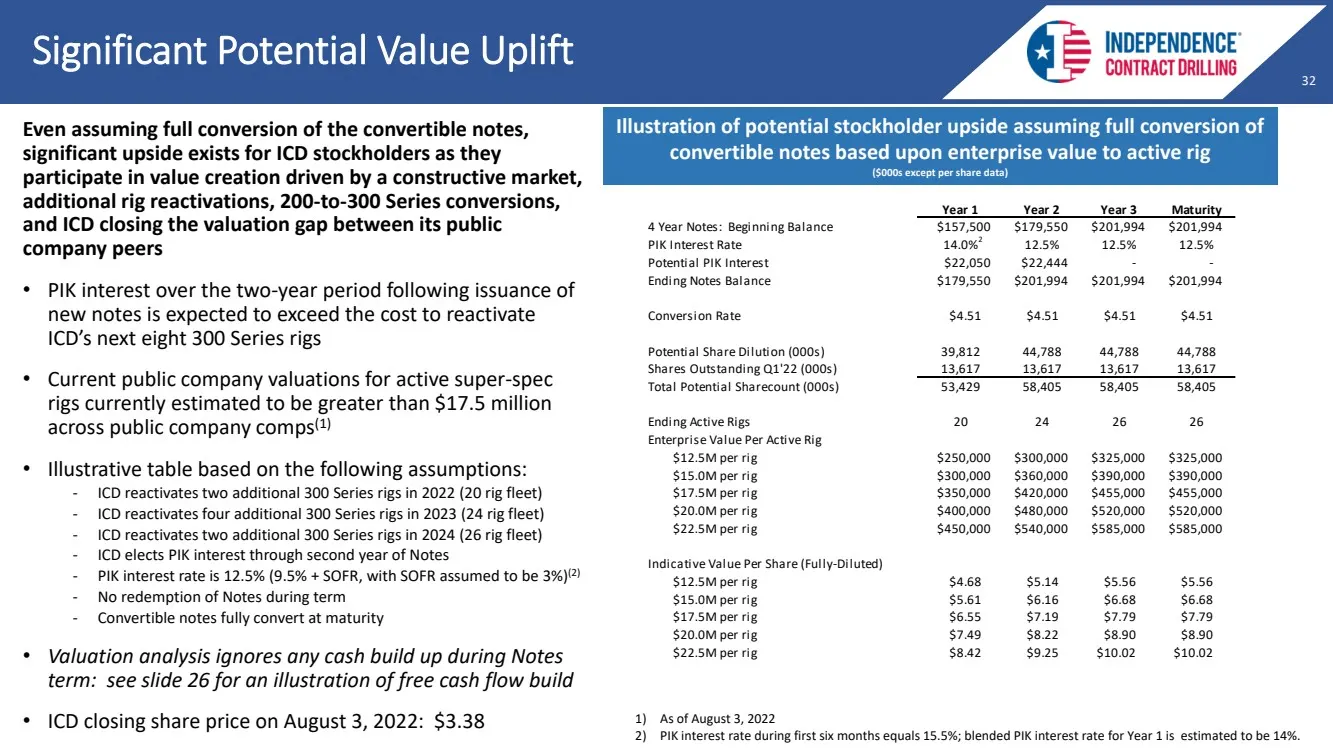
32 32 32 Even assuming full conversion of the convertible notes, significant upside exists for ICD stockholders as they participate in value creation driven by a constructive market, additional rig reactivations, 200 - to - 300 Series conversions, and ICD closing the valuation gap between its public
Slide 33: Significant Potential Value Uplift Illustration
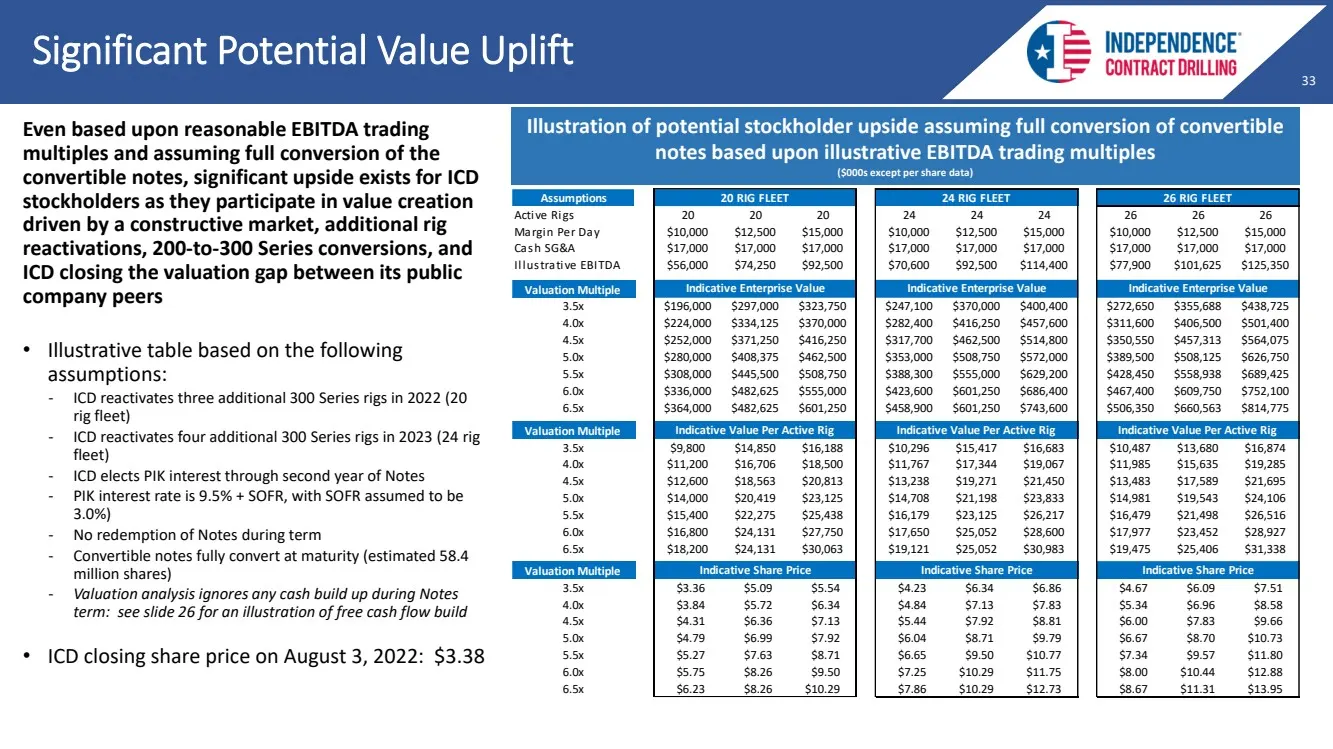
33 33 33 Significant Potential Value Uplift Illustration of potential stockholder upside assuming full conversion of convertible notes based upon illustrative EBITDA trading multiples ($000s except per share data) Even based upon reasonable EBITDA trading multiples and assuming full conversion of th
Slide 34: ICD Positioning in a Consolidating Market
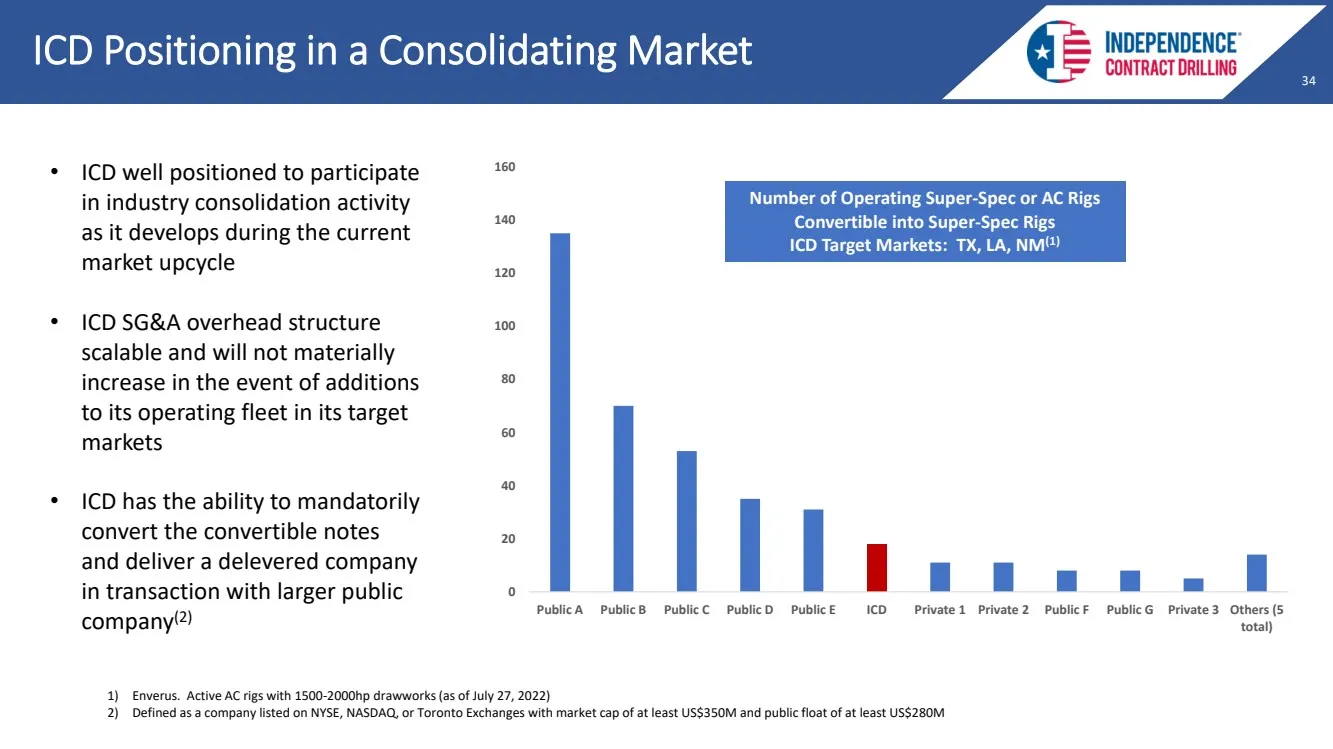
34 34 34 ICD Positioning in a Consolidating Market 0 20 40 60 80 100 120 140 160 Public A Public B Public C Public D Public E ICD Private 1 Private 2 Public F Public G Private 3 Others (5 total) Number of Operating Super - Spec or AC Rigs Convertible into Super - Spec Rigs ICD Target Markets: TX, LA
Slide 35: Independence Contract Drilling
1eo INDEPENDENCE 2auED CONTRACT DRILLING NYSE a
Slide 36: ESG and Sustainability
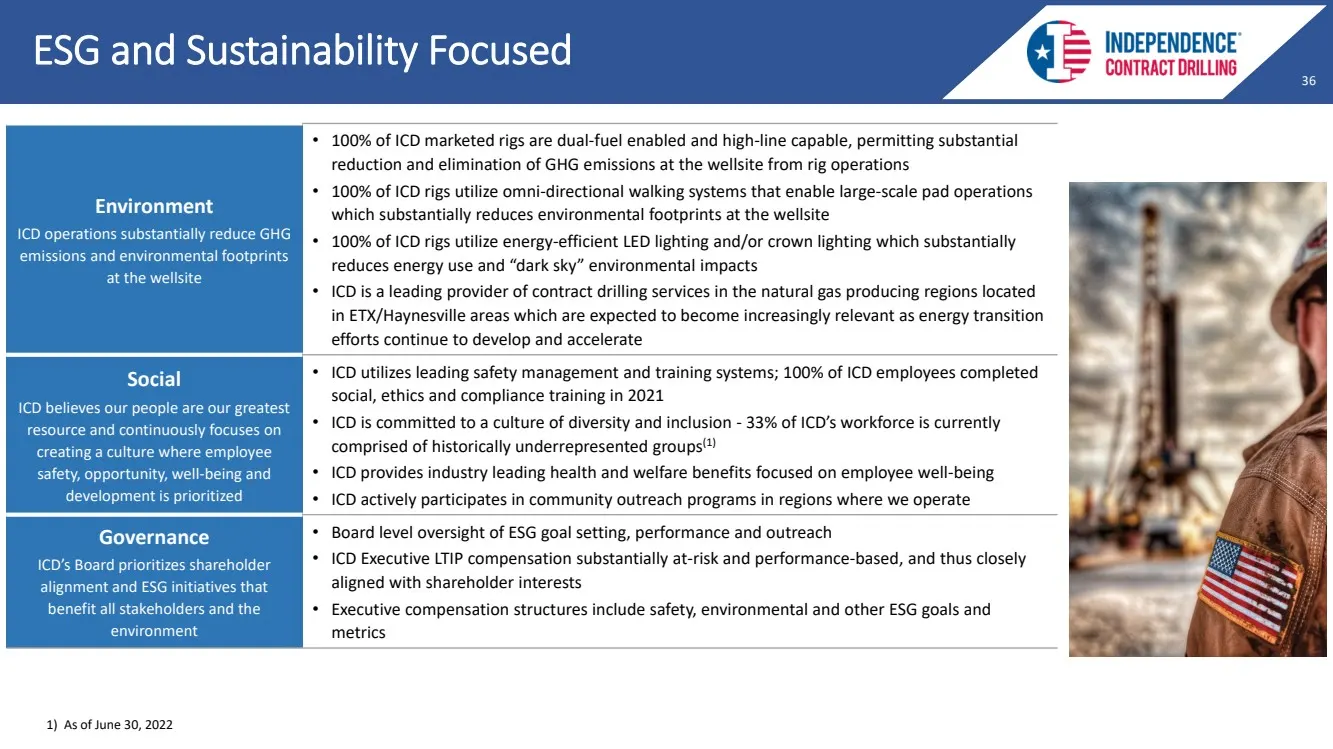
36 36 36 ESG and Sustainability Focused Environment ICD operations substantially reduce GHG emissions and environmental footprints at the wellsite • 100% of ICD marketed rigs are dual - fuel enabled and high - line capable, permitting substantial reduction and elimination of GHG emissions at the wel
Slide 37: ICD ShaleDriller Rigs Reduce and Eliminate GHG Emissions
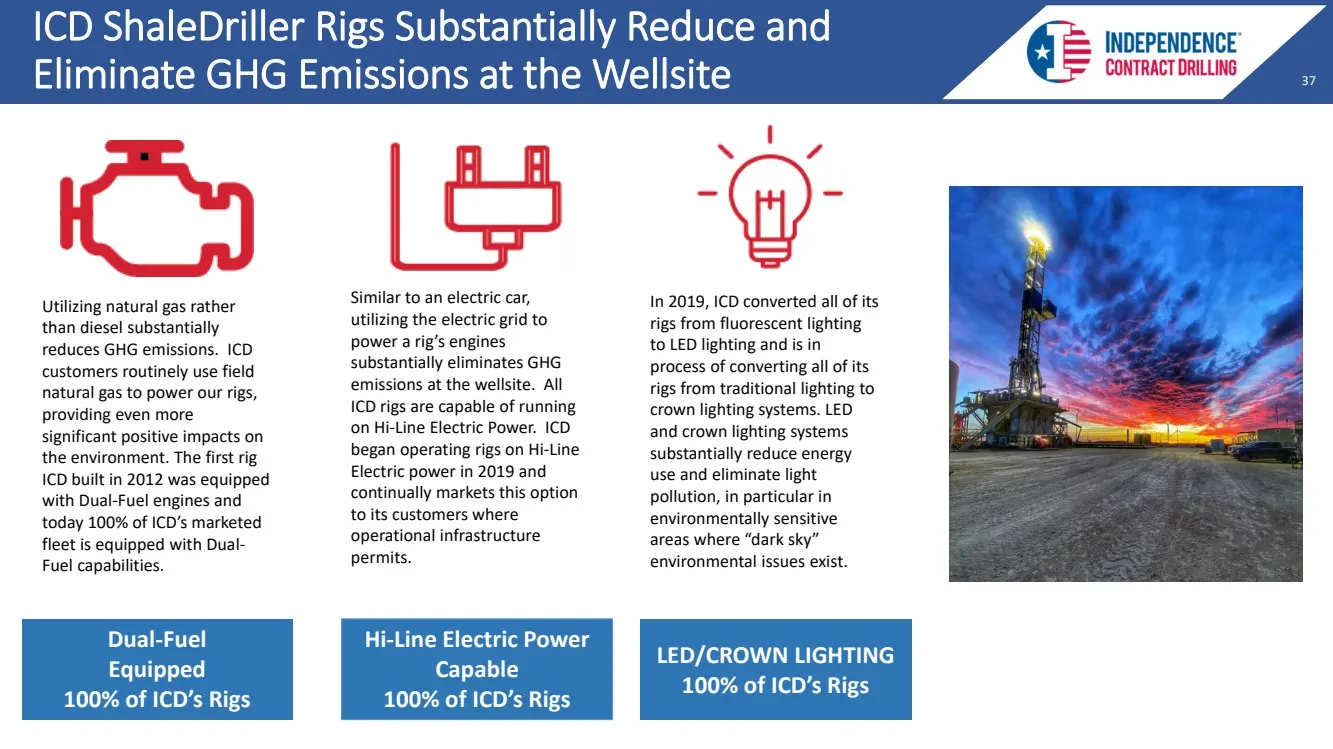
37 37 37 ICD ShaleDriller Rigs Substantially Reduce and Eliminate GHG Emissions at the Wellsite Utilizing natural gas rather than diesel substantially reduces GHG emissions. ICD customers routinely use field natural gas to power our rigs, providing even more significant positive impacts on the envir
Slide 38: US Land Drilling's Only Publicly-Traded, Pure-Play Growth Story
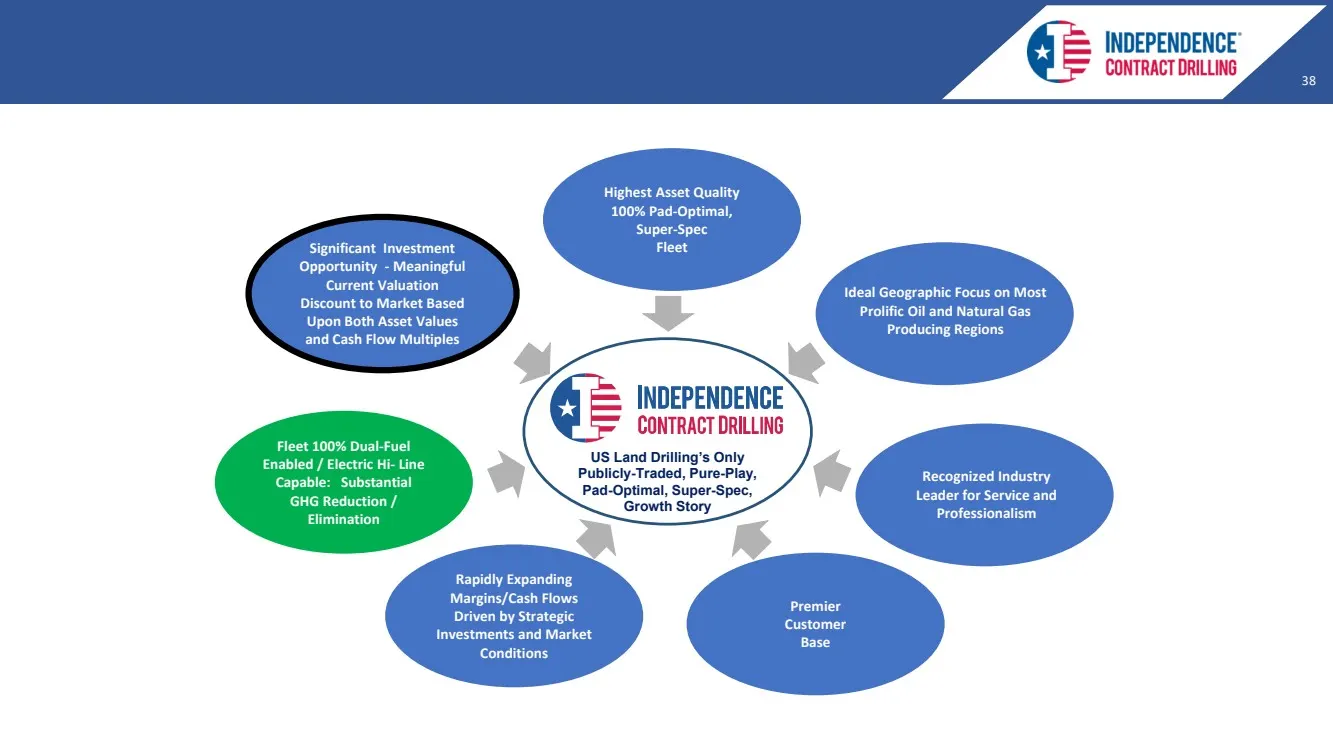
38 38 38 US Land Drilling’s Only Publicly - Traded, Pure - Play, Pad - Optimal, Super - Spec, Growth Story Highest Asset Quality 100% Pad - Optimal, Super - Spec Fleet Premier Customer Base Rapidly Expanding Margins/Cash Flows Driven by Strategic Investments and Market Conditions Significant Investm
Slide 39: Investor Contact Information
39 39 39 Investor Contact Information Email inquiries: [email protected] Phone inquiries: (281) 878 - 8710
Slide 40: Appendices: Financial Statements
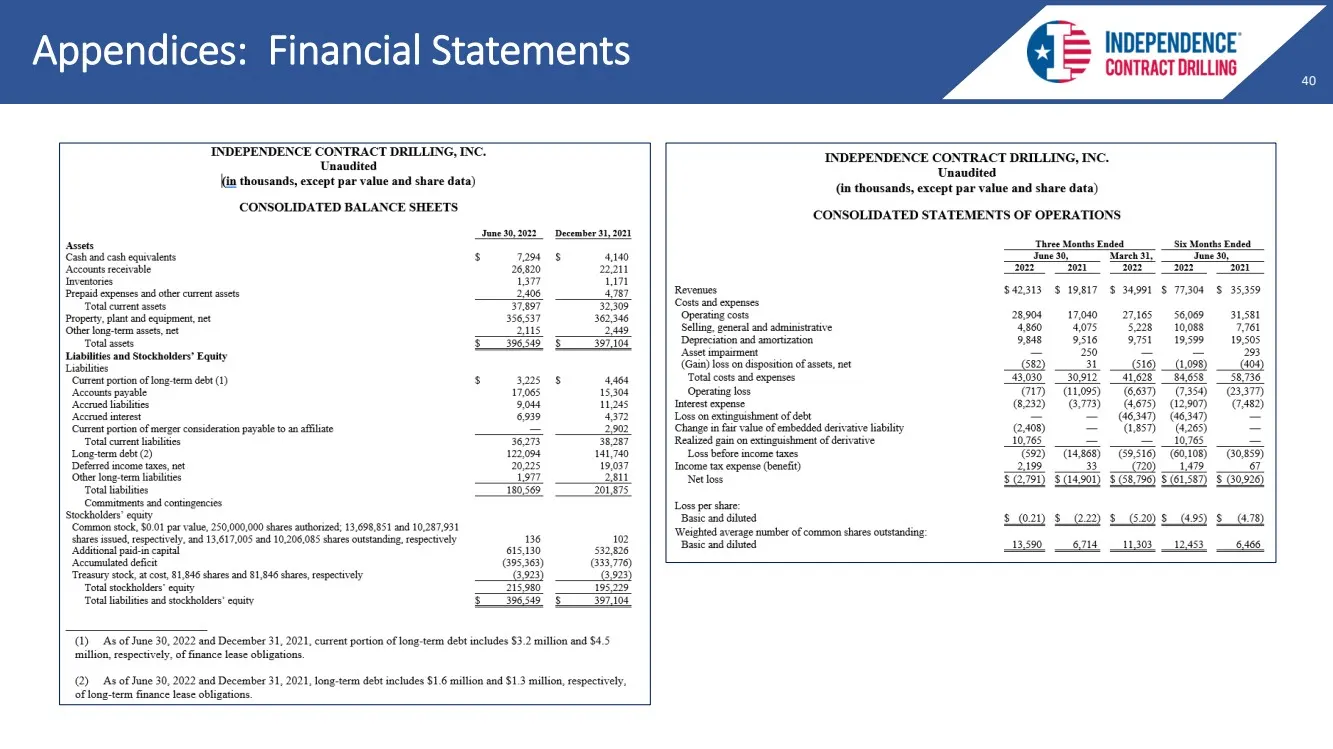
40 40 40 Appendices: Financial Statements
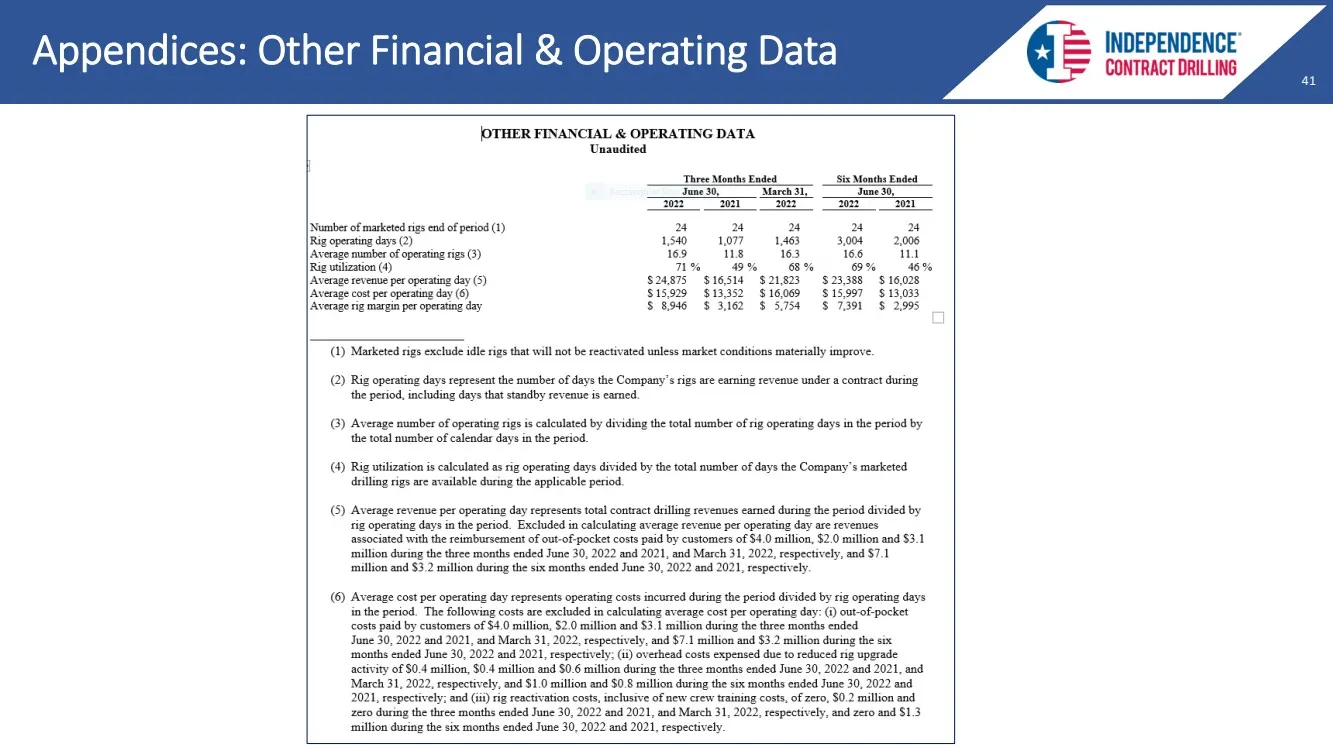
Slide 41: Appendices: Other Financial & Operating Data
41 41 41 Appendices: Other Financial & Operating Data
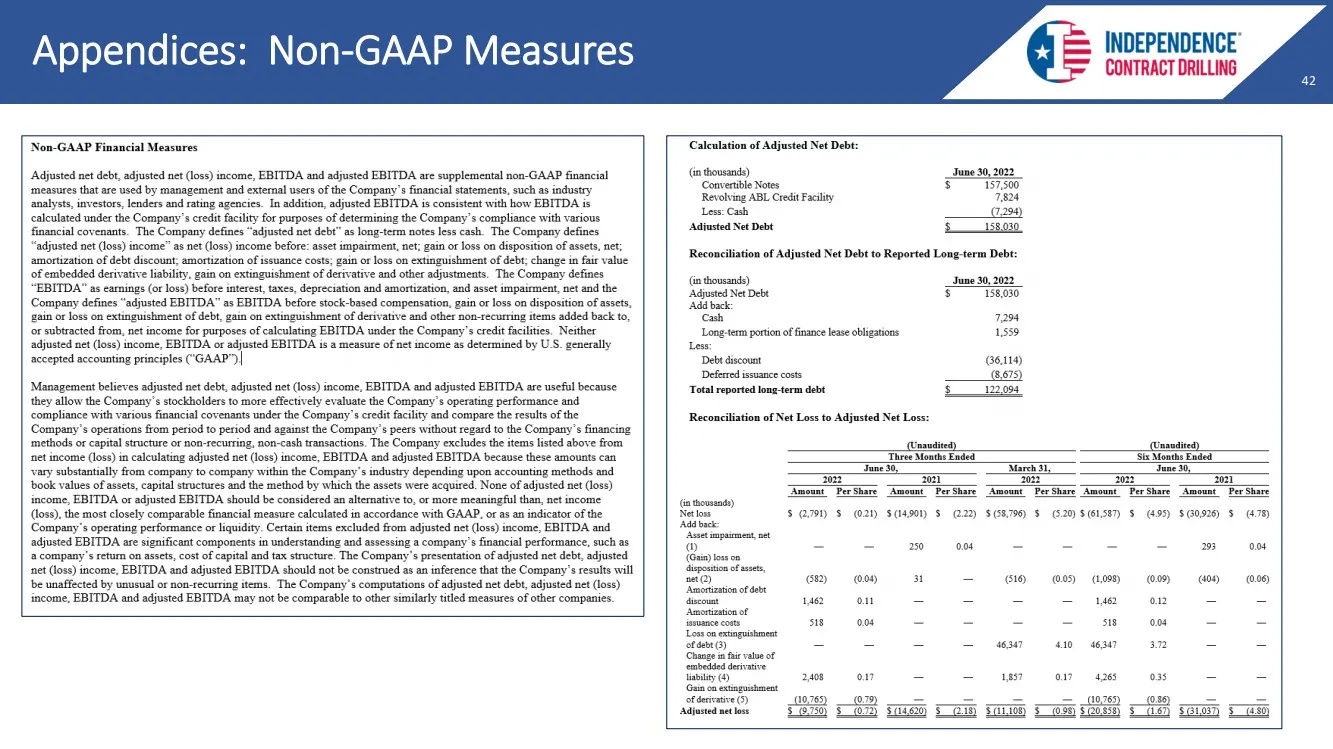
Slide 42: Appendices: Non-GAAP Measures
42 42 42 Appendices: Non - GAAP Measures
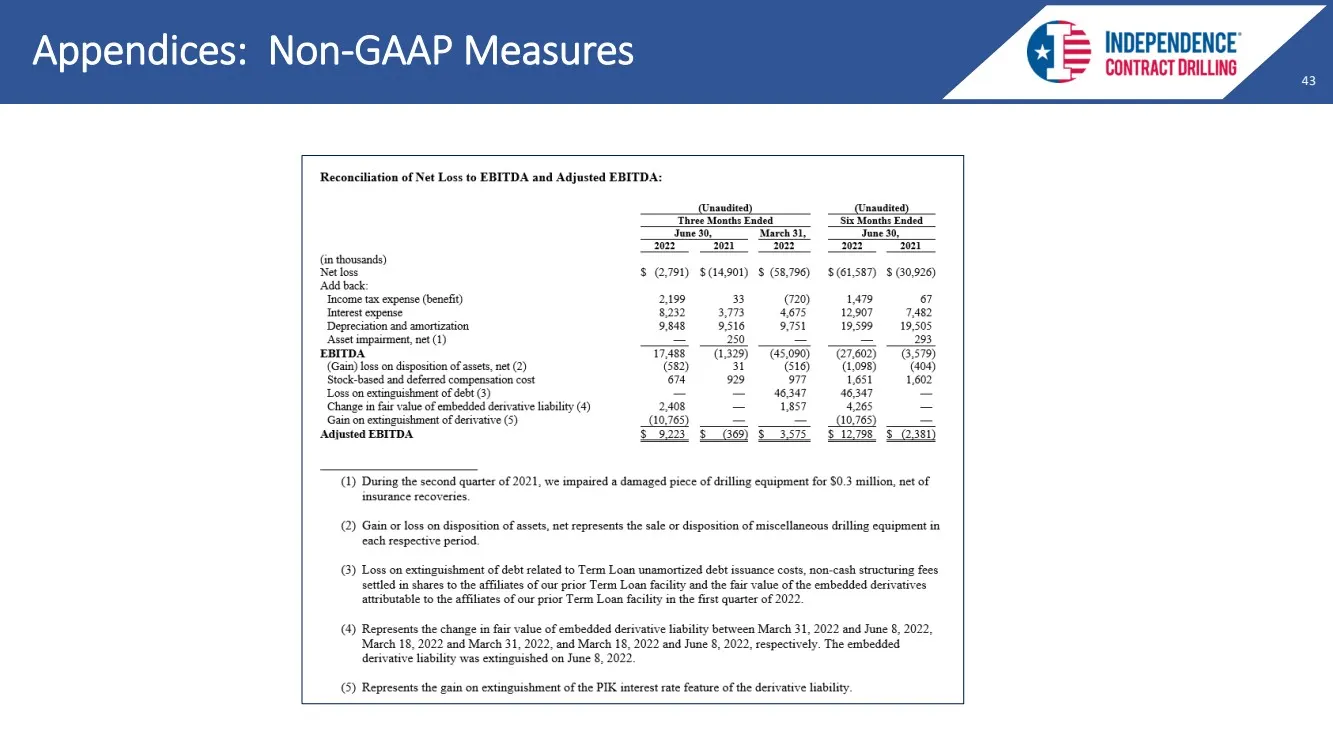
Slide 43: Appendices: Non-GAAP Measures
43 43 43 Appendices: Non - GAAP Measures
Source: SEC EDGAR · 8-K filed Aug 8, 2022
More decks from Independence Contract Drilling Inc
 Presentation (December 2024)15 slides · Dec 3, 2024
 Emerging Growth Conference (November 2023)31 slides · Nov 2, 2023
 Sidoti MicroCap Conference (August 2023)32 slides · Aug 16, 2023
 Emerging Growth Conference (June 2023)38 slides · Jun 14, 2023
 Investor Presentation (March 2023)41 slides · Mar 2, 2023
 Investor Presentation (November 2022)47 slides · Nov 1, 2022