Mead Johnson Nutrition — Barclays Back-to-School Consumer Conference 2014
24 slides from Mead Johnson Nutrition's conference presentation, Sep 3, 2014

Slide 1: Barclays Back-to-School Consumer Conference
Barclays Back-to-School Consumer Conference September 4, 2014 Kasper Jakobsen President & CEO Stan Burhans VP Finance - Global Commercial Operations
Slide 2: Safe Harbor Statement
Safe Harbor Statement Forward-Looking Statements Certain statements in this presentation are forward-looking as defined in the Private Securities Litigation Reform Act of 1995. These forward-looking statements may be identified by the fact they use words such as “should,” “expect,” “anticipate,” “es
Slide 3: Strategy Reflects Strong Category Prospects
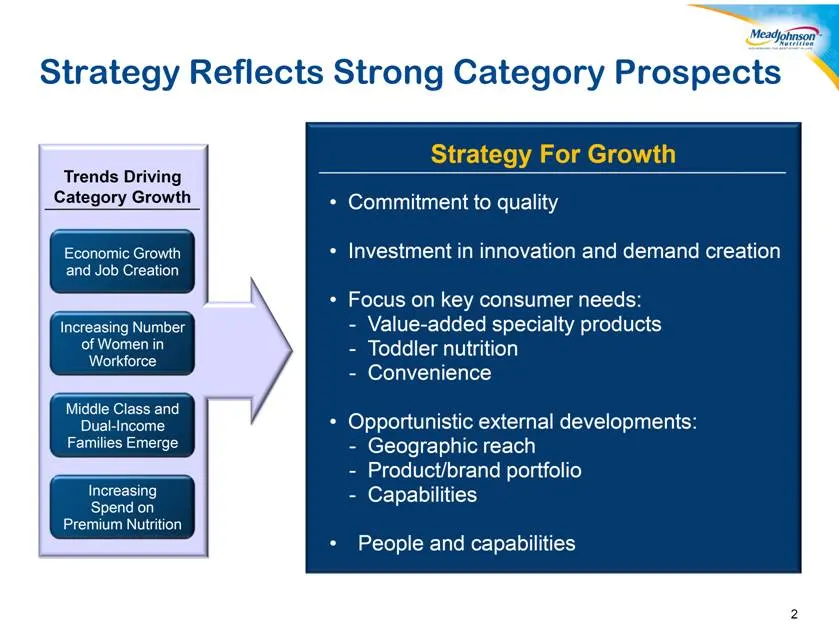
Strategy Reflects Strong Category Prospects 2 Economic Growth and Job Creation Increasing Spend on Premium Nutrition Increasing Number of Women in Workforce Middle Class and Dual-Income Families Emerge Trends Driving Category Growth Commitment to quality Investment in innovation and demand creation
Slide 4: Key External Drivers of Long-Term Growth
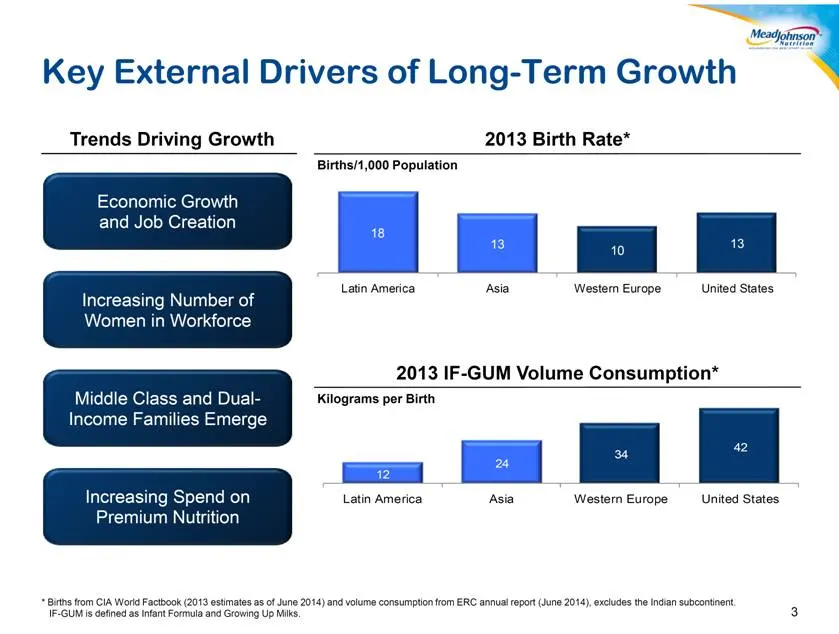
Key External Drivers of Long-Term Growth 3 Economic Growth and Job Creation Increasing Spend on Premium Nutrition Increasing Number of Women in Workforce Middle Class and Dual-Income Families Emerge Trends Driving Growth Kilograms per Birth Births/1,000 Population 2013 Birth Rate* 2013 IF-GUM Volume
Slide 5: Focused Solely on Pediatric Nutrition
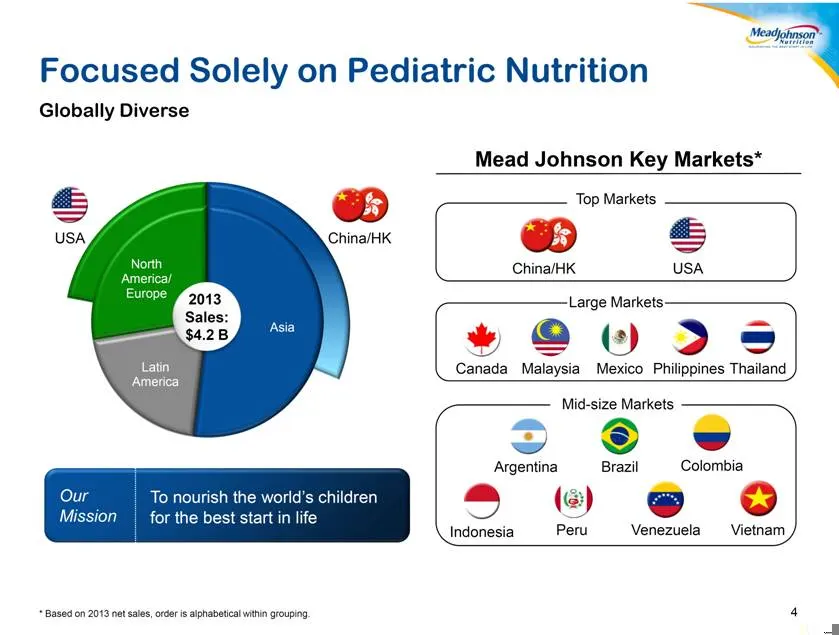
Focused Solely on Pediatric Nutrition Globally Diverse 4 Our Mission To nourish the world’s children for the best start in life Mead Johnson Key Markets* Our Vision Top Markets Mexico Canada Large Markets Malaysia Philippines Thailand Argentina Mid-size Markets Brazil Indonesia Peru Venezuela Vietna
Slide 6: China Our Top Markets
China Our Top Markets 5
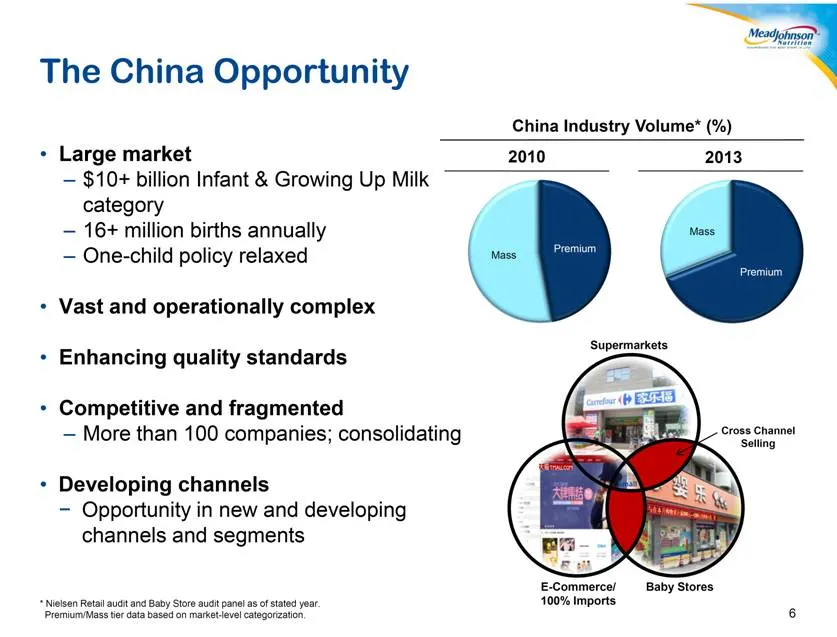
Slide 7: The China Opportunity
The China Opportunity Large market $10+ billion Infant & Growing Up Milk category 16+ million births annually One-child policy relaxed Vast and operationally complex Enhancing quality standards Competitive and fragmented More than 100 companies; consolidating Developing channels Opportunity in new a
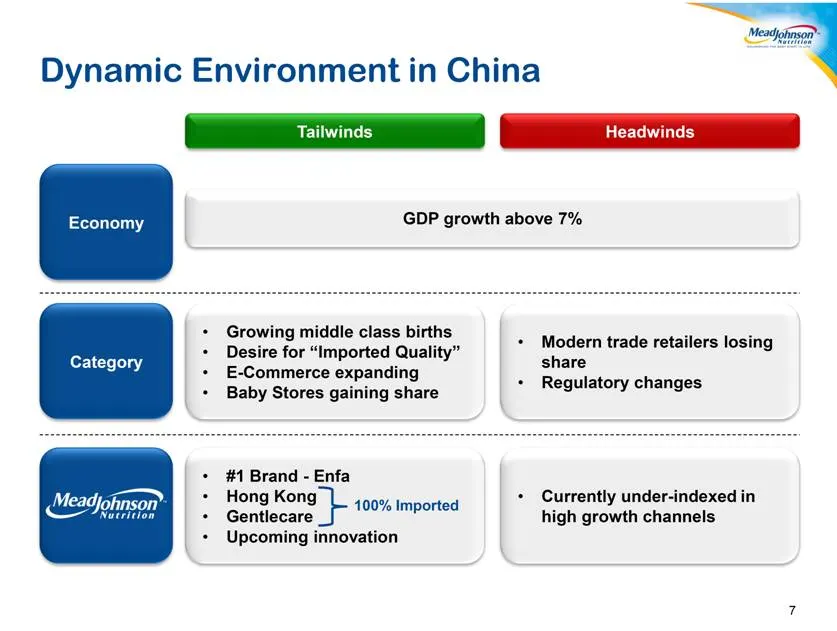
Slide 8: Dynamic Environment in China
Dynamic Environment in China 7 Economy Category Tailwinds Headwinds GDP growth above 7% Growing middle class births Desire for “Imported Quality” E-Commerce expanding Baby Stores gaining share #1 Brand - Enfa Hong Kong Gentlecare Upcoming innovation Modern trade retailers losing share Regulatory cha
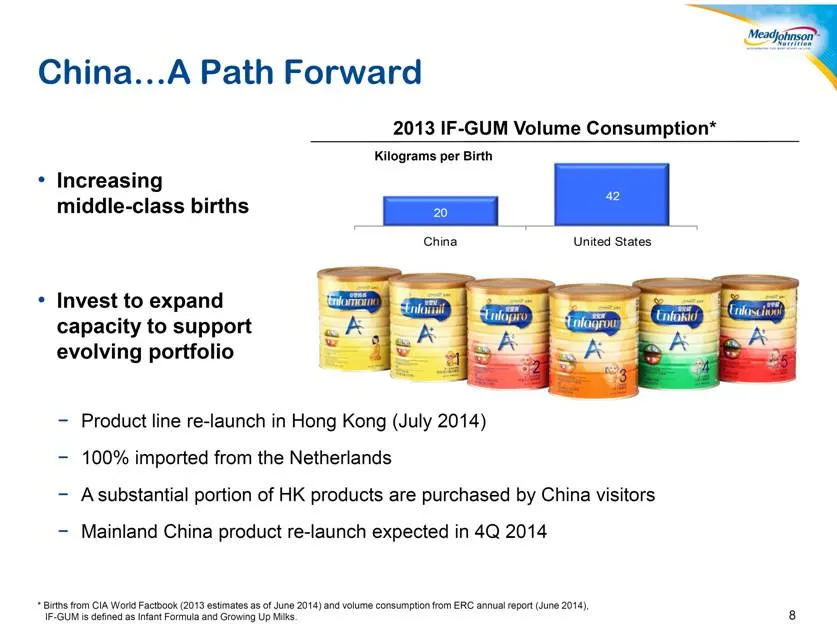
Slide 9: China A Path Forward
China A Path Forward 8 Invest to expand capacity to support evolving portfolio Increasing middle-class births 2013 IF-GUM Volume Consumption* Kilograms per Birth * Births from CIA World Factbook (2013 estimates as of June 2014) and volume consumption from ERC annual report (June 2014), IF-GUM is def
Slide 10: China/HK Track Record of Success
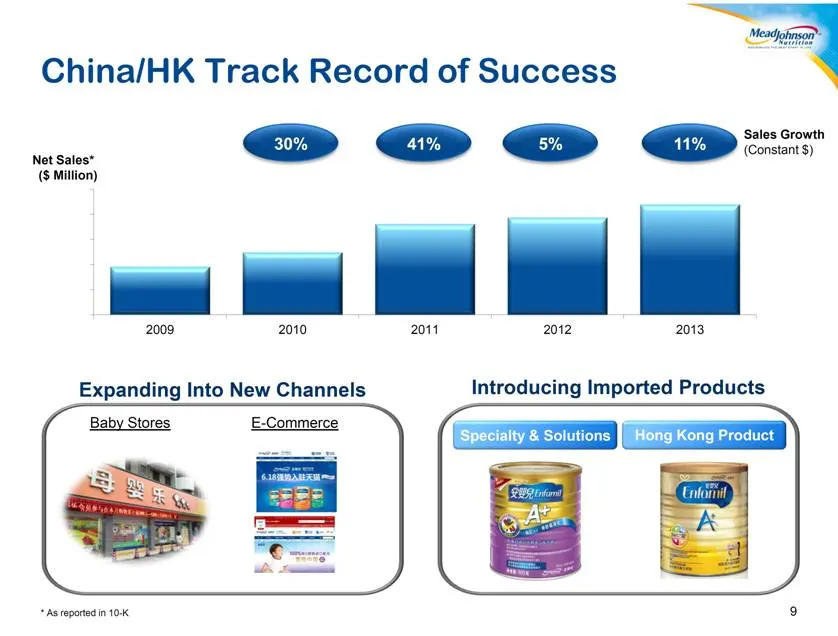
9 China/HK Track Record of Success Net Sales* ($ Million) 30% 41% 5% 11% Sales Growth (Constant $) Specialty & Solutions Hong Kong Product C2C Expanding Into New Channels Introducing Imported Products E-Commerce Baby Stores * As reported in 10-K 2009 2010 2011 2012 2013
Slide 11: MJN Top Markets United States
MJN Top Markets 10 United States
Slide 12: U.S. Category – Cause for Optimism
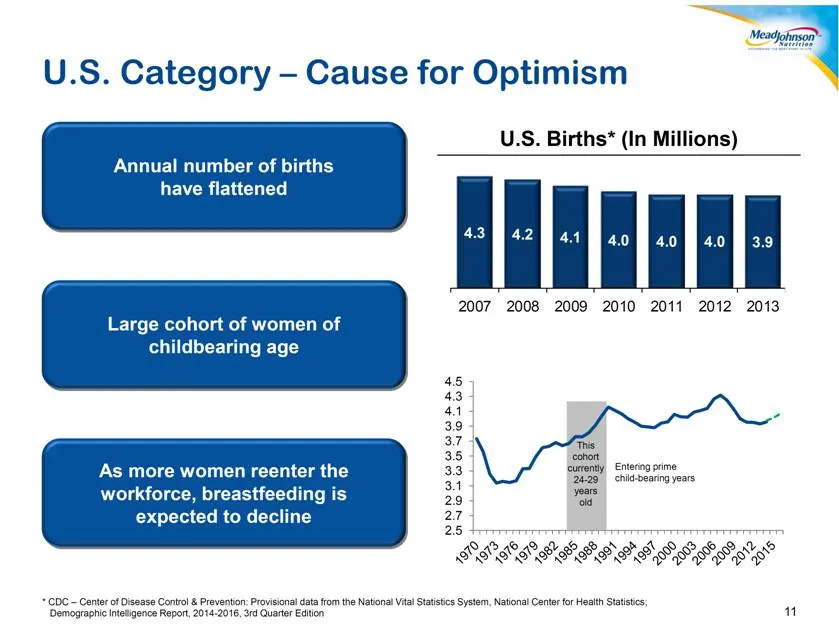
U.S. Category – Cause for Optimism 11 As more women reenter the workforce, breastfeeding is expected to decline Large cohort of women of childbearing age Annual number of births have flattened This cohort currently 24-29 years old U.S. Births* (In Millions) * CDC – Center of Disease Control & Preven
Slide 13: U.S. Infant Growth Drivers
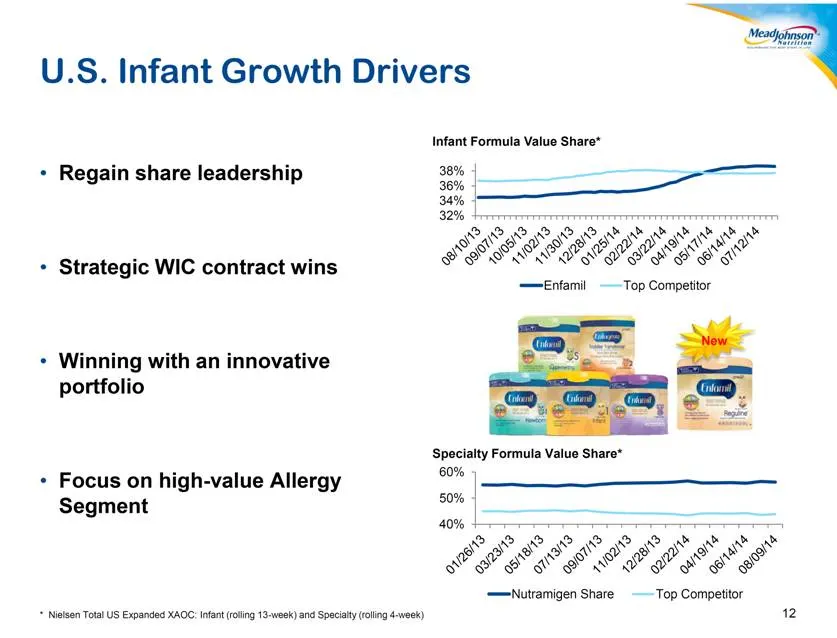
Regain share leadership Strategic WIC contract wins Winning with an innovative portfolio Focus on high-value Allergy Segment * Nielsen Total US Expanded XAOC: Infant (rolling 13-week) and Specialty (rolling 4-week) 12 U.S. Infant Growth Drivers Specialty Formula Value Share* Infant Formula Value Sha
Slide 14: U.S. is a Major Segment Driver
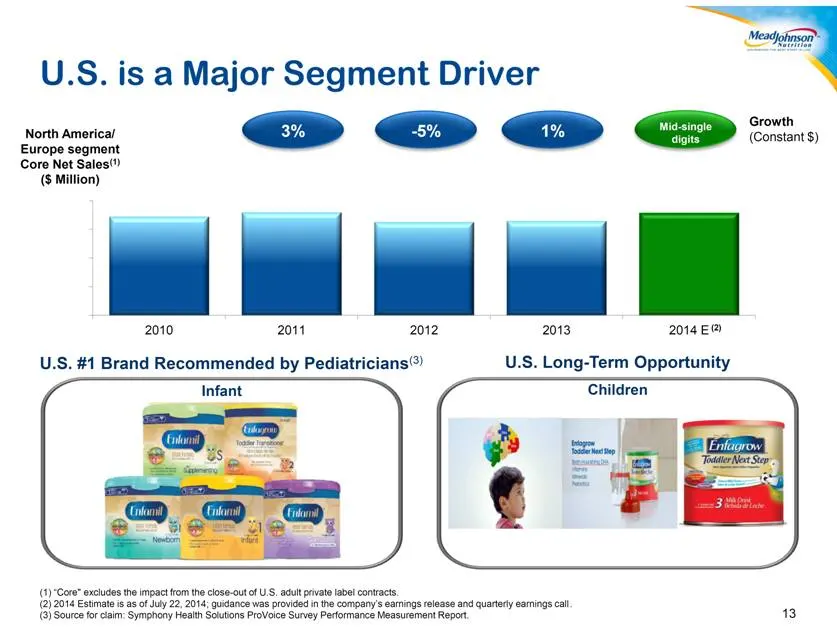
13 U.S. is a Major Segment Driver North America/Europe segment Core Net Sales(1) ($ Million) 3% -5% 1% Growth (Constant $) U.S. #1 Brand Recommended by Pediatricians(3) U.S. Long-Term Opportunity (1) “Core" excludes the impact from the close-out of U.S. adult private label contracts. (2) 2014 Estima
Slide 15: Financial Highlights
Financial Highlights Meadjohnson- Nutrition
Slide 16: Strong Financial Performance
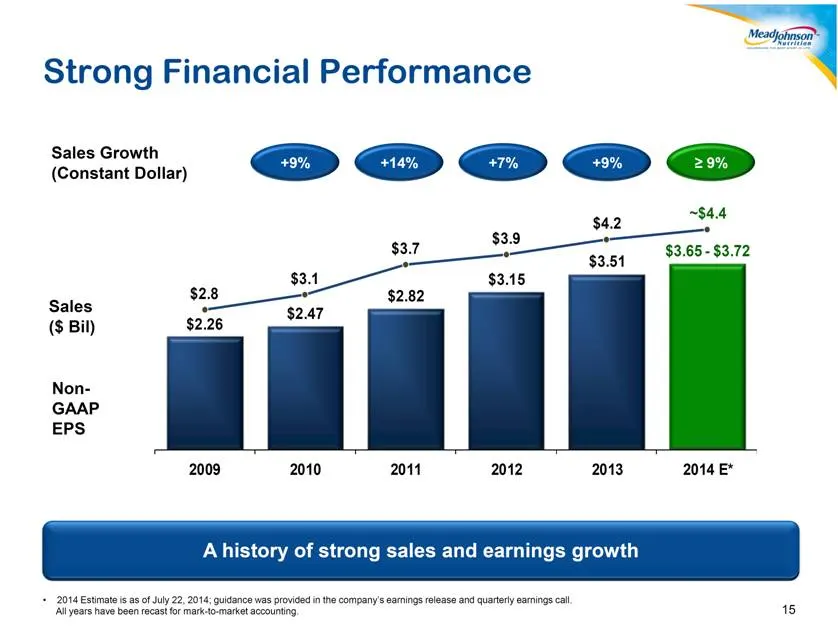
Strong Financial Performance 15 A history of strong sales and earnings growth Sales ($ Bil) Non-GAAP EPS Sales Growth (Constant Dollar) > 9% +9% +14% +9% +7% 2014 Estimate is as of July 22, 2014; guidance was provided in the company’s earnings release and quarterly earnings call. All years have been
Slide 17: Diverse Sources of Growth
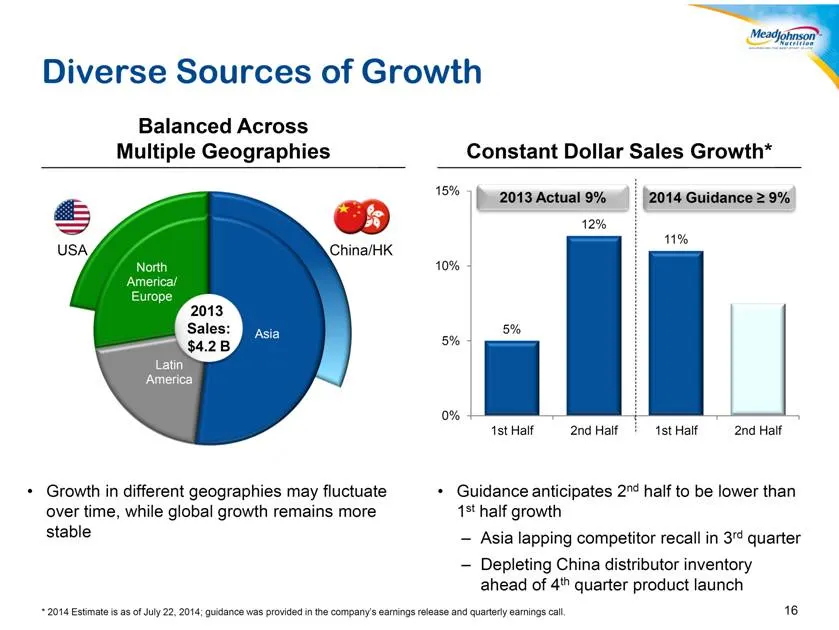
Growth in different geographies may fluctuate over time, while global growth remains more stable Diverse Sources of Growth 16 Guidance anticipates 2nd half to be lower than 1st half growth Asia lapping competitor recall in 3rd quarter Depleting China distributor inventory ahead of 4th quarter produc
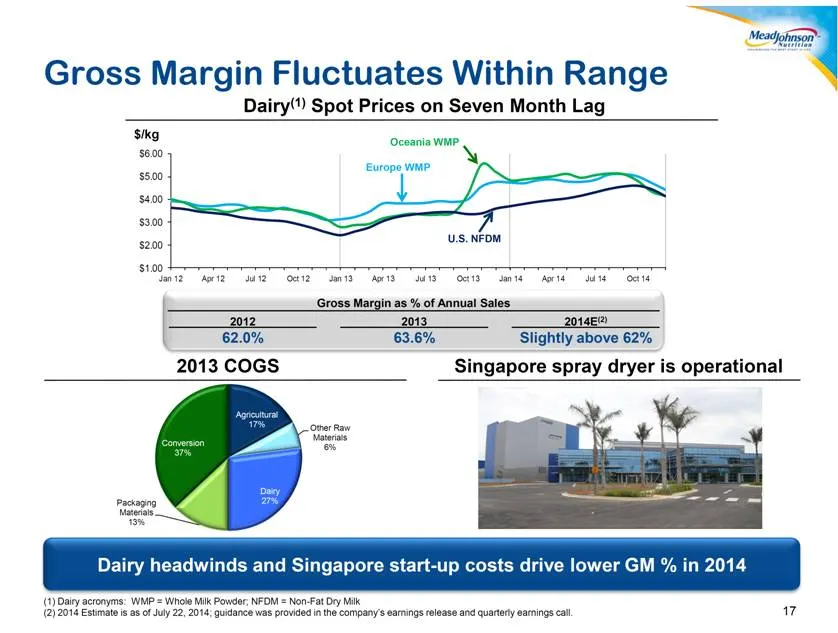
Slide 18: Gross Margin Fluctuates Within Range
Gross Margin Fluctuates Within Range 2013 COGS 17 Dairy(1) Spot Prices on Seven Month Lag $/kg Oceania WMP Europe WMP U.S. NFDM Dairy headwinds and Singapore start-up costs drive lower GM % in 2014 Singapore spray dryer is operational Gross Margin as % of Annual Sales 62.0% 2012 63.6% 2013 Slightly
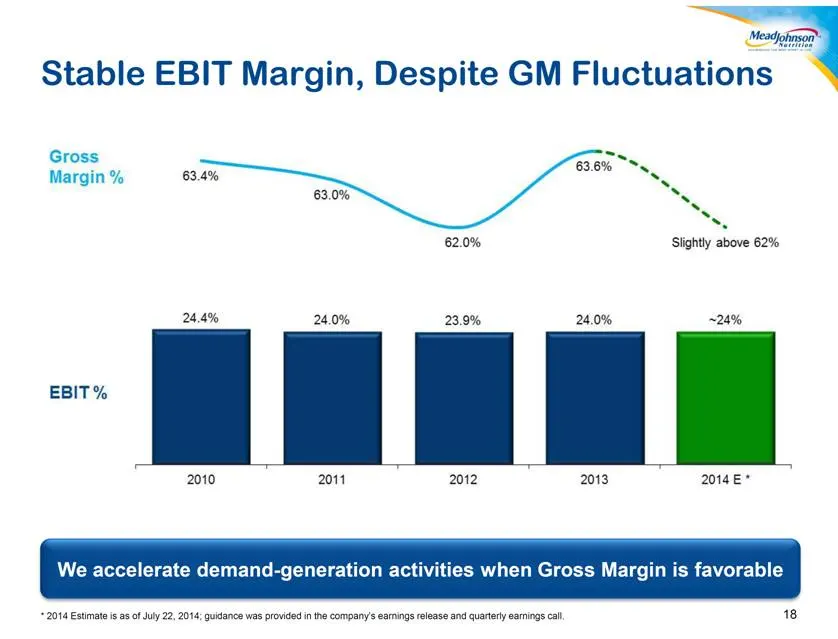
Slide 19: Stable EBIT Margin, Despite GM Fluctuations
Stable EBIT Margin, Despite GM Fluctuations 18 We accelerate demand-generation activities when Gross Margin is favorable * 2014 Estimate is as of July 22, 2014; guidance was provided in the company’s earnings release and quarterly earnings call.
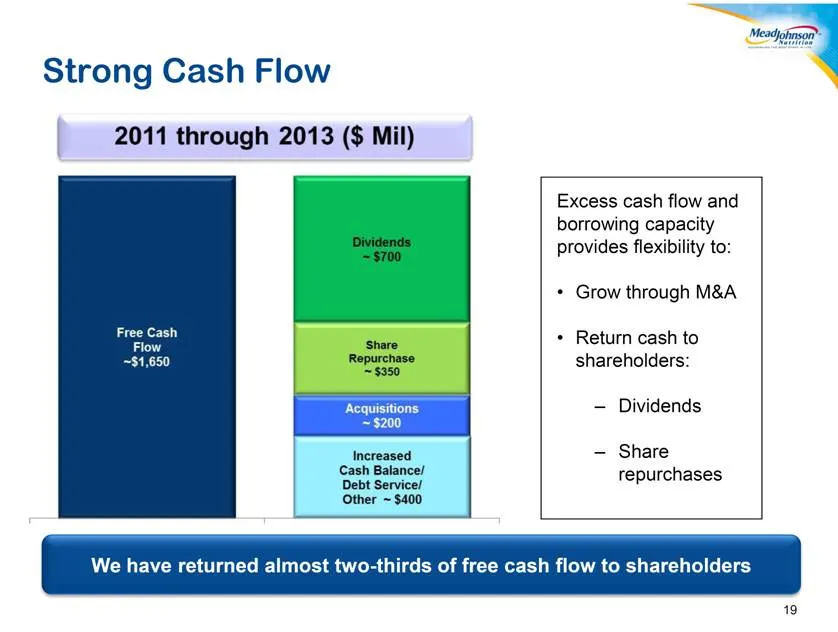
Slide 20: Strong Cash Flow
Strong Cash Flow 19 Excess cash flow and borrowing capacity provides flexibility to: Grow through M&A Return cash to shareholders: Dividends Share repurchases We have returned almost two-thirds of free cash flow to shareholders
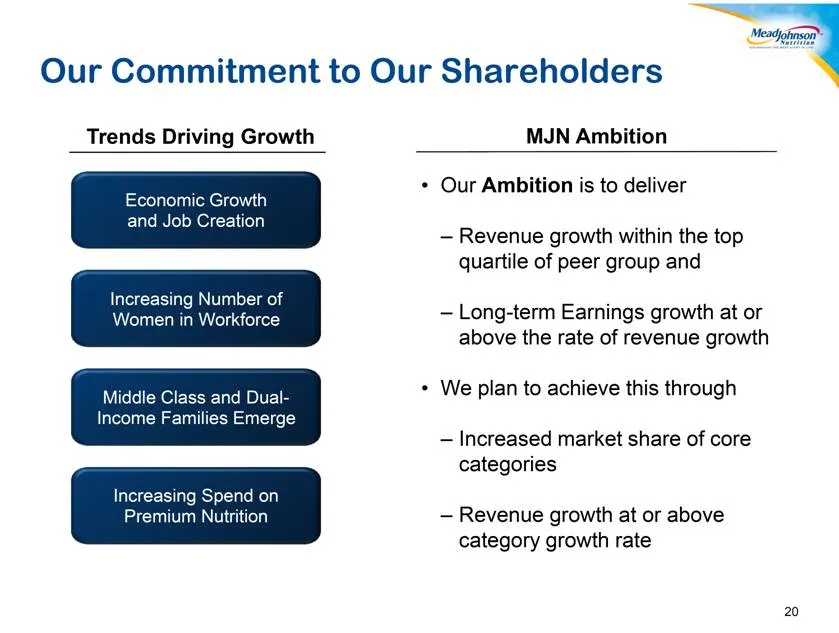
Slide 21: Our Commitment to Our Shareholders
Our Commitment to Our Shareholders 20 MJN Ambition Our Ambition is to deliver Revenue growth within the top quartile of peer group and Long-term Earnings growth at or above the rate of revenue growth We plan to achieve this through Increased market share of core categories Revenue growth at or above
Slide 22: Appendix
21 Appendix
Slide 23: Reconciliation of non-GAAP to GAAP
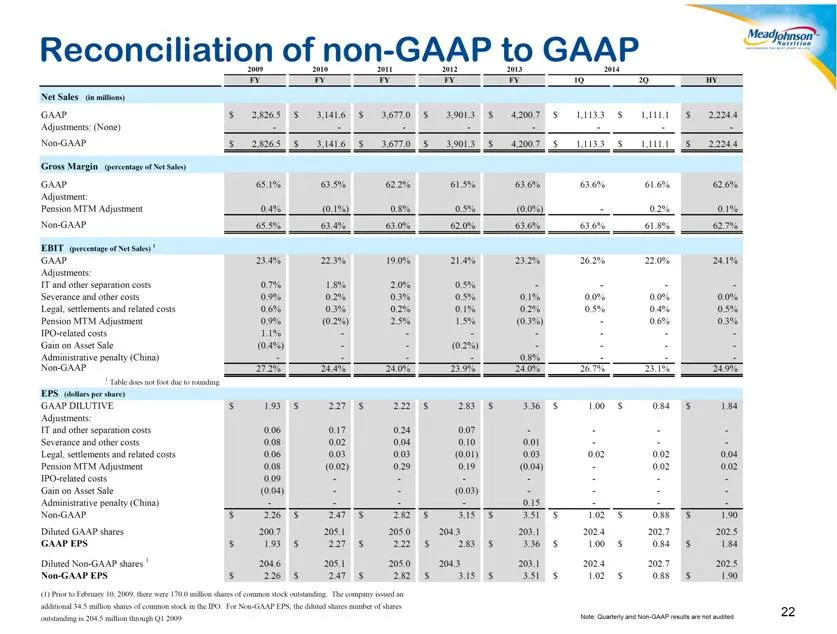
22 Reconciliation of non-GAAP to GAAP Note: Quarterly and Non-GAAP results are not audited 2009 2010 2011 FY FY FY FY FY 1Q 2Q HY Net Sales (in millions) GAAP 2,826.5 $ 3,141.6 $ 3,677.0 $ 3,901.3 $ 4,200.7 $ 1,113.3 $ 1,111.1 $ 2,224.4 $ Adjustments: (None) - - - - - - - - Non-GAAP 2,826.5 $ 3,141.
Slide 24: Reconciliation of non-GAAP to GAAP: Free Cash Flow
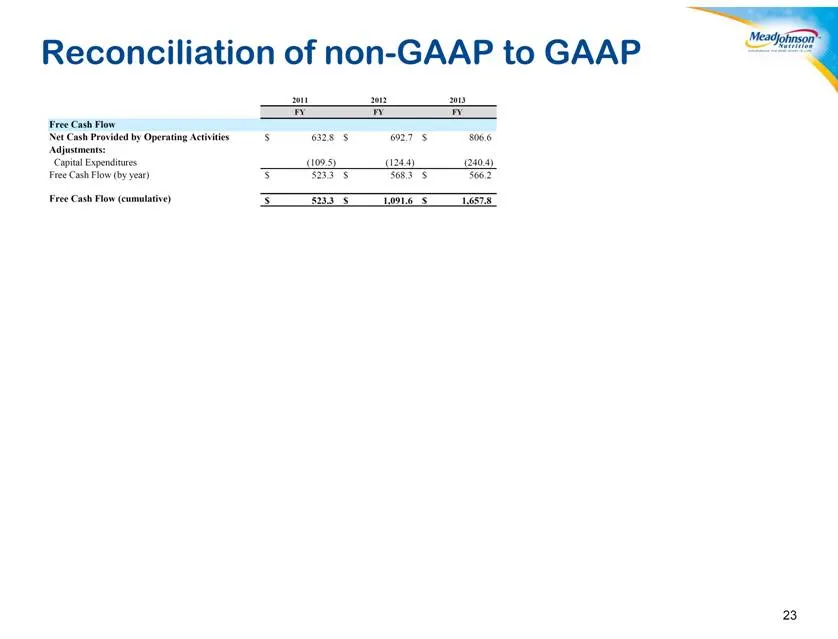
23 Reconciliation of non-GAAP to GAAP 2011 2012 2013 FY FY FY Free Cash Flow Net Cash Provided by Operating Activities $ 632.8 $ 692.7 $ 806.6 Adjustments: Capital Expenditures (109.5) (124.4) (240.4) Free Cash Flow (by year) $ 523.3 $ 568.3 $ 566.2 Free Cash Flow (cumulative) $ 523.3 $ 1,091.6 $ 1,
Source: SEC EDGAR · 8-K filed Sep 3, 2014
More decks from Mead Johnson Nutrition CO
 Morgan Stanley Global Consumer & Retail Conference 201616 slides · Nov 15, 2016
 Barclays Global Consumer Staples Conference 201618 slides · Sep 7, 2016
 Q1 2016 Earnings Presentation20 slides · Apr 28, 2016
 FY2015 Earnings Presentation23 slides · Jan 28, 2016
 Q3 2015 Earnings Presentation26 slides · Oct 22, 2015
 Investor Day (October 2015)15 slides · Oct 22, 2015