Ditech — Walter Investment Management — Debt Investor Presentation (January 2013)
41 slides from Ditech's debt investor presentation, Jan 16, 2013
Slide 1: Presentation to Lenders $475 million First Lien Term Loan
Presentation to Lenders $475 million First Lien Term Loan January 2013 0
Slide 2: Forward-Looking Statements
Forward-Looking Statements This document contains forward-looking statements, including forward-looking statements within the meaning of the Private Securities Litigation Reform Act of 1995. Such forward-looking statements include, but are not limited to, statements concerning Walter Investment's pl
Slide 3: Non-GAAP Financial Measures
Non-GAAP Financial Measures To supplement Walter Investment's consolidated financial statements prepared in accordance with GAAP and to better reflect period-over-period comparisons, Walter Investment uses non-GAAP financial measures of performance, financial position, or cash flows that either excl
Slide 4: Agenda
Agenda 1. Transaction Overview 2. Executive Summary 3. Key Credit Highlights 4. Industry Overview 5. Solid Financial Profile 6. Mitigating Risk / Platform Expansion 7. Business Line Expansion 8. Syndication Summary 3
Slide 5: Management Presenters
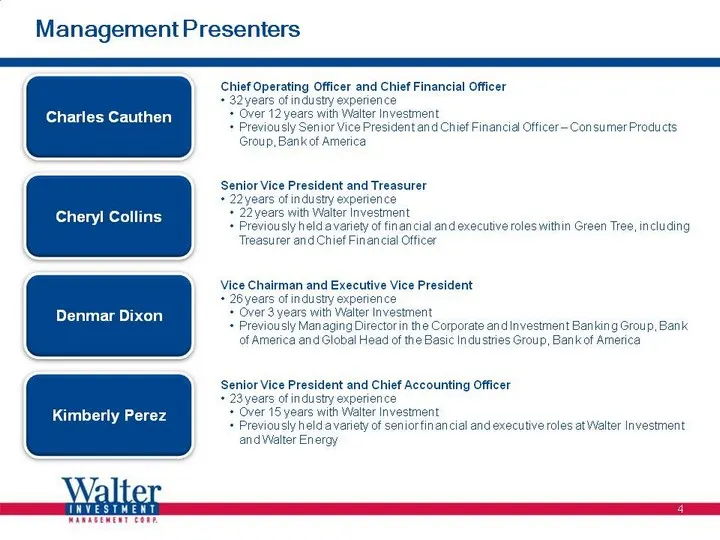
Management Presenters Charles Cauthen Denmar Dixon Chief Operating Officer and Chief Financial Officer 32 years of industry experience Over 12 years with Walter Investment Previously Senior Vice President and Chief Financial Officer - Consumer Products Group, Bank of America Vice Chairman and Execut
Slide 6: 1. Transaction Overview
1. Transaction Overview LE
Slide 7: Transaction Overview
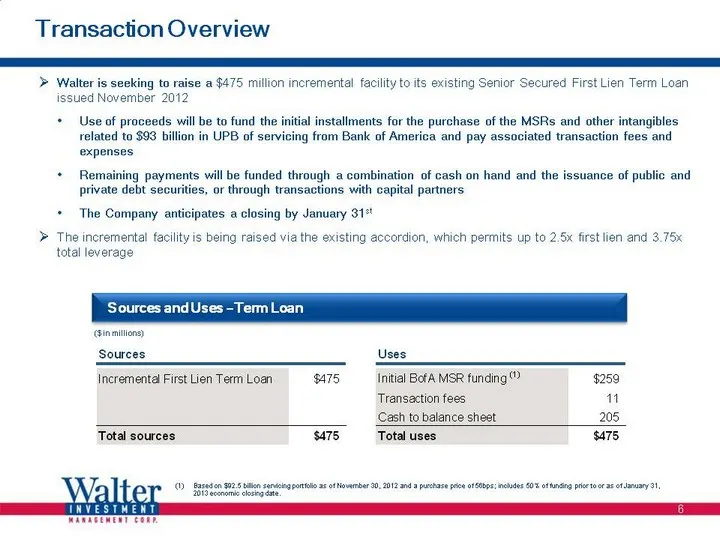
Transaction Overview Walter is seeking to raise a $475 million incremental facility to its existing Senior Secured First Lien Term Loan issued November 2012 Use of proceeds will be to fund the initial installments for the purchase of the MSRs and other intangibles related to $93 billion in UPB of se
Slide 8: Pro Forma Capitalization
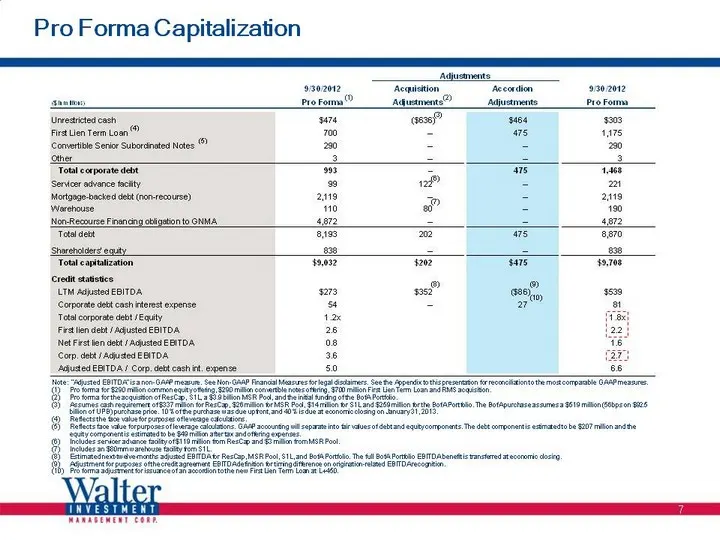
Pro Forma Capitalization 7 Note: "Adjusted EBITDA" is a non-GAAP measure. See Non-GAAP Financial Measures for legal disclaimers. See the Appendix to this presentation for reconciliation to the most comparable GAAP measures. (1) Pro forma for $290 million common equity offering, $290 million converti
Slide 9: Summary Organizational Chart
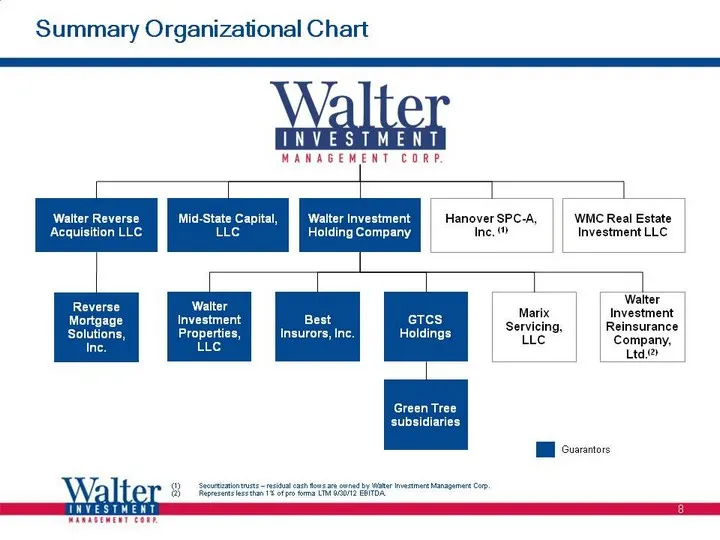
Summary Organizational Chart Walter Reverse Acquisition LLC Mid-State Capital, LLC WMC Real Estate Investment LLC Walter Investment Holding Company Hanover SPC-A, Inc. (1) Reverse Mortgage Solutions, Inc. Marix Servicing, LLC Walter Investment Reinsurance Company, Ltd.(2) Best Insurors, Inc. Walter
Slide 10: 2. Executive Summary
2. Executive Summary 9
Slide 11: Walter Business Update
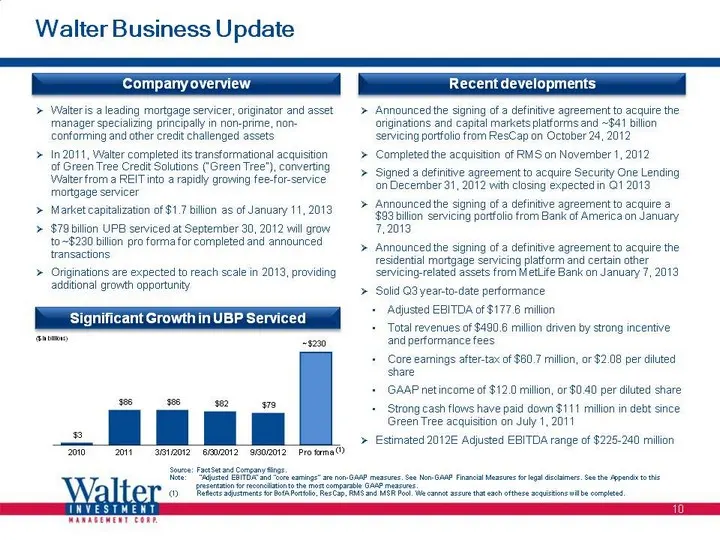
Walter Business Update Walter is a leading mortgage servicer, originator and asset manager specializing principally in non-prime, non- conforming and other credit challenged assets In 2011, Walter completed its transformational acquisition of Green Tree Credit Solutions ("Green Tree"), converting Wa
Slide 12: 3. Key Credit Highlights
3. Key Credit Highlights 11
Slide 13: Key Credit Highlights
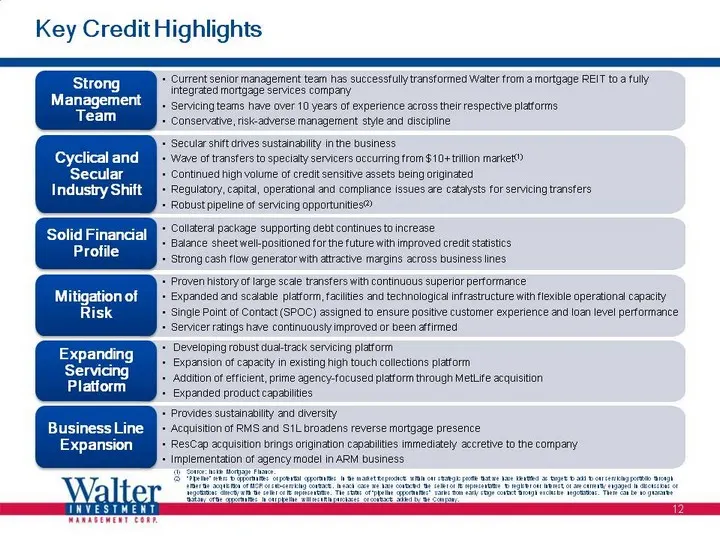
Collateral package supporting debt continues to increase Balance sheet well-positioned for the future with improved credit statistics Strong cash flow generator with attractive margins across business lines Solid Financial Profile Proven history of large scale transfers with continuous superior perf
Slide 14: 4. Industry Overview
4. Industry Overview 13
Slide 15: Changing Industry Dynamics Favor Special Servicers
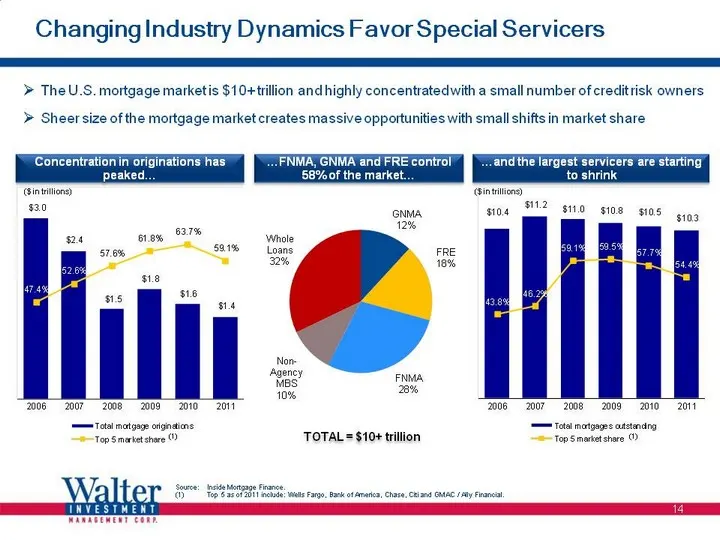
Changing Industry Dynamics Favor Special Servicers The U.S. mortgage market is $10+ trillion and highly concentrated with a small number of credit risk owners Sheer size of the mortgage market creates massive opportunities with small shifts in market share Concentration in originations has peaked...
Slide 16: Building Scale and Sustainability in the New Environment
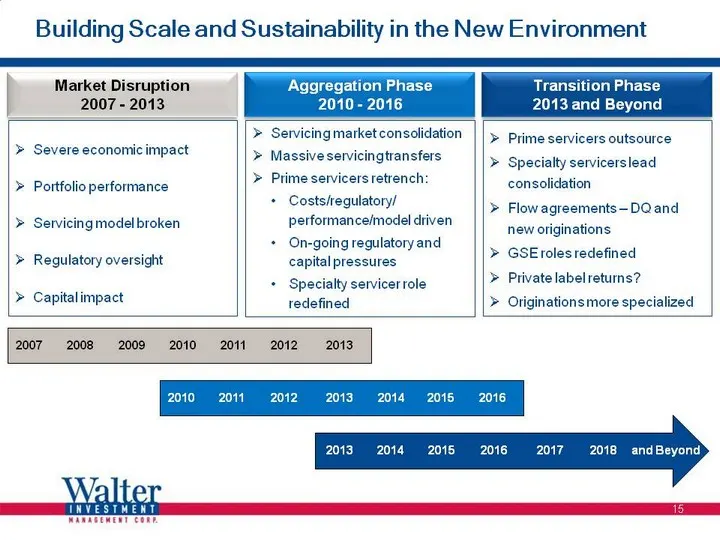
Building Scale and Sustainability in the New Environment Market Disruption 2007 - 2013 Aggregation Phase 2010 - 2016 Transition Phase 2013 and Beyond Severe economic impact Portfolio performance Servicing model broken Regulatory oversight Capital impact Servicing market consolidation Massive servici
Slide 17: The Opportunity is Accelerating for Special Servicers of Scale
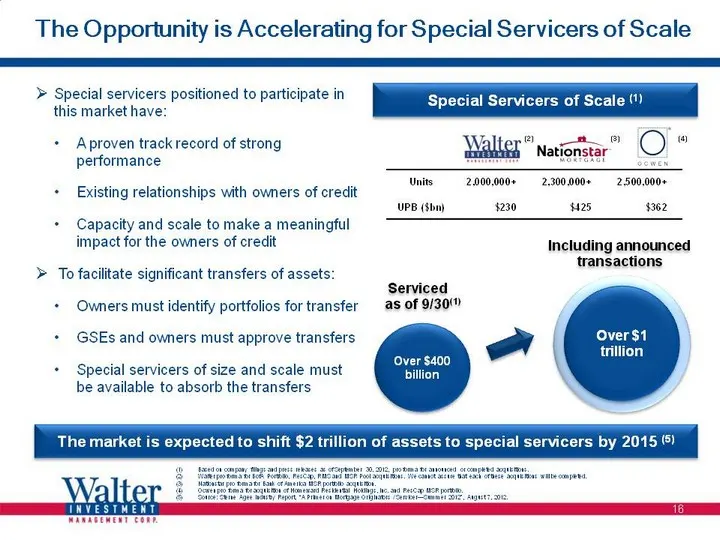
The Opportunity is Accelerating for Special Servicers of Scale Special Servicers of Scale (1) Over $400 billion Special servicers positioned to participate in this market have: A proven track record of strong performance Existing relationships with owners of credit Capacity and scale to make a meani
Slide 18: 5. Solid Financial Profile
5. Solid Financial Profile 17
Slide 19: Q3 YTD 2012 Highlights
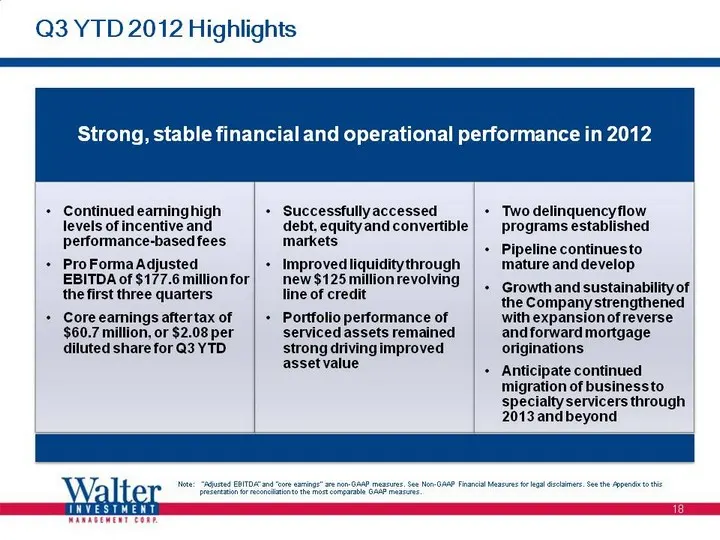
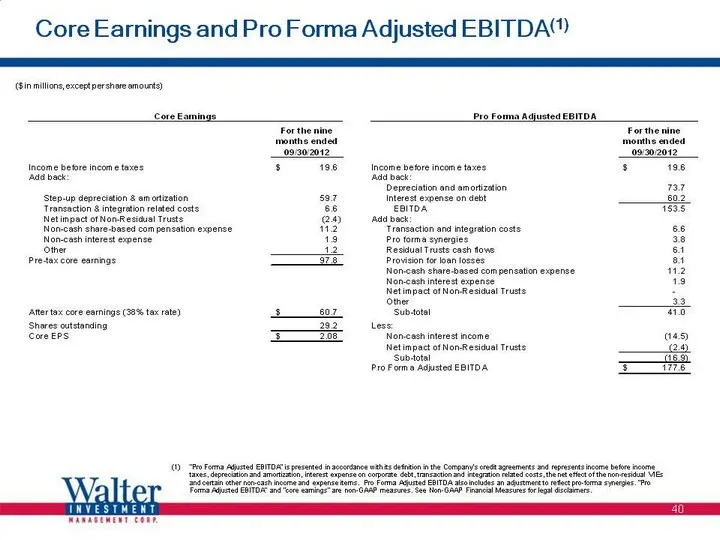
Q3 YTD 2012 Highlights Strong, stable financial and operational performance in 2012 Continued earning high levels of incentive and performance-based fees Pro Forma Adjusted EBITDA of $177.6 million for the first three quarters Core earnings after tax of $60.7 million, or $2.08 per diluted share for
Slide 20: Q3 YTD 2012 Segment Overview
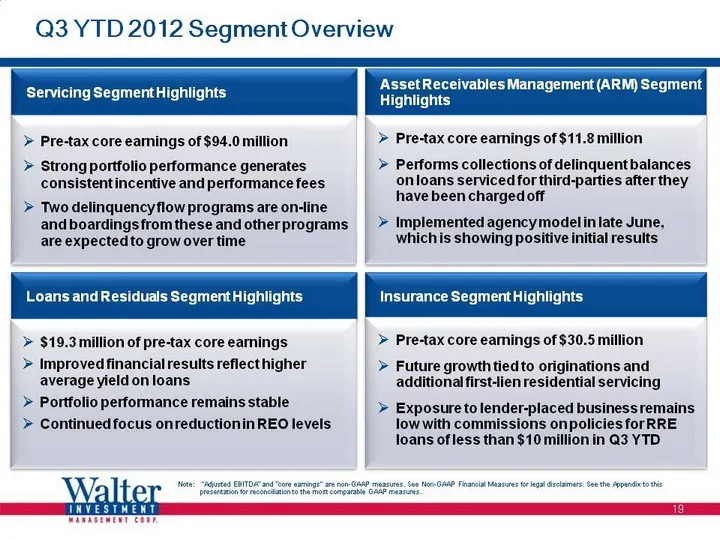
Q3 YTD 2012 Segment Overview Loans and Residuals Segment Highlights $19.3 million of pre-tax core earnings Improved financial results reflect higher average yield on loans Portfolio performance remains stable Continued focus on reduction in REO levels Servicing Segment Highlights Pre-tax core earnin
Slide 21: Strong Operating Performance
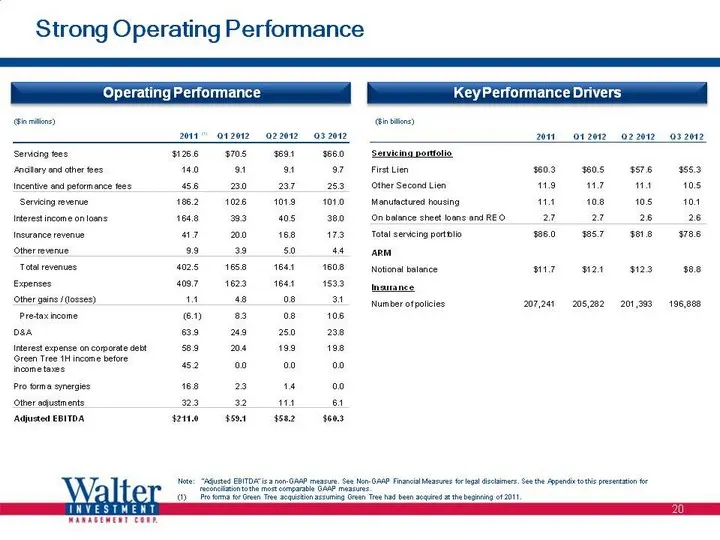
Strong Operating Performance ($ in millions) ($ in billions) Operating Performance Key Performance Drivers (1) 20 Note: "Adjusted EBITDA" is a non-GAAP measure. See Non-GAAP Financial Measures for legal disclaimers. See the Appendix to this presentation for reconciliation to the most comparable GAAP
Slide 22: 9/30/12 LTM Pro Forma Adjusted EBITDA
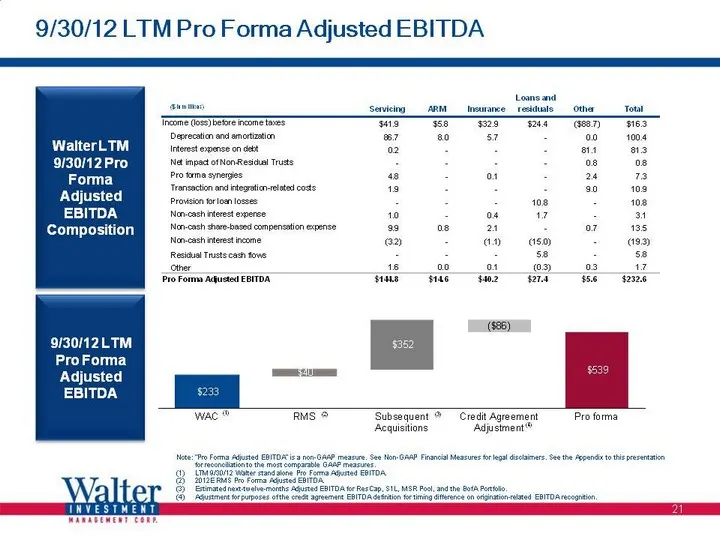
9/30/12 LTM Pro Forma Adjusted EBITDA Note: "Pro Forma Adjusted EBITDA" is a non-GAAP measure. See Non-GAAP Financial Measures for legal disclaimers. See the Appendix to this presentation for reconciliation to the most comparable GAAP measures. (1) LTM 9/30/12 Walter stand alone Pro Forma Adjusted E
Slide 23: 6. Mitigating Risk / Platform Expansion
6. Mitigating Risk / Platform Expansion 22
Slide 24: Servicing Growth and Integration Plan
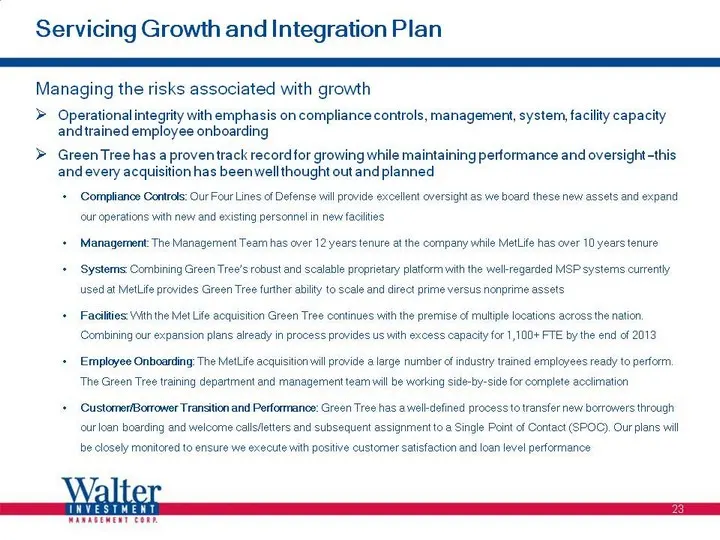
Servicing Growth and Integration Plan Managing the risks associated with growth Operational integrity with emphasis on compliance controls, management, system, facility capacity and trained employee onboarding Green Tree has a proven track record for growing while maintaining performance and oversig
Slide 25: Servicing Growth and Integration Plan (Cont'd)
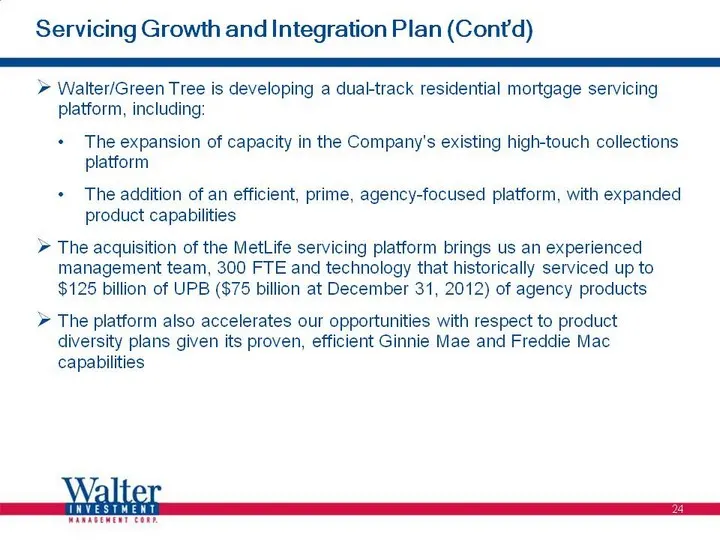
Servicing Growth and Integration Plan (Cont'd) Walter/Green Tree is developing a dual-track residential mortgage servicing platform, including: The expansion of capacity in the Company's existing high-touch collections platform The addition of an efficient, prime, agency-focused platform, with expan
Slide 26: 7. Business Line Expansion
7. Business Line Expansion 25
Slide 27: Strategic Overview
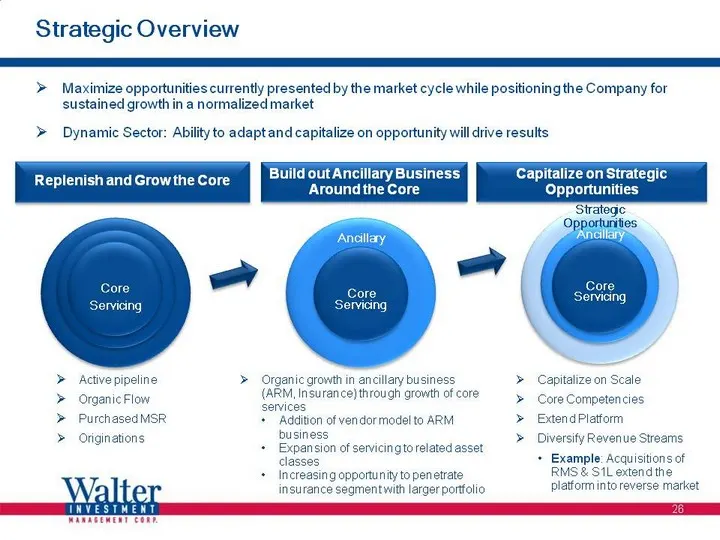
Strategic Overview Maximize opportunities currently presented by the market cycle while positioning the Company for sustained growth in a normalized market Dynamic Sector: Ability to adapt and capitalize on opportunity will drive results Active pipeline Organic Flow Purchased MSR Originations Organi
Slide 28: ResCap Acquisition Overview
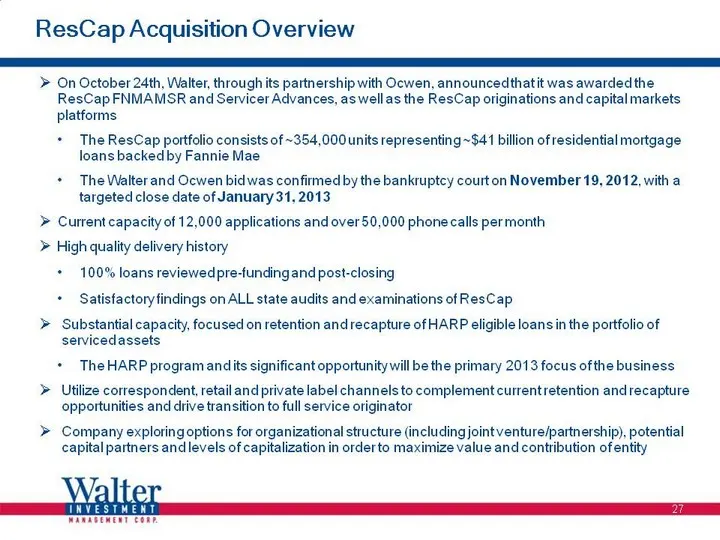
ResCap Acquisition Overview On October 24th, Walter, through its partnership with Ocwen, announced that it was awarded the ResCap FNMA MSR and Servicer Advances, as well as the ResCap originations and capital markets platforms The ResCap portfolio consists of ~354,000 units representing ~$41 billion
Slide 29: Bank of America MSR Portfolio Overview
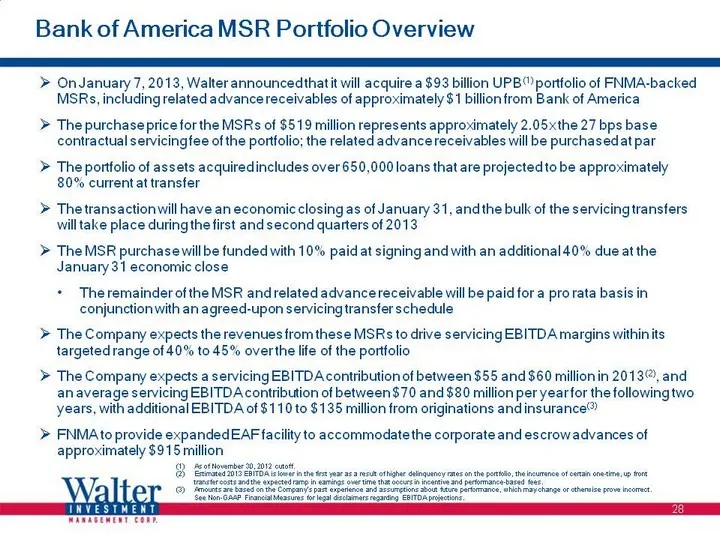
Bank of America MSR Portfolio Overview On January 7, 2013, Walter announced that it will acquire a $93 billion UPB(1) portfolio of FNMA-backed MSRs, including related advance receivables of approximately $1 billion from Bank of America The purchase price for the MSRs of $519 million represents appro
Slide 30: Security One Lending Acquisition Overview
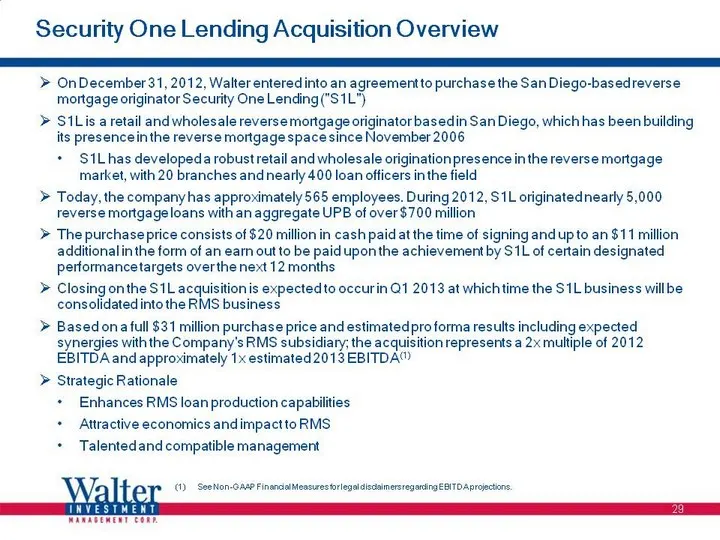
Security One Lending Acquisition Overview On December 31, 2012, Walter entered into an agreement to purchase the San Diego-based reverse mortgage originator Security One Lending ("S1L") S1L is a retail and wholesale reverse mortgage originator based in San Diego, which has been building its presence
Slide 31: 8. Syndication Summary
8. Syndication Summary 30
Slide 32: Illustrative Term Sheet - First Lien Credit Facilities
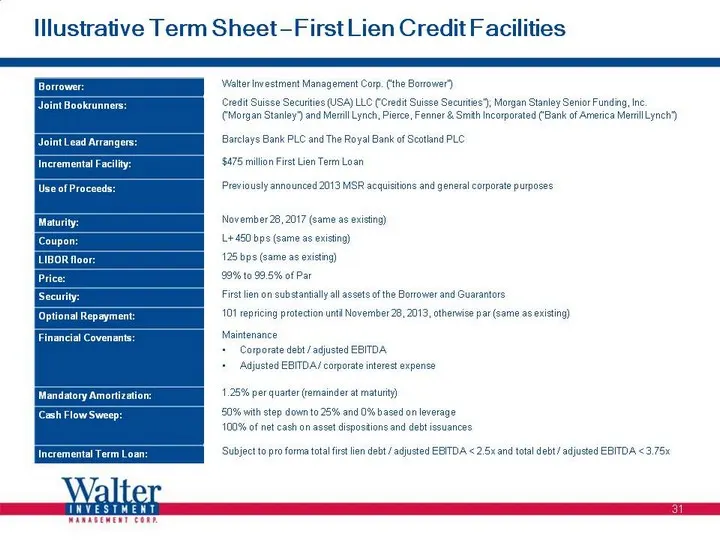
Illustrative Term Sheet - First Lien Credit Facilities 31 Borrower: Walter Investment Management Corp. ("the Borrower") Joint Bookrunners: Credit Suisse Securities (USA) LLC ("Credit Suisse Securities"); Morgan Stanley Senior Funding, Inc. ("Morgan Stanley") and Merrill Lynch, Pierce, Fenner & Smith
Slide 33: Transaction Timetable
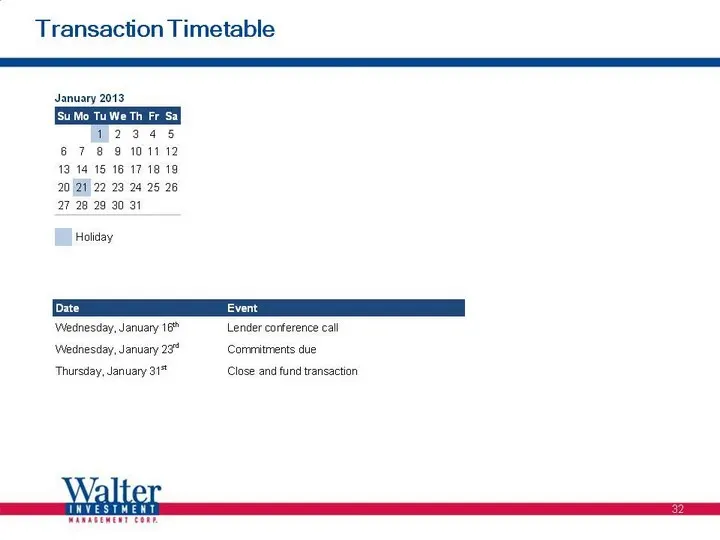
Transaction Timetable January 2013 [Su Mo TuWe Th Fr Sa W294 5 6789 101112 13:14 15 16 17 18 19 20 il 22 23 24 25 28 78 29 30 31 Holiday ‘Wednesday, January 16” Lender conference call ‘Wednesday, January 29° Corrritments due Thursday, January 31* Close and fund transaction LYE
Slide 34: Contacts
Contacts Credit Suisse Loan Capital Markets Jeff Cohen, Managing Director +1 212 325 7455 Alex Lanuza, Director +1 212 538 2295 Investment Banking Andrew Rosenburgh, Managing Director +1 212 325 5562 Ali Mehdi, Managing Director +1 212 325 2997 David Stolzar, Director +1 212 538 6840 Corporate Banki
Slide 35: Appendix
Appendix 34
Slide 36: Q3 2012 Pro Forma Adjusted EBITDA
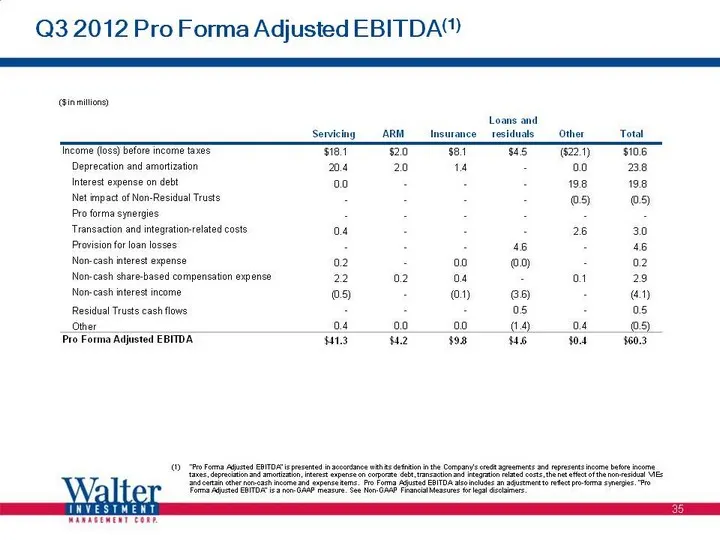
Q3 2012 Pro Forma Adjusted EBITDA(1) ($ in millions) 35 "Pro Forma Adjusted EBITDA" is presented in accordance with its definition in the Company's credit agreements and represents income before income taxes, depreciation and amortization, interest expense on corporate debt, transaction and integrat
Slide 37: Q2 2012 Pro Forma Adjusted EBITDA
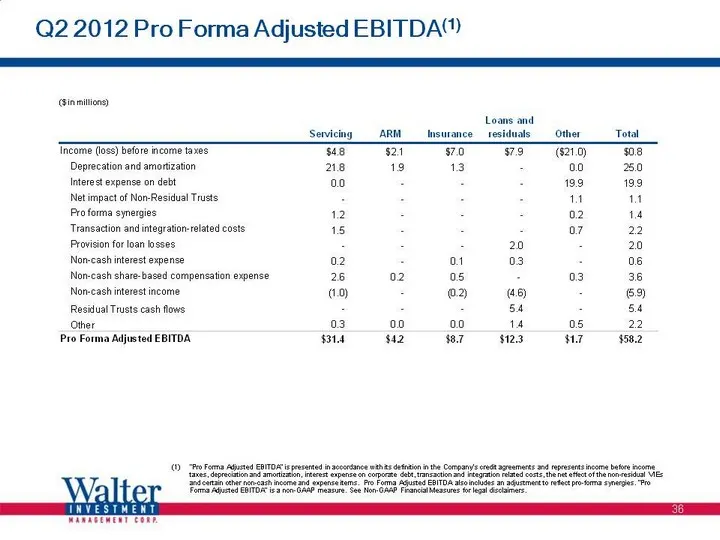
Q2 2012 Pro Forma Adjusted EBITDA(1) ($ in millions) 36 "Pro Forma Adjusted EBITDA" is presented in accordance with its definition in the Company's credit agreements and represents income before income taxes, depreciation and amortization, interest expense on corporate debt, transaction and integrat
Slide 38: Q1 2012 Pro Forma Adjusted EBITDA
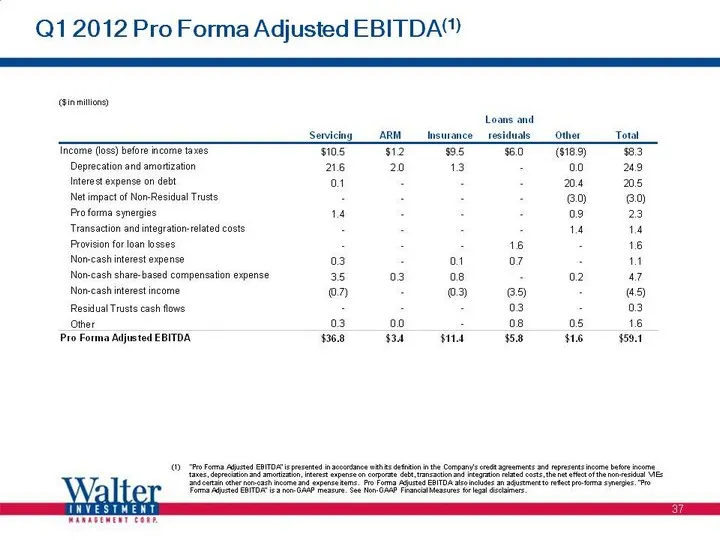
Q1 2012 Pro Forma Adjusted EBITDA(1) ($ in millions) 37 "Pro Forma Adjusted EBITDA" is presented in accordance with its definition in the Company's credit agreements and represents income before income taxes, depreciation and amortization, interest expense on corporate debt, transaction and integrat
Slide 39: Q4 2011 Pro Forma Adjusted EBITDA
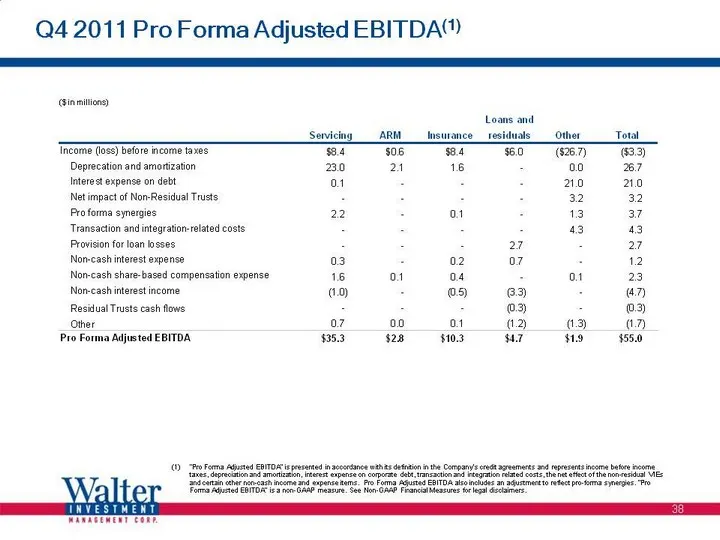
Q4 2011 Pro Forma Adjusted EBITDA(1) ($ in millions) 38 "Pro Forma Adjusted EBITDA" is presented in accordance with its definition in the Company's credit agreements and represents income before income taxes, depreciation and amortization, interest expense on corporate debt, transaction and integrat
Slide 40: Nine Months Ended 9/30/12 Core Earnings
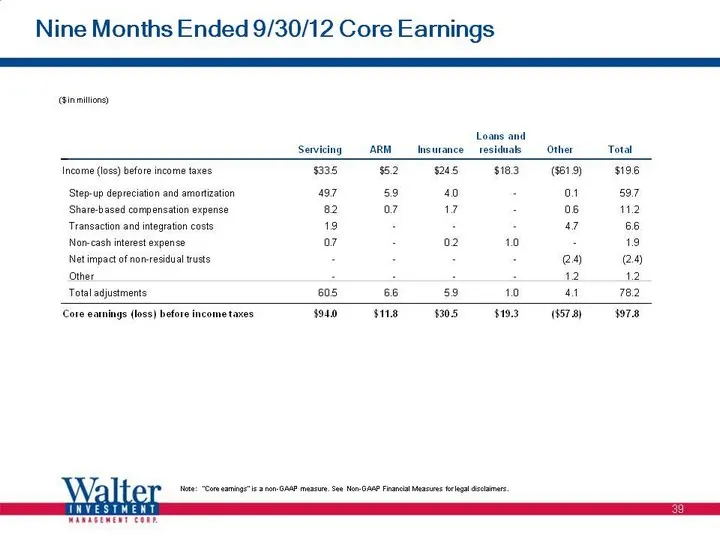
Nine Months Ended 9/30/12 Core Earnings ($ in millions) 39 Note: "Core earnings" is a non-GAAP measure. See Non-GAAP Financial Measures for legal disclaimers.
Slide 41: Core Earnings and Pro Forma Adjusted EBITDA
Core Earnings and Pro Forma Adjusted EBITDA(1) ($ in millions, except per share amounts) 40 "Pro Forma Adjusted EBITDA" is presented in accordance with its definition in the Company's credit agreements and represents income before income taxes, depreciation and amortization, interest expense on corp
Source: SEC EDGAR · 8-K filed Jan 16, 2013
More decks from Ditech Holding Corporation
 Presentation (December 2018)27 slides · Dec 14, 2018
 Q2 2018 Earnings Presentation21 slides · Aug 9, 2018
 Q1 2018 Earnings Presentation27 slides · Jun 6, 2018
 Walter Investment Management — Debt Investor Presentation (October 2017)15 slides · Oct 23, 2017
 Walter Investment Management — Debt Investor Presentation (August 2017)35 slides · Aug 1, 2017
 Walter Investment Management — Debt Investor Presentation (August 2017)5 slides · Aug 1, 2017