Churchill Capital Corp VII — SPAC Merger (August 2023)
47 slides from Churchill Capital Corp VII's SPAC merger presentation, Aug 1, 2023
Slide 1: August 2023 Investor Presentation
August 2023 Investor Presentation
Slide 2: About This Presentation
2 About This Presentation This presentation is provided for informational purposes only and has been prepared to assist interested parties in making their own evaluation with respect to a potential transaction (the “proposed transaction”) between CorpAcq Holdings Limited (“CorpAcq”) and Churchill Ca
Slide 3: Financial Information
3 Financial Information The financial information contained in this presentation has been taken from or prepared based on the historical financial statements of CorpAcq for the periods presented . CorpAcq’s historical financial information is prepared in accordance with the generally accepted accoun
Slide 4: Participants in the Solicitation
4 Participants in the Solicitation CorpAcq, Churchill, Churchill Sponsor VII LLC and their directors and executive officers may be deemed participants in the solicitation of proxies from Churchill’s shareholders with respect to the proposed transaction . A list of the names of Churchill’s directors
Slide 5: Simon Orange, David Martin, Michael Klein
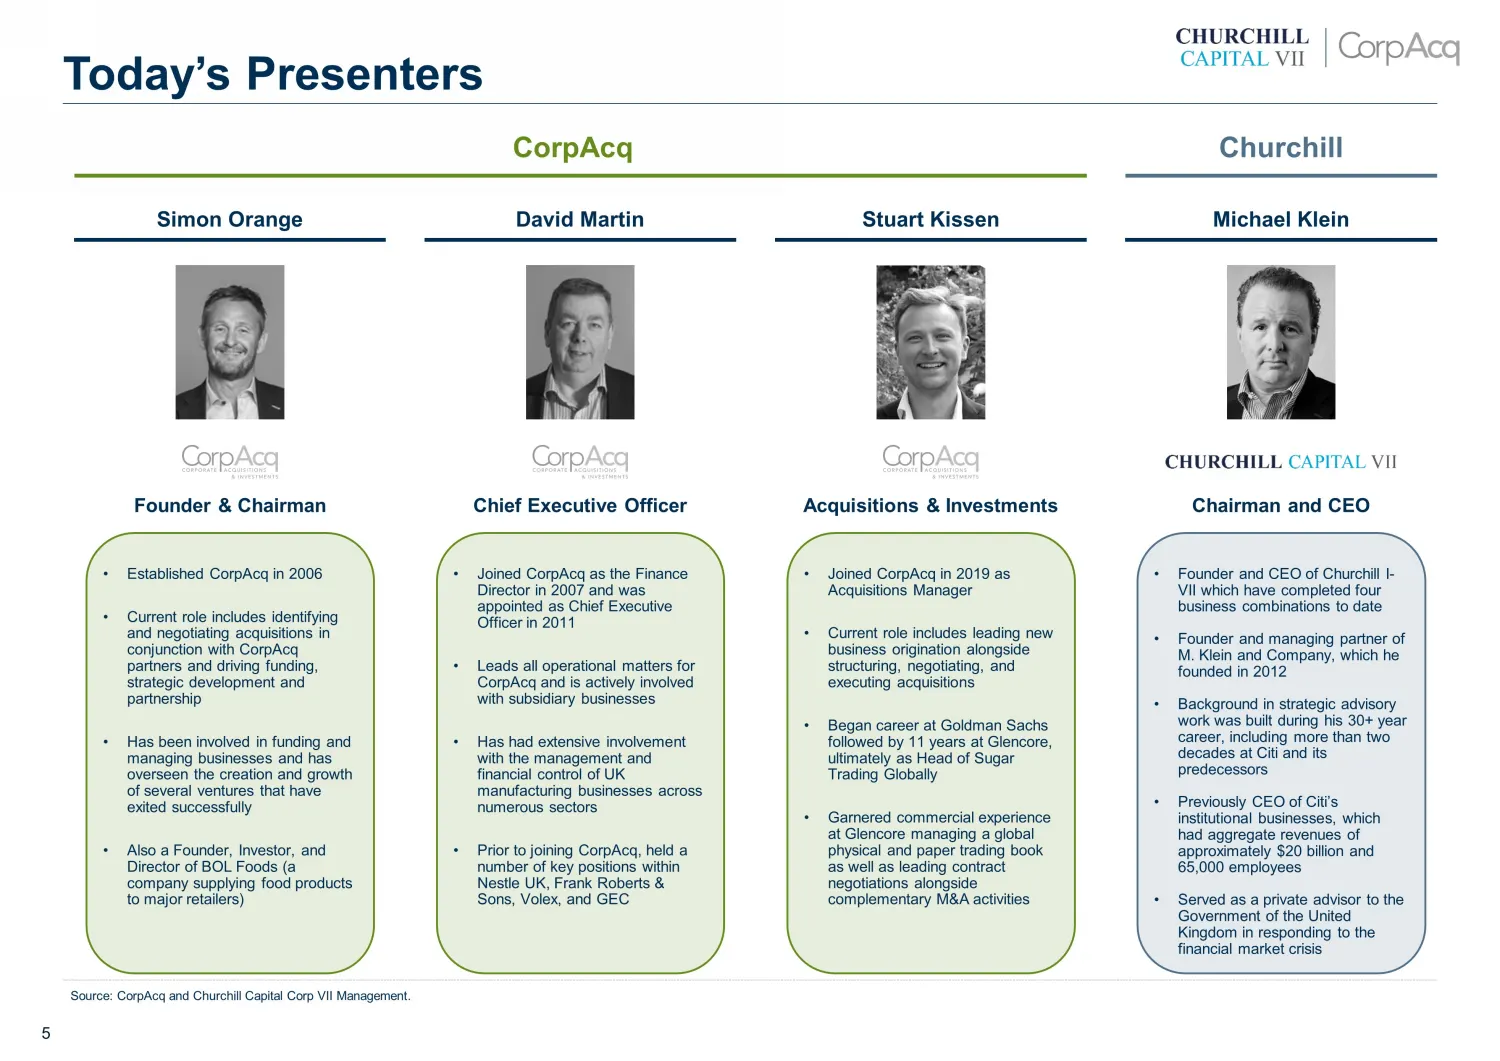
5 Simon Orange David Martin Michael Klein • Established CorpAcq in 2006 • Current role includes identifying and negotiating acquisitions in conjunction with CorpAcq partners and driving funding, strategic development and partnership • Has been involved in funding and managing businesses and has over
Slide 6: CorpAcq to go public via business combination with Churchill Capital Corp VII
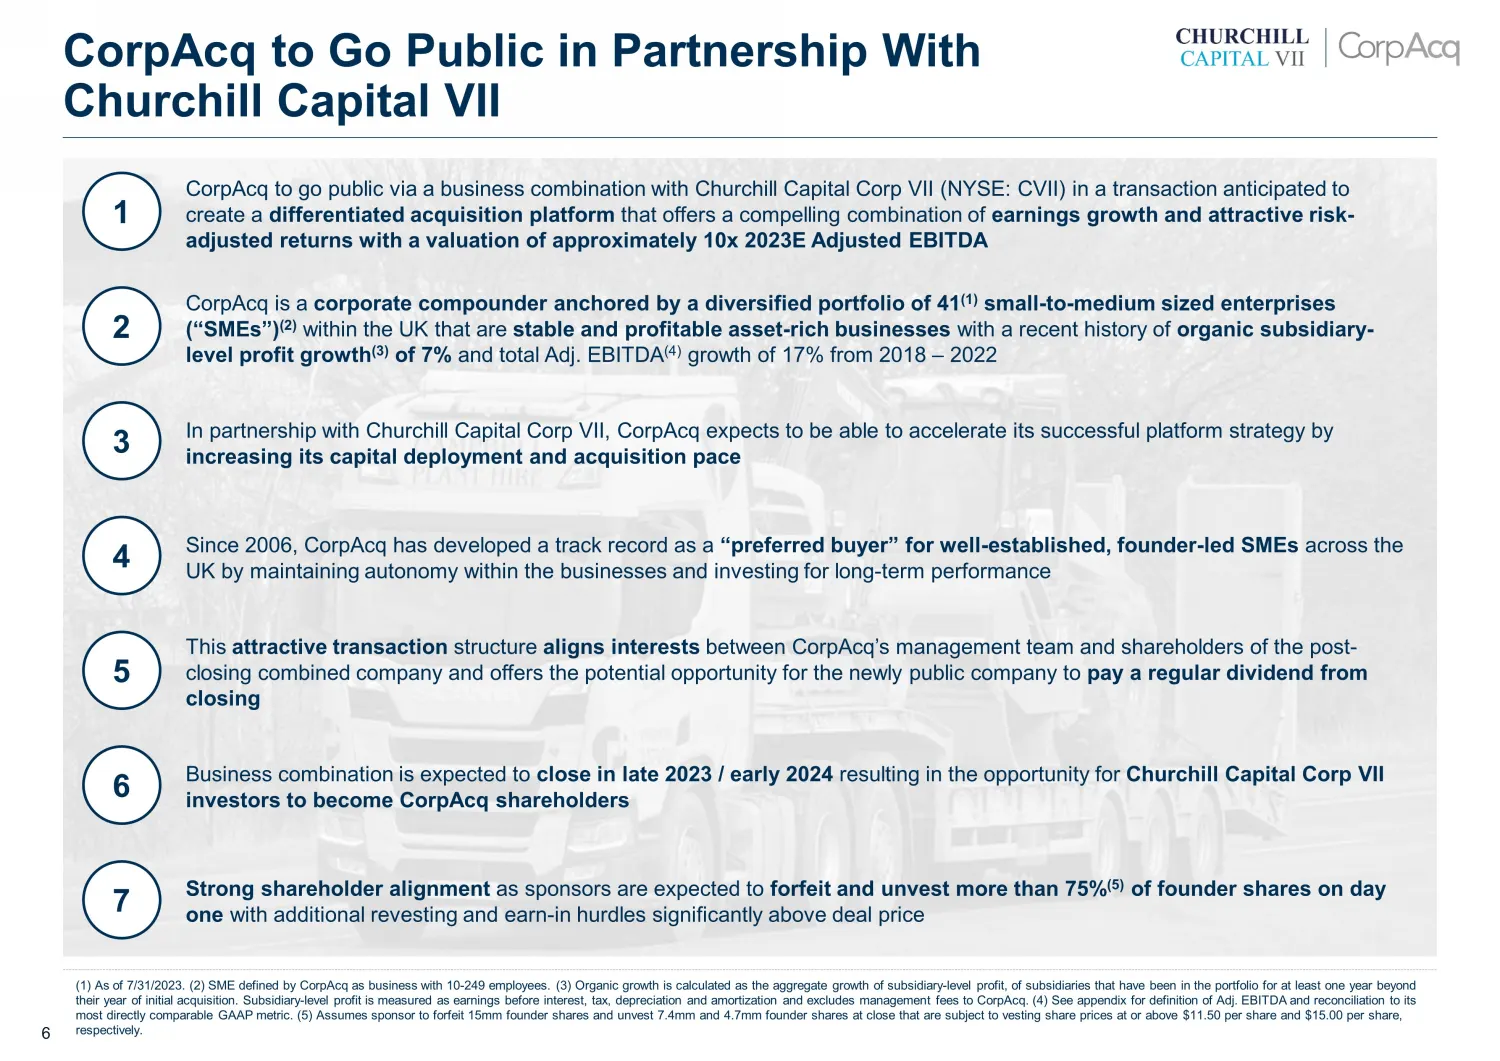
6 1 2 3 4 5 6 CorpAcq to go public via a business combination with Churchill Capital Corp VII (NYSE: CVII) in a transaction anticipated to create a differentiated acquisition platform that offers a compelling combination of earnings growth and attractive risk - adjusted returns with a valuation of a
Slide 7: A diversified platform underpinned by proven assets and an acquisition engine
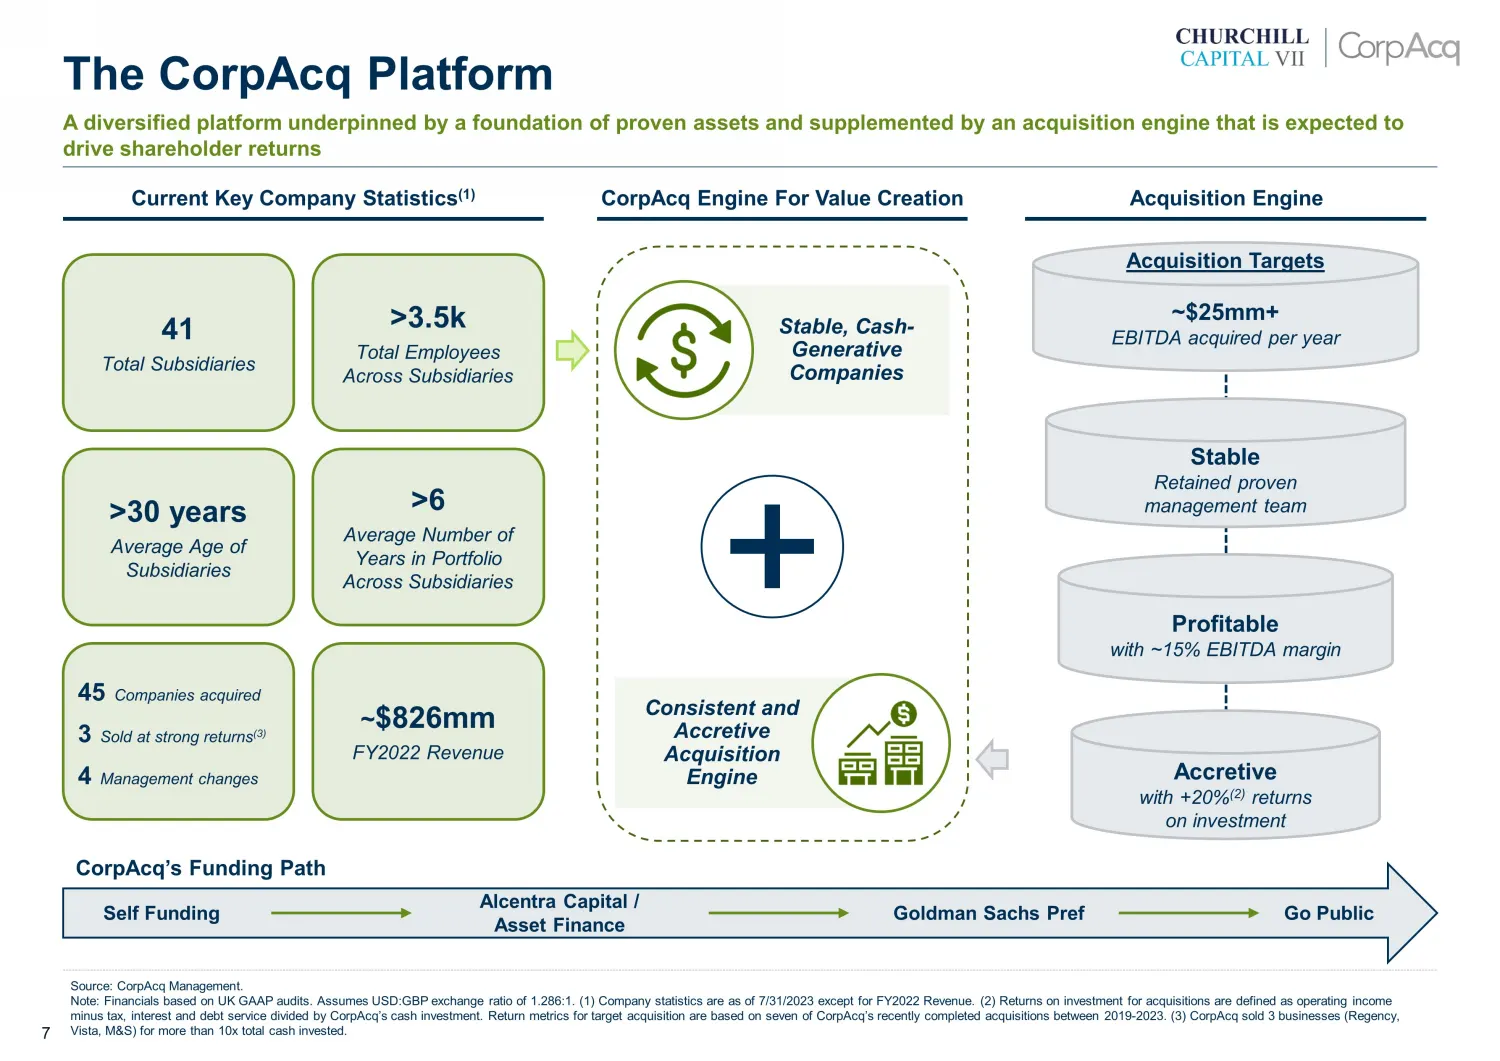
7 A diversified platform underpinned by a foundation of proven assets and supplemented by an acquisition engine that is expecte d t o drive shareholder returns Current Key Company Statistics (1) CorpAcq Engine For Value Creation Acquisition Engine Stable, Cash - Generative Companies Consistent and A
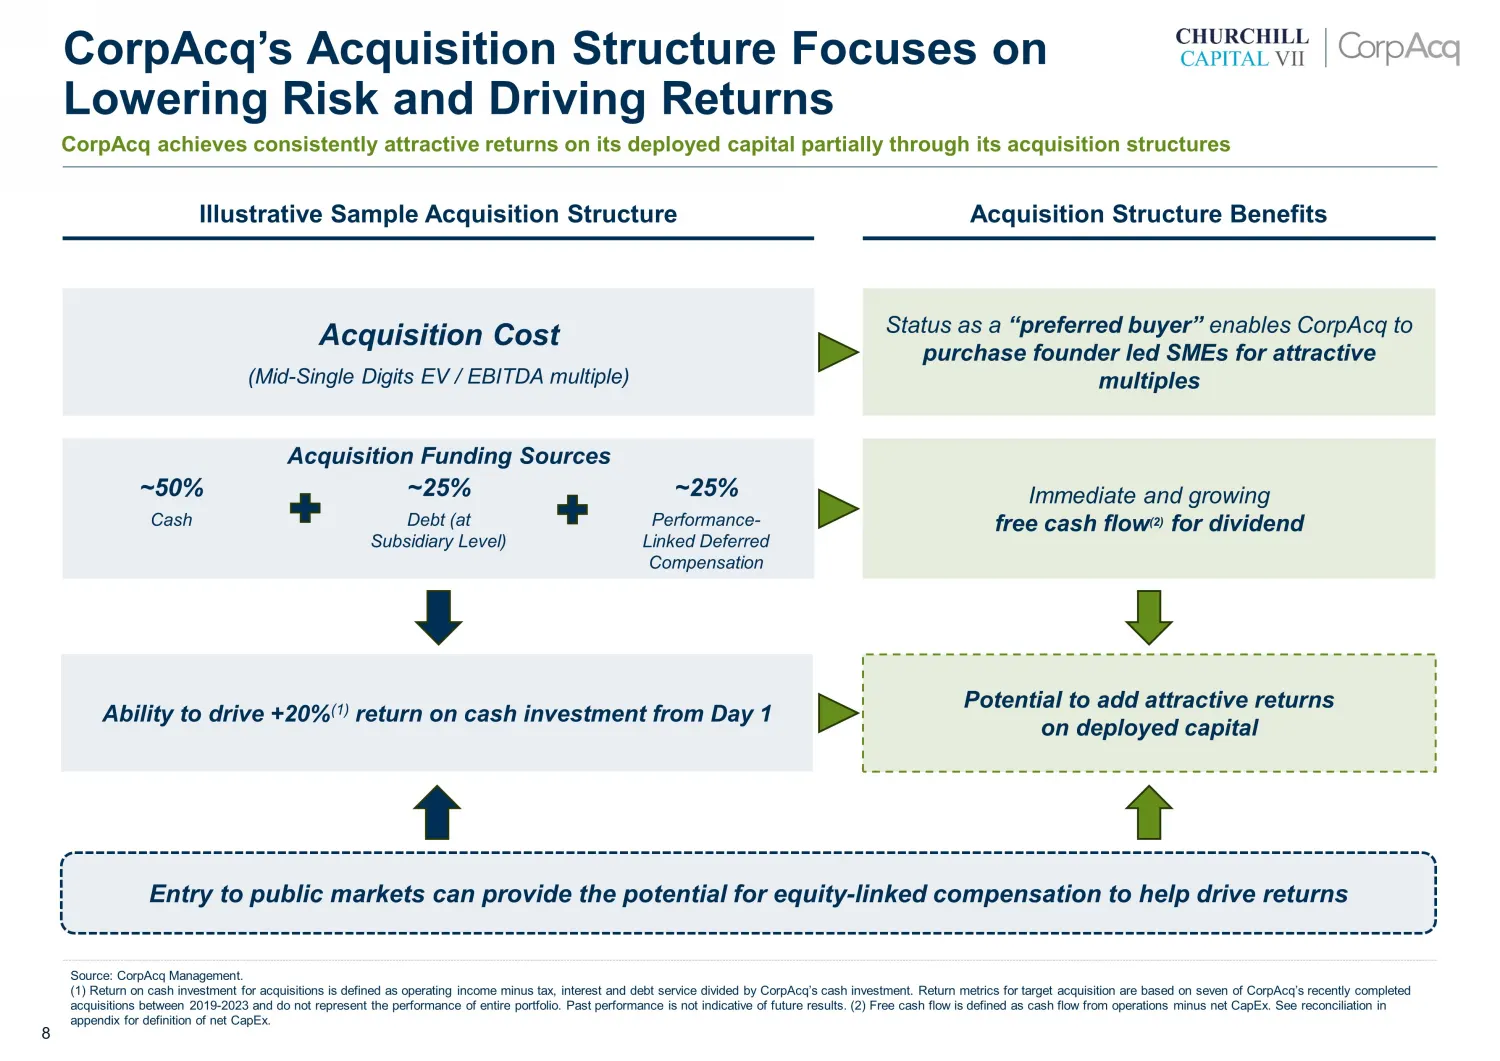
Slide 8: CorpAcq's Acquisition Structure Focuses on Lowering Risk and Driving Returns
8 CorpAcq’s Acquisition Structure Focuses on Lowering Risk and Driving Returns CorpAcq achieves consistently attractive returns on its deployed capital partially through its acquisition structures Acquisition Structure Benefits Acquisition Cost (Mid - Single Digits EV / EBITDA multiple) Entry to pub
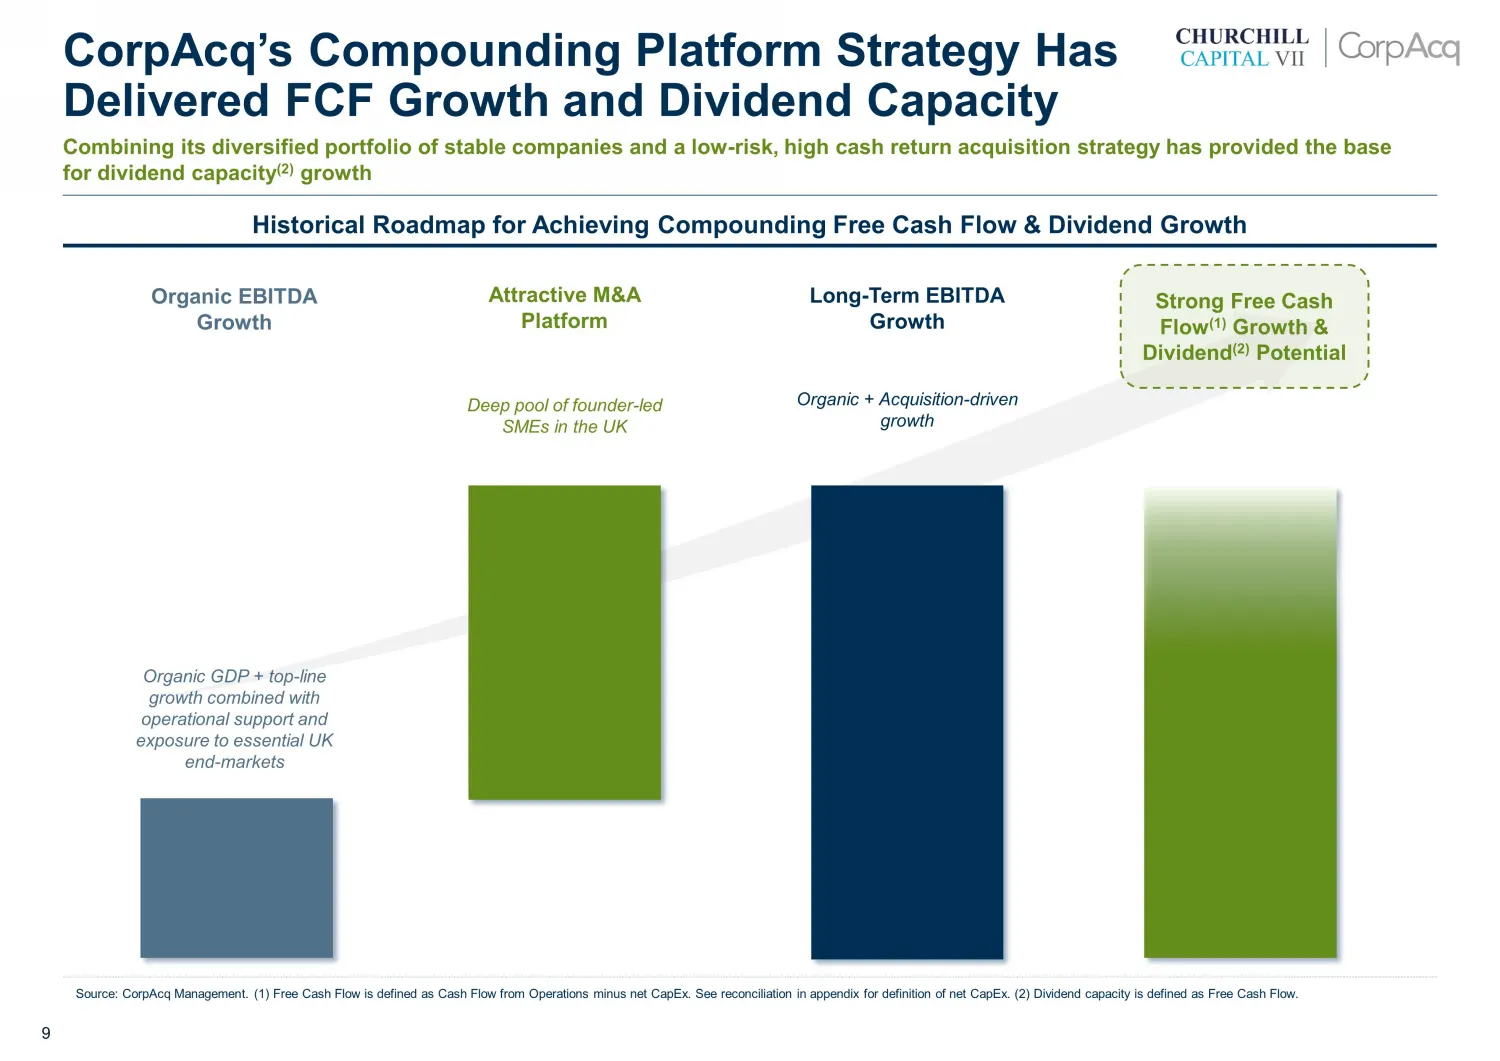
Slide 9: Historical Roadmap for Achieving Compounding Free Cash Flow & Dividend Growth
9 Historical Roadmap for Achieving Compounding Free Cash Flow & Dividend Growth Combining its diversified portfolio of stable companies and a low - risk, high cash return acquisition strategy has provided the b ase for dividend capacity (2) growth Organic GDP + top - line growth combined with operat
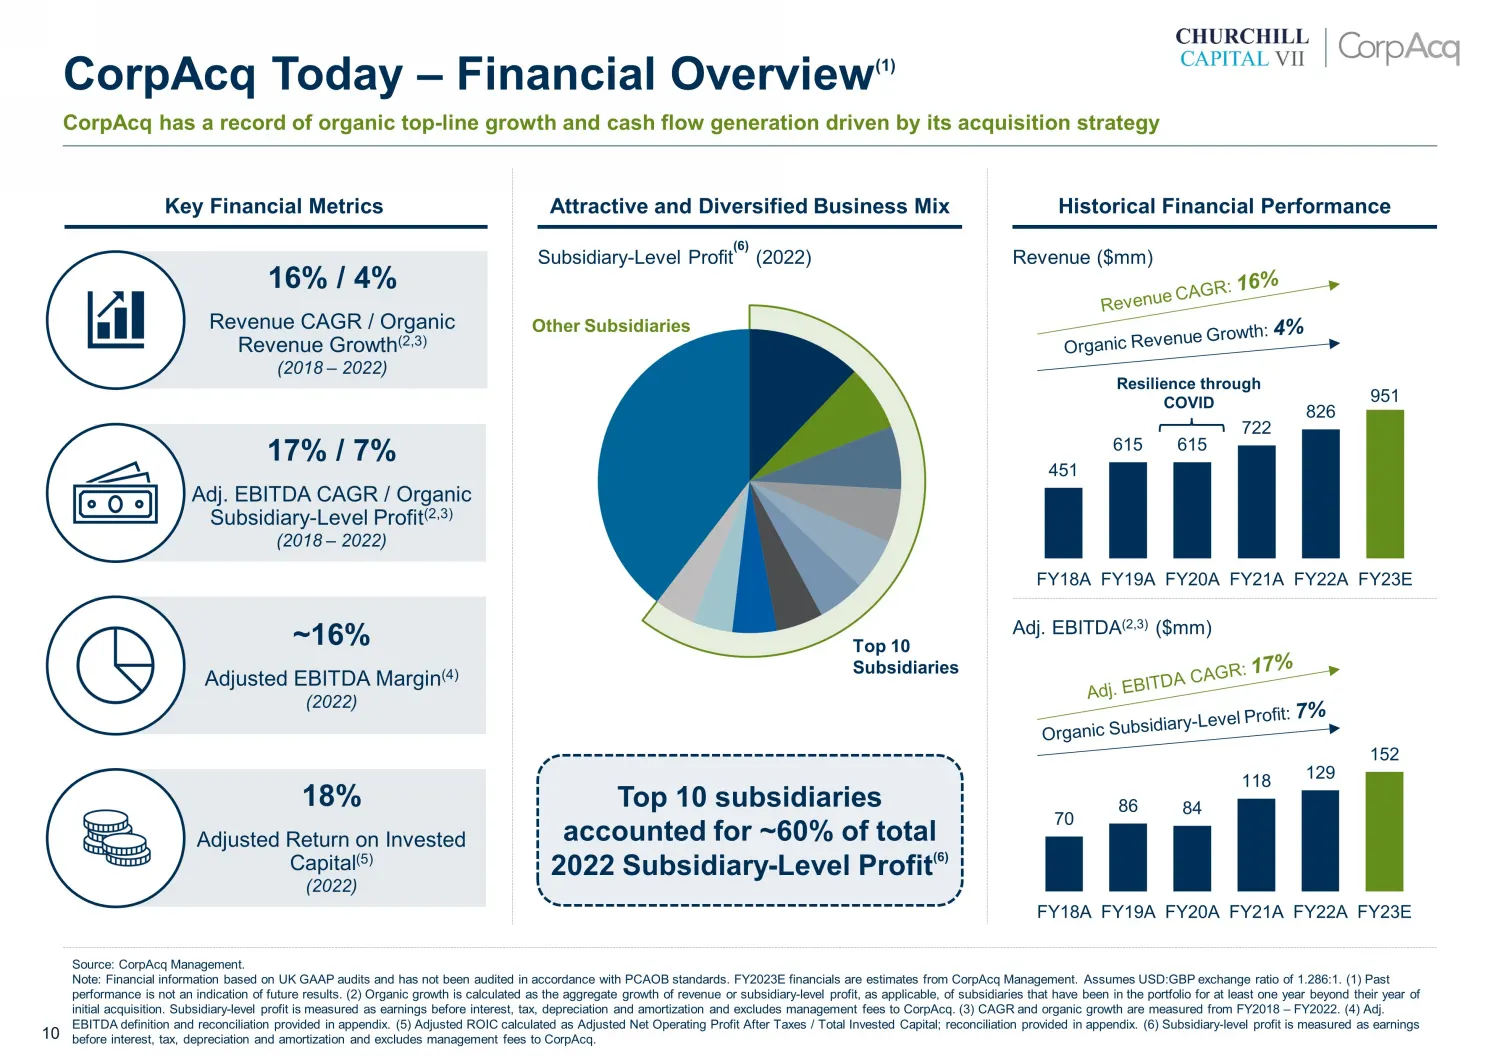
Slide 10: Revenue and Adjusted EBITDA growth FY18A-FY23E
10 451 615 615 722 826 951 FY18A FY19A FY20A FY21A FY22A FY23E ~16% Adjusted EBITDA Margin (4) (2022) 16% / 4% Revenue CAGR / Organic Revenue Growth (2,3) (2018 – 2022) 17% / 7% Adj. EBITDA CAGR / Organic Subsidiary - Level Profit (2,3) (2018 – 2022) 18% Adjusted Return on Invested Capital (5) (2022
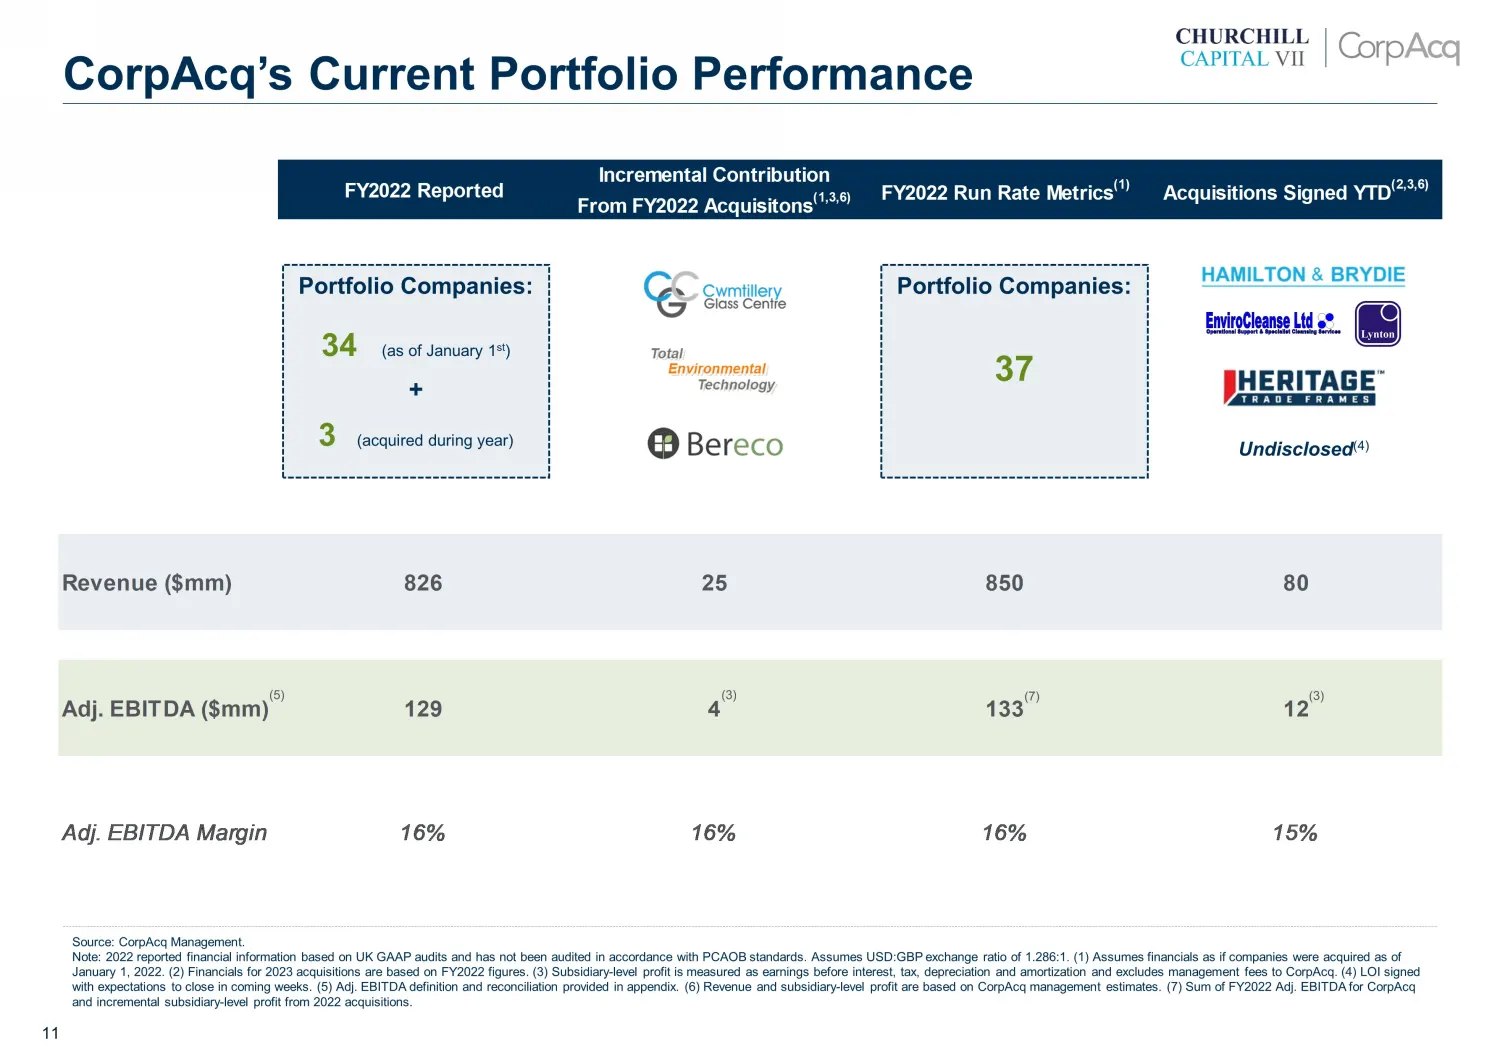
Slide 11: FY2022 Reported and Run Rate Metrics
11 FY2022 Reported Incremental Contribution From FY2022 Acquisitons (1,3,6) FY2022 Run Rate Metrics (1) Acquisitions Signed YTD (2,3,6) Revenue ($mm) 826 25 850 80 Adj. EBITDA ($mm) 129 4 133 12 Adj. EBITDA Margin 16% 16% 16% 15% Source: CorpAcq Management. Note: 2022 reported financial information
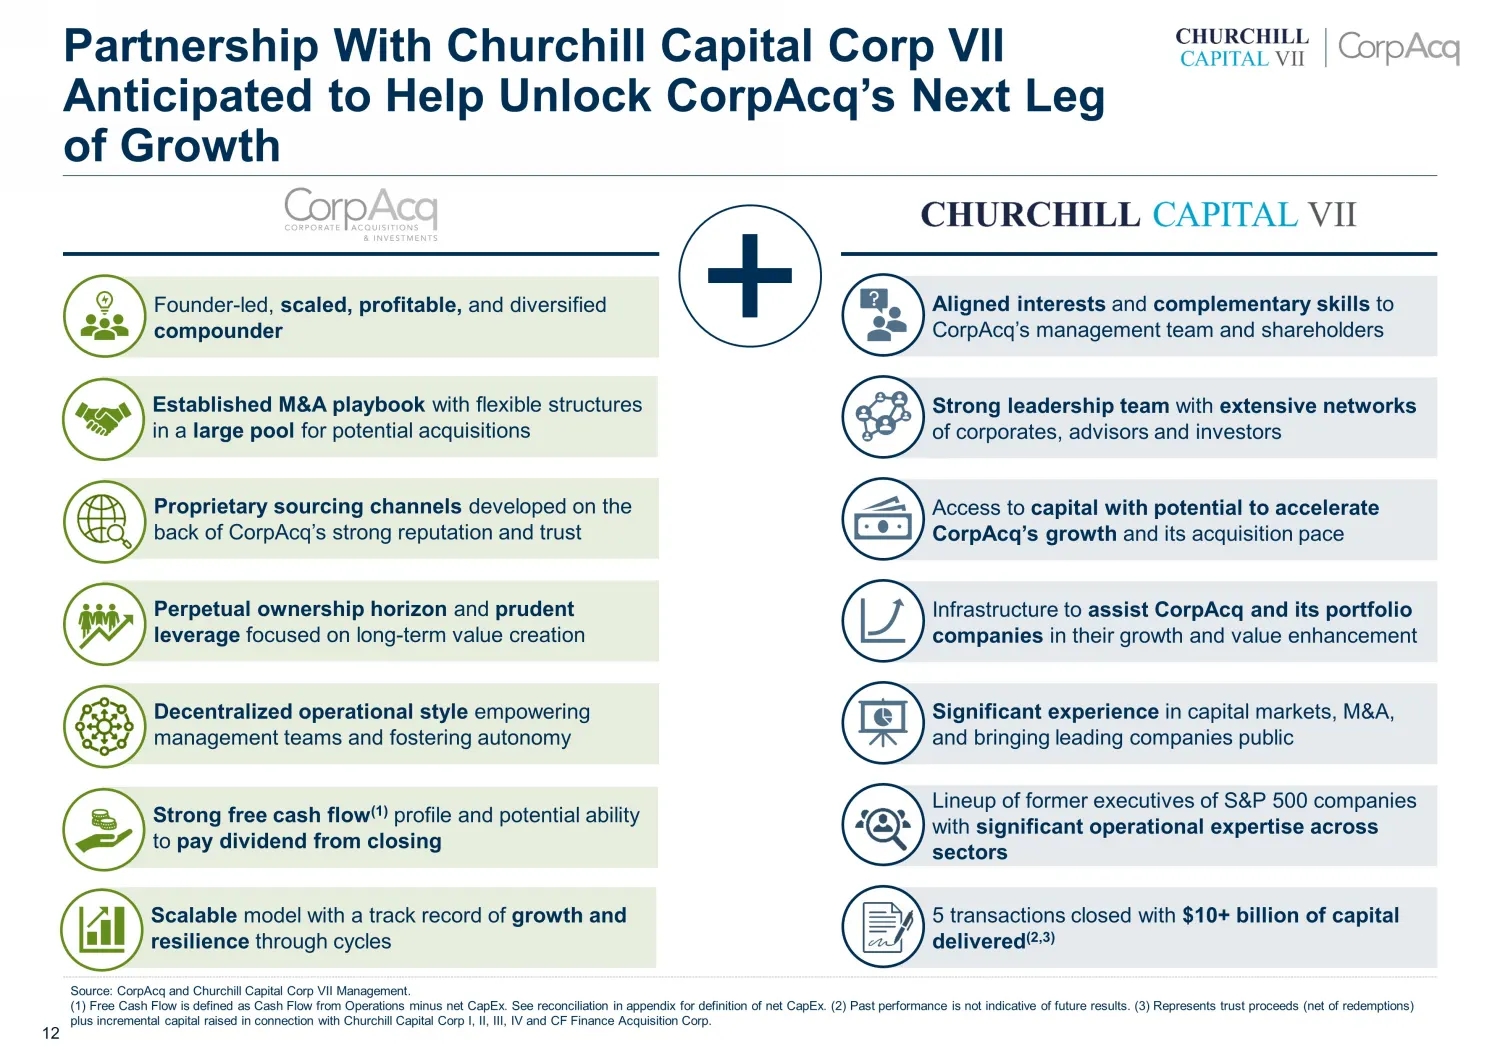
Slide 12: Founder-led, scaled, profitable, and diversified compounder
12 Founder - led, scaled, profitable, and diversified compounder 3 Strong free cash flow (1) profile and potential ability to pay dividend from closing 3 Established M&A playbook with flexible structures in a large pool for potential acquisitions 3 Decentralized operational style empowering manageme
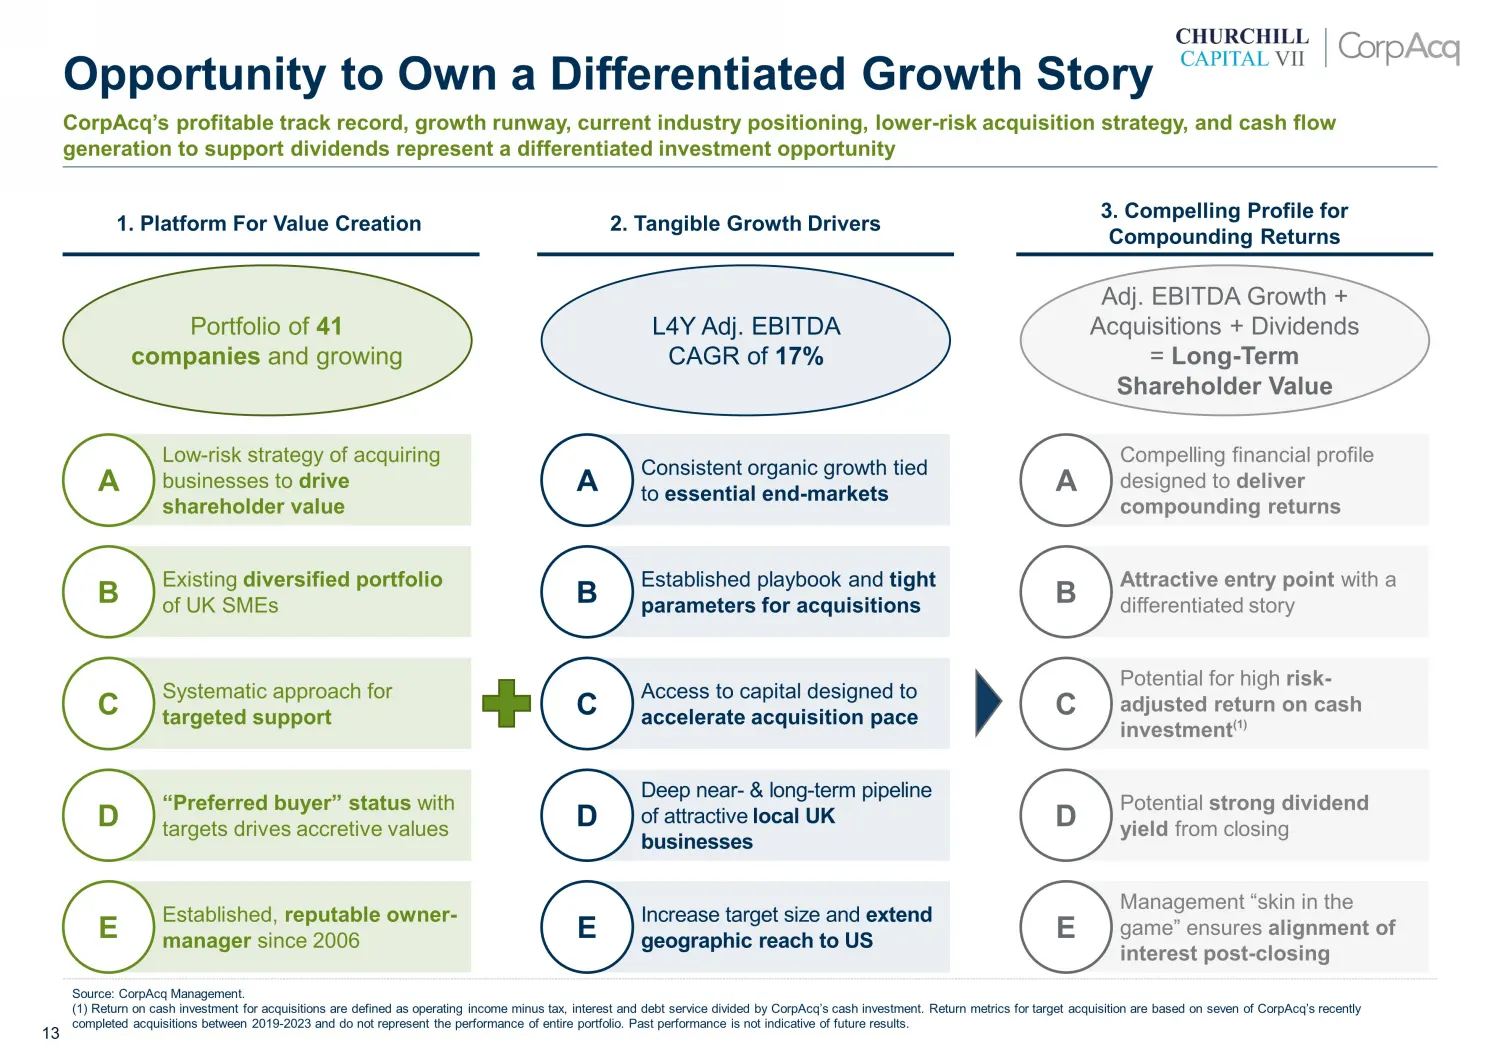
Slide 13: Compelling financial profile designed to deliver compounding returns
13 Compelling financial profile designed to deliver compounding returns Attractive entry point with a differentiated story Potential strong dividend yield from closing Potential fo r h igh risk - adjusted return on cash investment (1) Management “skin in the game” ensures alignment of interest post
Slide 14: Platform for value creation
14 1 Platform for value creation 01
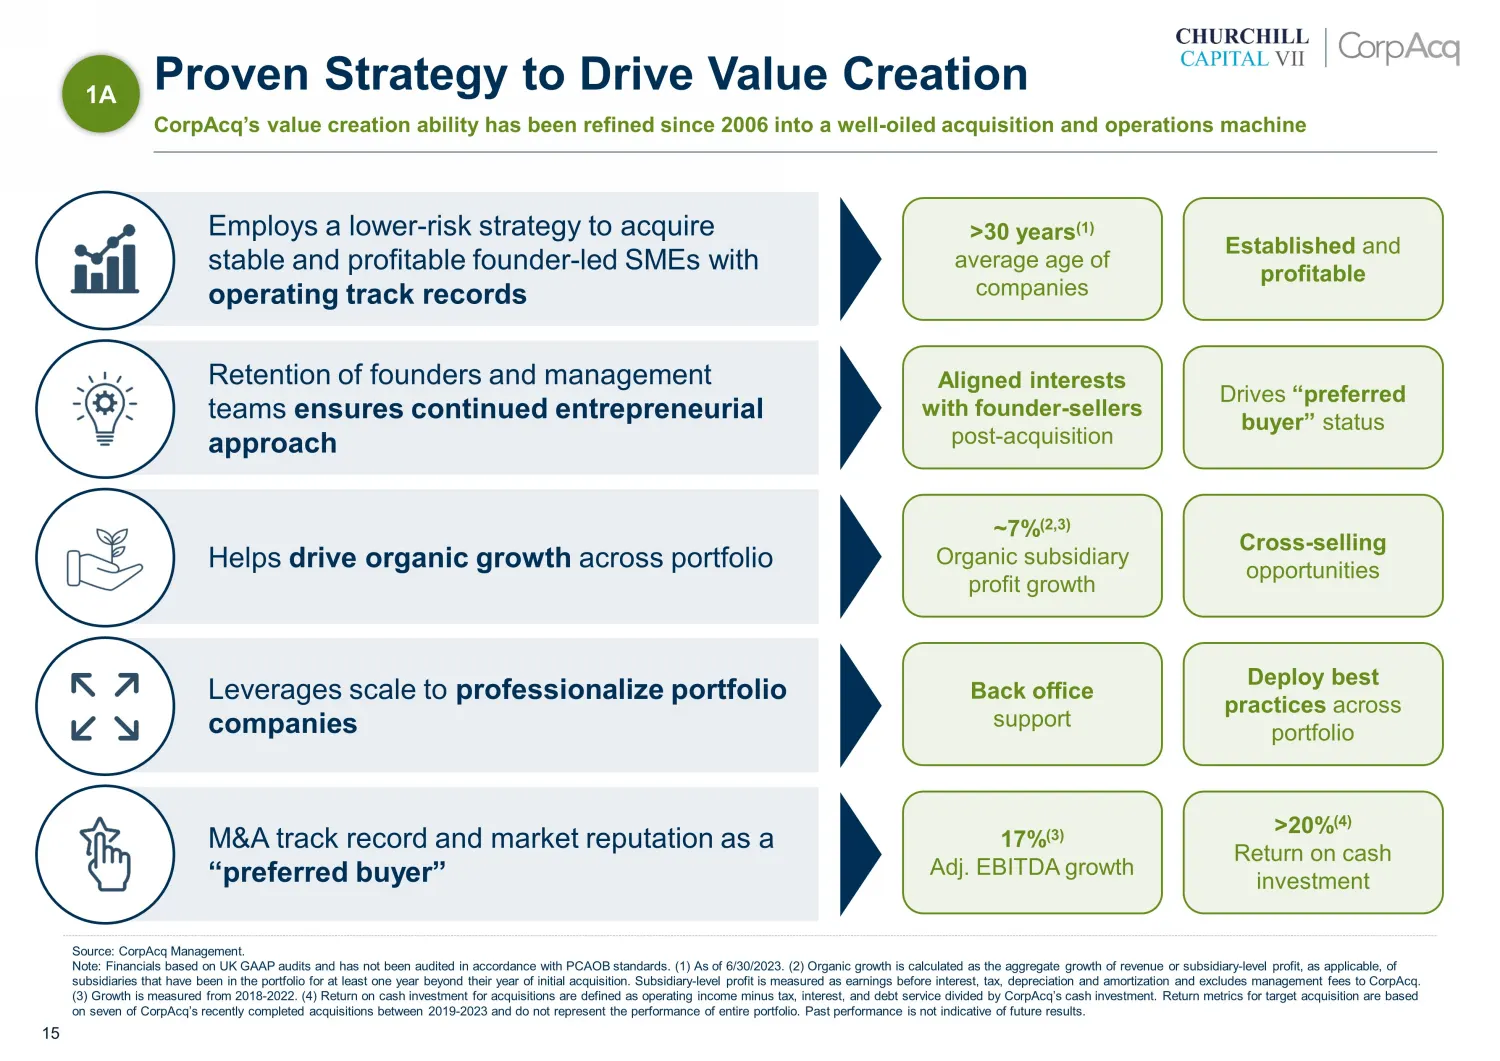
Slide 15: Source: CorpAcq Management. Note: Financials based on UK GAAP audits and has not been
15 Source: CorpAcq Management. Note: Financials based on UK GAAP audits and has not been audited in accordance with PCAOB standards. (1) As of 6/30/2023. (2 ) Organic growth is calculated as the aggregate growth of revenue or s ubsidiary - level profit , as applicable, of subsidiaries that have been
Slide 16: Diversified Portfolio of Strong UK SMEs
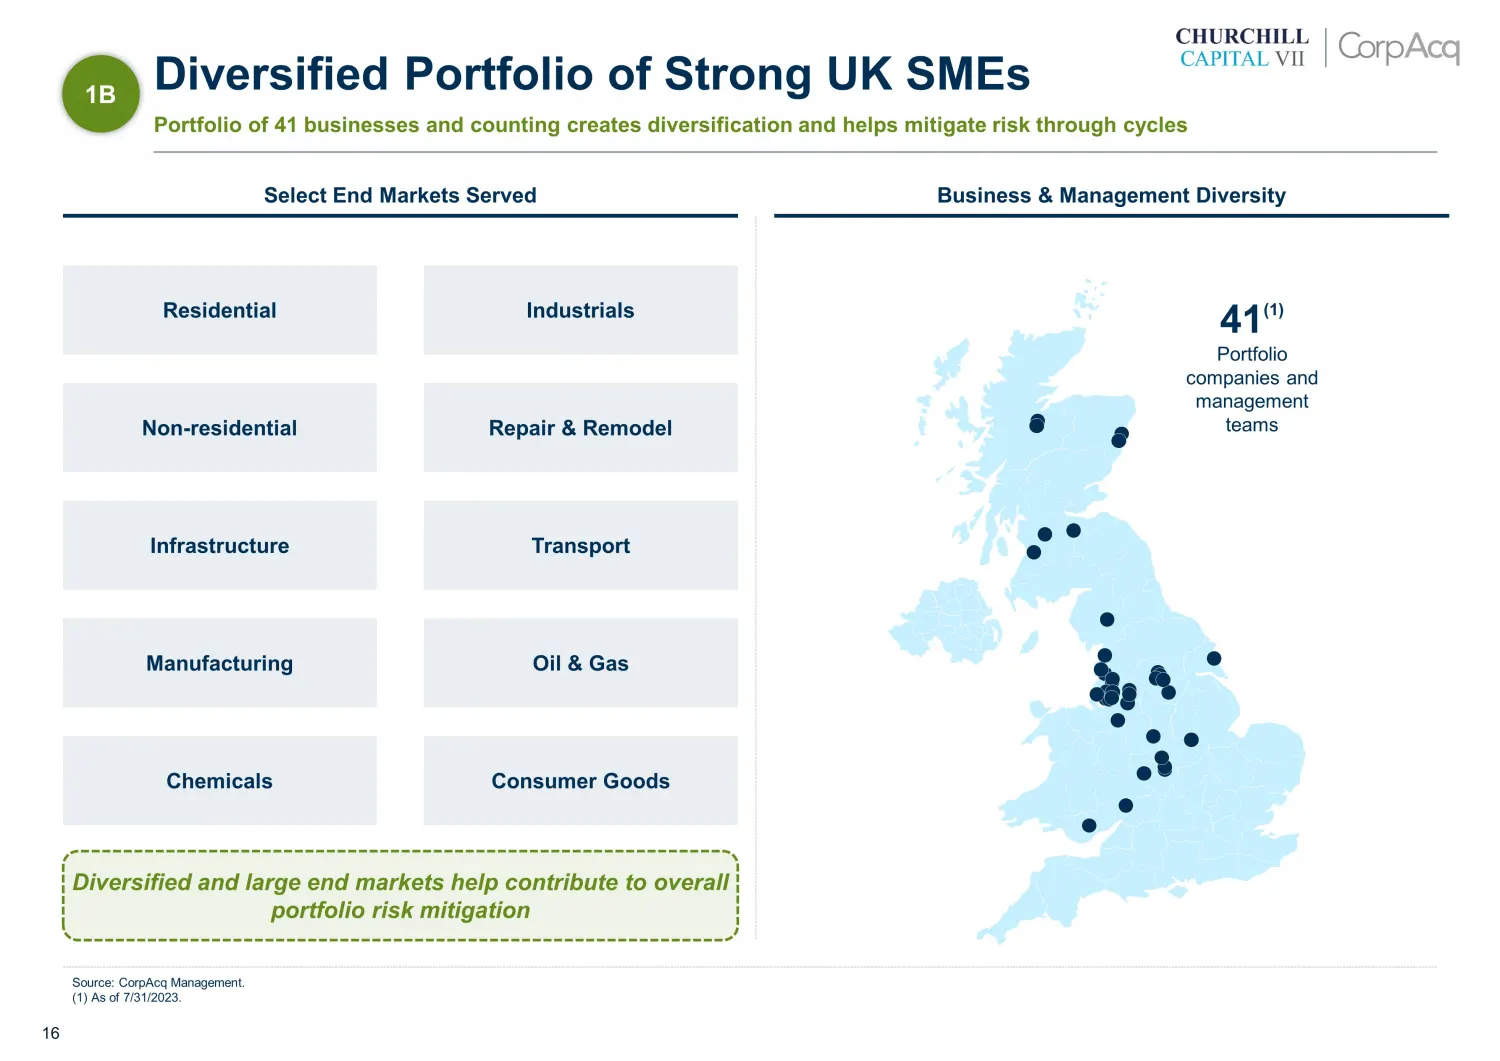
16 Source: CorpAcq Management. (1) As of 7/31/2023. Select End Markets Served 41 (1) Portfolio companies and management teams Diversified and large end markets help contribute to overall portfolio risk mitigation Business & Management Diversity Residential Infrastructure Non - residential Manufactur
Slide 17: CorpAcq Organizational Overview
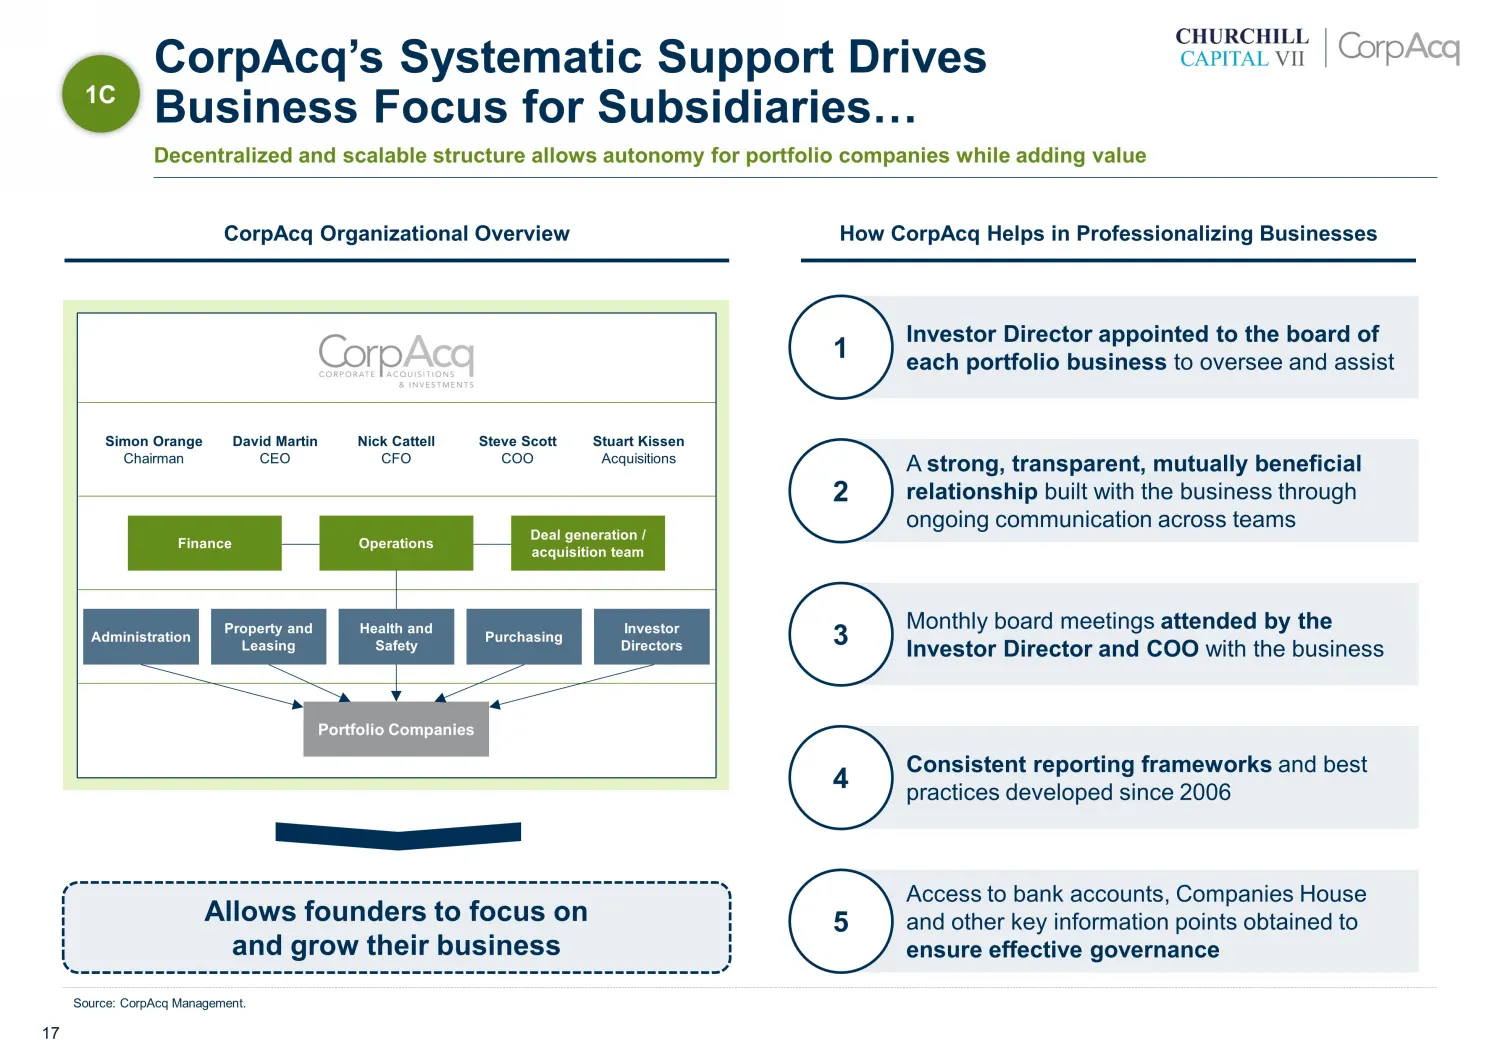
17 Consistent reporting frameworks and best practices developed since 2006 Allows founders to focus on and grow their business Simon Orange Chairman David Martin CEO Nick Cattell CFO Steve Scott COO Stuart Kissen Acquisitions Finance Operations Deal generation / acquisition team Administration Prope
Slide 18: Growth Levers and Targeted Support
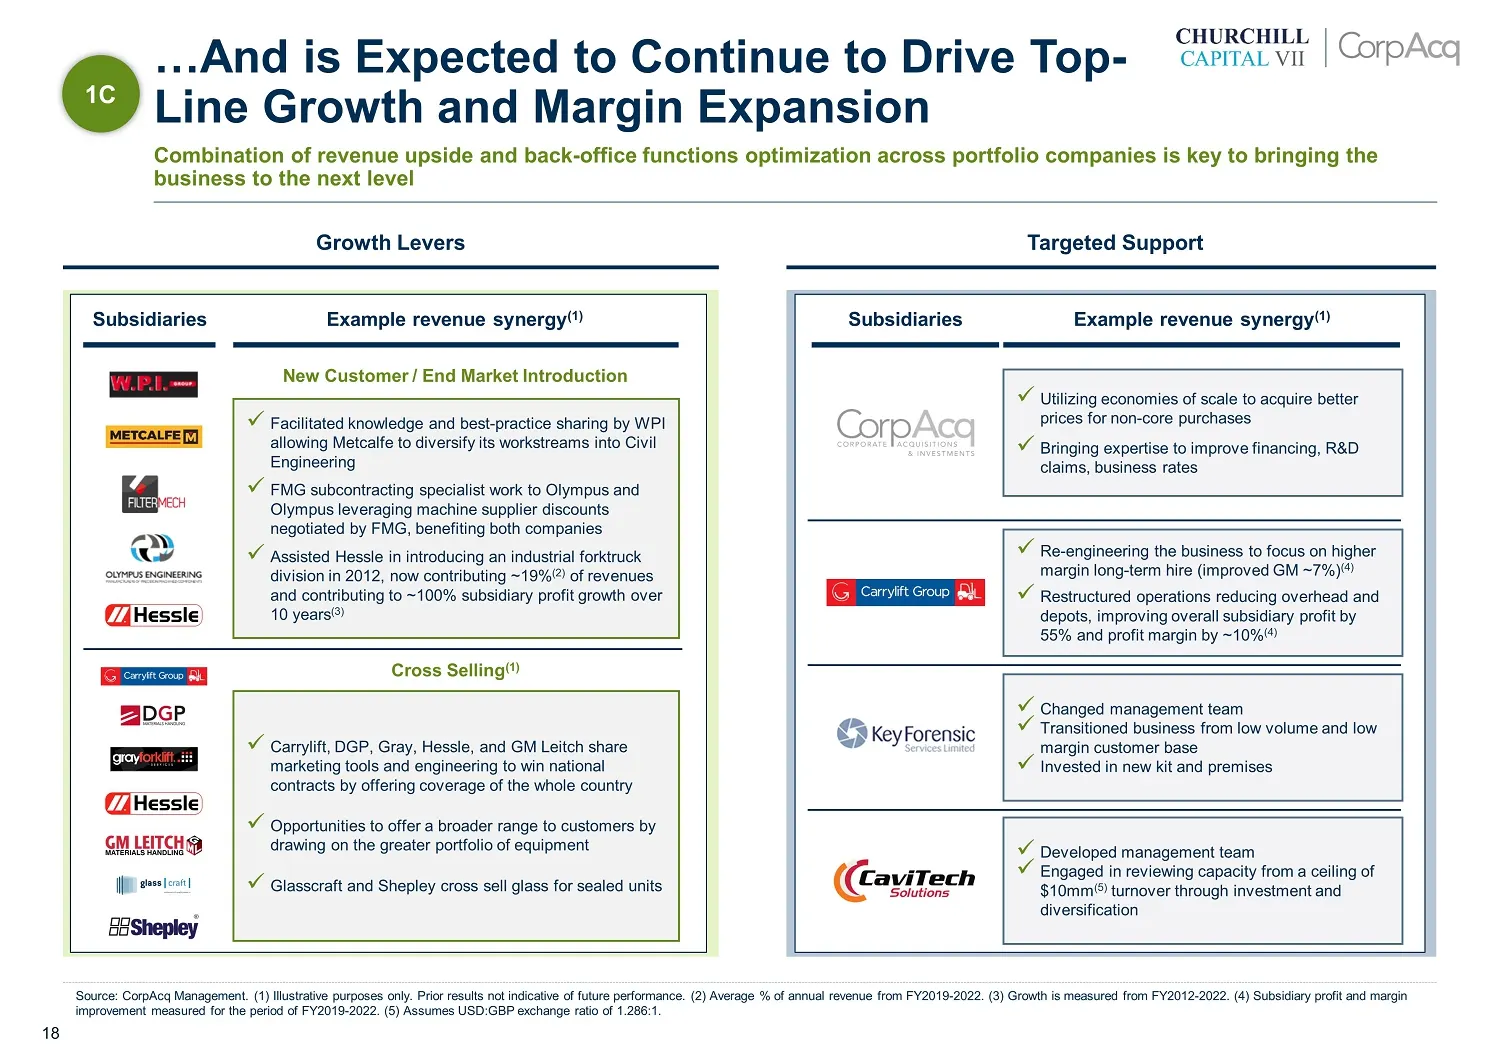
18 Subsidiaries Example revenue synergy (1) x Facilitated knowledge and best - practice sharing by WPI allowing Metcalfe to diversify its workstreams into Civil Engineering x FMG subcontracting specialist work to Olympus and Olympus leveraging machine supplier discounts negotiated by FMG, benefiting
Slide 19: Management retention across portfolio
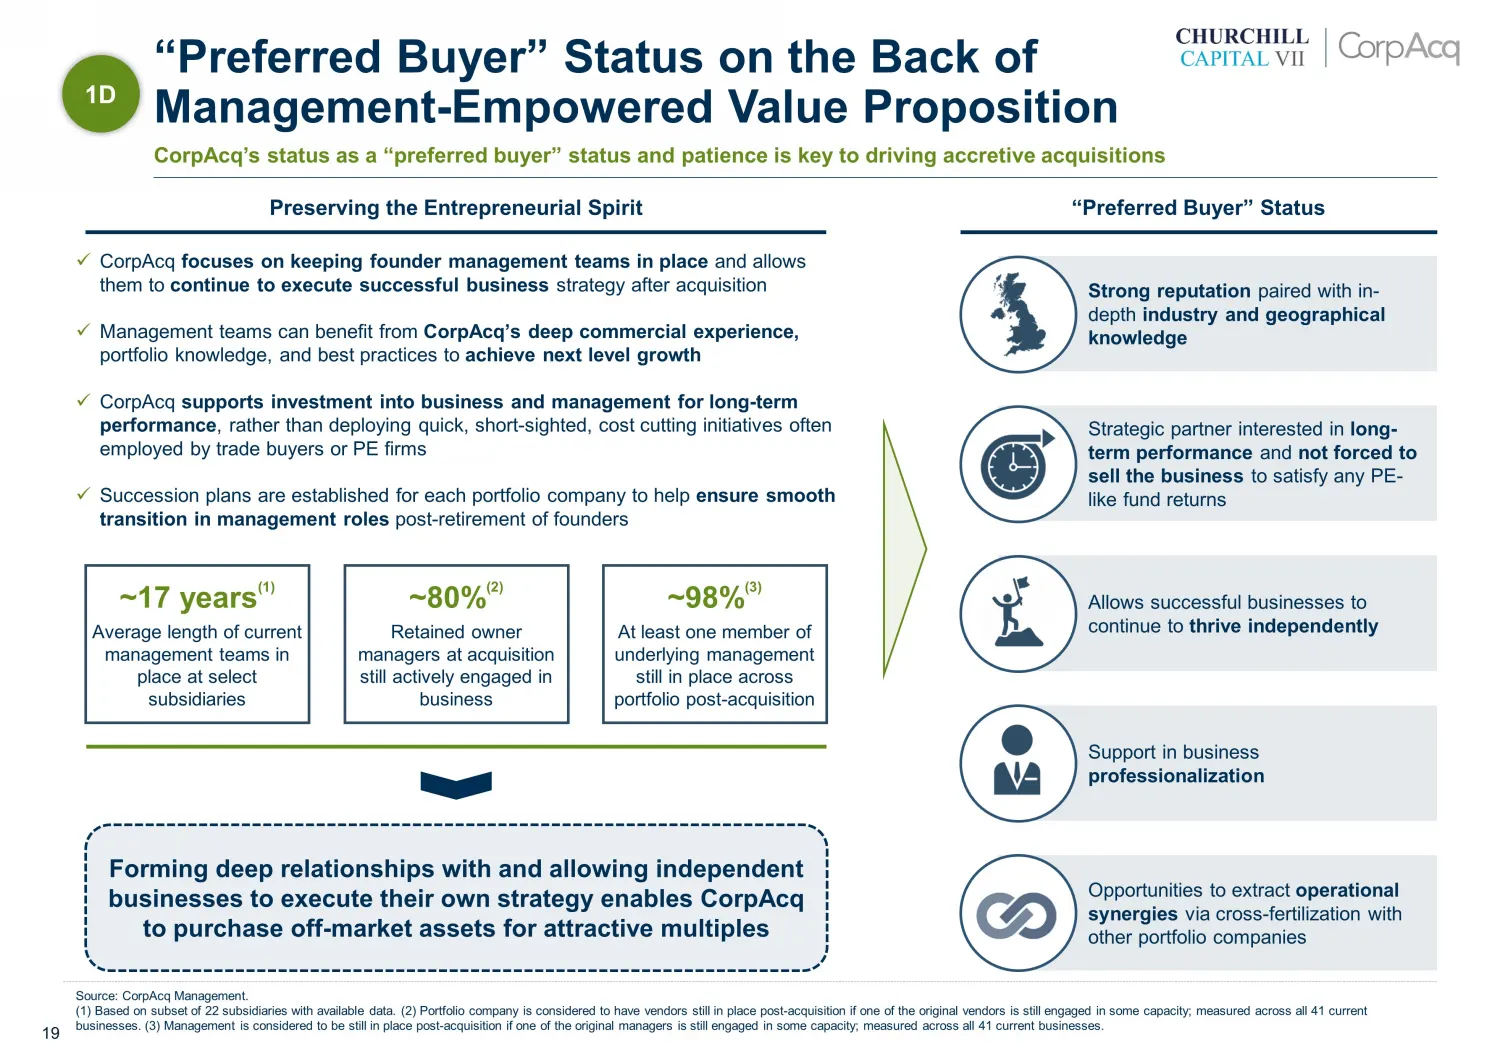
19 ~17 years (1) Average length of current management teams in place at select subsidiaries Forming deep relationships with and allowing independent businesses to execute their own strategy enables CorpAcq to purchase off - market assets for attractive multiples ~98% (3) At least one member of under
Slide 20: Executive leadership team
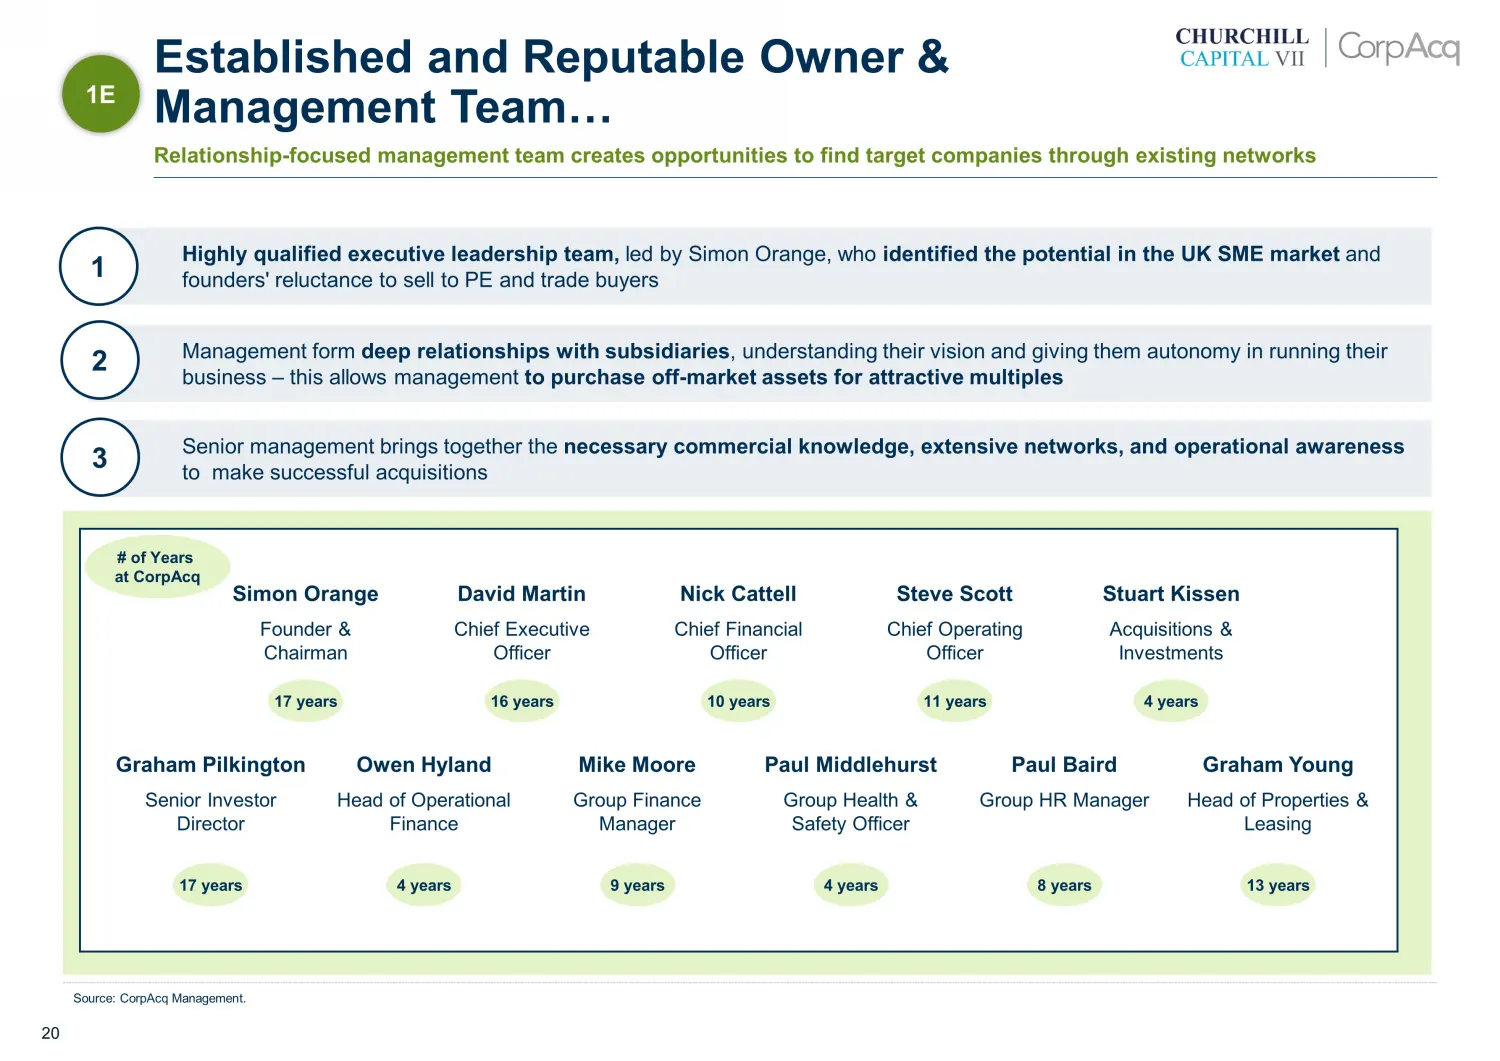
20 Management form deep relationships with subsidiaries , understanding their vision and giving them autonomy in running their business – this allows management to purchase off - market assets for attractive multiples Highly qualified executive leadership team, led by Simon Orange, who identified th
Slide 21: History of Portfolio Build-Up
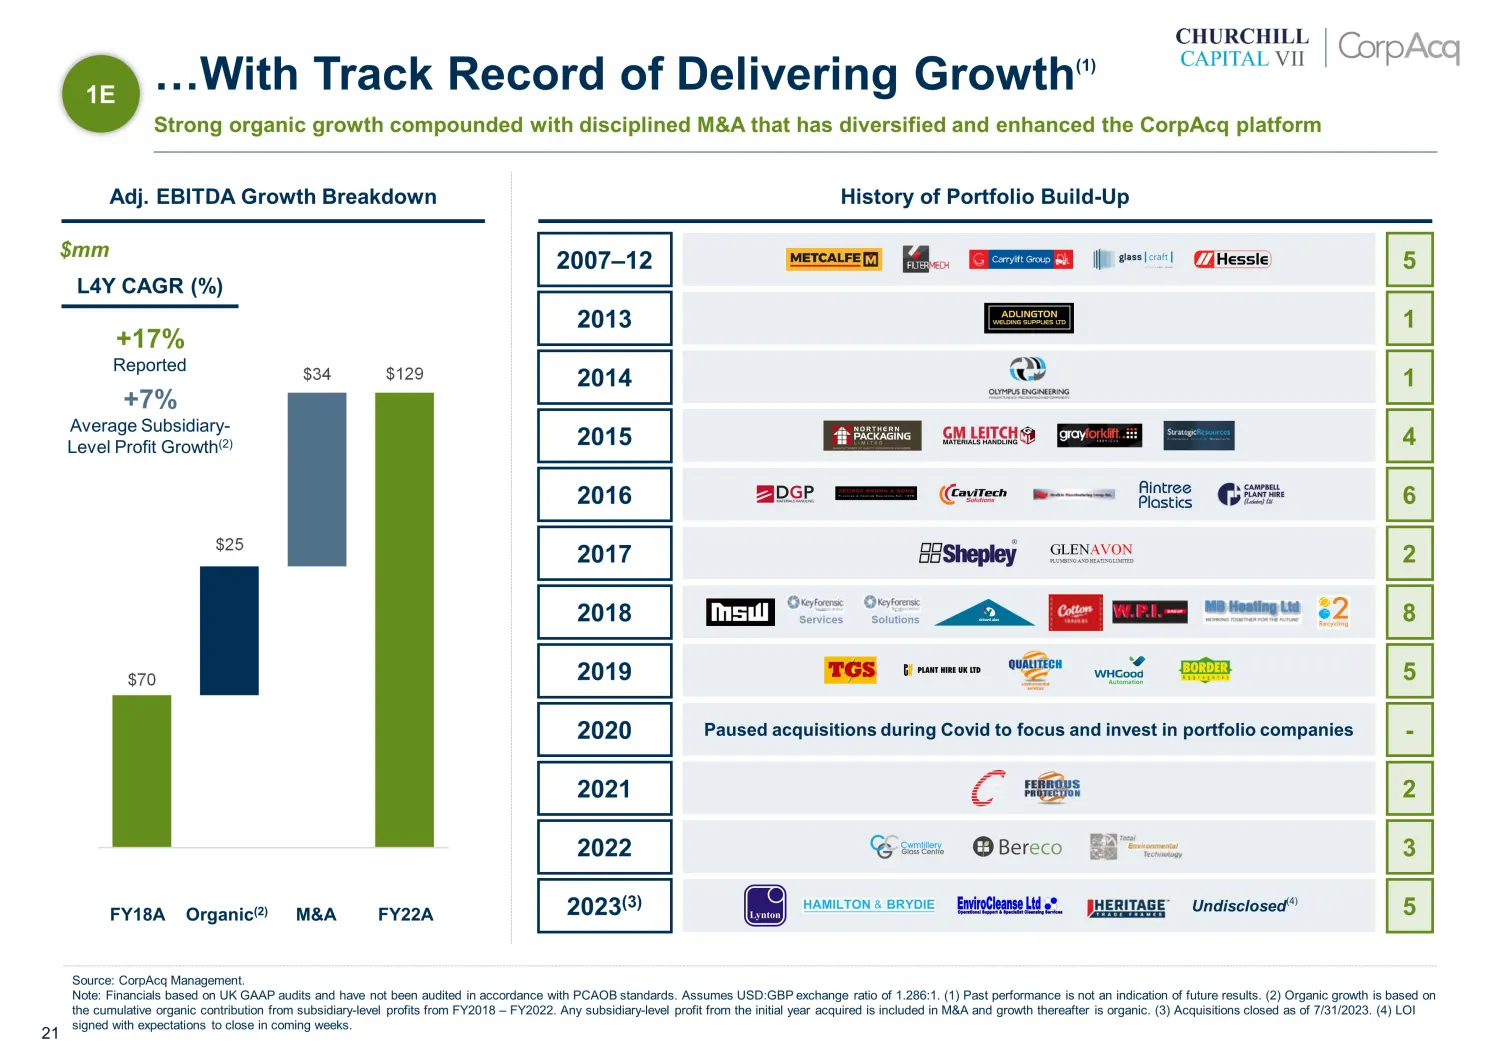
21 $70 $129 $25 $34 $ mm L4Y CAGR (%) +17% Reported + 7 % Average Subsidiary - Level Profit Growth (2) Adj. EBITDA Growth Breakdown History of Portfolio Build - Up Source: CorpAcq Management. Note: Financials based on UK GAAP audits and have not been audited in accordance with PCAOB standards. Assum
Slide 22: Tangible upside levers
22 2 Tangible upside levers 02
Slide 23: Multiple Opportunities to Drive Future Growth
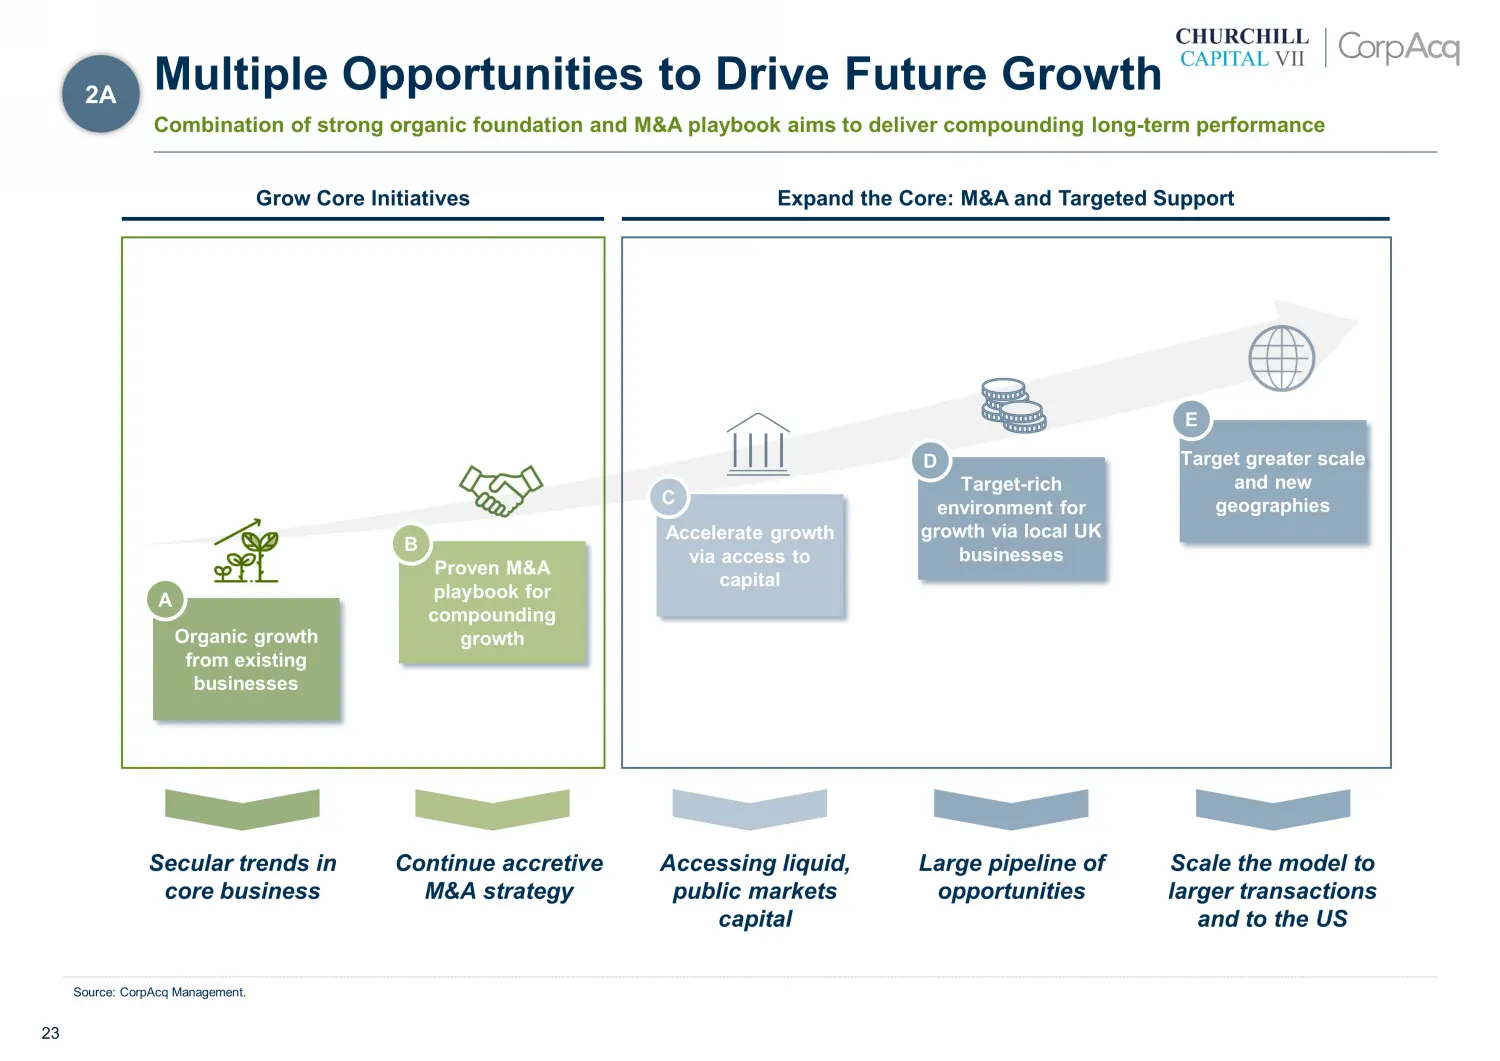
23 Accelerate growth via access to capital Target greater scale and new geographies Secular trends in core business Continue accretive M&A strategy Large pipeline of opportunities Scale the model to larger transactions and to the US Organic growth from existing businesses A E C Proven M&A playbook f
Slide 24: Favorable UK Industry Trends in CorpAcq's End-Markets
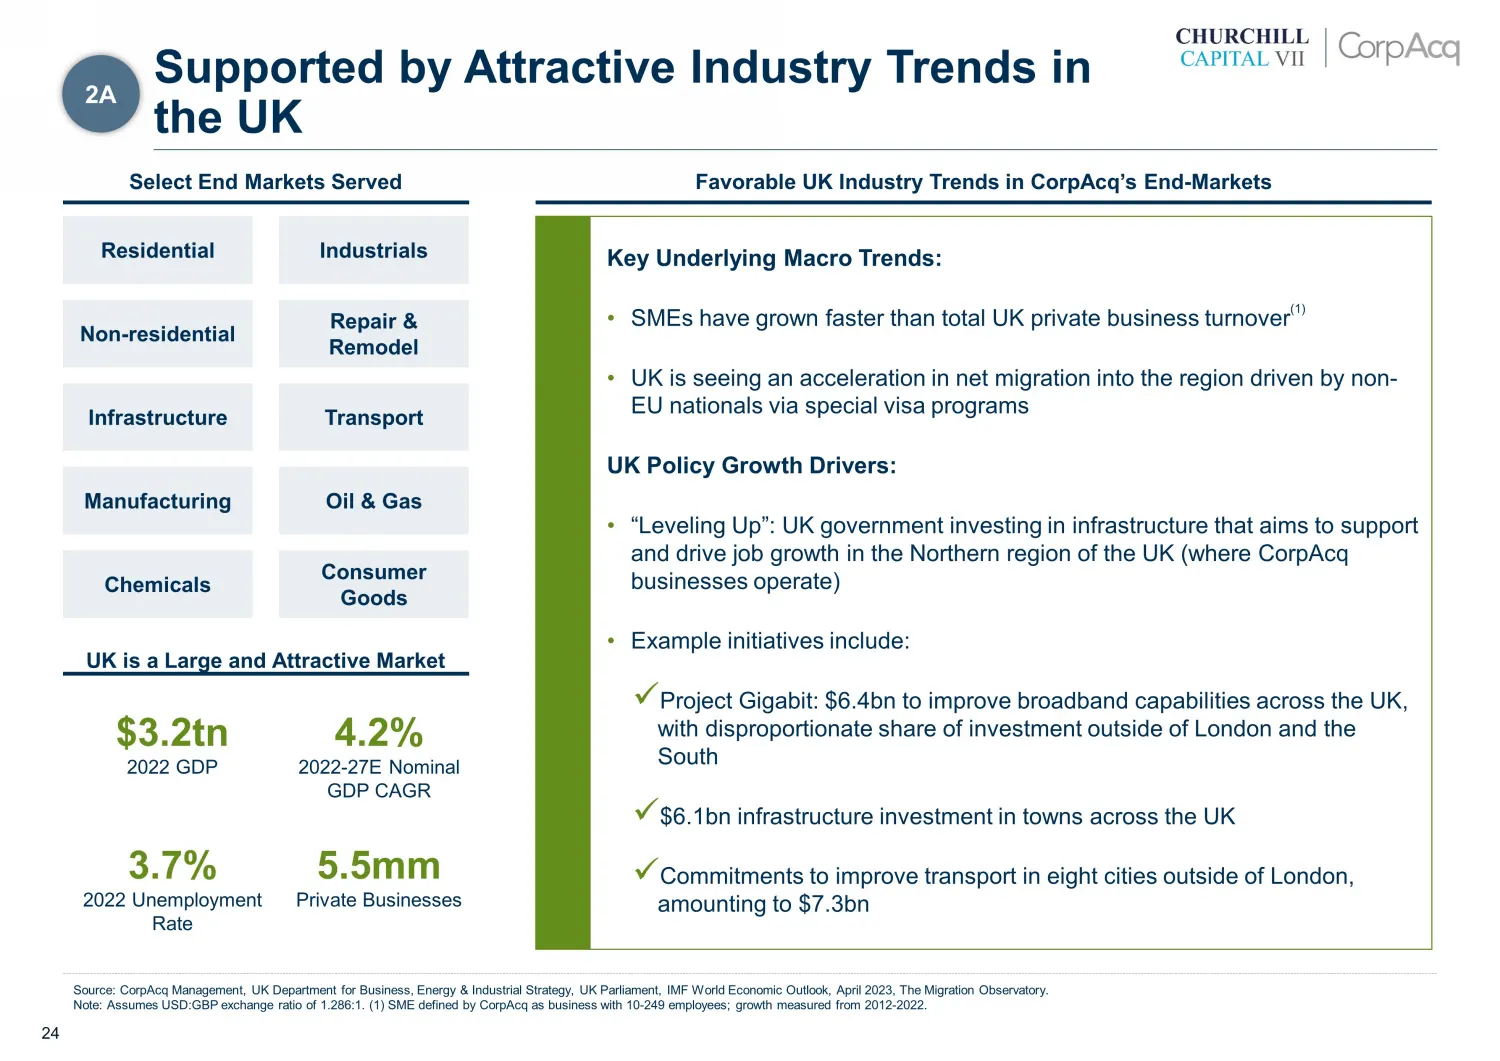
24 Favorable UK Industry Trends in CorpAcq ’s End - Markets Select End Markets Served UK is a Large and Attractive Market Key Underlying Macro Trends: • SMEs have grown faster than total UK private business turnover (1) • UK is seeing an acceleration in net migration into the region driven by non -
Slide 25: Established Acquisition Strategy and Criteria
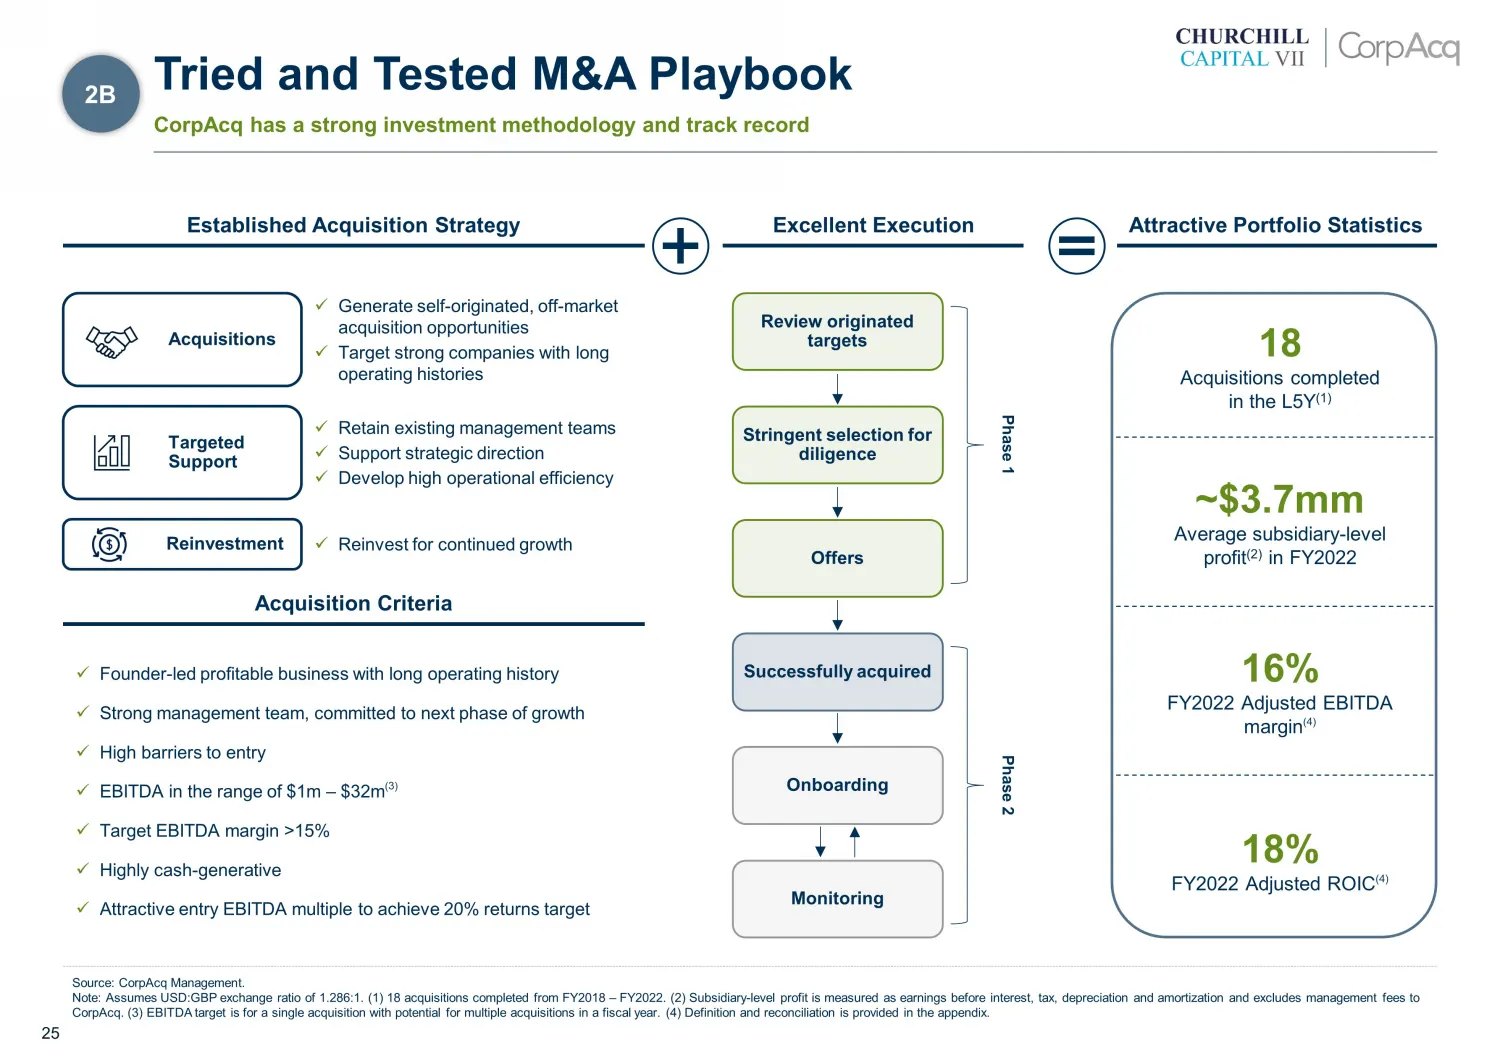
25 Acquisition Criteria x Founder - led profitable business with long operating history x Strong management team, committed to next phase of growth x High barriers to entry x EBITDA in the range of $ 1m – $ 32m (3) x Target EBITDA margin >15% x Highly cash - generative x Attractive entry EBITDA mult
Slide 26: Capital Raised in Churchill Transaction
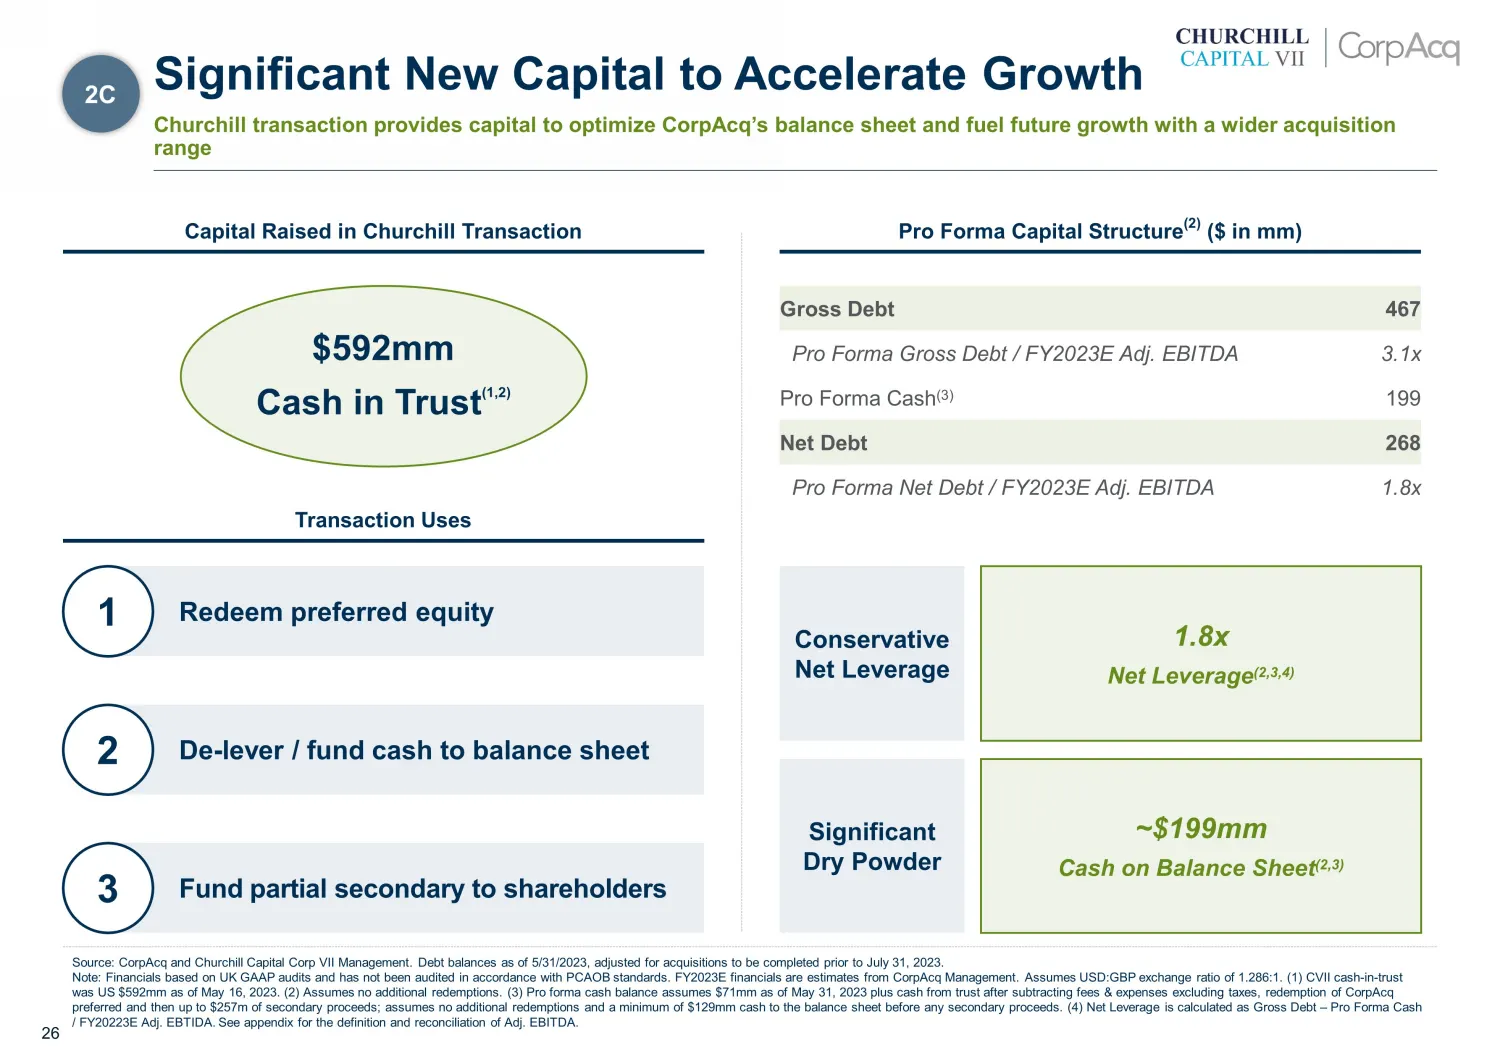
26 Capital Raised in Churchill Transaction Pro Forma Capital Structure (2) ( $ in mm) $ 592mm Cash in Trust (1,2) Transaction Uses Redeem preferred equity 1 De - lever / fund cash to balance sheet 2 Fund partial secondary to shareholders 3 Gross Debt 467 Pro Forma Gross Debt / FY2023E Adj. EBITDA 3.
Slide 27: UK Total Addressable Market and Pipeline
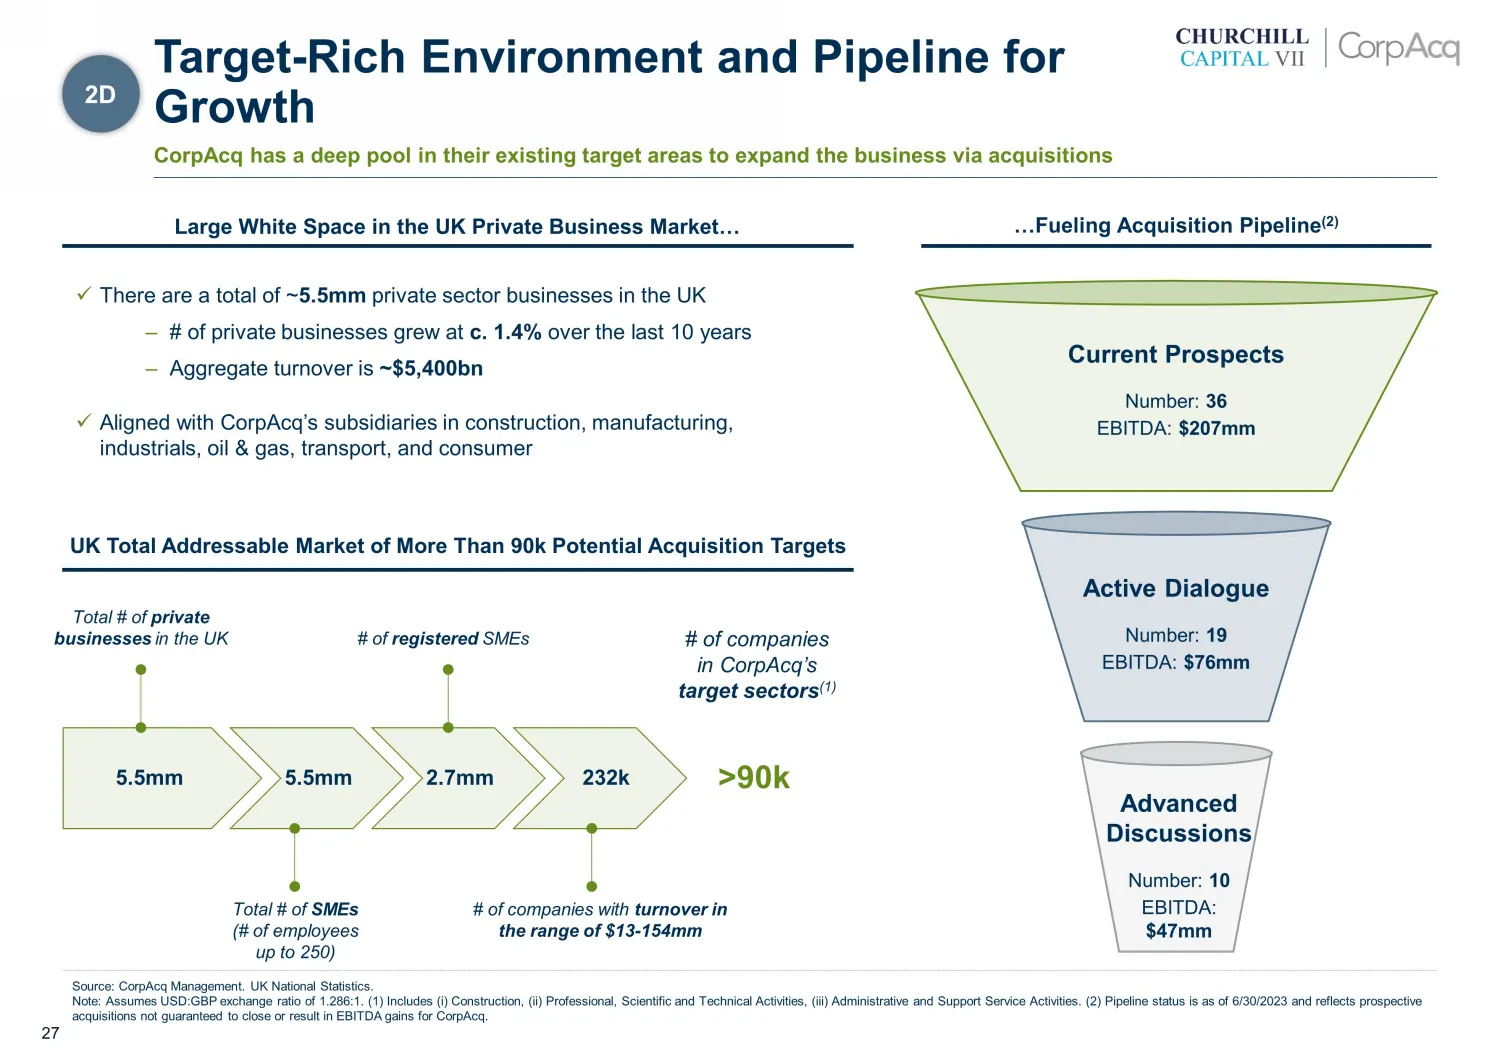
27 >90k 2.7mm x There are a total of ~ 5.5mm private sector businesses in the UK – # of private businesses grew at c. 1.4% over the last 10 years – Aggregate turnover is ~ $ 5,400bn x Aligned with CorpAcq’s subsidiaries in construction, manufacturing, industrials, oil & gas, transport, and consumer
Slide 28: Opportunity Set Over Time
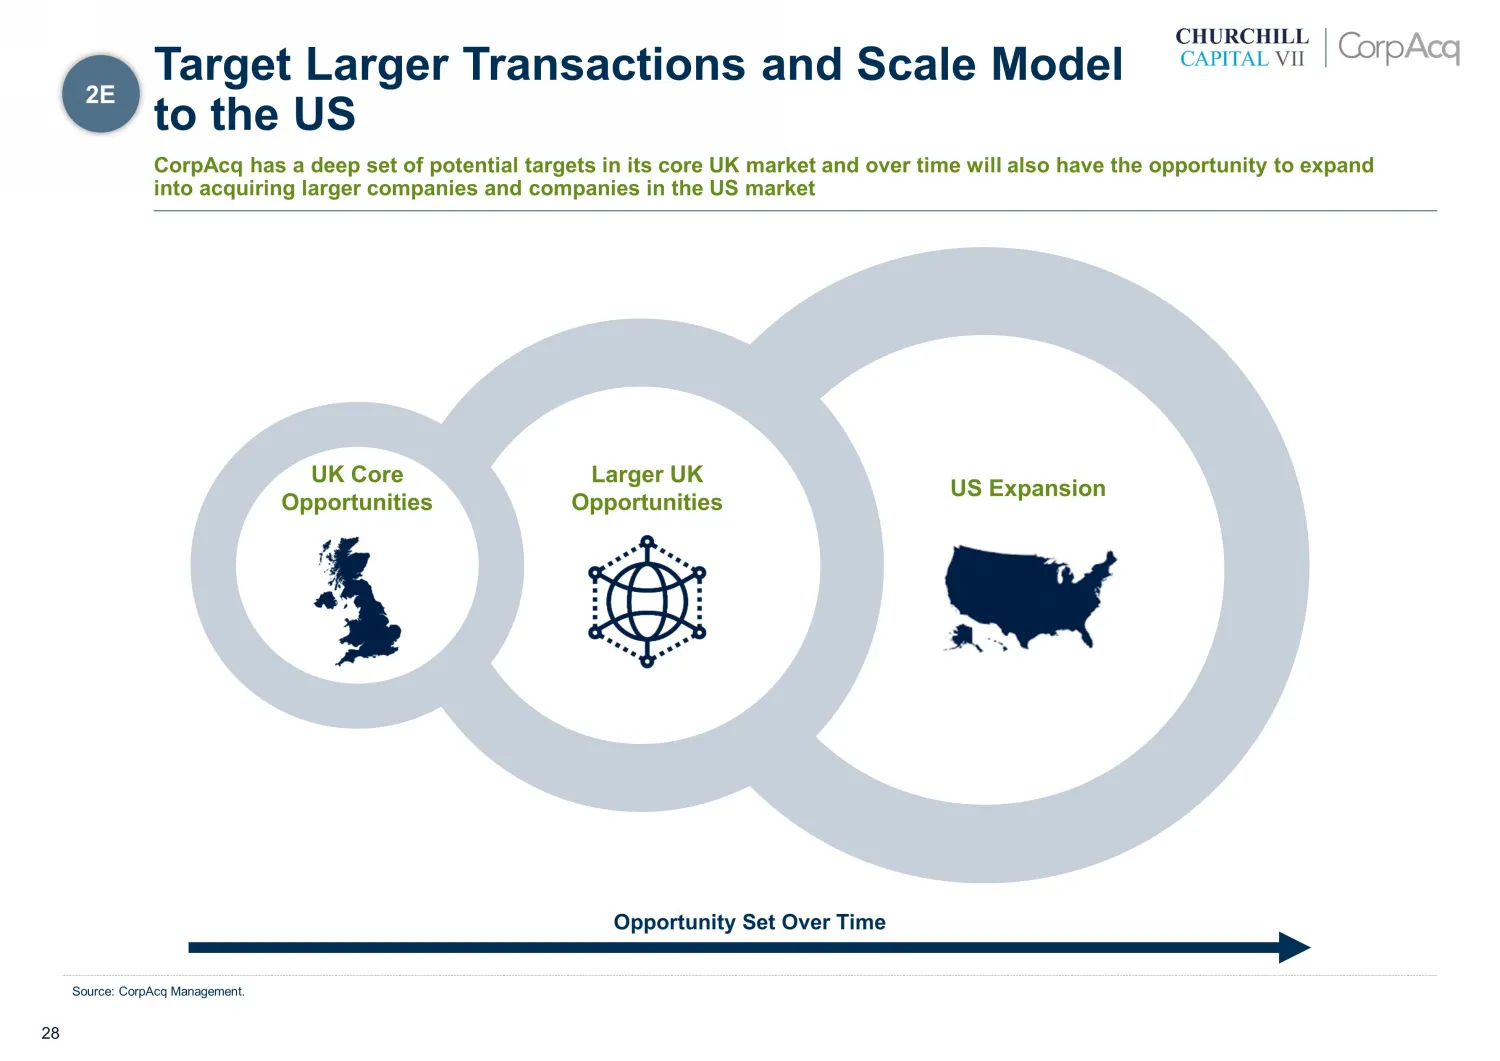
28 Opportunity Set Over Time Larger UK Opportunities US Expansion UK Core Opportunities Source: CorpAcq Management. CorpAcq has a deep set of potential targets in its core UK market and over time will also have the opportunity to expand into acquiring larger companies and companies in the US market
Slide 29: Profile for compounding returns
29 3 Profile for compounding returns 03
Slide 30: Compelling Financial Profile For Compounding
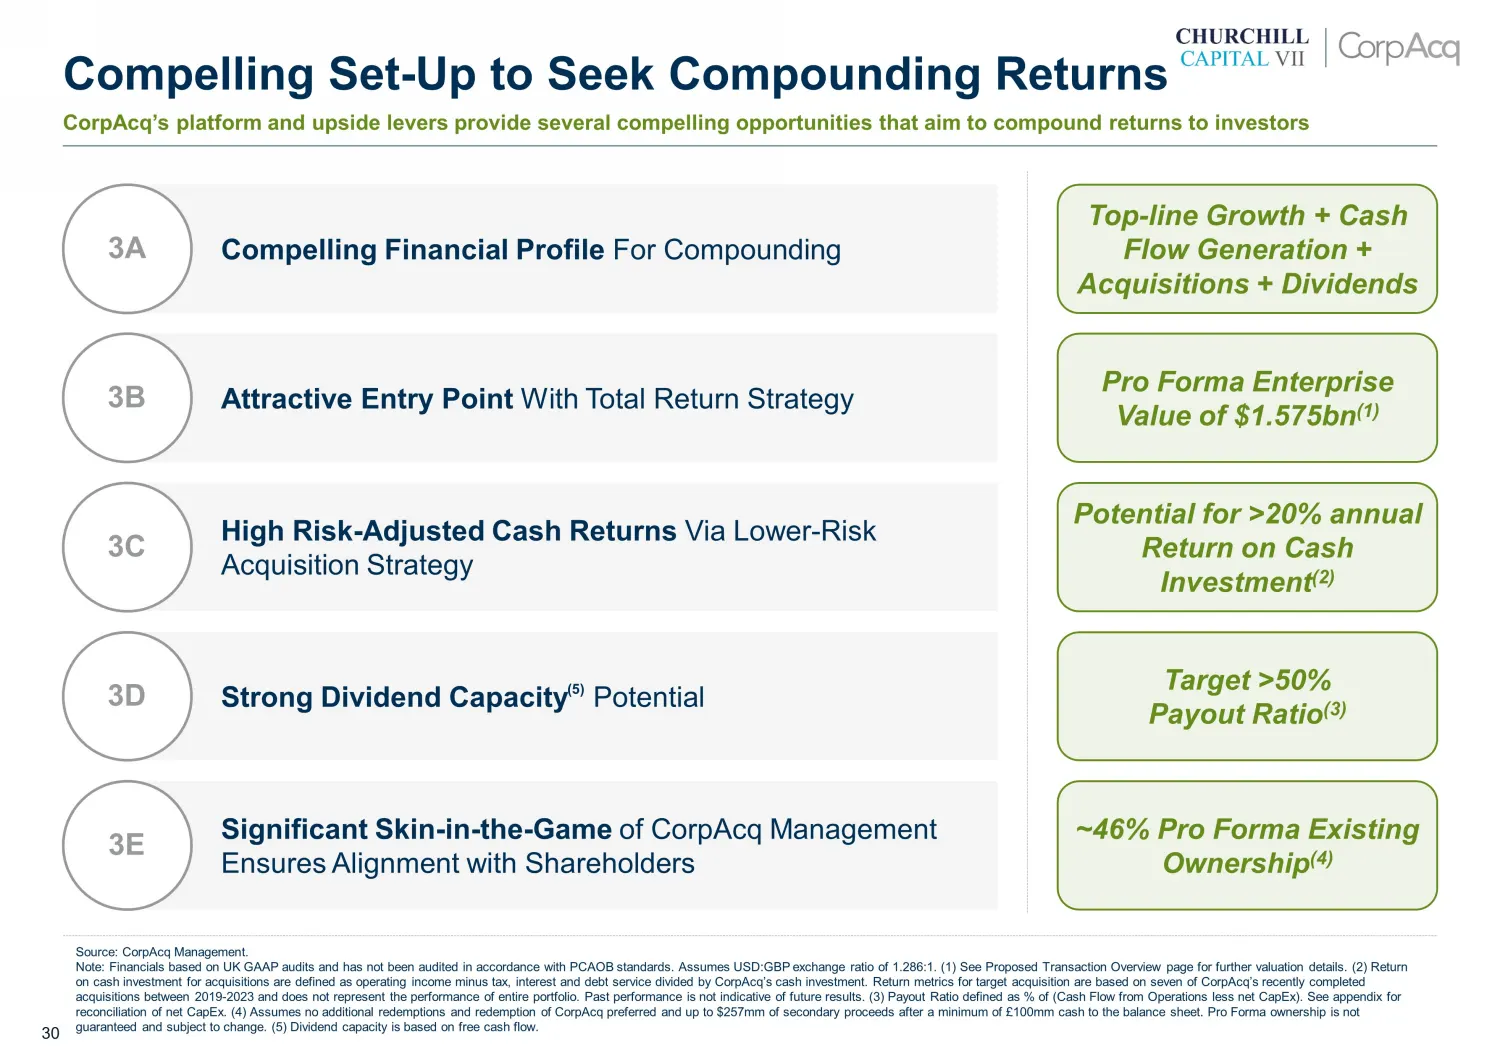
30 Pro Forma Enterprise Value of $ 1.575bn (1) Attractive Entry Point With Total Return Strategy Strong Dividend Capacity (5) Potential High Risk - Adjusted Cash Returns Via Lower - Risk Acquisition Strategy Significant Skin - in - the - Game of CorpAcq Management Ensures Alignment with Shareholders
Slide 31: Historical Roadmap for Achieving Compounding Free Cash Flow & Dividend Growth
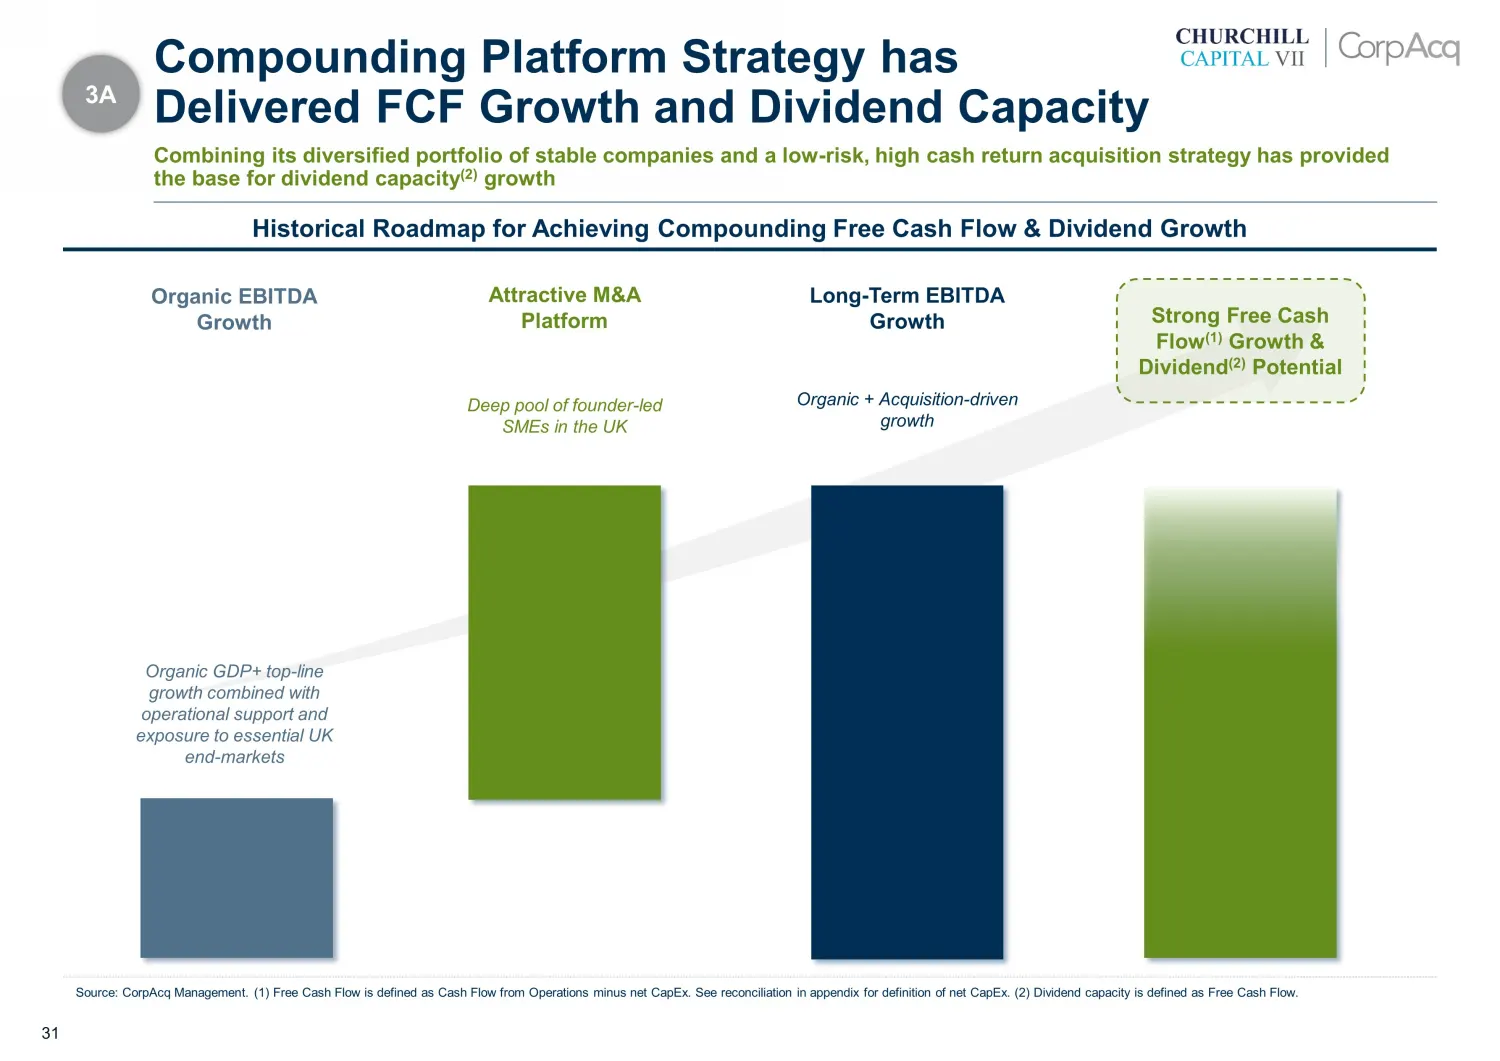
31 Historical Roadmap for Achieving Compounding Free Cash Flow & Dividend Growth Organic GDP+ top - line growth combined with operational support and exposure to essential UK end - markets Organic + Acquisition - driven growth Source: CorpAcq Management. (1) Free Cash Flow is defined as Cash Flow fr
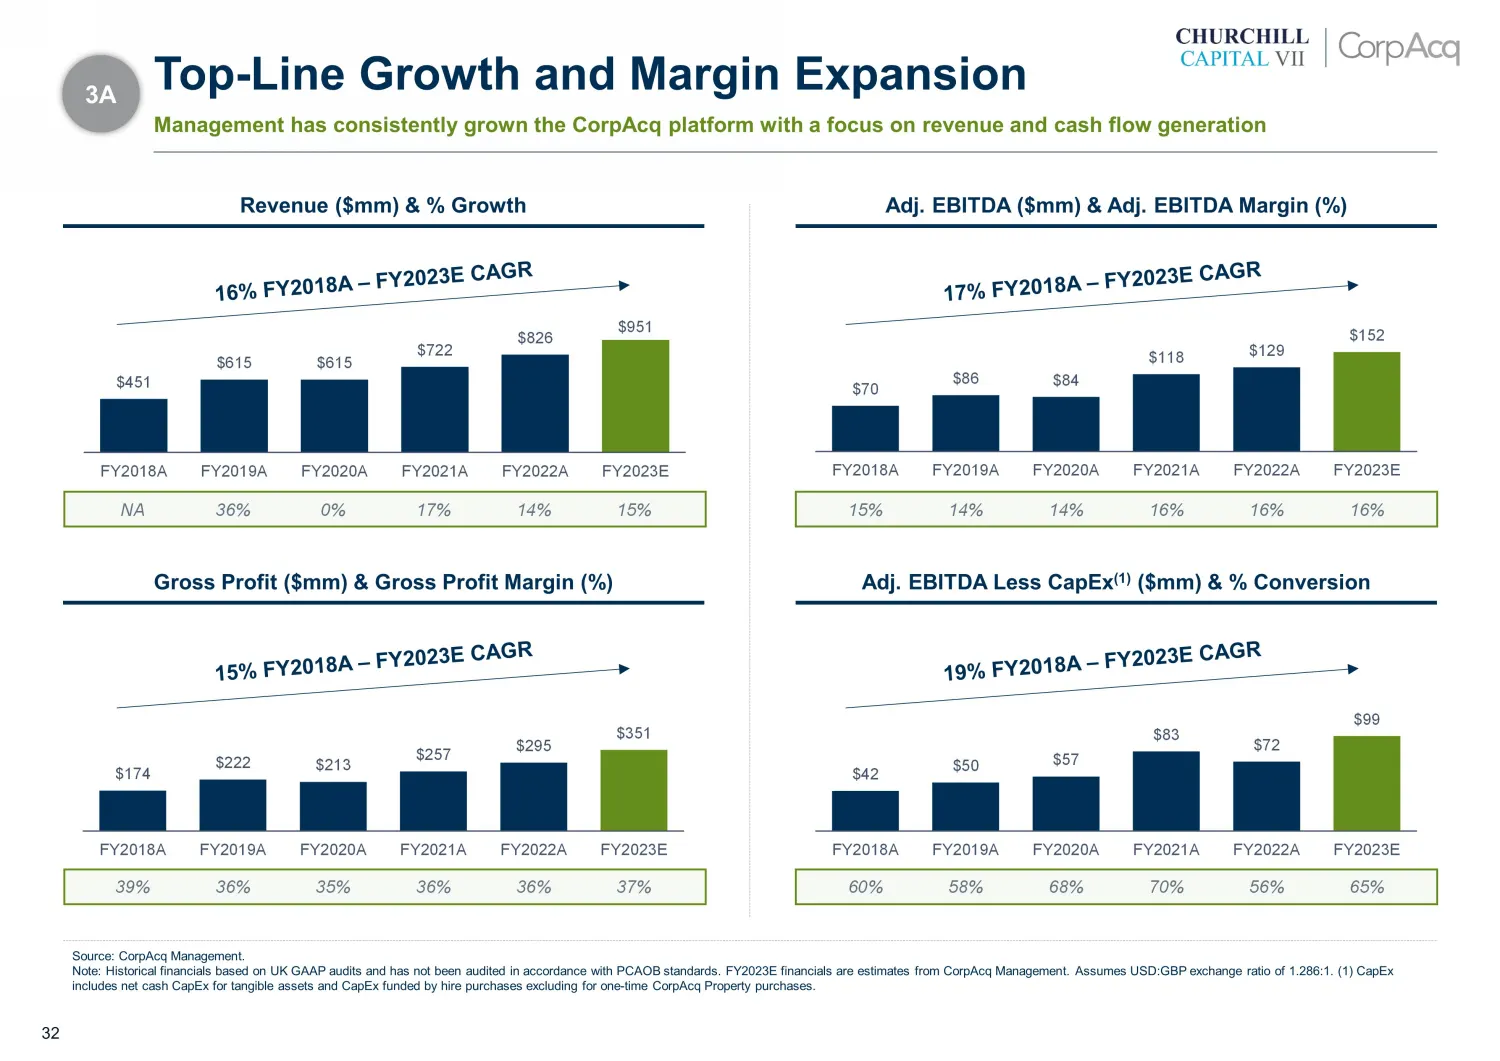
Slide 32: Revenue, Gross Profit, Adj. EBITDA and EBITDA less CapEx
32 $174 $222 $213 $257 $295 $351 FY2018A FY2019A FY2020A FY2021A FY2022A FY2023E 39% 36% 35% 36% 36% 37% 15% 14% 14% 16% 16% 16% $70 $86 $84 $118 $129 $152 FY2018A FY2019A FY2020A FY2021A FY2022A FY2023E NA 36% 0% 17% 14% 15% $451 $615 $615 $722 $826 $951 FY2018A FY2019A FY2020A FY2021A FY2022A FY20
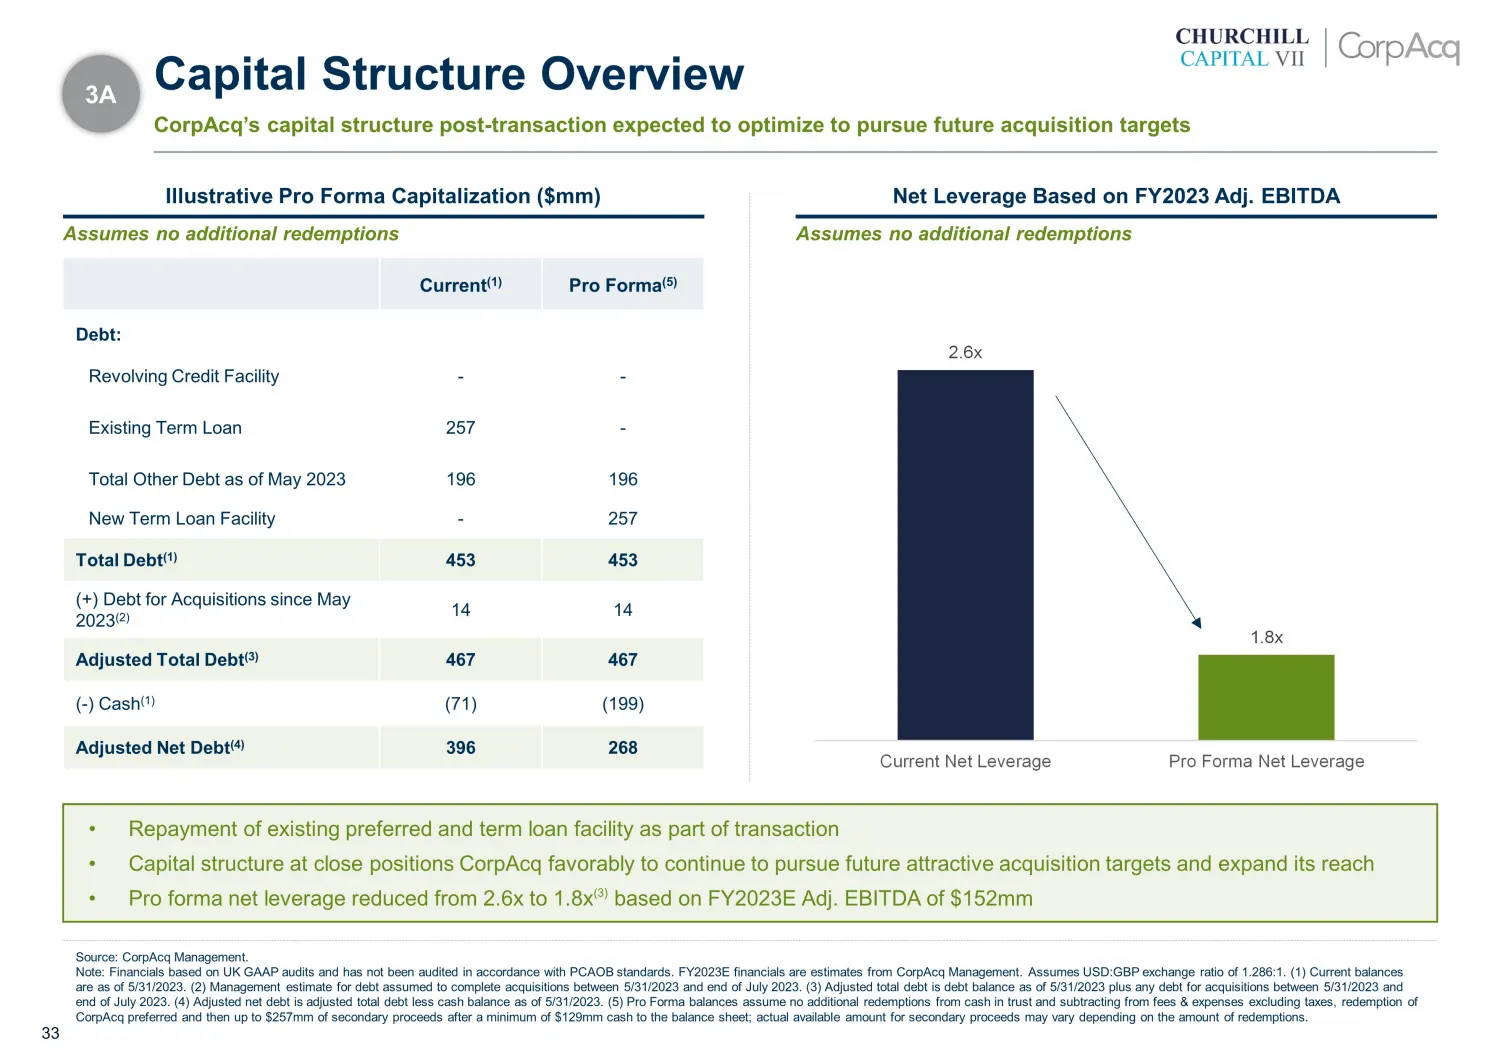
Slide 33: Illustrative Pro Forma Capitalization
33 Illustrative Pro Forma Capitalization ( $ mm) Net Leverage Based on FY2023 Adj. EBITDA Current (1) Pro Forma (5) Debt: Revolving Credit Facility - - Existing Term Loan 257 - Total Other Debt as of May 2023 196 196 New Term Loan Facility - 257 Total Debt (1) 453 453 (+) Debt for Acquisitions since
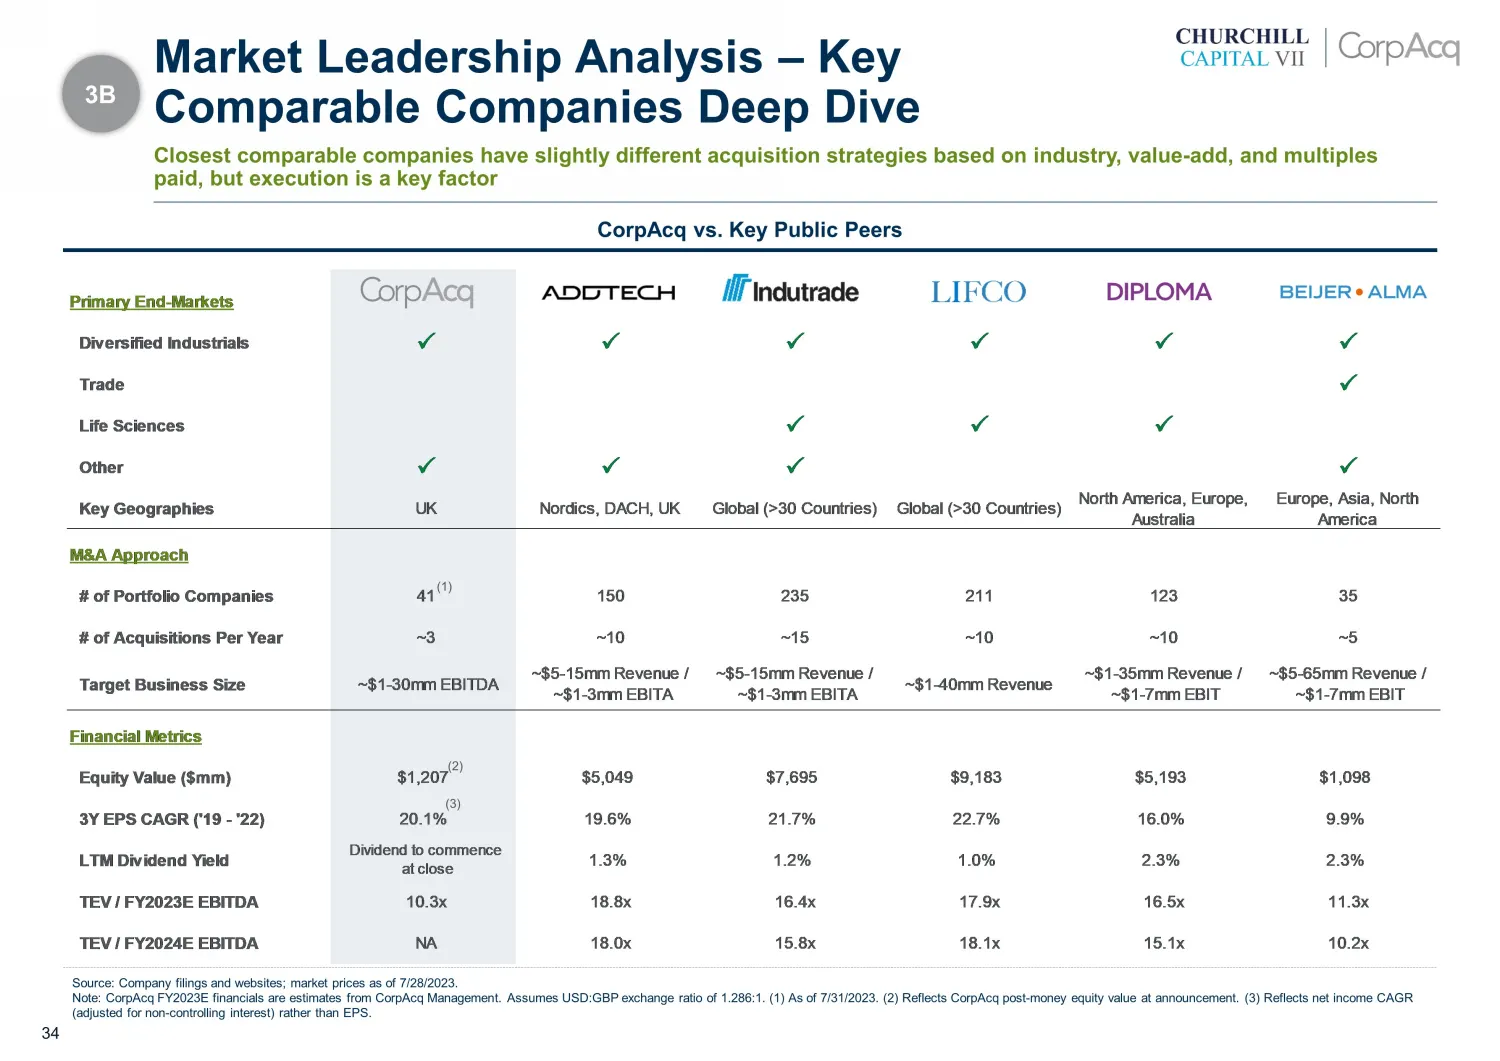
Slide 34: CorpAcq vs. Key Public Peers
34 CorpAcq vs. Key Public Peers Source: Company filings and websites; market prices as of 7/28/2023. Note: CorpAcq FY 2023E financials are estimates from CorpAcq Management. Assumes USD:GBP exchange ratio of 1.286:1. (1) As of 7/31/2023. (2) Reflects CorpAcq post - money equity value at announcement
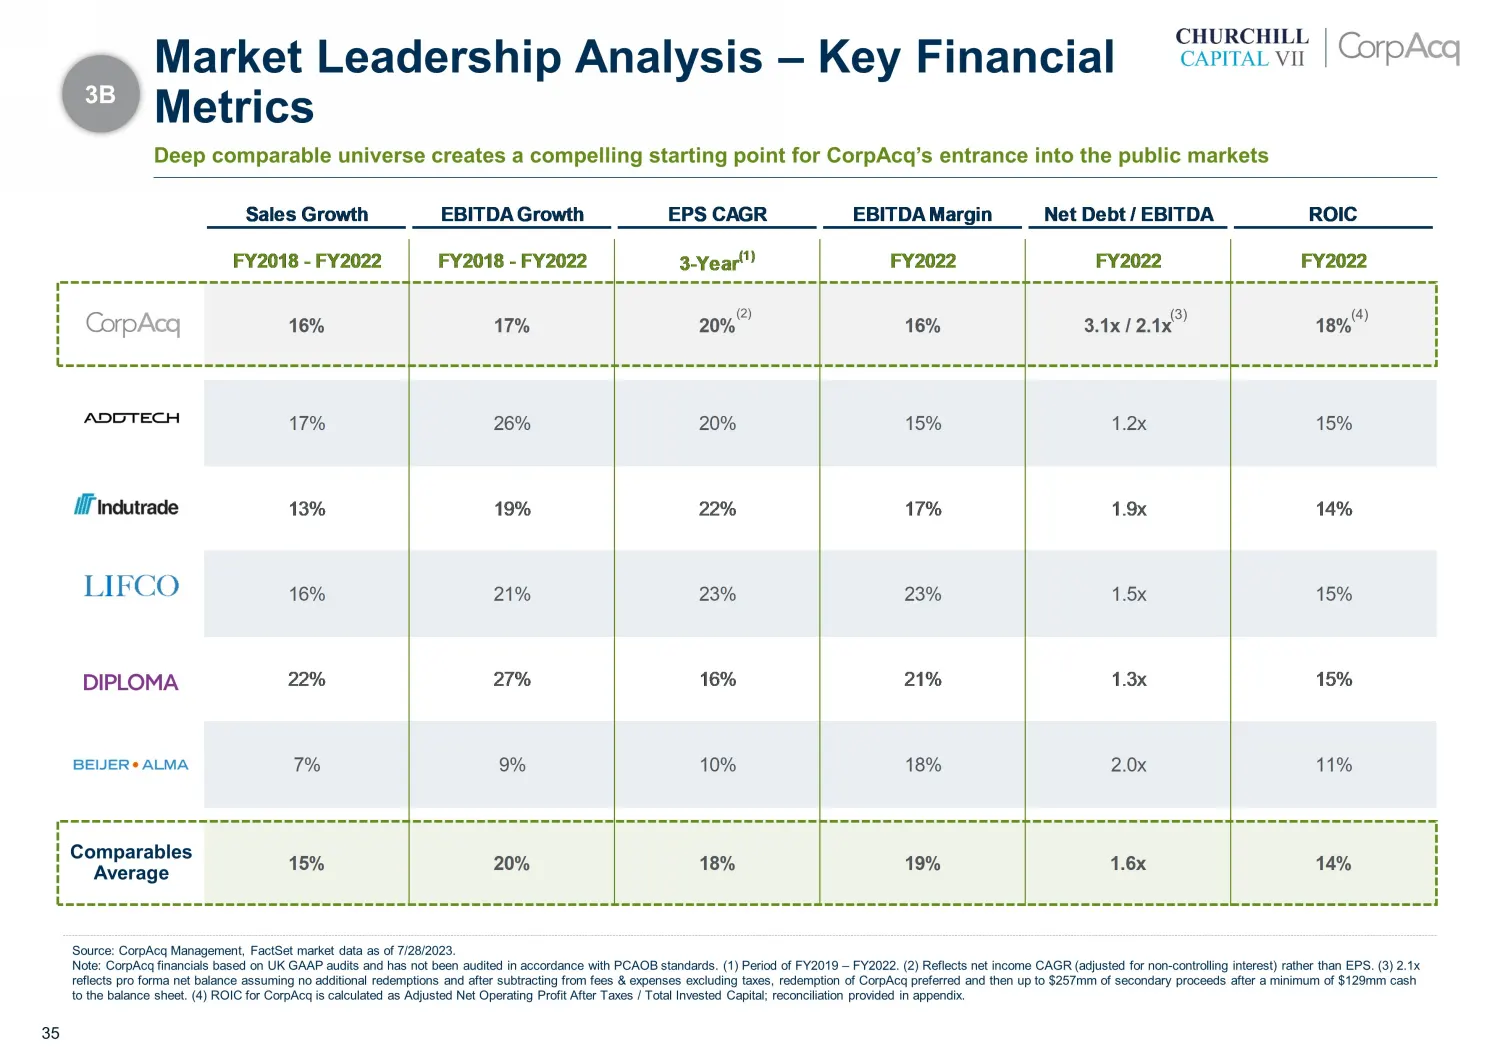
Slide 35: Peer benchmarking: growth, margins, leverage, ROIC
35 Source: CorpAcq Management , FactSet market data as of 7/28/2023. Note: CorpAcq financials based on UK GAAP audits and has not been audited in accordance with PCAOB standards . (1) Period of FY2019 – FY2022. (2) Reflects net income CAGR (adjusted for non - controlling interest) rather than EPS. (
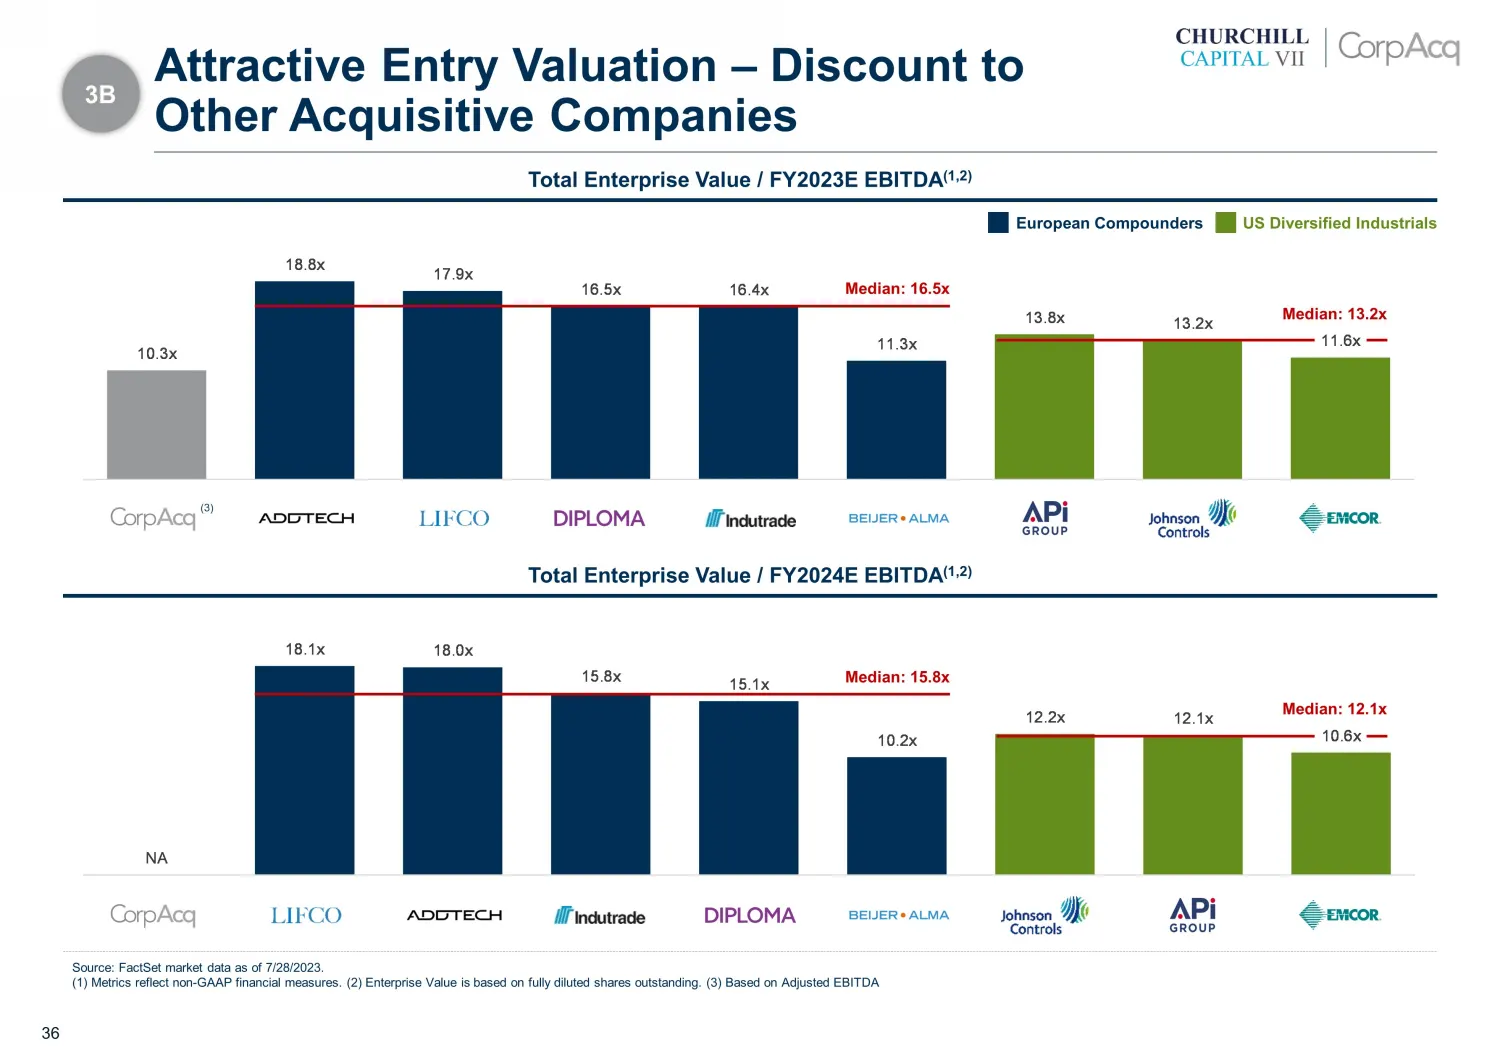
Slide 36: Attractive Entry Valuation – Discount to Other Acquisitive Companies
36 NA 18.1x 18.0x 15.8x 15.1x 10.2x 12.2x 12.1x 10.6x 10.3x 18.8x 17.9x 16.5x 16.4x 11.3x 13.8x 13.2x 11.6x Total Enterprise Value / FY2023E EBITDA (1,2) Total Enterprise Value / FY2024E EBITDA (1,2) Source: FactSet market data as of 7/28/2023. (1) Metrics reflect non - GAAP financial measures. (2)
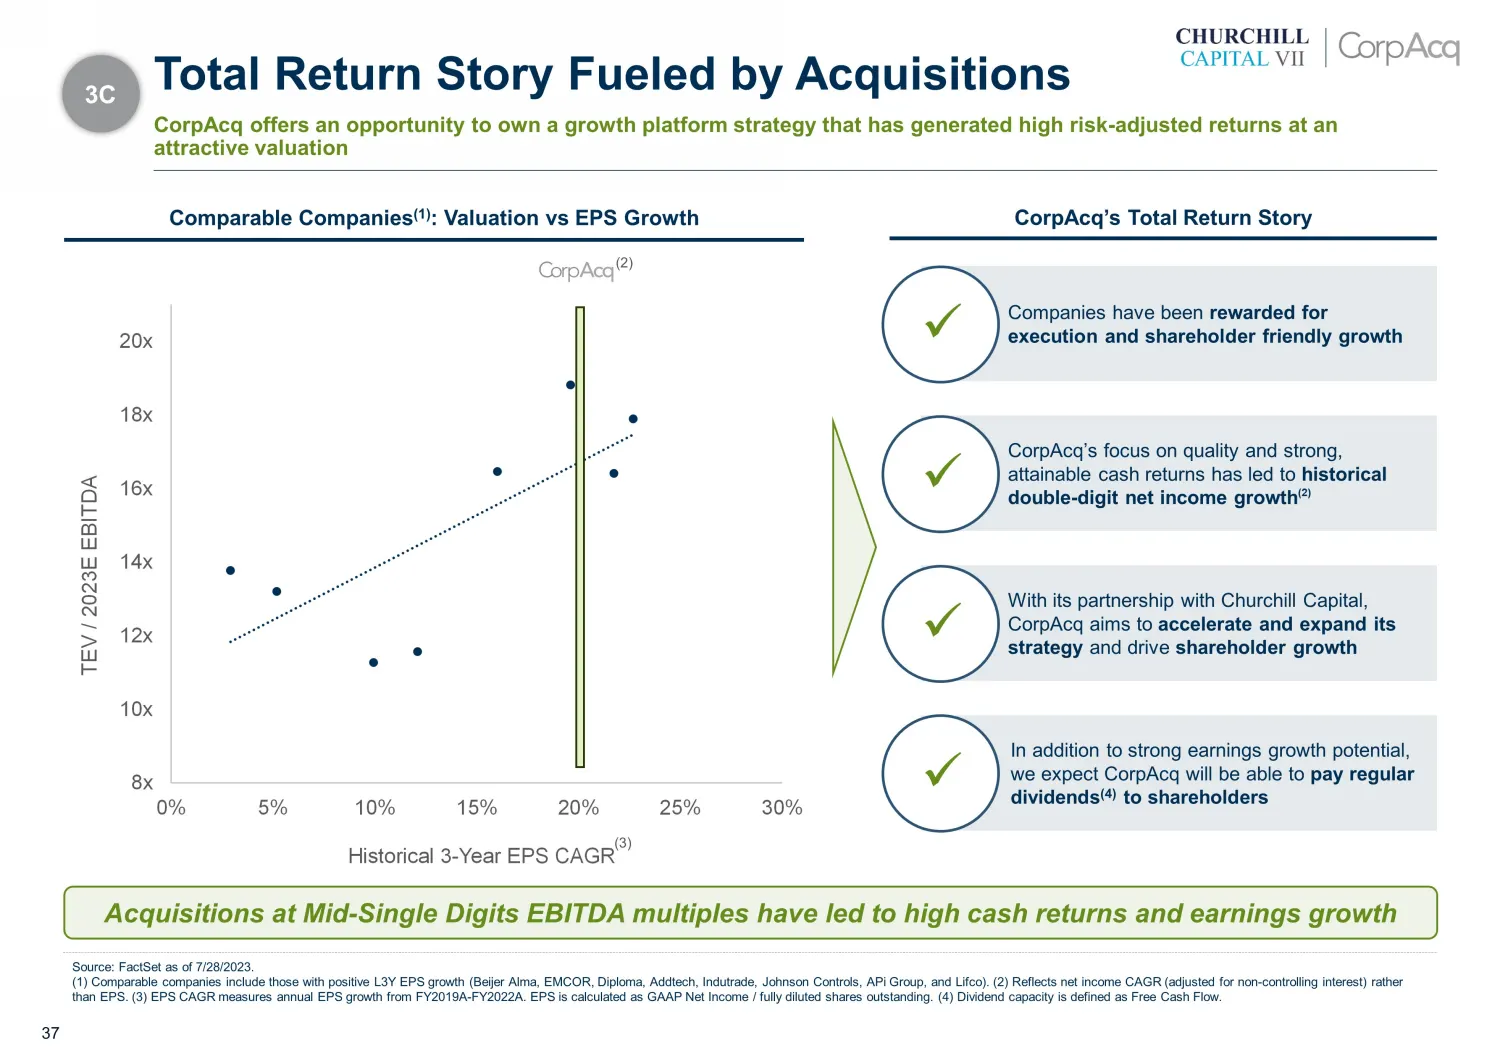
Slide 37: Comparable Companies: Valuation vs EPS Growth
37 8x 10x 12x 14x 16x 18x 20x 0% 5% 10% 15% 20% 25% 30% TEV / 2023E EBITDA Historical 3 - Year EPS CAGR Comparable Companies (1) : Valuation vs EPS Growth Source: FactSet as of 7/28/2023. (1) Comparable companies include those with positive L3Y EPS growth ( Beijer Alma, EMCOR, Diploma, Addtech , Ind
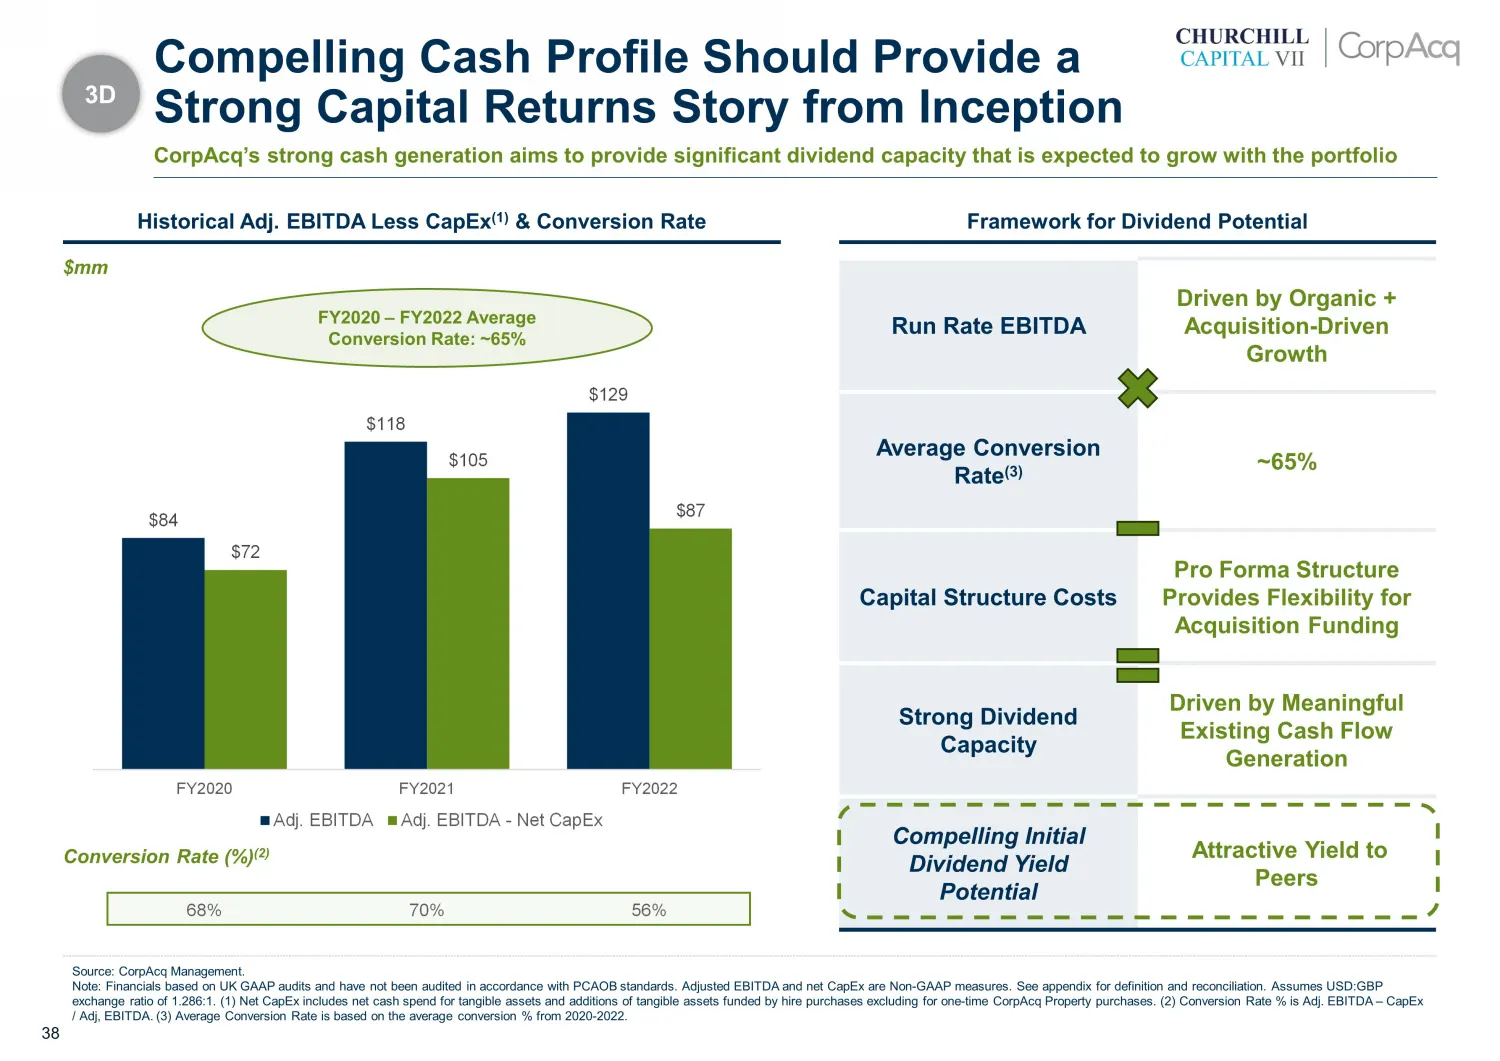
Slide 38: Framework for Dividend Potential
38 Source: CorpAcq Management. Note: Financials based on UK GAAP audits and have not been audited in accordance with PCAOB standards. Adjusted EBITDA and ne t C apEx are Non - GAAP measures. See appendix for definition and reconciliation. Assumes USD:GBP exchange ratio of 1.286:1. (1) Net CapEx incl
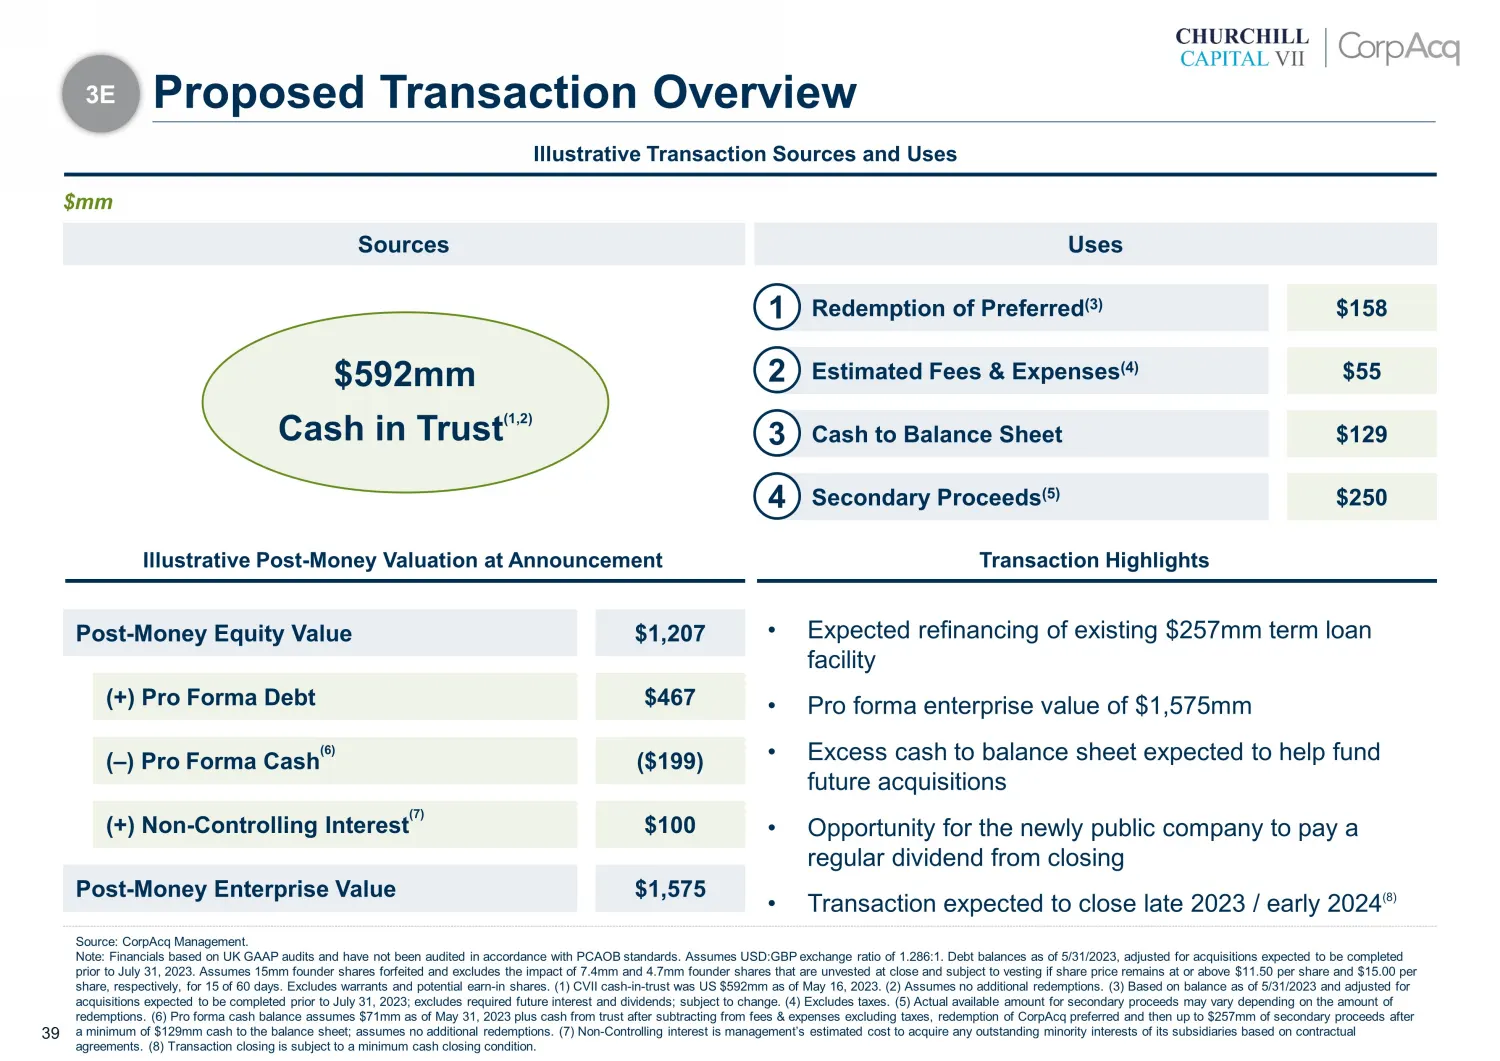
Slide 39: Illustrative Transaction Sources and Uses
39 Illustrative Transaction Sources and Uses Sources Illustrative Post - Money Valuation at Announcement Source: CorpAcq Management. Note: Financials based on UK GAAP audits and have not been audited in accordance with PCAOB standards. Assumes USD:GBP exchange ratio of 1.286:1. Debt balances as of 5
Slide 40: Differentiated opportunity to own a platform of UK SMEs
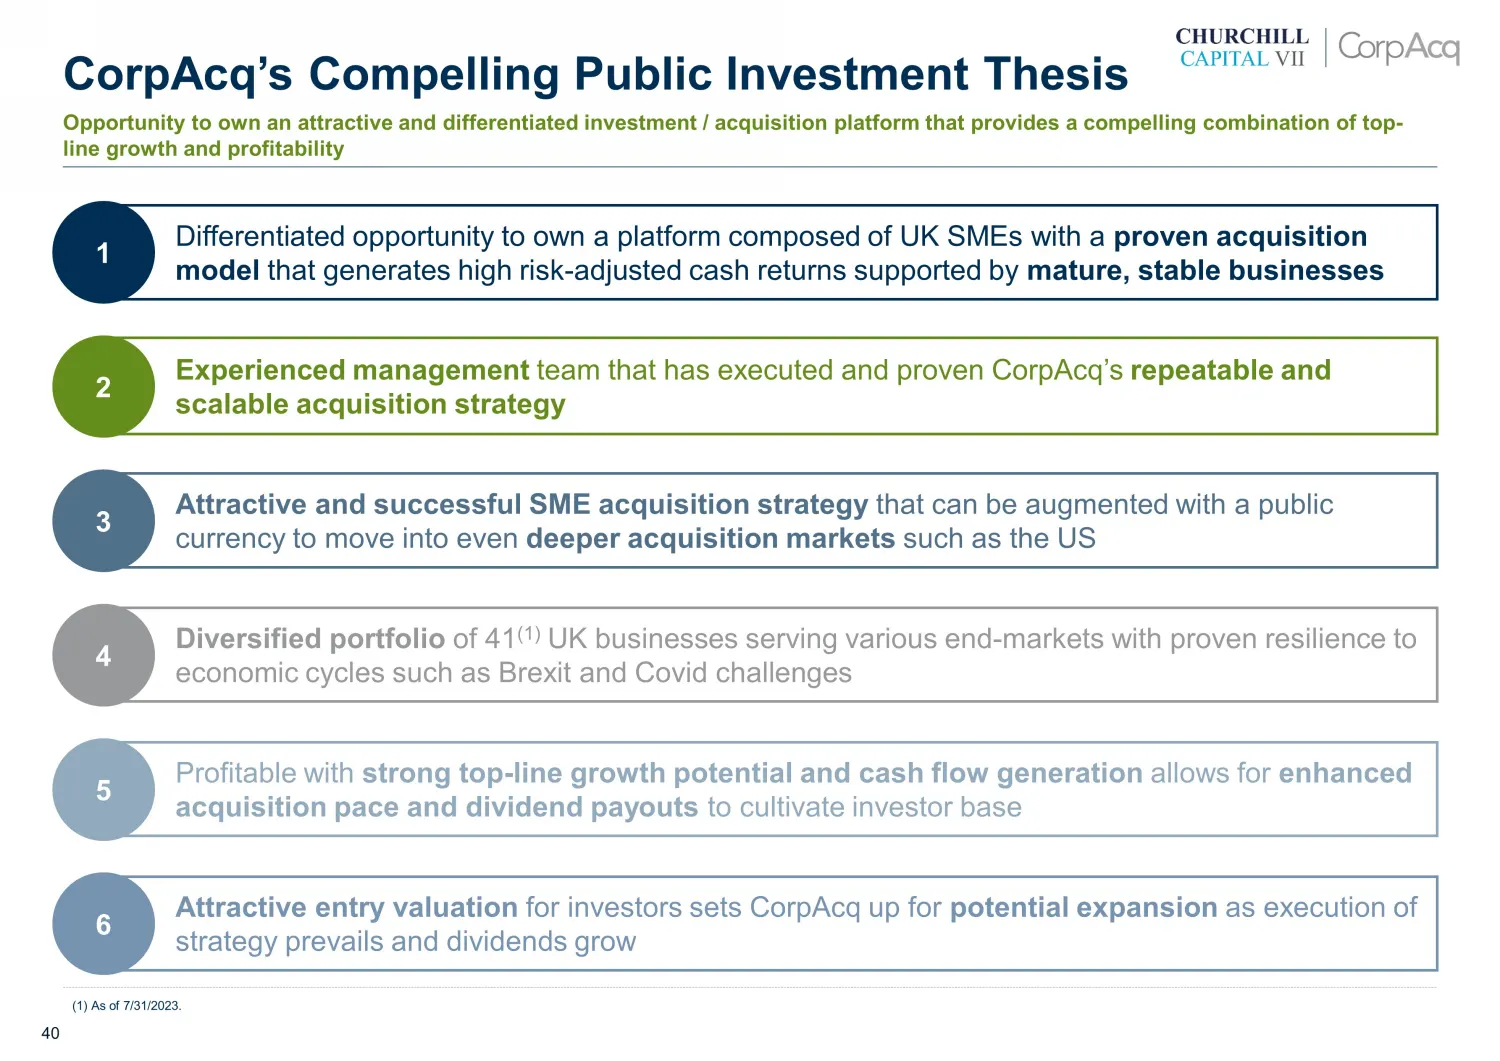
40 Differentiated opportunity to own a platform composed of UK SMEs with a proven acquisition model that generates high risk - adjusted cash returns supported by mature, stable businesses 1 Experienced management team that has executed and proven CorpAcq’s repeatable and scalable acquisition strateg
Slide 41: Appendix
“ CHURCHILL | CAPITAL VIL | Appendix
Slide 42: Illustrative Sample of Portfolio Companies
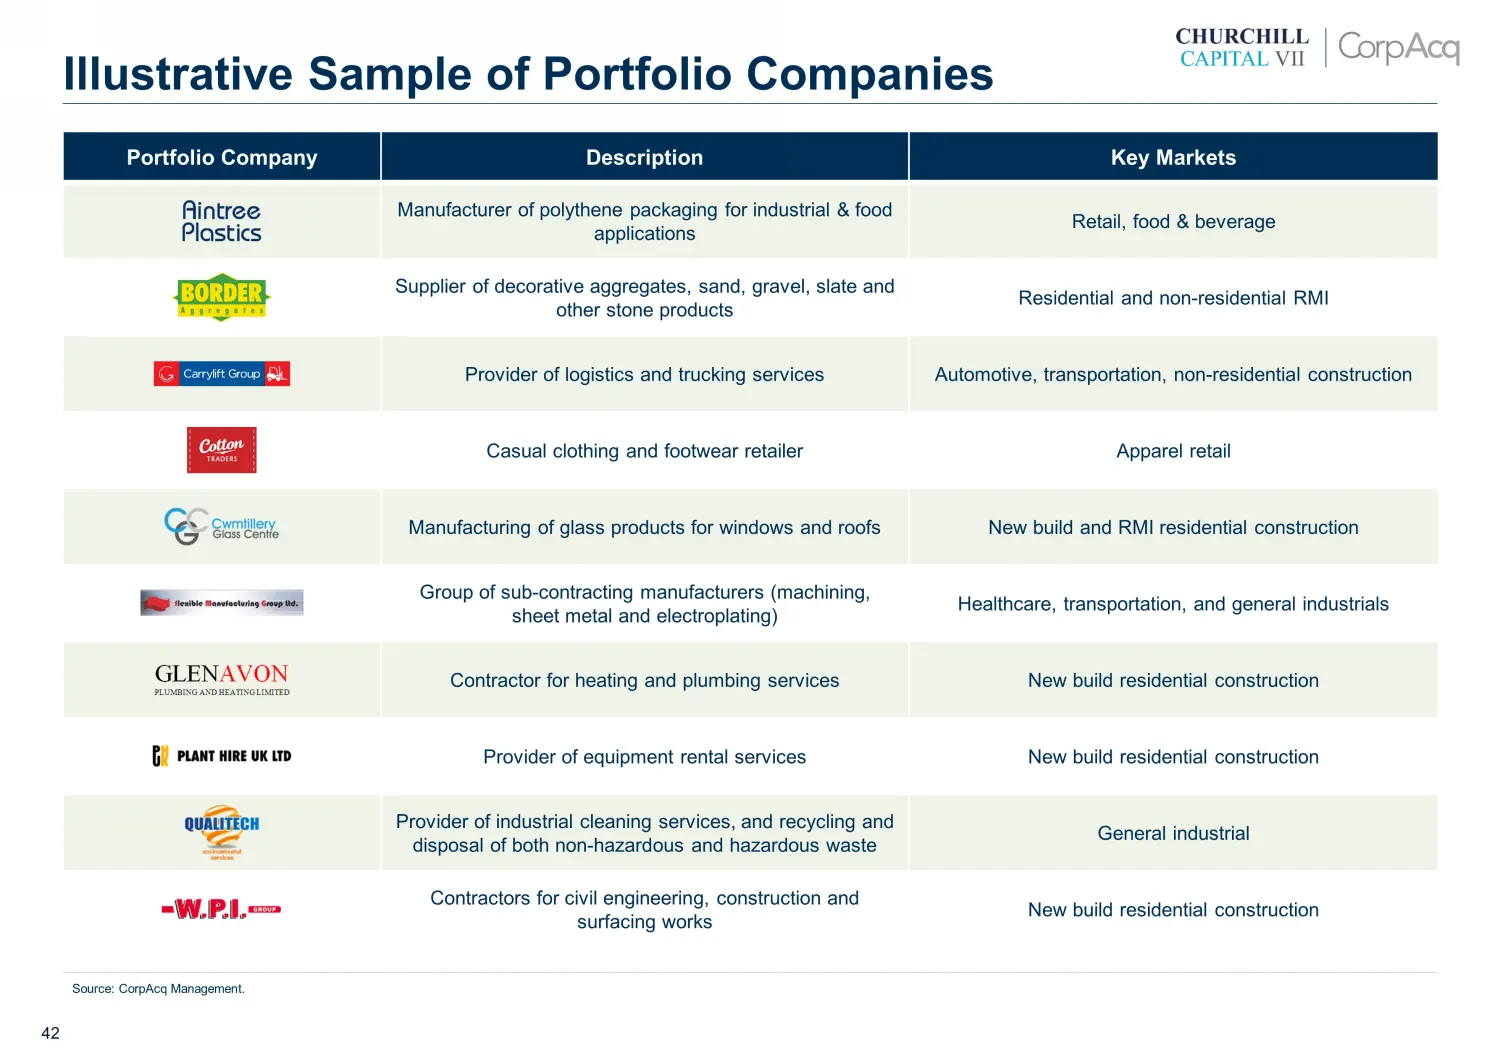
42 Source: CorpAcq Management. Illustrative Sample of Portfolio Companies Portfolio Company Description Key Markets Manufacturer of polythene packaging for industrial & food applications Retail, food & beverage Supplier of decorative aggregates, sand, gravel, slate and other stone products Residenti
Slide 43: EBITDA Adjustments Overview
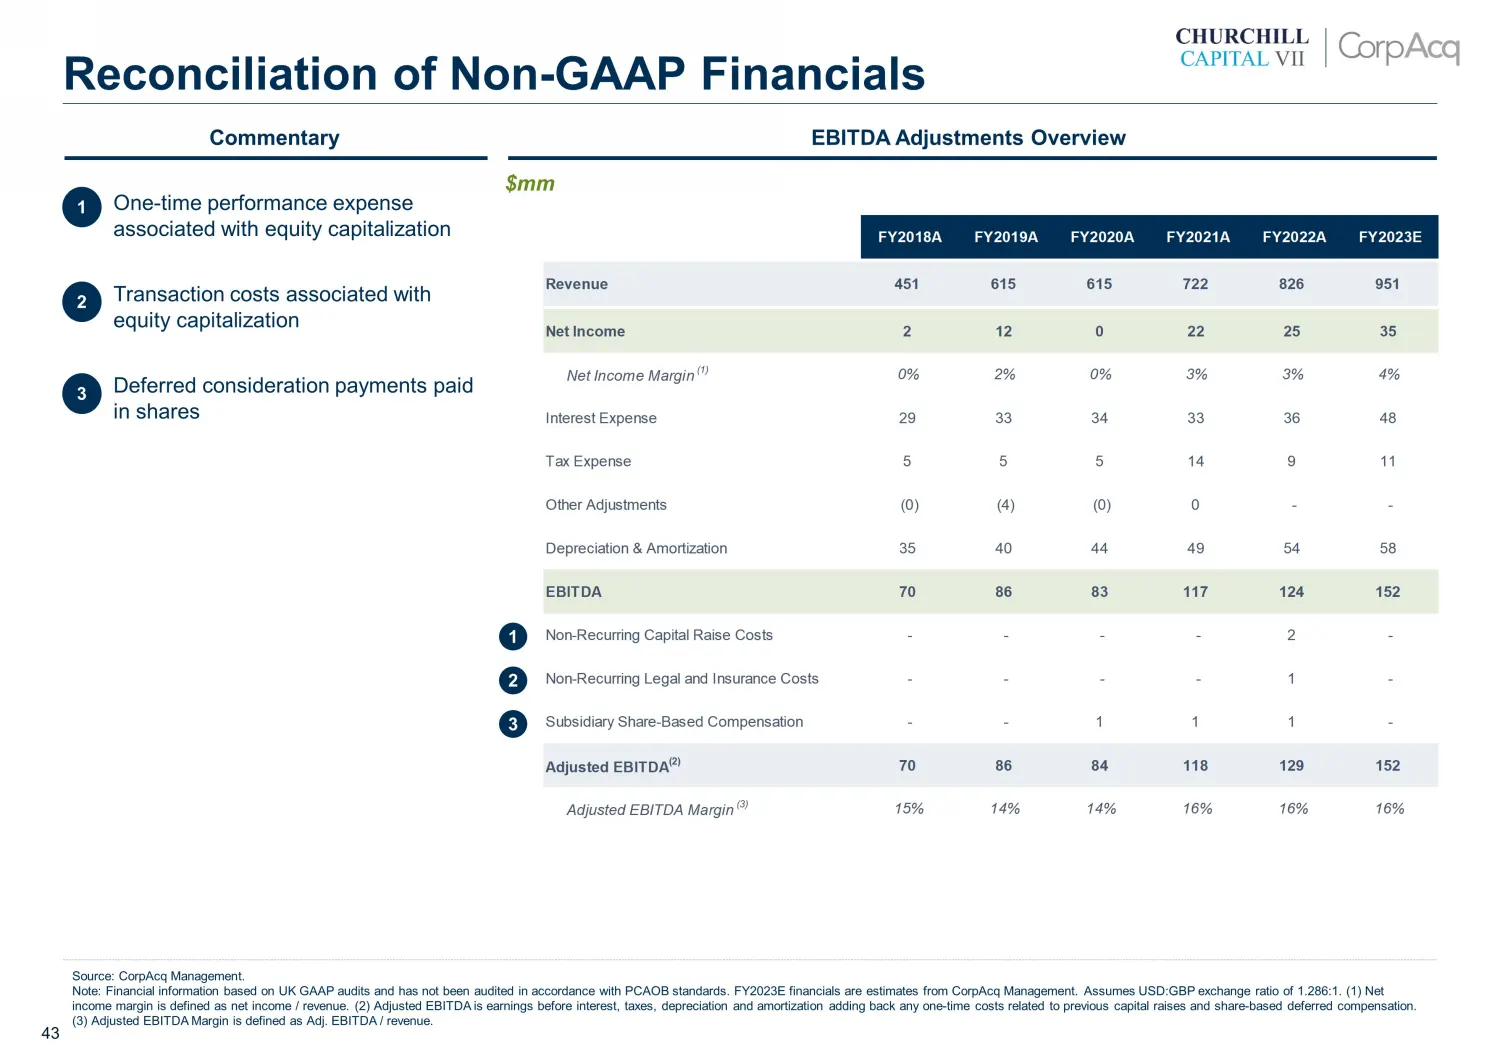
43 Commentary EBITDA Adjustments Overview $ mm Source: CorpAcq Management. Note: Financial information based on UK GAAP audits and has not been audited in accordance with PCAOB standards. FY 2023E financials are estimates from CorpAcq Management. Assumes USD:GBP exchange ratio of 1.286:1. (1) Net in
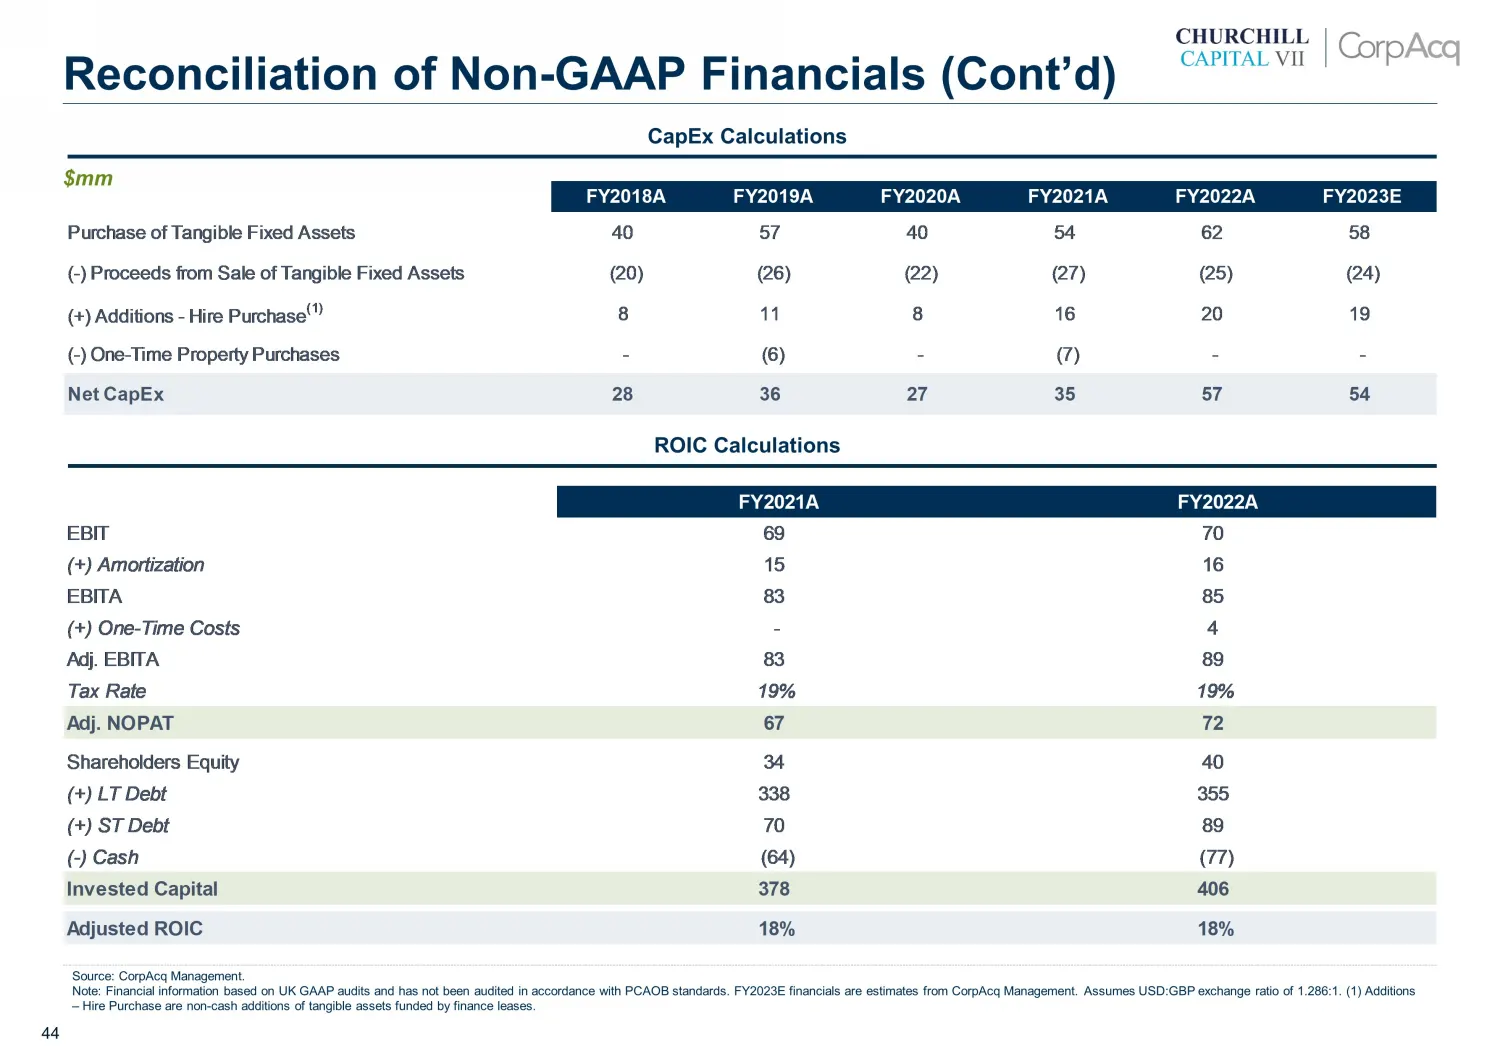
Slide 44: CapEx and ROIC Calculations
44 FY2018A FY2019A FY2020A FY2021A FY2022A FY2023E Purchase of Tangible Fixed Assets 40 57 40 54 62 58 (-) Proceeds from Sale of Tangible Fixed Assets (20) (26) (22) (27) (25) (24) (+) Additions - Hire Purchase (1) 8 11 8 16 20 19 (-) One-Time Property Purchases - (6) - (7) - - Net CapEx 28 36 27 35
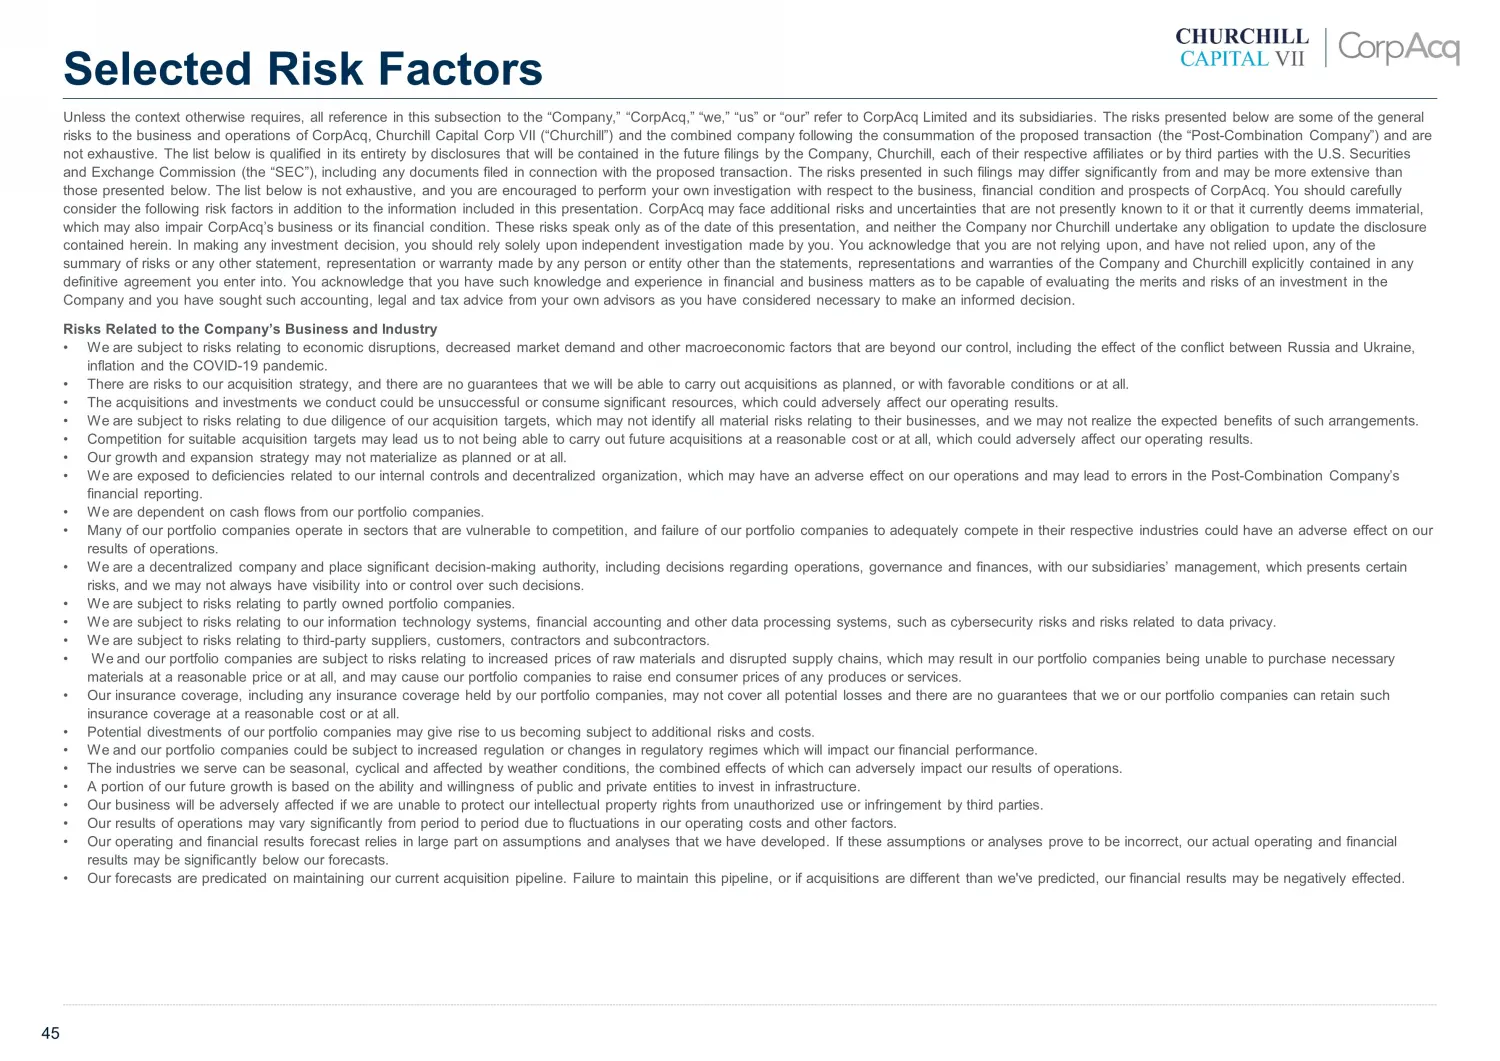
Slide 45: Risk Factors
45 Unless the context otherwise requires, all reference in this subsection to the “Company,” “CorpAcq,” “we,” “us” or “our” refe r t o CorpAcq Limited and its subsidiaries. The risks presented below are some of the general risks to the business and operations of CorpAcq, Churchill Capital Corp VII (
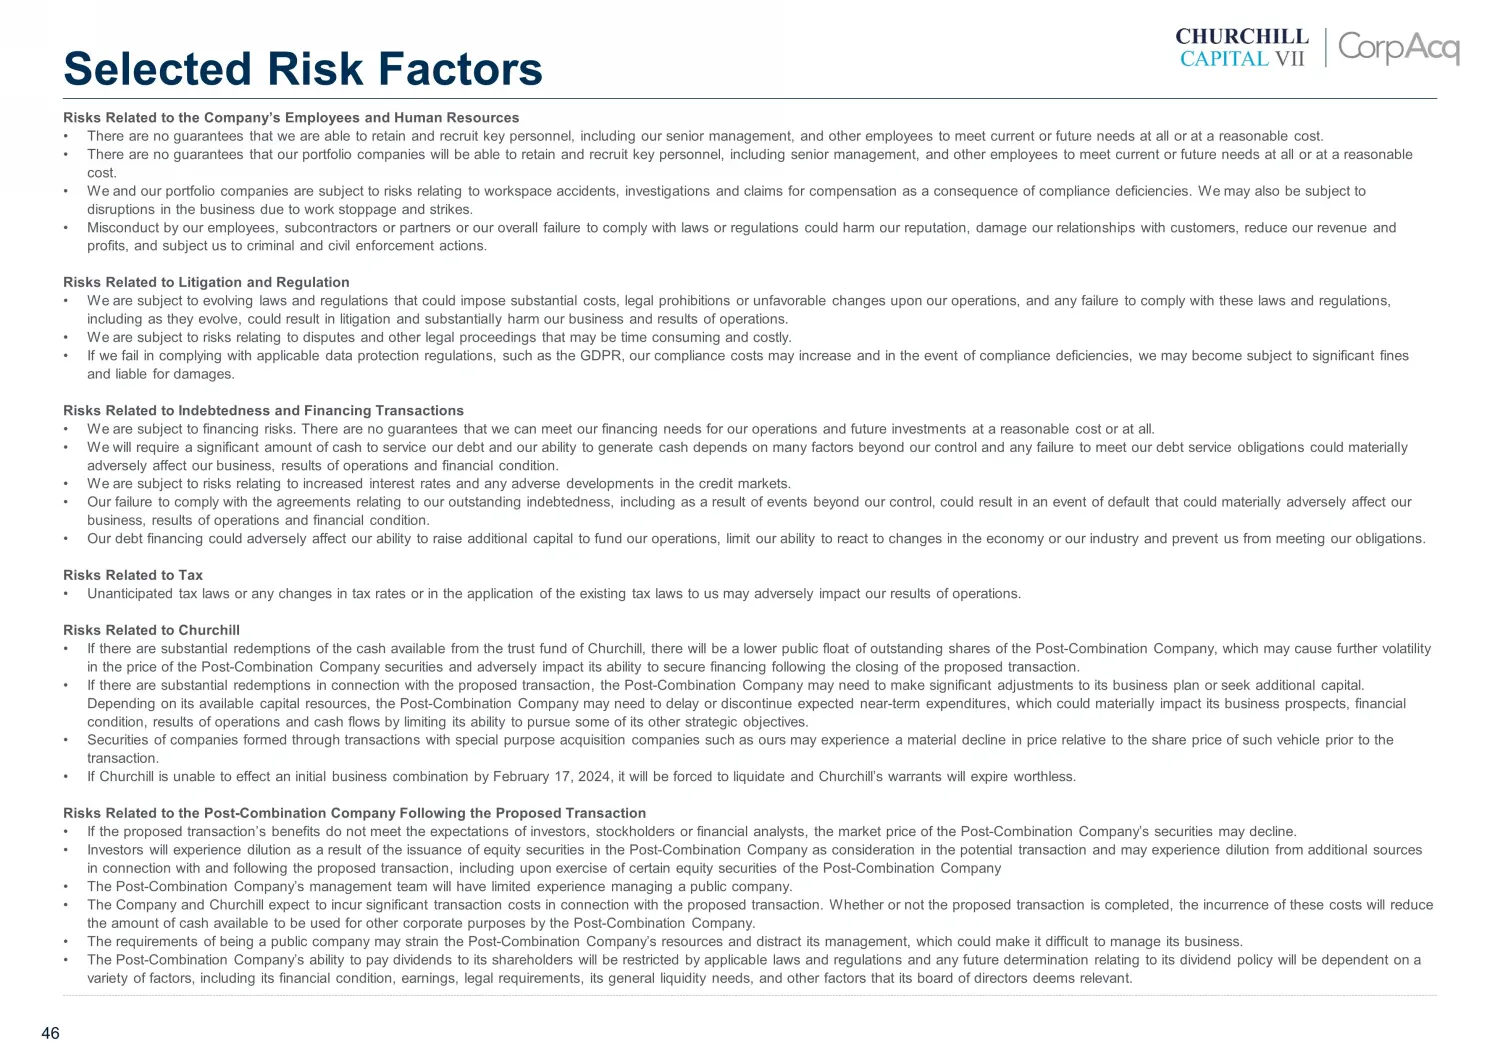
Slide 46: Risks Related to the Company's Employees and Human Resources
46 Risks Related to the Company’s Employees and Human Resources • There are no guarantees that we are able to retain and recruit key personnel, including our senior management, and other empl oye es to meet current or future needs at all or at a reasonable cost. • There are no guarantees that our po

Slide 47: 47
47
Source: SEC EDGAR · 8-K filed Aug 1, 2023