Atlas Pipeline Partners L.P — Stephens Fall Investment Conference 2014
30 slides from Atlas Pipeline Partners L.P's conference presentation, Nov 12, 2014
Slide 1: Stephens Fall Investment Conference
Atlas Pipeline Partners, L.P. Stephens Fall Investment Conference November 11, 2014 New York City
Slide 2: Forward-looking statements
THE WORDS “BELIEVES, ANTICIPATES, EXPECTS”, “PRO FORMA” AND SIMILAR EXPRESSIONS ARE INTENDED TO IDENTIFY FORWARD LOOKING STATEMENTS. SUCH STATEMENTS ARE SUBJECT TO CERTAIN RISKS AND UNCERTAINTIES, WHICH COULD CAUSE ACTUAL RESULTS TO DIFFER MATERIALLY FROM THOSE PROJECTED IN THE FORWARD LOOKING STATE
Slide 3: Notice about the Recent Targa – Atlas Announcement
* Notice about the Recent Targa – Atlas Announcement On October 13, 2014, the Partnership announced that it has entered into a definitive agreement to be acquired by Targa Resources Partners L.P. (NYSE: NGLS) in a transaction valuing the Partnership at $7.7 billion, including debt and an approximate
Slide 4: Atlas Pipeline Partners, L.P. overview
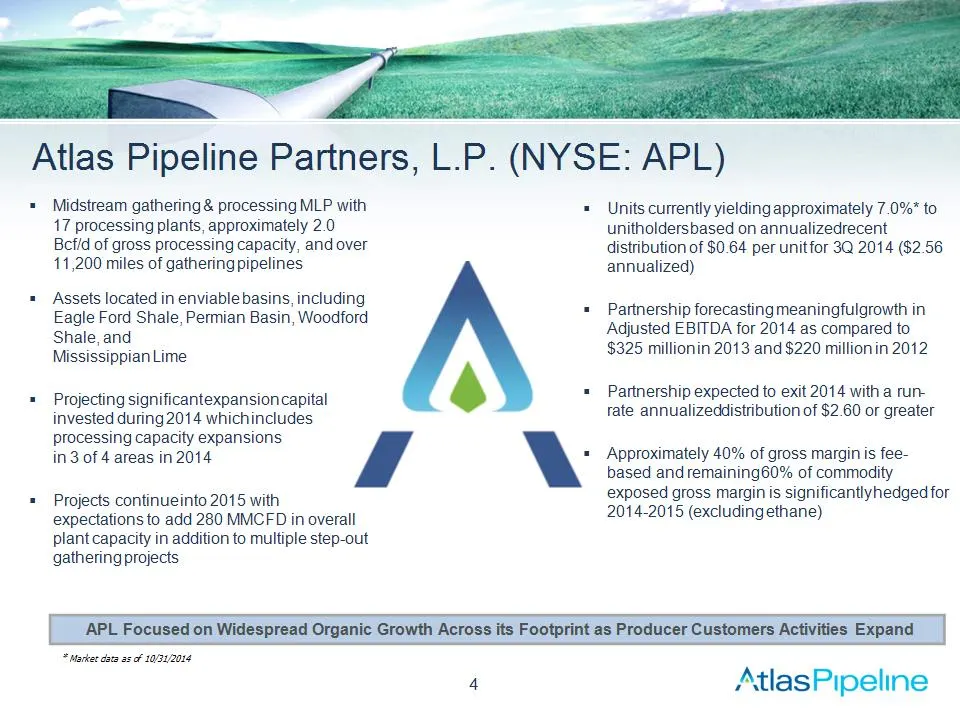
* Market data as of 10/31/2014 Atlas Pipeline Partners, L.P. (NYSE: APL) * Units currently yielding approximately 7.0%* to unitholders based on annualized recent distribution of $0.64 per unit for 3Q 2014 ($2.56 annualized) Partnership forecasting meaningful growth in Adjusted EBITDA for 2014 as com
Slide 5: Diversified Asset Base in Oil / NGL-Rich Areas
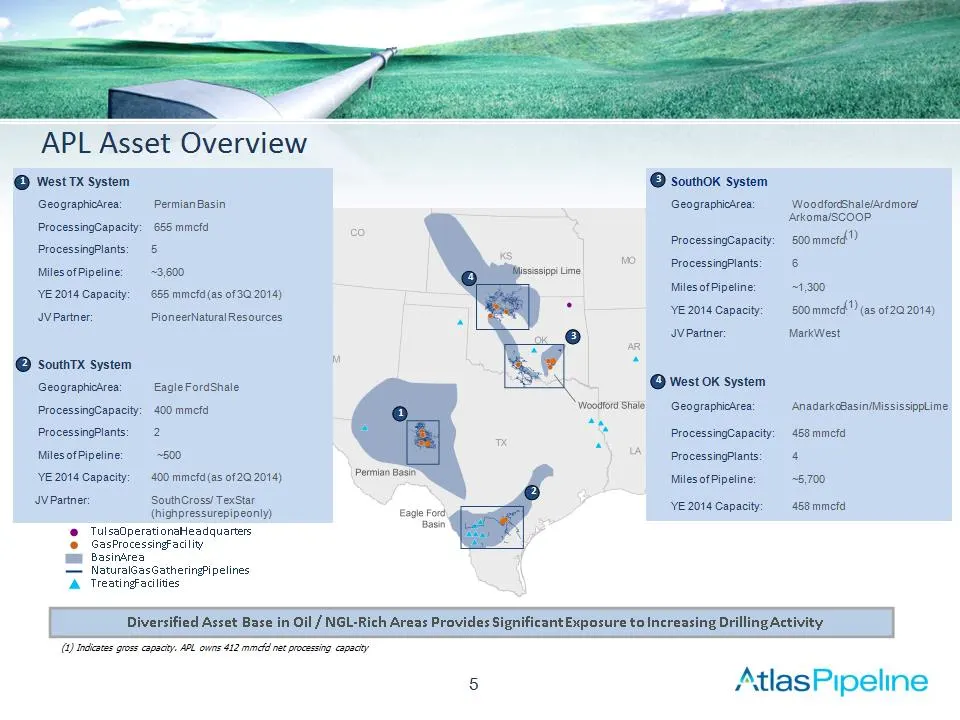
Diversified Asset Base in Oil / NGL-Rich Areas Provides Significant Exposure to Increasing Drilling Activity APL Asset Overview West TX System Geographic Area: Permian Basin Processing Capacity: 655 mmcfd Processing Plants: 5 Miles of Pipeline: ~3,600 YE 2014 Capacity: 655 mmcfd (as of 3Q 2014) JV P
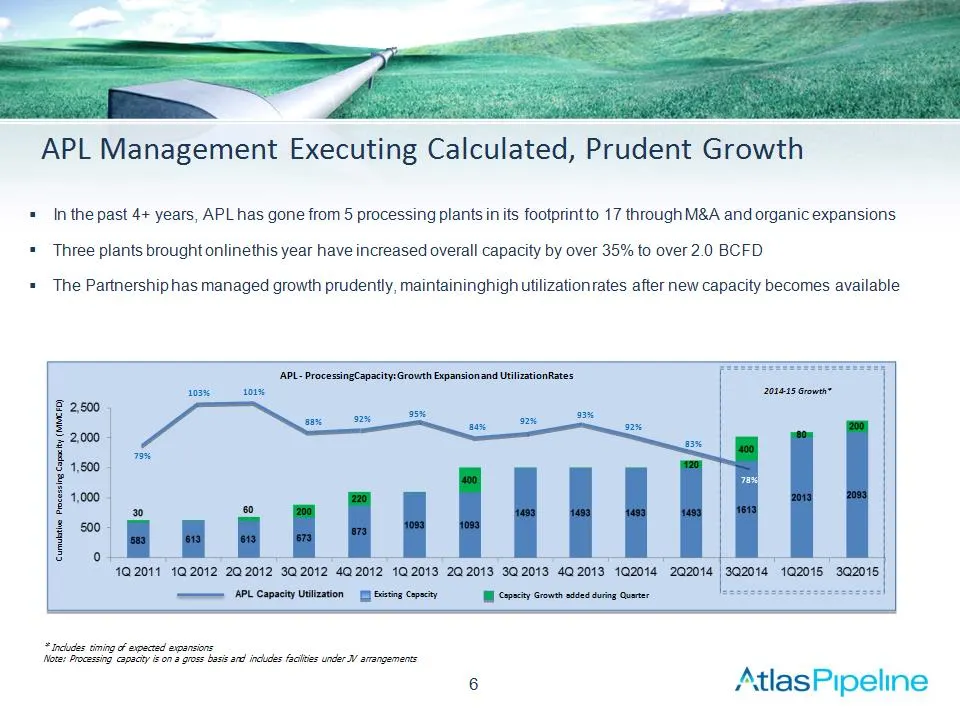
Slide 6: APL Management Executing Calculated, Prudent Growth
* APL Management Executing Calculated, Prudent Growth APL – Processing Capacity: Growth Expansion and Utilization Rates Cumulative Processing Capacity (MMCFD) 2014-15 Growth* 79% 103% 101% 88% 92% 95% 84% 92% 93% * Includes timing of expected expansions Note: Processing capacity is on a gross basis
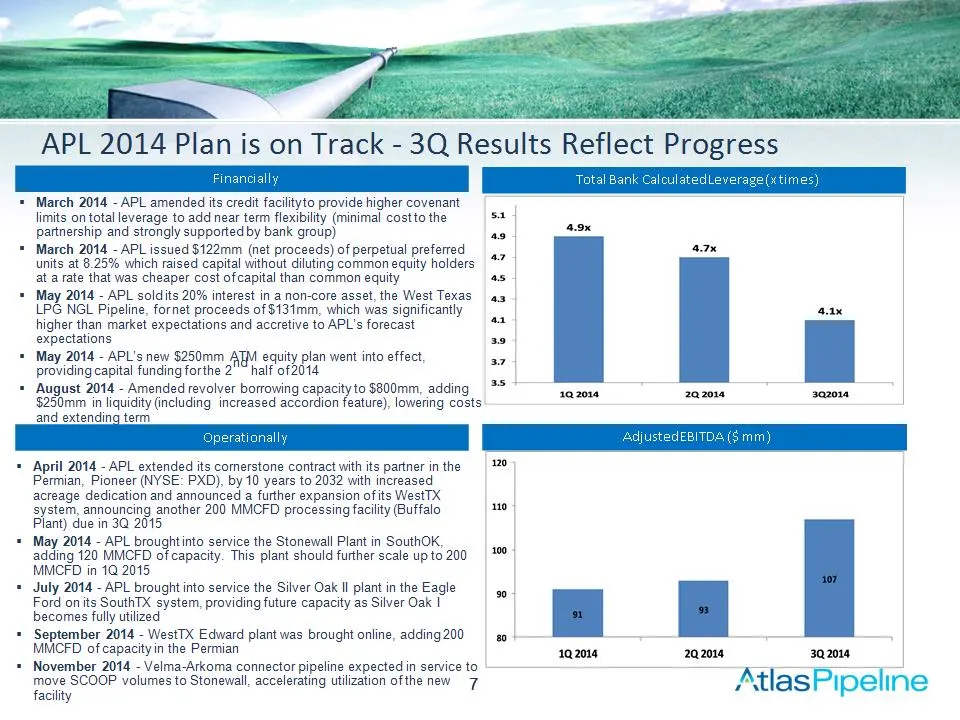
Slide 7: Financing and capital actions in 2014
* March 2014 - APL amended its credit facility to provide higher covenant limits on total leverage to add near term flexibility (minimal cost to the partnership and strongly supported by bank group) March 2014 - APL issued $122mm (net proceeds) of perpetual preferred units at 8.25% which raised capi
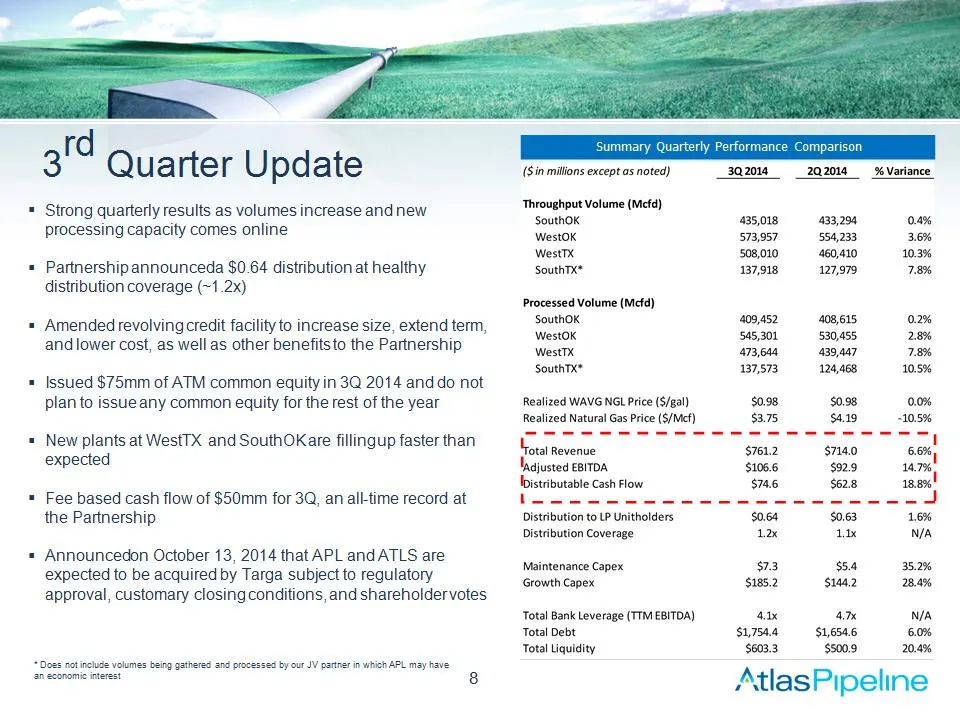
Slide 8: 3rd Quarter Update Summary
3rd Quarter Update Summary Quarterly Performance Comparison Strong quarterly results as volumes increase and new processing capacity comes online Partnership announced a $0.64 distribution at healthy distribution coverage (~1.2x) Amended revolving credit facility to increase size, extend term, and l
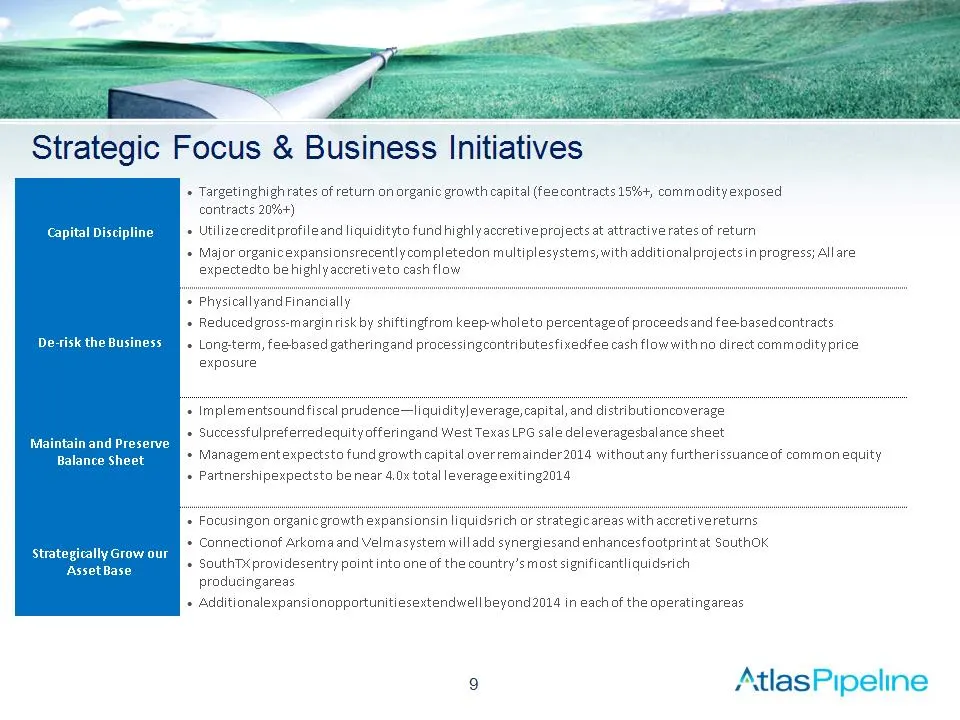
Slide 9: Capital Discipline
Capital Discipline Targeting high rates of return on organic growth capital (fee contracts 15%+, commodity exposed contracts 20%+) Utilize credit profile and liquidity to fund highly accretive projects at attractive rates of return Major organic expansions recently completed on multiple systems, wit
Slide 10: Operational Update
Operational Update 10 AtlasPipeline
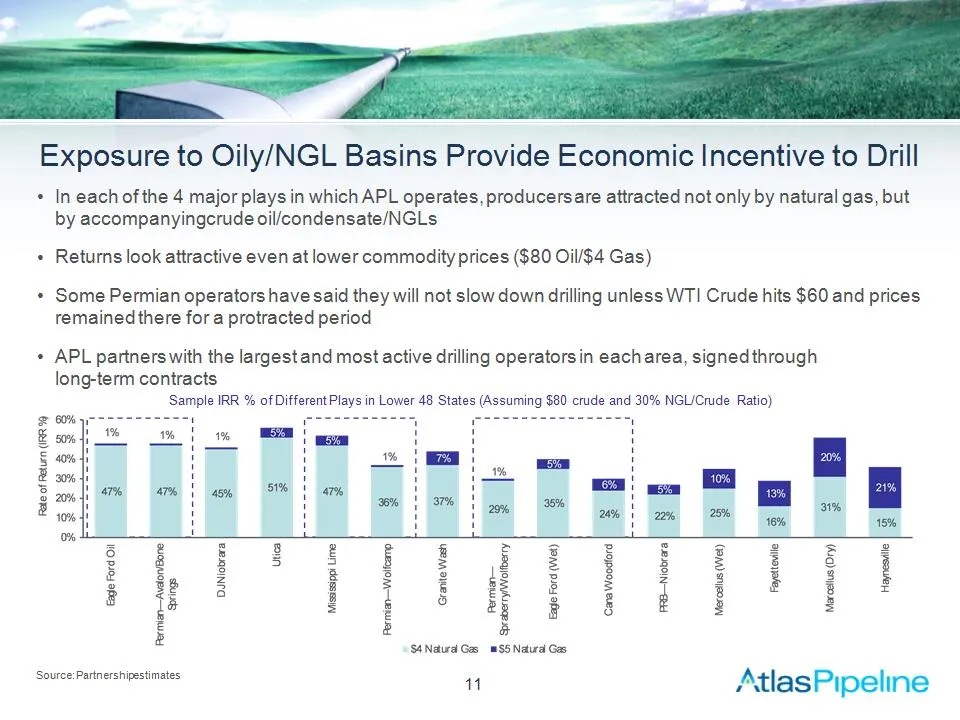
Slide 11: Exposure to Oily/NGL Basins Provide Economic Incentive to Drill
In each of the 4 major plays in which APL operates, producers are attracted not only by natural gas, but by accompanying crude oil/condensate/NGLs Returns look attractive even at lower commodity prices ($80 Oil/$4 Gas) Some Permian operators have said they will not slow down drilling unless WTI Crud
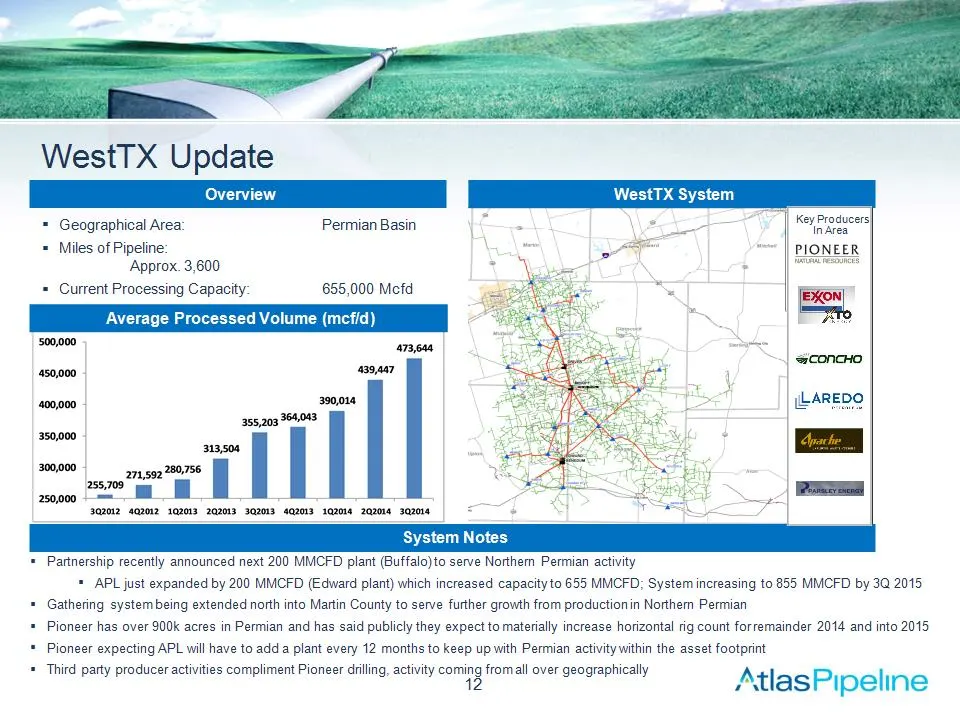
Slide 12: WestTX Update
Geographical Area: Permian Basin Miles of Pipeline: Approx. 3,600 Current Processing Capacity: 655,000 Mcfd Number of Rigs Running: 79 WestTX Update WestTX System Average Processed Volume (mcf/d) Overview System Notes Partnership recently announced next 200 MMCFD plant (Buffalo) to serve Northern Pe
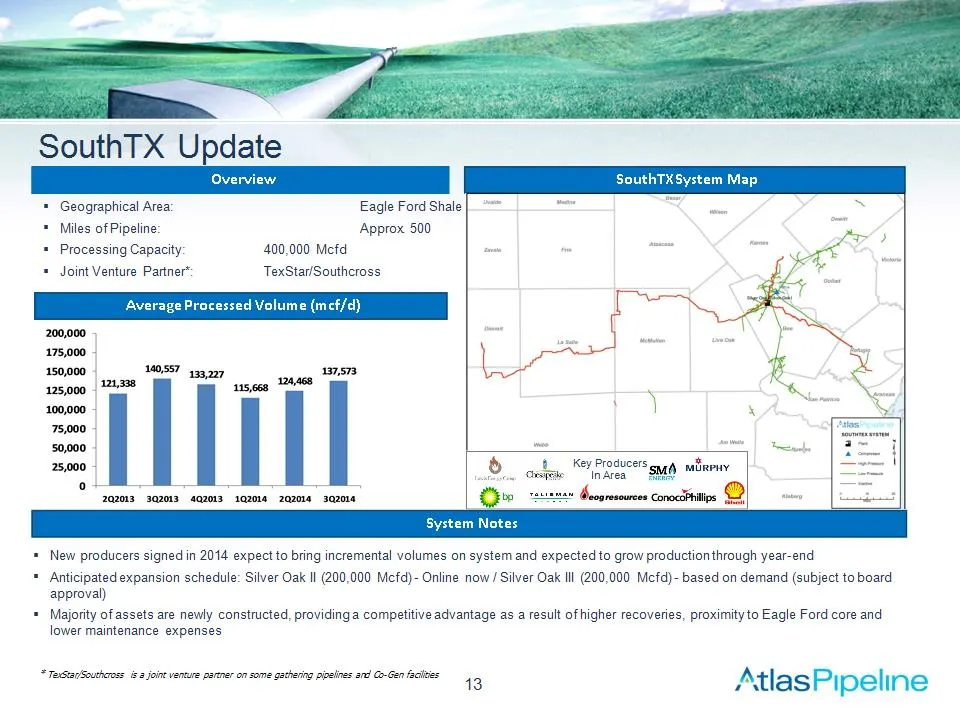
Slide 13: SouthTX Update
SouthTX Update New producers signed in 2014 expect to bring incremental volumes on system and expected to grow production through year-end Anticipated expansion schedule: Silver Oak II (200,000 Mcfd) – Online now / Silver Oak III (200,000 Mcfd) – based on demand (subject to board approval) Majority
Slide 14: WestOK Update
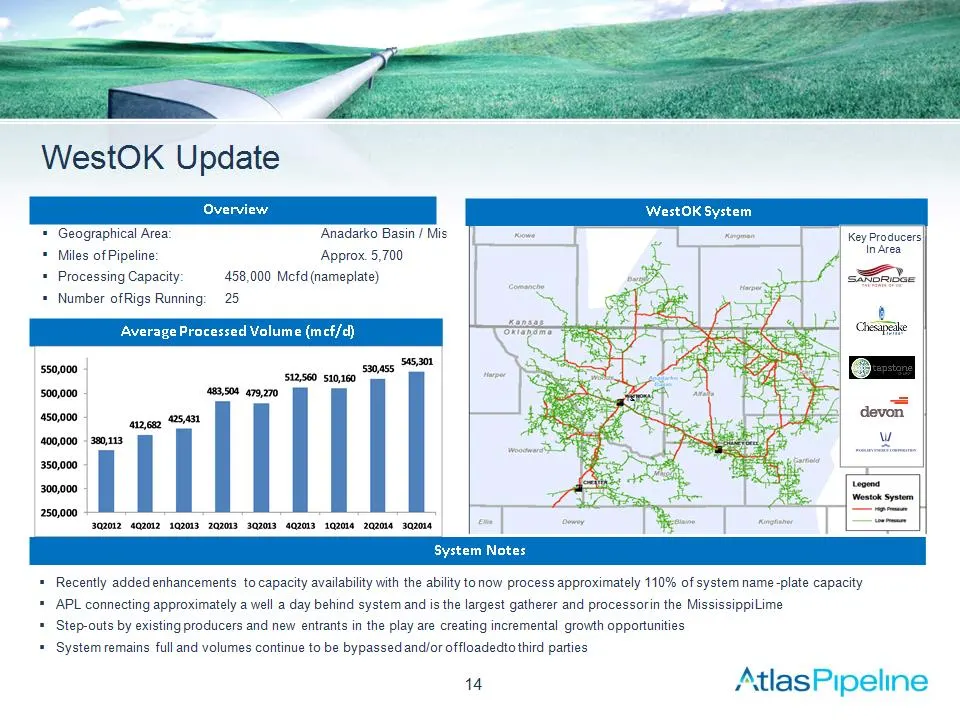
WestOK Update Geographical Area: Anadarko Basin / Mississippi Lime Miles of Pipeline: Approx. 5,700 Processing Capacity: 458,000 Mcfd (nameplate) Number of Rigs Running: 25 Average Processed Volume (mcf/d) Overview Recently added enhancements to capacity availability with the ability to now process
Slide 15: SouthOK Update (Velma & Arkoma)
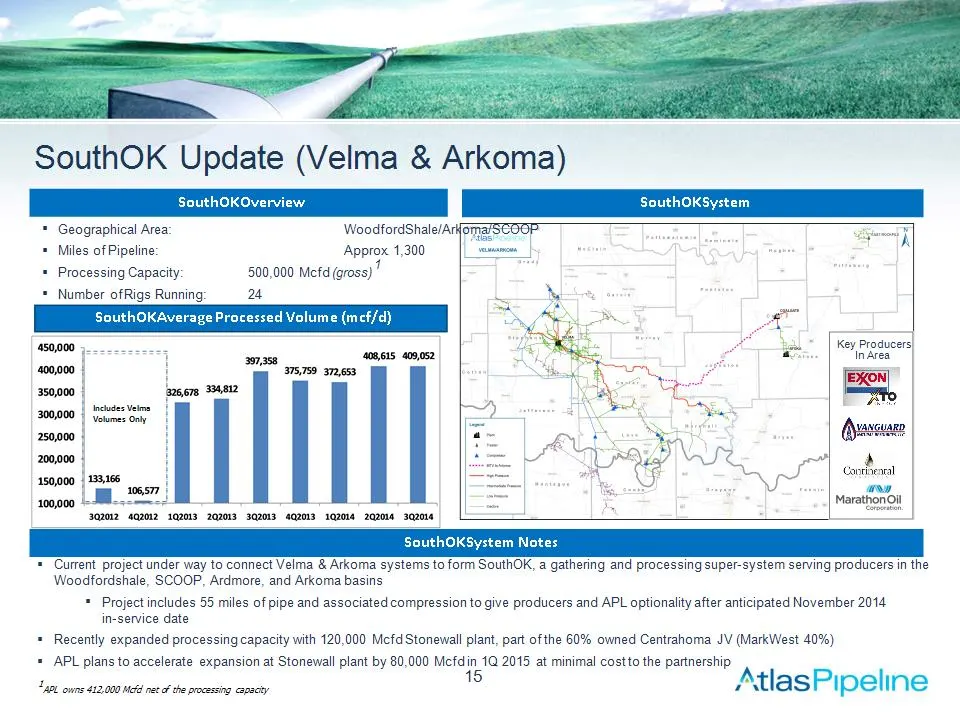
Geographical Area: Woodford Shale/Arkoma/SCOOP Miles of Pipeline: Approx. 1,300 Processing Capacity: 500,000 Mcfd (gross)1 Number of Rigs Running: 24 SouthOK Update (Velma & Arkoma) SouthOK Overview Current project under way to connect Velma & Arkoma systems to form SouthOK, a gathering and processi
Slide 16: Financial Overview
Financial Overview 16 AtlasPipeline
Slide 17: Financial Objectives
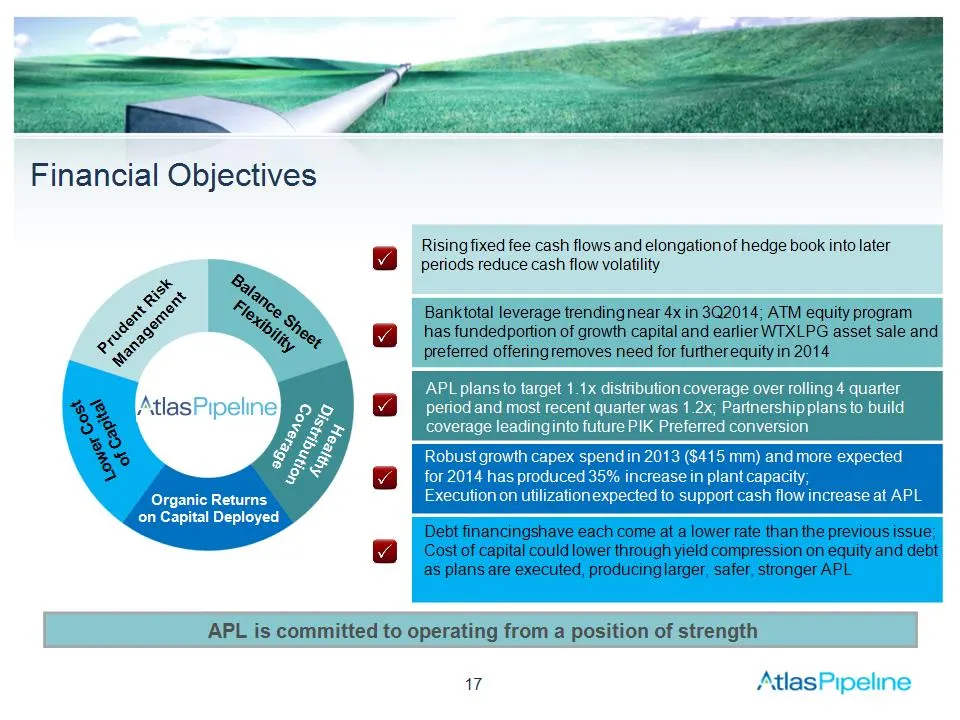
Financial Objectives Lower Cost of Capital Organic Returns on Capital Deployed Balance Sheet Flexibility Prudent Risk Management Healthy Distribution Coverage Rising fixed fee cash flows and elongation of hedge book into later periods reduce cash flow volatility Bank total leverage trending near 4x
Slide 18: 2013 – 2014 Quarterly Financial Summary – Consolidated
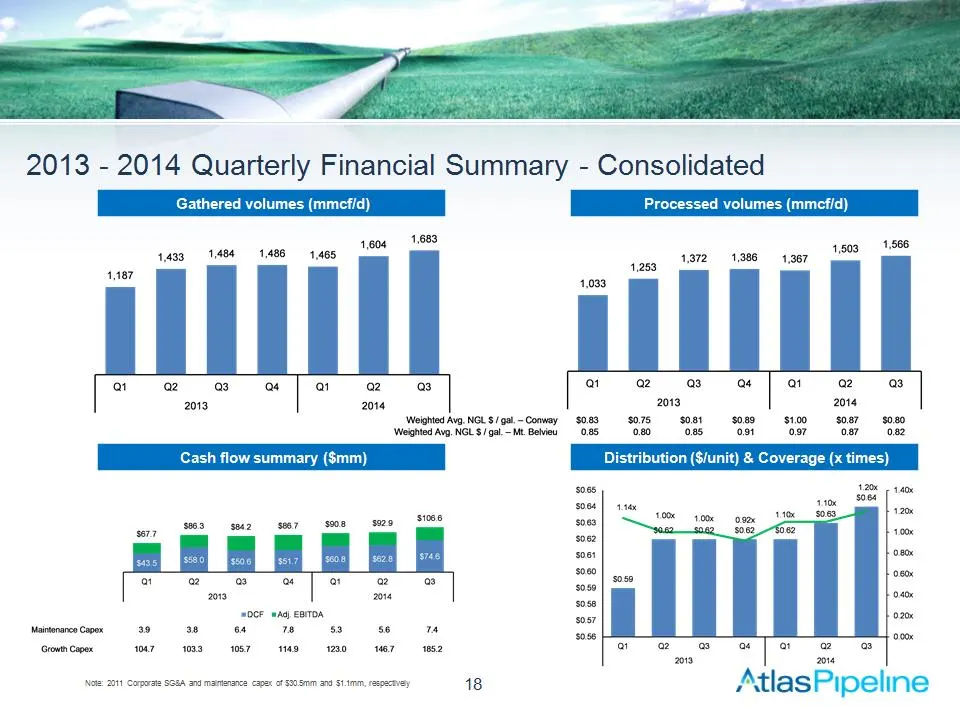
2013 – 2014 Quarterly Financial Summary – Consolidated * Gathered volumes (mmcf/d) Processed volumes (mmcf/d) Cash flow summary ($mm) Distribution ($/unit) & Coverage (x times) Note: 2011 Corporate SG&A and maintenance capex of $30.5mm and $1.1mm, respectively
Slide 19: APL Fixed-Fees Up Considerably in Recent Years
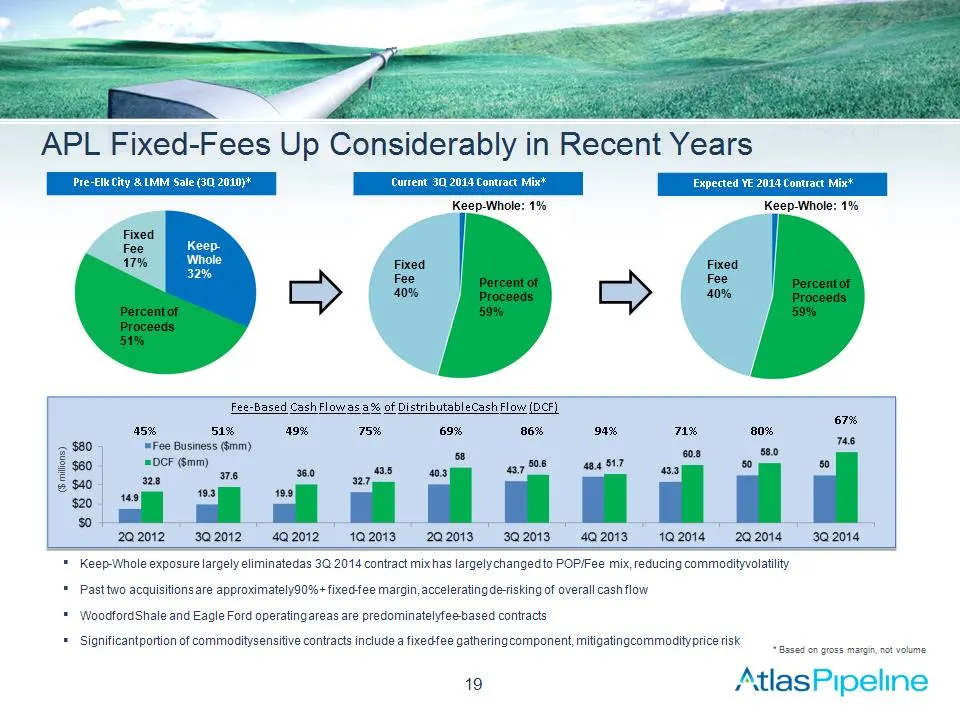
APL Fixed-Fees Up Considerably in Recent Years Keep-Whole exposure largely eliminated as 3Q 2014 contract mix has largely changed to POP/Fee mix, reducing commodity volatility Past two acquisitions are approximately 90%+ fixed-fee margin, accelerating de-risking of overall cash flow Woodford Shale a
Slide 20: Atlas Pipeline has made Progress with Credit Profile
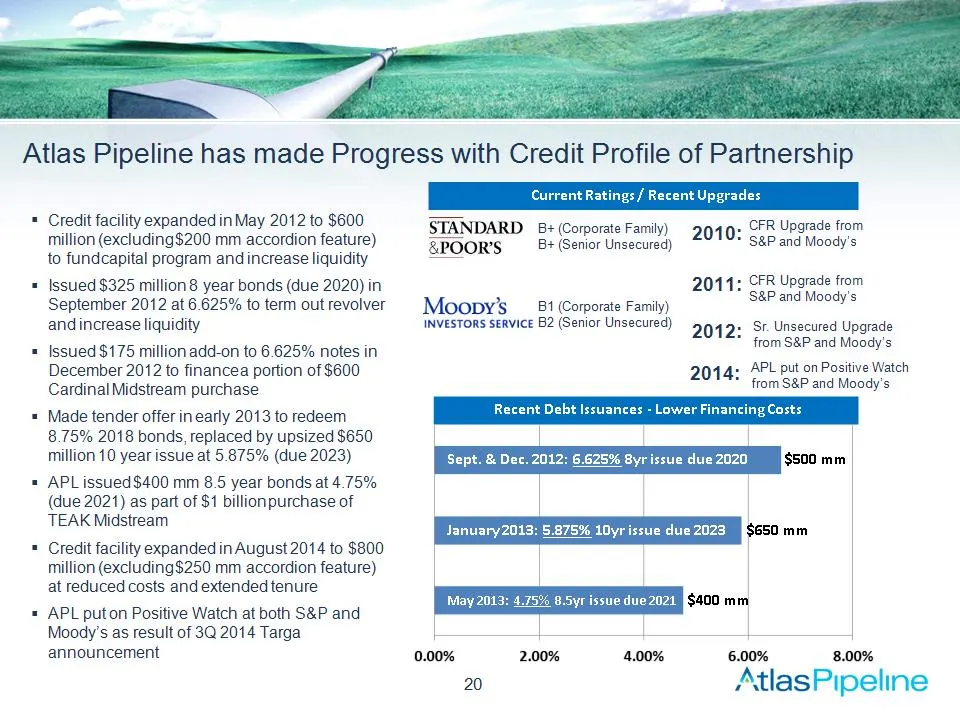
Atlas Pipeline has made Progress with Credit Profile of Partnership Credit facility expanded in May 2012 to $600 million (excluding $200 mm accordion feature) to fund capital program and increase liquidity Issued $325 million 8 year bonds (due 2020) in September 2012 at 6.625% to term out revolver a
Slide 21: APL Distributable Cash Flow less Dependent on NGL Pricing
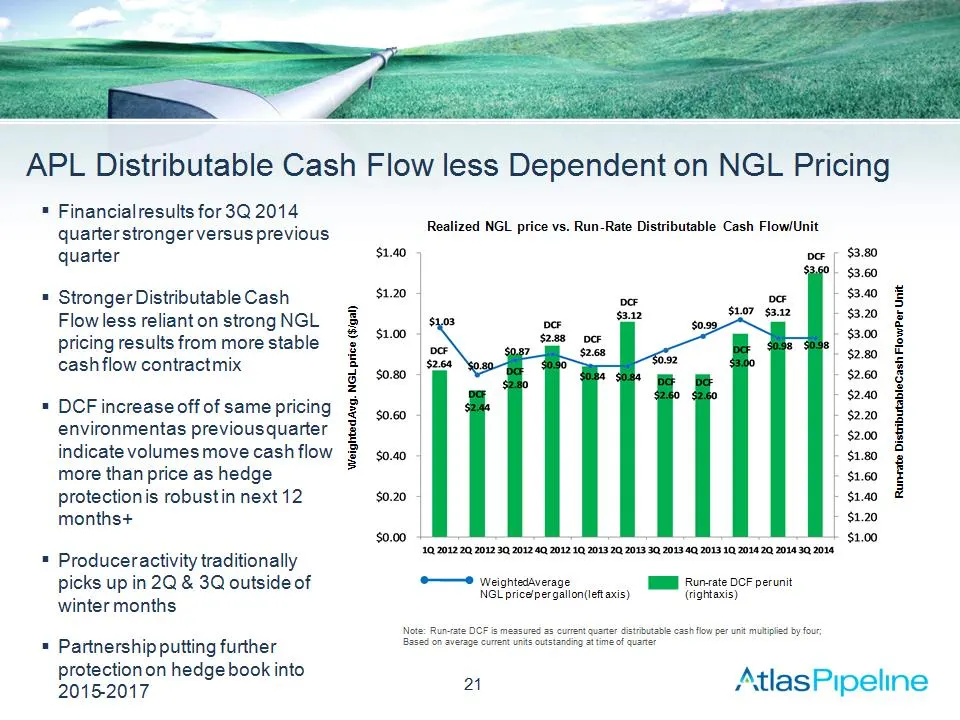
APL Distributable Cash Flow less Dependent on NGL Pricing Weighted Avg. NGL price ($/gal) Run-rate Distributable Cash Flow Per Unit Financial results for 3Q 2014 quarter stronger versus previous quarter Stronger Distributable Cash Flow less reliant on strong NGL pricing results from more stable cash
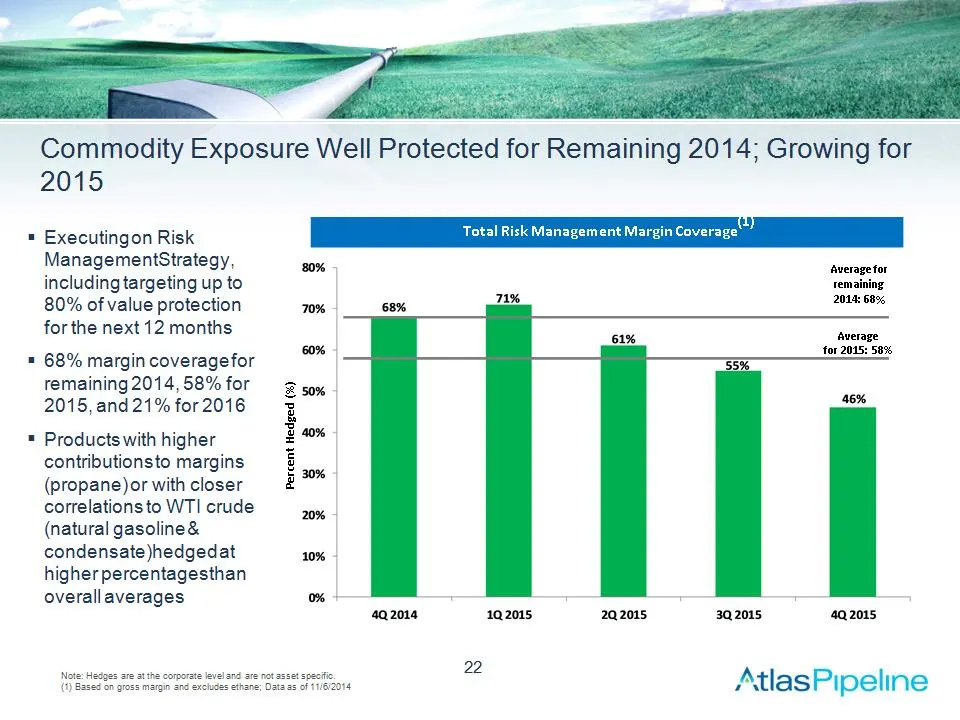
Slide 22: Commodity Exposure Well Protected for Remaining 2014; Growing for 2015
Commodity Exposure Well Protected for Remaining 2014; Growing for 2015 Total Risk Management Margin Coverage(1) Executing on Risk Management Strategy, including targeting up to 80% of value protection for the next 12 months 68% margin coverage for remaining 2014, 58% for 2015, and 21% for 2016 Produ
Slide 23: Targa – Atlas Proposed Transaction
Targa – Atlas Proposed Transaction *
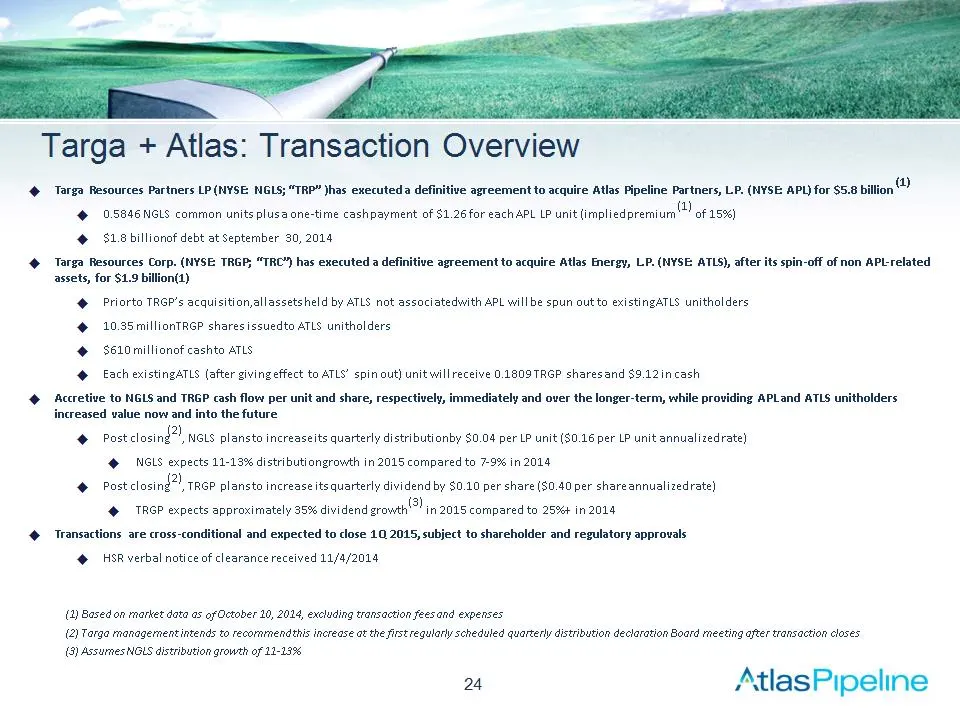
Slide 24: Targa + Atlas: Transaction Overview
Targa + Atlas: Transaction Overview * (1) Based on market data as of October 10, 2014, excluding transaction fees and expenses (2) Targa management intends to recommend this increase at the first regularly scheduled quarterly distribution declaration Board meeting after transaction closes (3) Assume
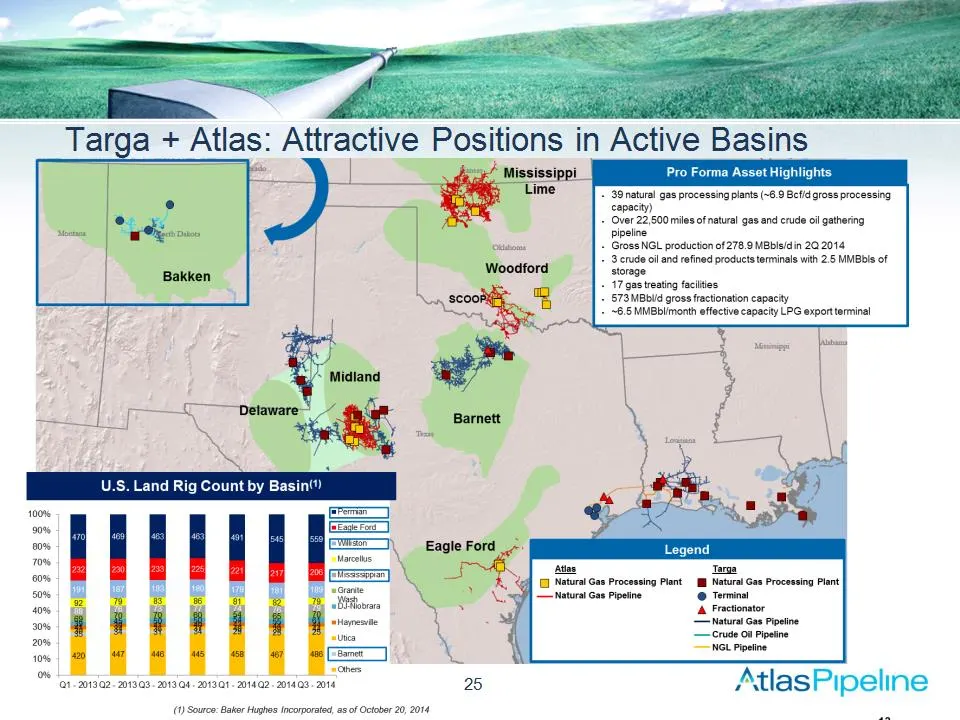
Slide 25: Targa + Atlas: Attractive Positions in Active Basins
Targa + Atlas: Attractive Positions in Active Basins *
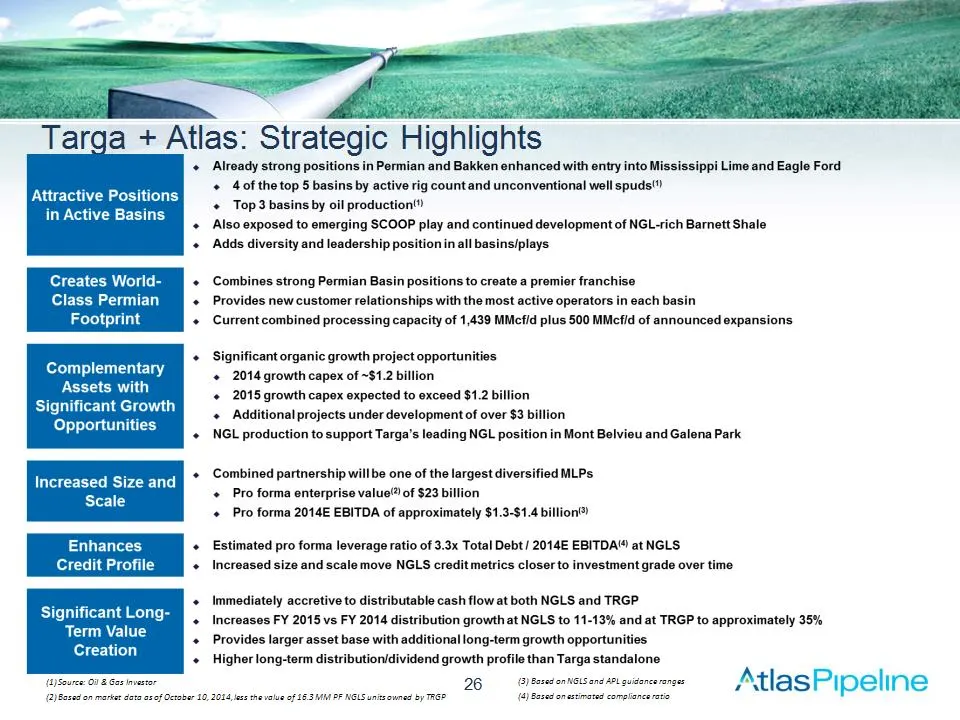
Slide 26: Targa + Atlas: Strategic Highlights
Targa + Atlas: Strategic Highlights * (1) Source: Oil & Gas Investor (2) Based on market data as of October 10, 2014, less the value of 16.3 MM PF NGLS units owned by TRGP (3) Based on NGLS and APL guidance ranges (4) Based on estimated compliance ratio
Slide 27: Appendix
Appendix 27 AtlasPipeline
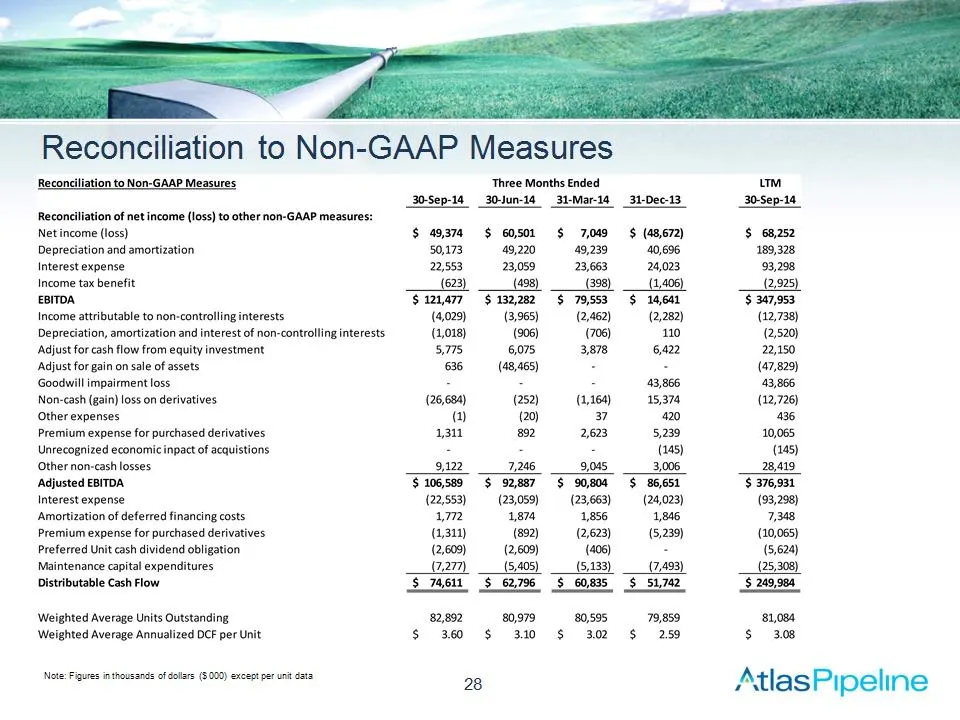
Slide 28: Reconciliation to Non-GAAP Measures
Reconciliation to Non-GAAP Measures Note: Figures in thousands of dollars ($ 000) except per unit data *
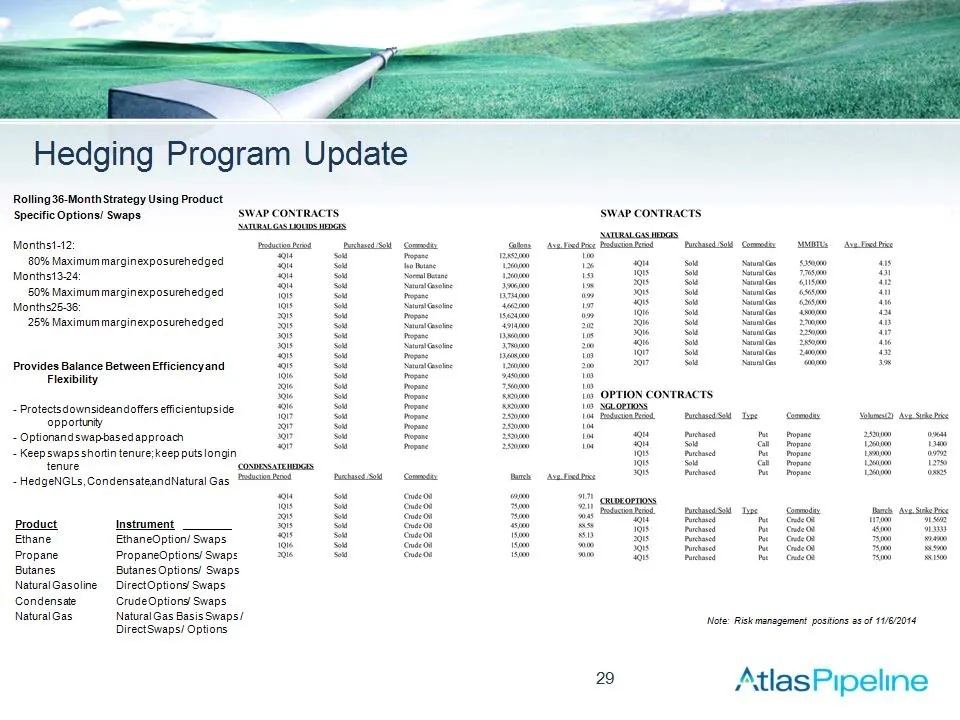
Slide 29: Hedging Program Update
Product Instrument ________ Ethane Ethane Option / Swaps Propane Propane Options / Swaps Butanes Butanes Options / Swaps Natural Gasoline Direct Options / Swaps Condensate Crude Options / Swaps Natural Gas Natural Gas Basis Swaps / Direct Swaps / Options Hedging Program Update Note: Risk management
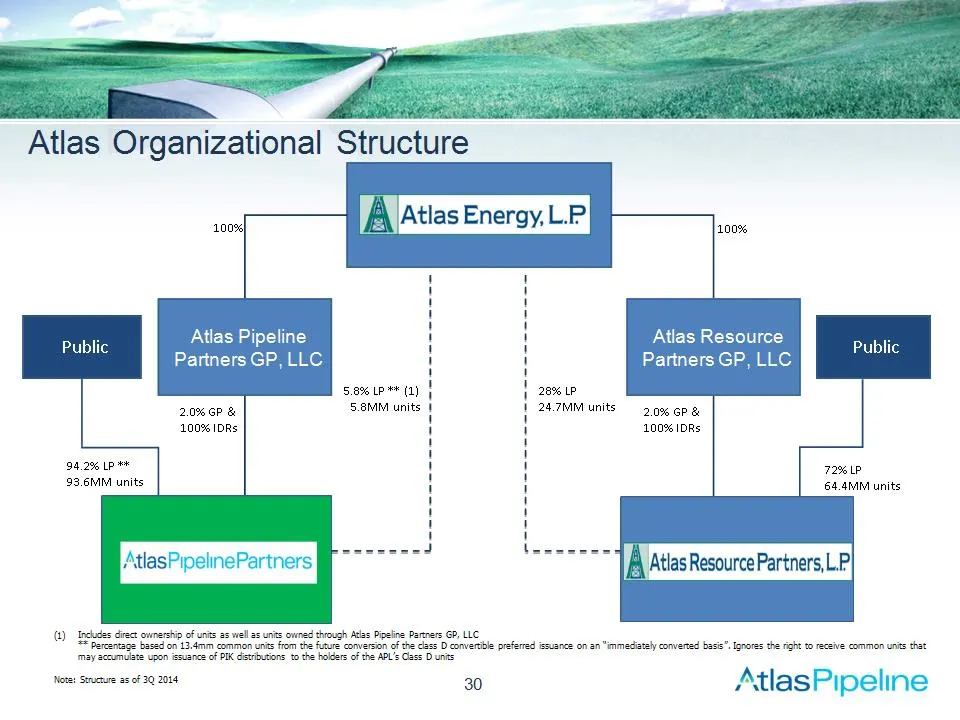
Slide 30: Atlas Organizational Structure
Atlas Organizational Structure * 2.0% GP & 100% IDRs 2.0% GP & 100% IDRs 100% 100% Atlas Resource Partners GP, LLC Atlas Pipeline Partners GP, LLC 5.8% LP ** (1) 5.8MM units 28% LP 24.7MM units Public 94.2% LP ** 93.6MM units Public 72% LP 64.4MM units Includes direct ownership of units as well as u
Source: SEC EDGAR · 425 filed Nov 12, 2014