FGX International Holdings LTD
FGX International — Investor Presentation (May 2008)
30 slides from FGX International's investor presentation, May 12, 2008
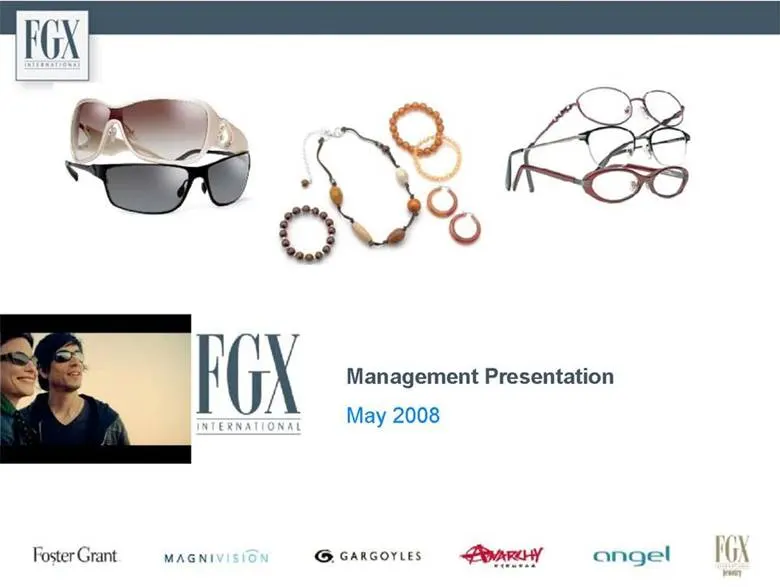
Slide 1: Management Presentation May 2008
Management Presentation May 2008
Slide 2: Special Note Regarding Forward-Looking Statements
SPECIAL NOTE REGARDING FORWARD-LOOKING STATEMENTS This presentation contains forward-looking statements (as defined in the Private Securities Litigation Reform Act of 1995) that are based on current expectations, estimates, forecasts and projections, as the case may be, and as such involve substanti
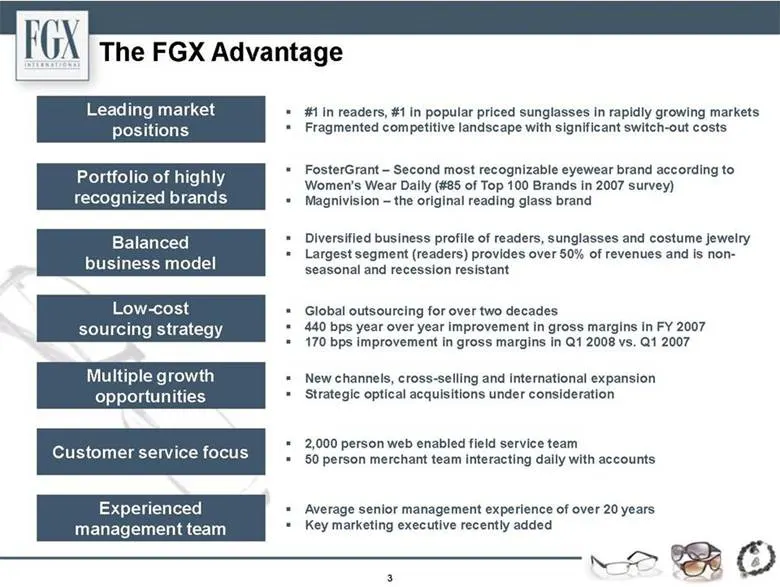
Slide 3: The FGX Advantage
The FGX Advantage Leading market positions #1 in readers, #1 in popular priced sunglasses in rapidly growing markets Fragmented competitive landscape with significant switch-out costs Portfolio of highly recognized brands FosterGrant – Second most recognizable eyewear brand according to Women’s Wear
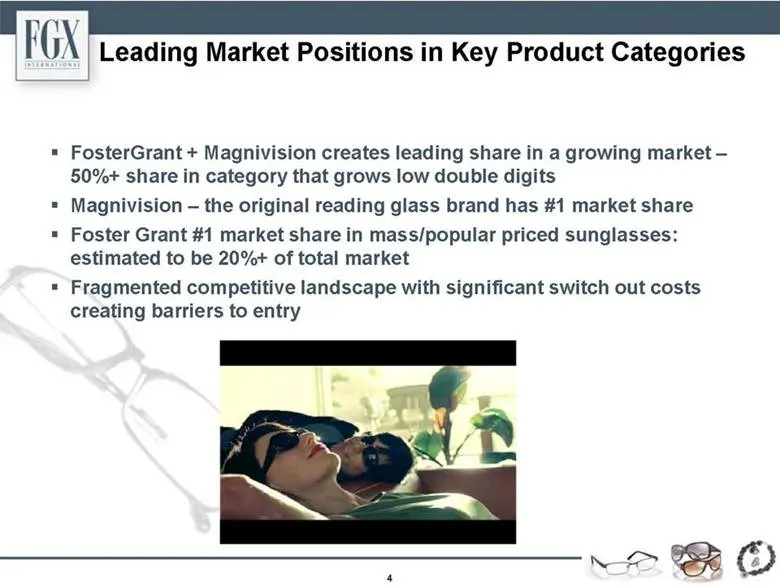
Slide 4: Leading Market Positions in Key Product Categories
Leading Market Positions in Key Product Categories FosterGrant + Magnivision creates leading share in a growing market – 50%+ share in category that grows low double digits Magnivision – the original reading glass brand has #1 market share Foster Grant #1 market share in mass/popular priced sunglass
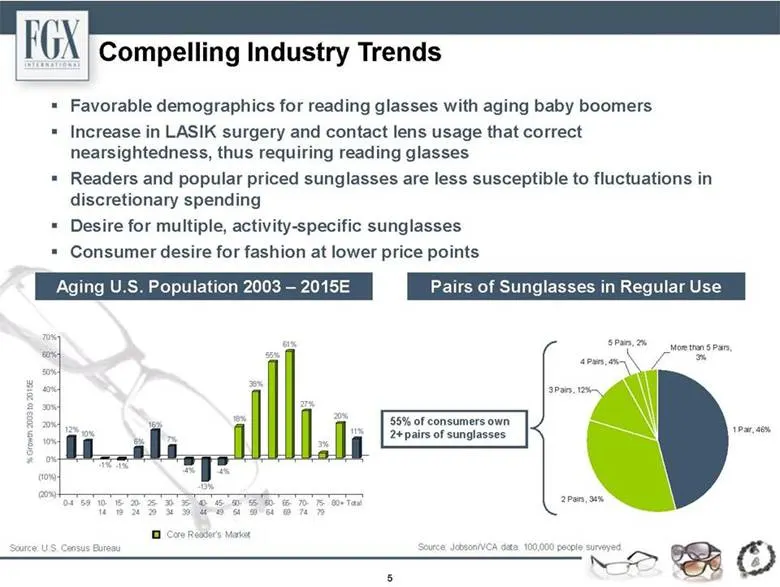
Slide 5: Compelling Industry Trends
Favorable demographics for reading glasses with aging baby boomers Increase in LASIK surgery and contact lens usage that correct nearsightedness, thus requiring reading glasses Readers and popular priced sunglasses are less susceptible to fluctuations in discretionary spending Desire for multiple, a
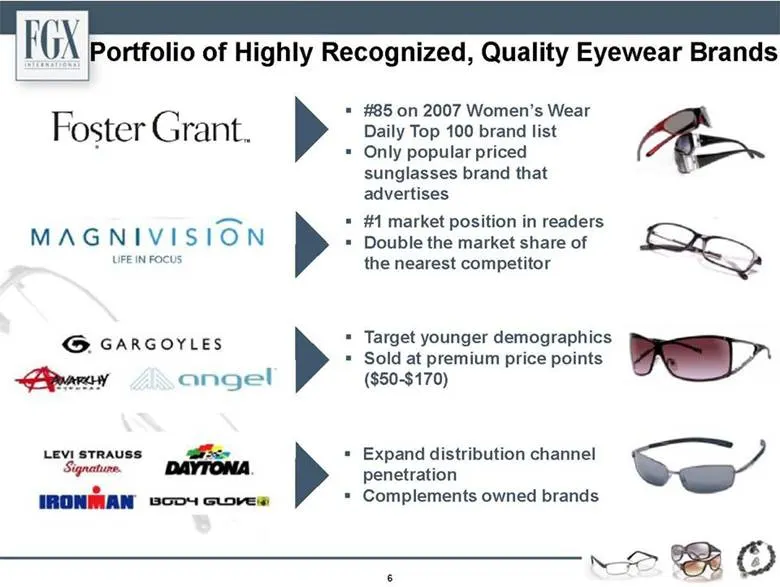
Slide 6: Portfolio of Highly Recognized, Quality Eyewear Brands
Portfolio of Highly Recognized, Quality Eyewear Brands #85 on 2007 Women’s Wear Daily Top 100 brand list Only popular priced sunglasses brand that advertises #1 market position in readers Double the market share of the nearest competitor Target younger demographics Sold at premium price points ($50-
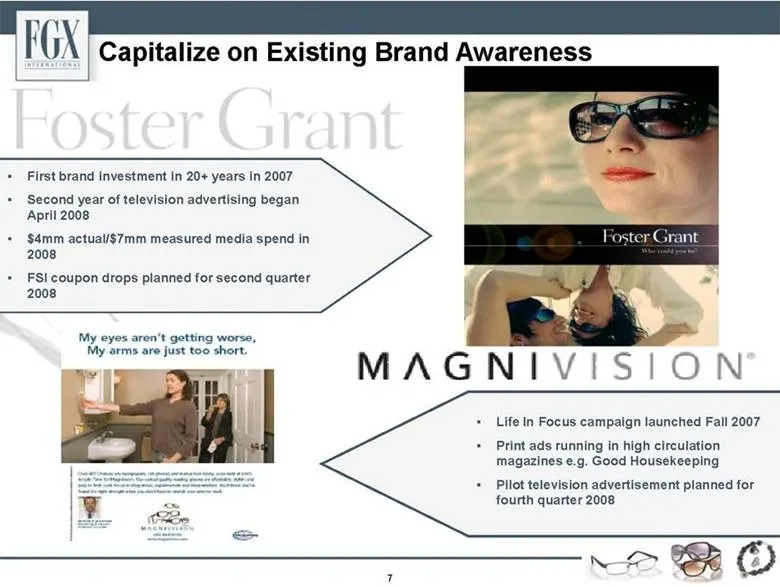
Slide 7: Capitalize on Existing Brand Awareness
Capitalize on Existing Brand Awareness First brand investment in 20+ years in 2007 • Second year of television advertising began April 2008 • $4mm actual/$7mm measured media spend in 2008 • FSI coupon drops planned for second quarter 2008 • Life In Focus campaign launched Fall 2007 • Print ads runni
Slide 8: Latest TV Advertisement
FOX) Latest TV Advertisement We B&O
Slide 9: Balanced Business Model
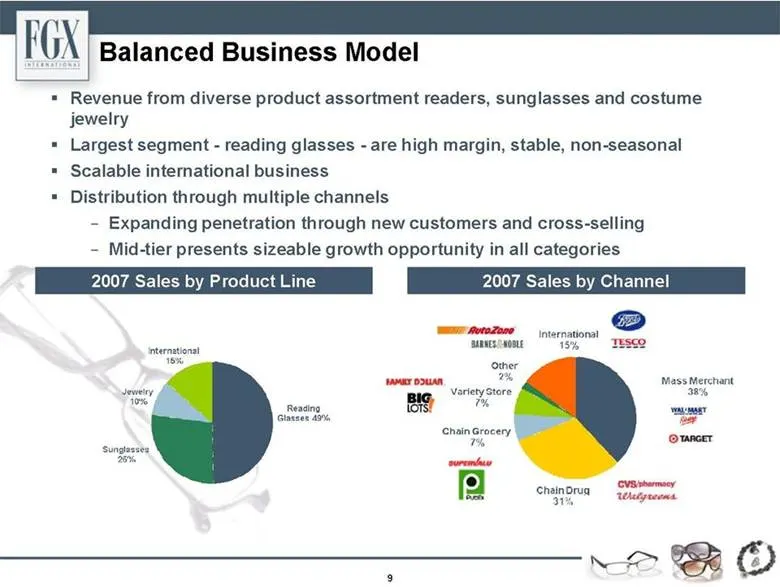
Balanced Business Model 2007 Sales by Product Line 2007 Sales by Channel Revenue from diverse product assortment readers, sunglasses and costume jewelry Largest segment - reading glasses - are high margin, stable, non-seasonal Scalable international business Distribution through multiple channels Ex
Slide 10: Efficient, Low Cost Sourcing Model
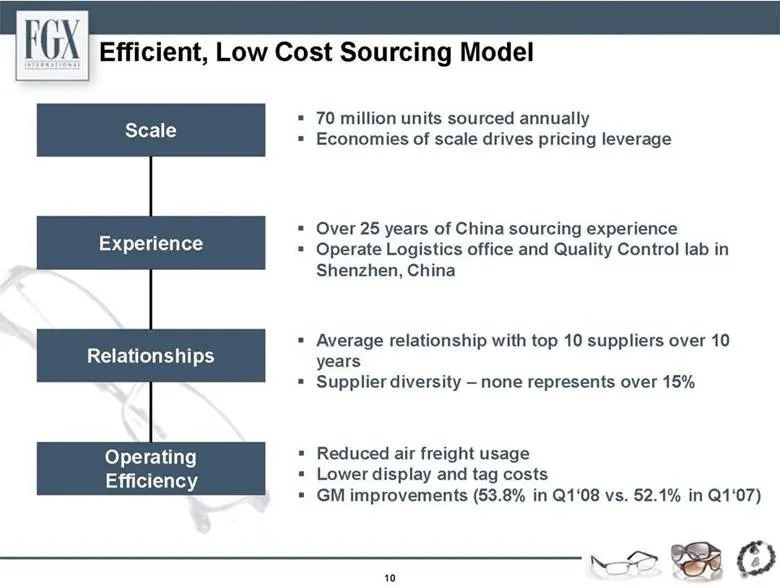
Efficient, Low Cost Sourcing Model Scale 70 million units sourced annually Economies of scale drives pricing leverage Experience Over 25 years of China sourcing experience Operate Logistics office and Quality Control lab in Shenzhen, China Relationships Average relationship with top 10 suppliers ove
Slide 11: Growth Strategies: a Multi-Pronged Approach
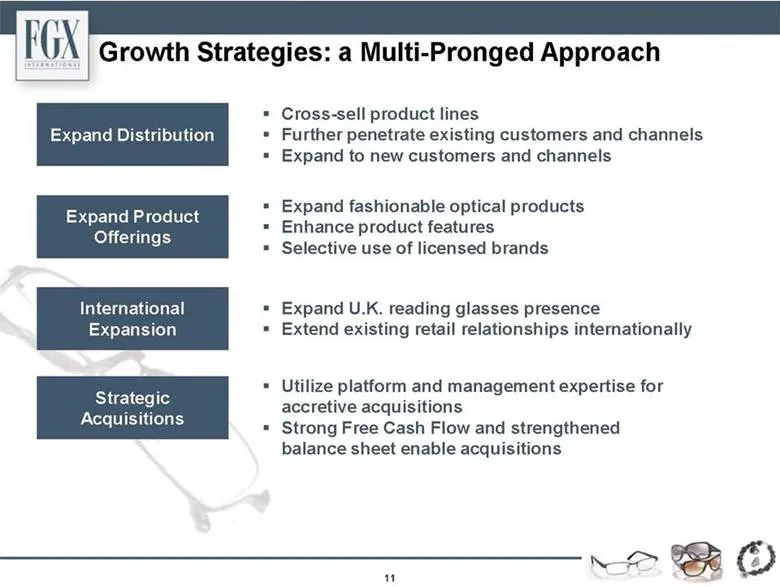
Expand Distribution Growth Strategies: a Multi-Pronged Approach Cross-sell product lines Further penetrate existing customers and channels Expand Product Offerings Expand to new customers and channels Expand fashionable optical products Enhance product features International Expansion Selective use
Slide 12: Jack Flynn, President
Jack Flynn President 12
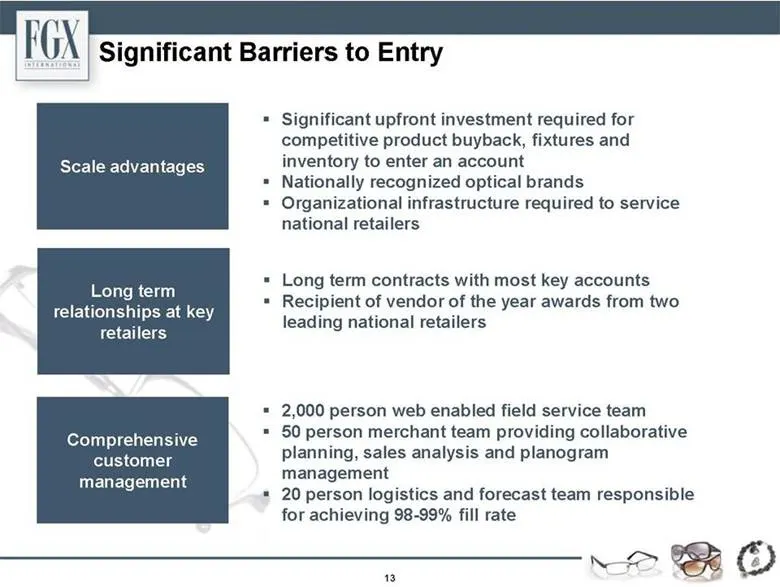
Slide 13: Significant Barriers to Entry
Significant Barriers to Entry Scale advantages Significant upfront investment required for competitive product buyback, fixtures and inventory to enter an account Nationally recognized optical brands Organizational infrastructure required to service national retailers Long term relationships at key
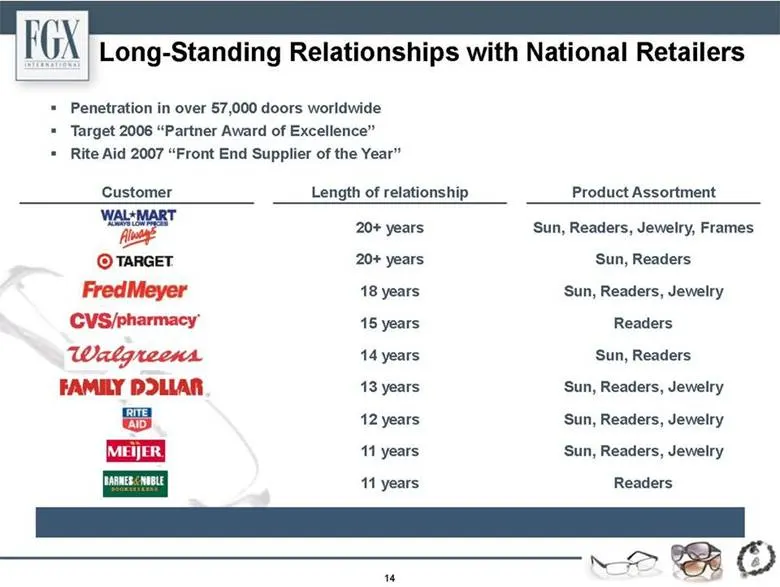
Slide 14: Long-Standing Relationships with National Retailers
Long-Standing Relationships with National Retailers Penetration in over 57,000 doors worldwide Target 2006 “Partner Award of Excellence” Rite Aid 2007 “Front End Supplier of the Year” Customer Length of relationship Product Assortment 20+ years Sun, Readers, Jewelry, Frames 20+ years Sun, Readers 18
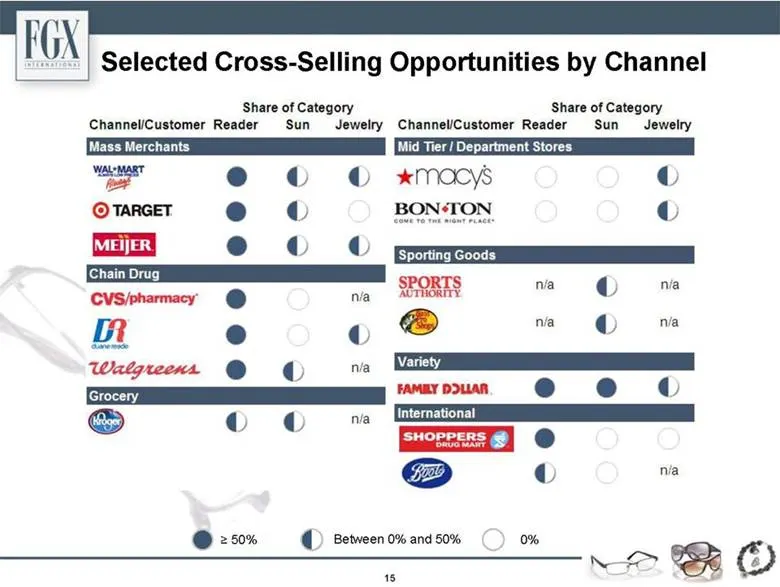
Slide 15: Selected Cross-Selling Opportunities by Channel
Selected Cross-Selling Opportunities by Channel Share of Category Channel/Customer Reader Sun Jewelry Share of Category Channel/Customer Reader Sun Jewlry Mass Merchants Mid Tier/Department Stores Chain Drug Sporting Goods Grocery Variety > 50% Between 0% and 50% 0% n/a n/a n/a n/a n/a n/a n/a n/a 1
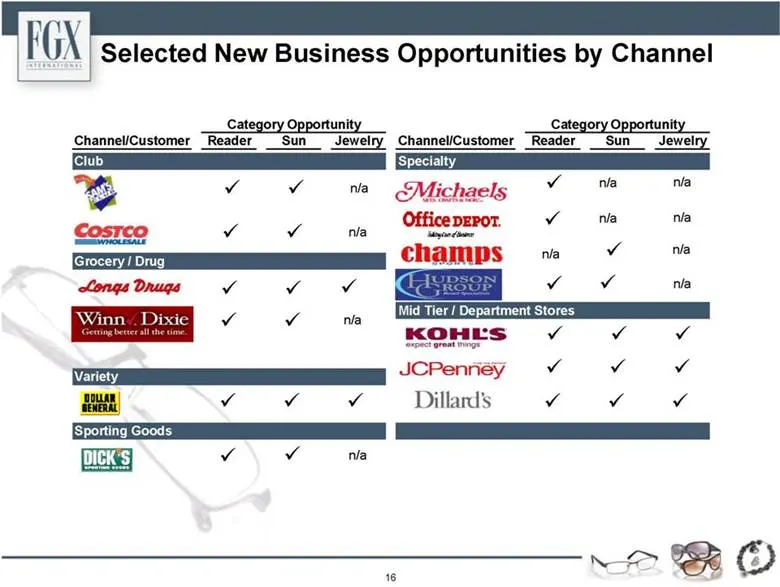
Slide 16: Selected New Business Opportunities by Channel
Selected New Business Opportunities by Channel Category Opportunity Category Opportunity Channel/Customer Reader Sun Jewelry Channel/Customer Reader Sun Jewelry Club Specialty Grocery / Drug Mid Tier / Department Stores Variety Sporting Goods n/ab n/ab n/ab n/ab n/ab n/ab n/ab n/ab n/ab n/ab n/ab 16
Slide 17: Recent Change for Wal-Mart Reader Business
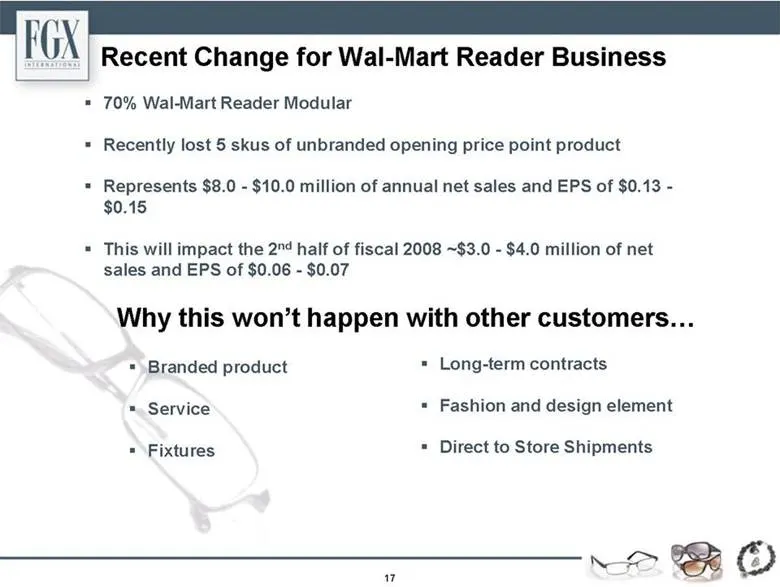
Recent Change for Wal-Mart Reader Business 70% Wal-Mart Reader Modular Recently lost 5 skus of unbranded opening price point product Represents $8.0 - $10.0 million of annual net sales and EPS of $0.13 - $0.15 This will impact the 2nd half of fiscal 2008 ~$3.0 - $4.0 million of net sales and EPS of
Slide 18: New Business Update
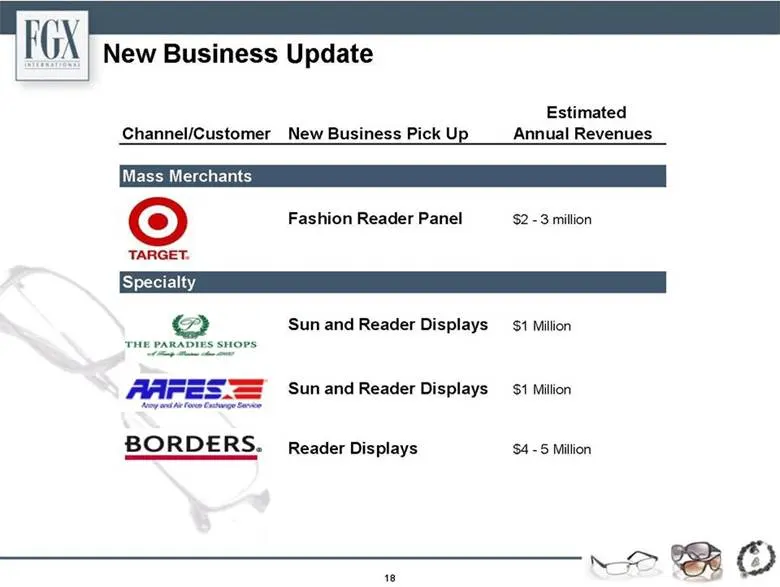
New Business Update Mass Merchants Fashion Reader Panel $2 - 3 million Specialty Sun and Reader Displays $1 Million Sun and Reader Displays $1 Million Reader Displays $4 - 5 Million Channel/Customer New Business Pick Up Estimated Annual Revenues 18
Slide 19: Financial Overview
Financial Overview Anthony DiPaola Executive Vice President Chief Financial Officer 19
Slide 20: Improved Capital Structure During 2007
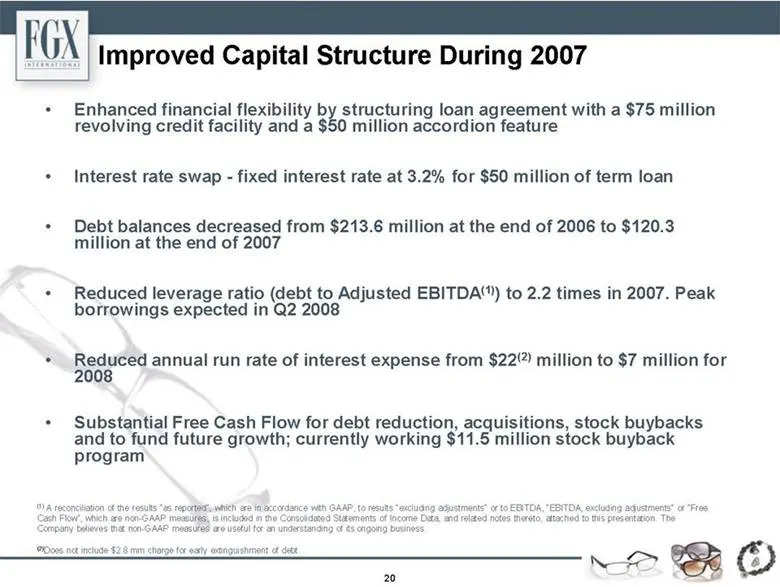
Improved Capital Structure During 2007 • Enhanced financial flexibility by structuring loan agreement with a $75 million revolving credit facility and a $50 million accordion feature • Interest rate swap - fixed interest rate at 3.2% for $50 million of term loan • Debt balances decreased from $213.6
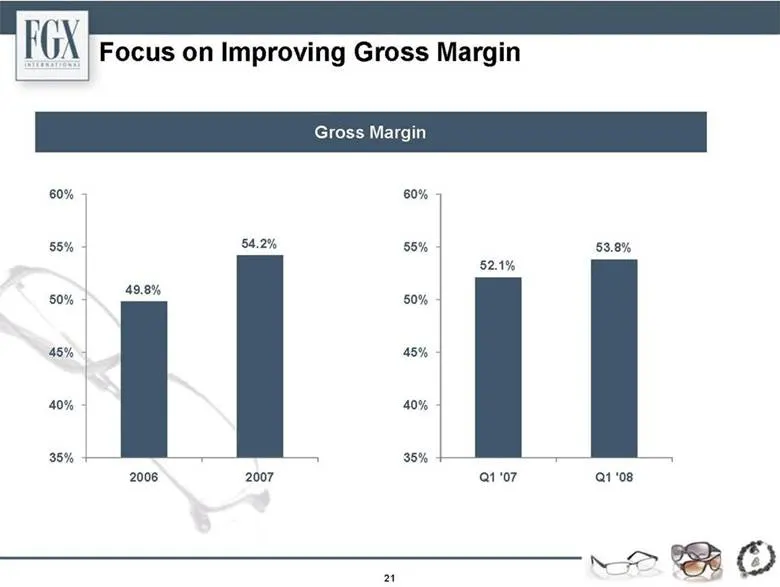
Slide 21: Focus on Improving Gross Margin
Focus on Improving Gross Margin Gross Margin 52.1% 53.8% 35% 40% 45% 50% 55% 60% Q1 '07 Q1 '08 49.8% 54.2% 35% 40% 45% 50% 55% 60% 2006 2007 21
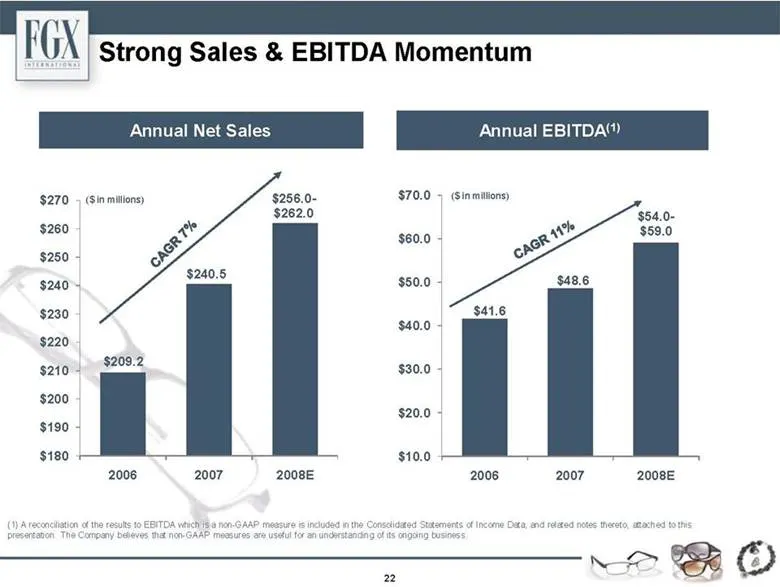
Slide 22: Strong Sales & EBITDA Momentum
Strong Sales & EBITDA Momentum Annual Net Sales ($ in millions) Annual EBITDA(1) (1) A reconciliation of the results to EBITDA which is a non-GAAP measure is included in the Consolidated Statements of Income Data, and related notes thereto, attached to this presentation. The Company believes that no
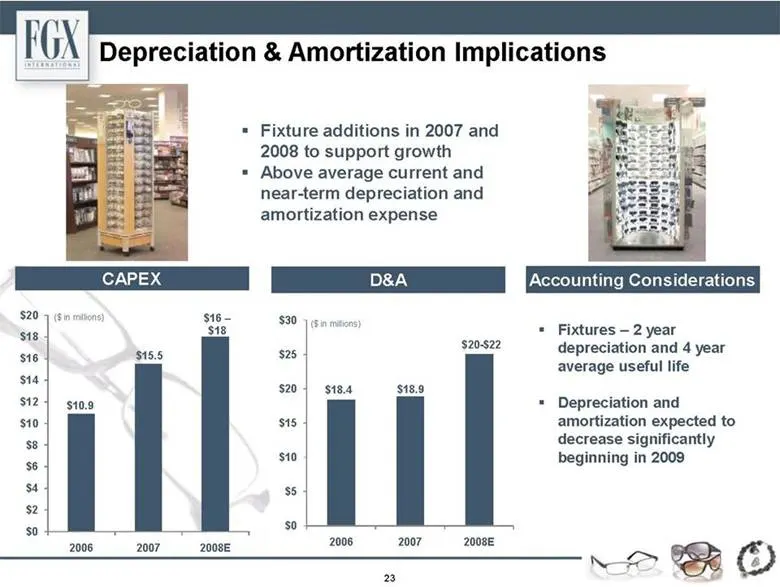
Slide 23: Depreciation & Amortization Implications
Depreciation & Amortization Implications Fixture additions in 2007 and 2008 to support growth Above average current and near-term depreciation and amortization expense CAPEX D&A $18.4 $18.9 $20-$22 $0 $5 $10 $15 $20 $25 $30 2006 2007 2008E $10.9 $15.5 $16 – $18 $0 $2 $4 $6 $8 $10 $12 $14 $16 $18 $20
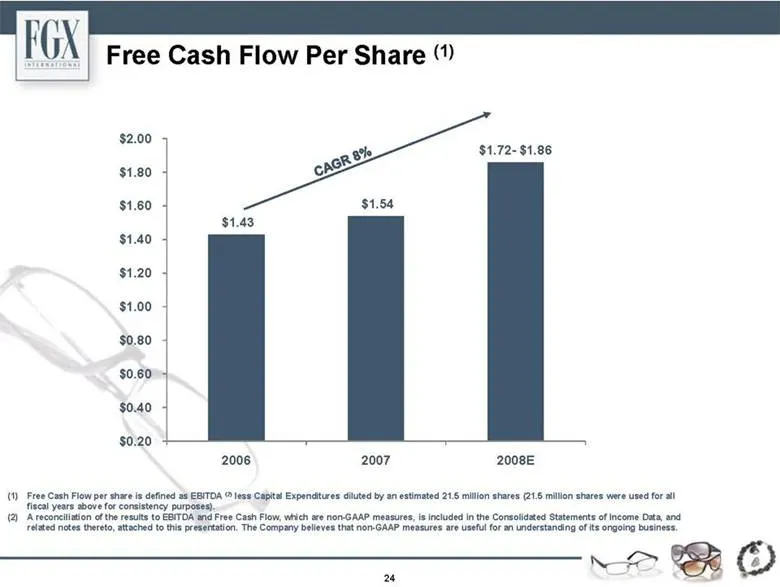
Slide 24: Free Cash Flow Per Share
Free Cash Flow Per Share (1) $1.43 $1.54 $1.72- $1.86 $0.20 $0.40 $0.60 $0.80 $1.00 $1.20 $1.40 $1.60 $1.80 $2.00 2006 2007 2008E (1) Free Cash Flow per share is defined as EBITDA (2) less Capital Expenditures diluted by an estimated 21.5 million shares (21.5 million shares were used for all fiscal
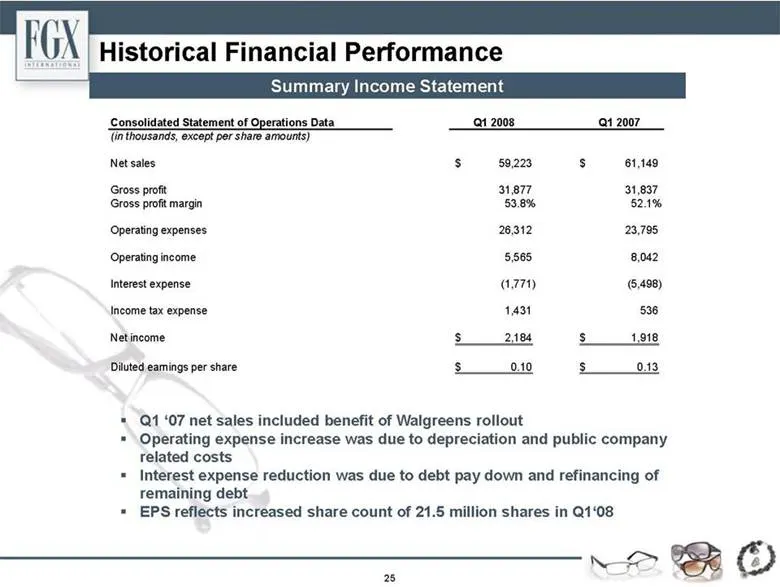
Slide 25: Historical Financial Performance Summary
Historical Financial Performance Summary Income Statement Consolidated Statement of Operations Data Q1 2008 Q1 2007 (in thousands, except per share amounts) Net sales 59,223 $ 61,149 $ Gross profit 31,877 31,837 Gross profit margin 53.8% 52.1% Operating expenses 26,312 23,795 Operating income 5,565
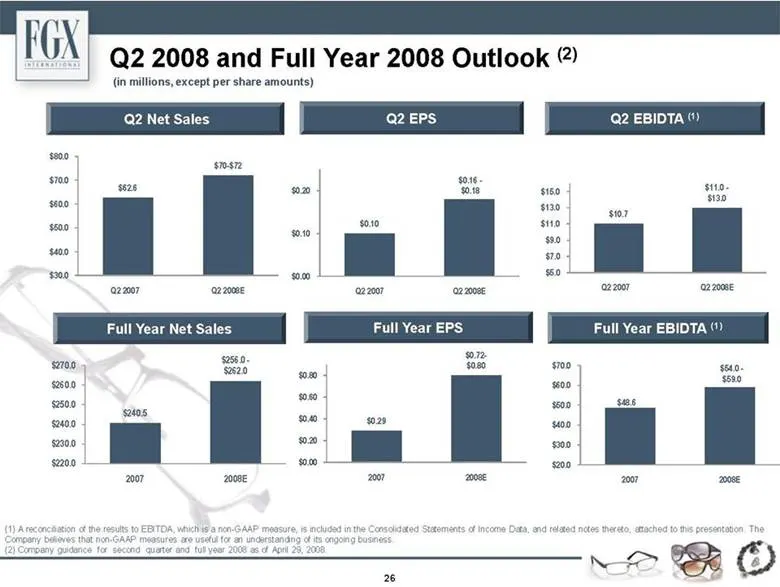
Slide 26: Q2 2008 and Full Year 2008 Outlook
Q2 2008 and Full Year 2008 Outlook (2) (in millions, except per share amounts) $0.29 $0.72- $0.80 $0.00 $0.20 $0.40 $0.60 $0.80 2007 2008E $62.6 $70-$72 $30.0 $40.0 $50.0 $60.0 $70.0 $80.0 Q2 2007 Q2 2008E Q2 2008 and Full Year 2008 Outlook (2) $240.5 $256.0 - $262.0 $220.0 $230.0 $240.0 $250.0 $260
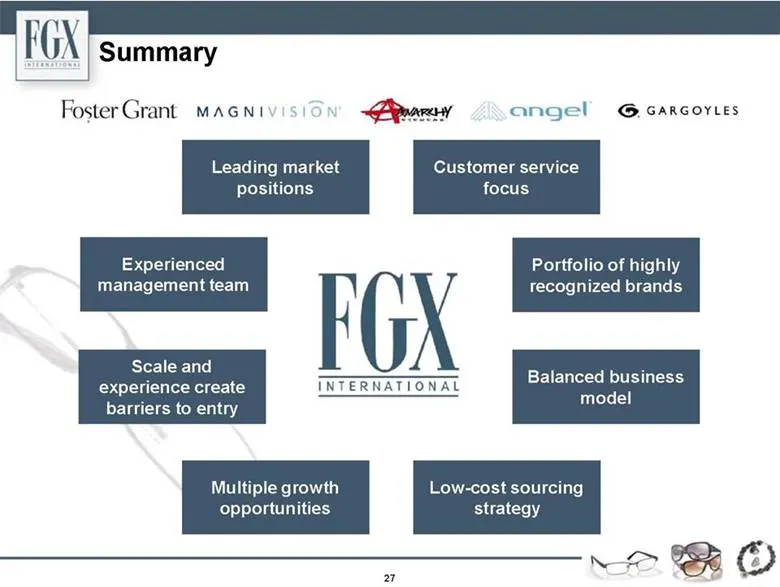
Slide 27: Summary
Summary Leading market positions Balanced business model Portfolio of highly recognized brands Low-cost sourcing strategy Scale and experience create barriers to entry Multiple growth opportunities Experienced management team Customer service focus 27
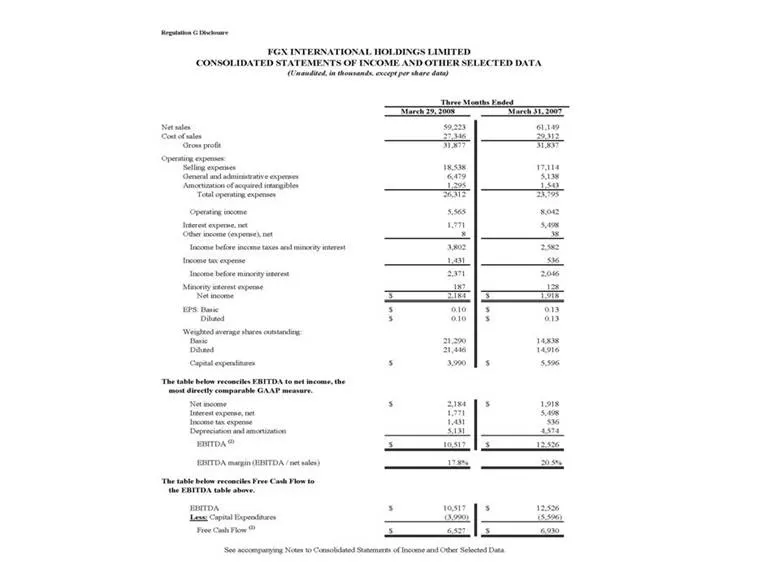
Slide 28: Regulation G Disclosure
Regulation G Disclosure March 29, 2008 March 31, 2007 Net sales 59,223 61,149 Cost of sales 27,346 29,312 Gross profit 31,877 31,837 Operating expenses: Selling expenses 18,538 17,114 General and administrative expenses 6,479 5,138 Amortization of acquired intangibles 1,295 1,543 Total operating exp
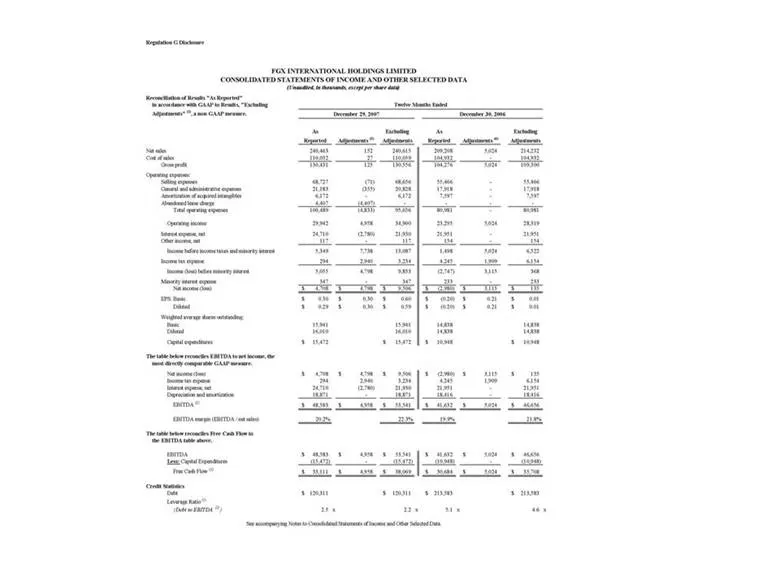
Slide 29: Regulation G Disclosure
Regulation G Disclosure Reconciliation of Results "As Reported" in accordance with GAAP to Results, "Excluding Adjustments" (1), a non-GAAP measure. As Excluding As Excluding Reported Adjustments (3) Adjustments Reported Adjustments (4) Adjustments Net sales 240,463 152 240,615 209,208 5,024 214,232
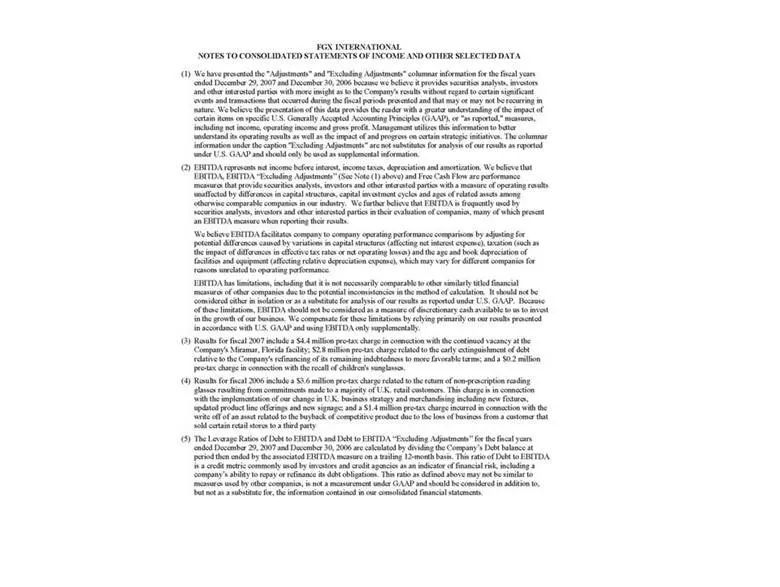
Slide 30: Notes to Consolidated Statements of Income and Other Selected Data
FGX INTERNATIONAL NOTES TO CONSOLIDATED STATEMENTS OF INCOME AND OTHER SELECTED DATA (1) We have presented the “Adjustments” and “Excluding Adjustments” columnar information for the fiscal years ended December 29, 2007 and December 30, 2006 because we believe it provides securities analysts, investo
Source: SEC EDGAR · 8-K filed May 12, 2008
More decks from FGX International Holdings LTD
 Investor Presentation (November 2009)24 slides · Nov 9, 2009
 Investor Presentation (September 2009)24 slides · Sep 22, 2009
 Oppenheimer Annual Consumer Conference 200930 slides · Jul 13, 2009
 Investor Presentation (June 2009)29 slides · Jun 26, 2009
 Investor Presentation (June 2009)26 slides · Jun 8, 2009
 Investor Presentation (May 2009)25 slides · May 28, 2009