Altra Industrial Motion — Q1 2020 Earnings Presentation
20 slides from Altra Industrial Motion's earnings presentation, Apr 30, 2020
Slide 1: First-Quarter 2020 Results
First-Quarter 2020 Results April 30, 2020 Exhibit 99.2
Slide 2: Q1 2020 Conference Call Details
Q1 2020 Conference Call Details Live Webcast April 30, 2020 10:00 AM ET Dial-In Number (866) 209-9085 Domestic (647) 689-5687 International Webcast at www.altramotion.com Replay Through May 14, 2020 (800) 585-8367 Domestic (416) 621-4642 International Conference ID: 5769568 Webcast Replay at www.alt
Slide 3: Safe Harbor Statement
Safe Harbor Statement Forward-Looking Statements All statements, other than statements of historical fact included in this release are forward-looking statements, as that term is defined in the Private Securities Litigation Reform Act of 1995. These statements include, but are not limited to, any st

Slide 4: Agenda and Speakers
Agenda and Speakers Executive Overview COVID-19 Response Market Review Q1 Financial Review & 2020 Guidance Concluding Remarks Q&A Carl Christenson Chairman & Chief Executive Officer Christian Storch Vice President & Chief Financial Officer
Slide 5: Q1 2020 Performance Highlights
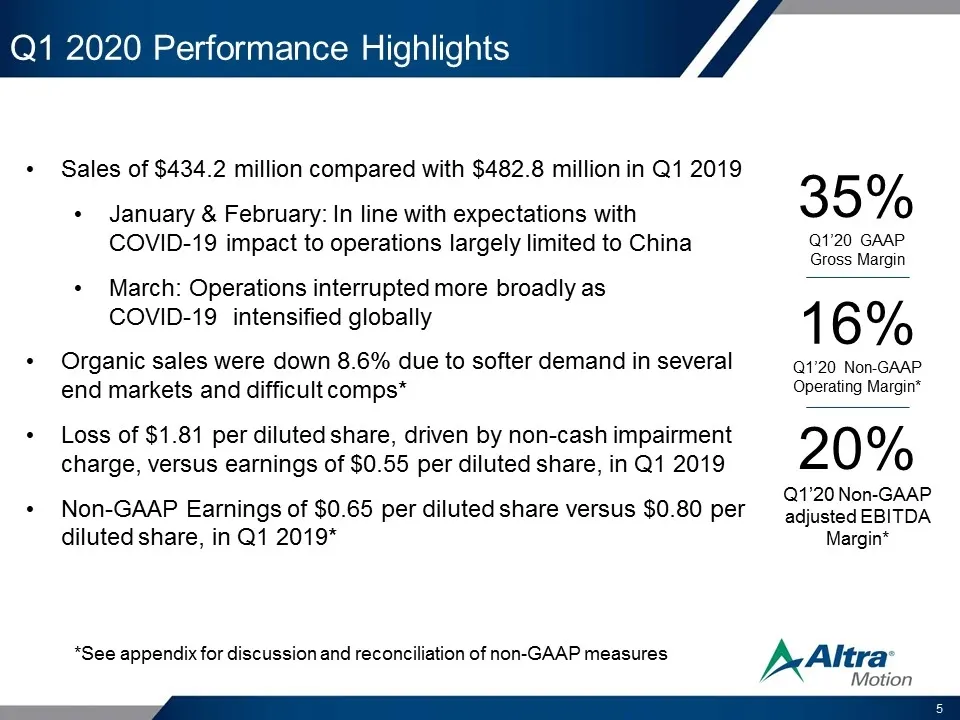
Q1 2020 Performance Highlights Sales of $434.2 million compared with $482.8 million in Q1 2019 January & February: In line with expectations with COVID-19 impact to operations largely limited to China March: Operations interrupted more broadly as COVID-19 intensified globally Organic sales were down
Slide 6: Resilient and Nimble COVID-19 Response
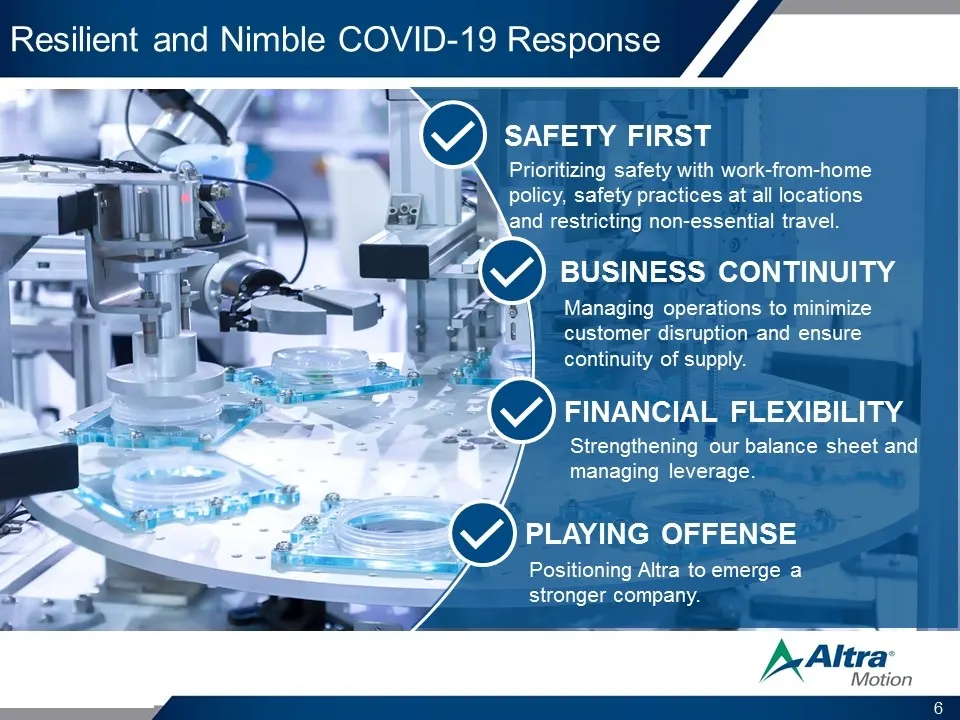
SAFETY FIRST FINANCIAL FLEXIBILITY Managing operations to minimize customer disruption and ensure continuity of supply. Strengthening our balance sheet and managing leverage. BUSINESS CONTINUITY Prioritizing safety with work-from-home policy, safety practices at all locations and restricting non-ess
Slide 7: Protecting our Hard-Working Employees
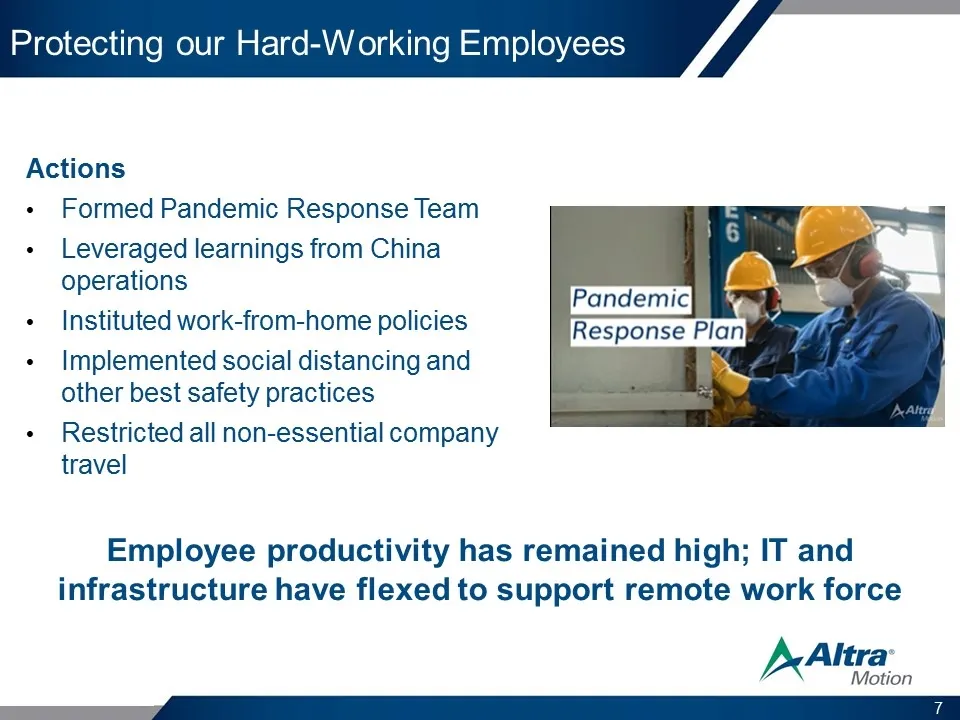
Protecting our Hard-Working Employees Actions Formed Pandemic Response Team Leveraged learnings from China operations Instituted work-from-home policies Implemented social distancing and other best safety practices Restricted all non-essential company travel Employee productivity has remained high;
Slide 8: Ensuring Business Continuity
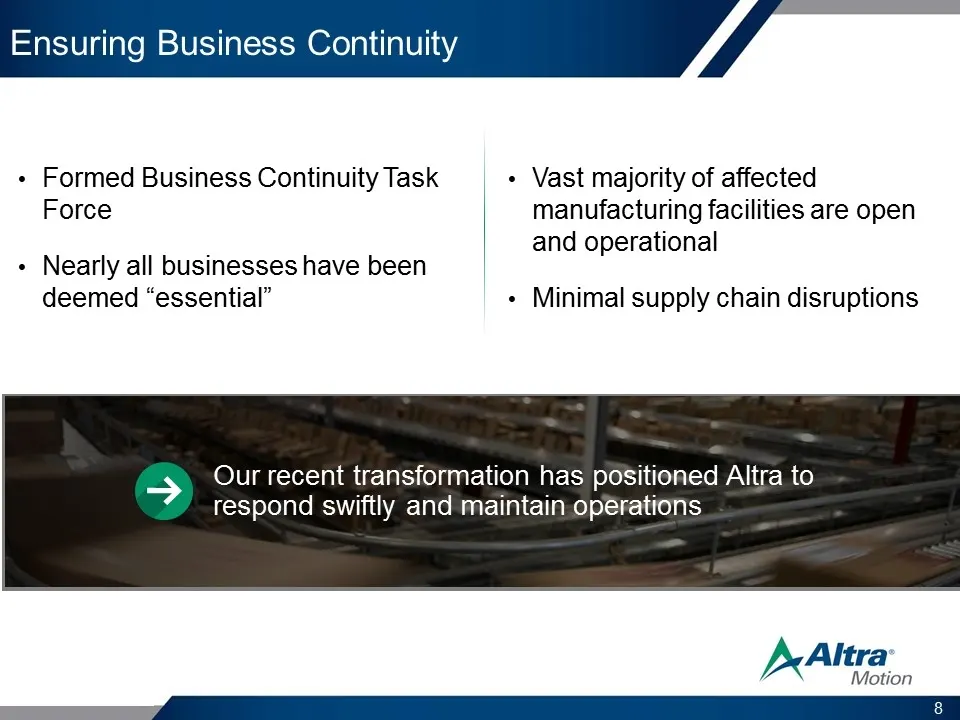
Ensuring Business Continuity Formed Business Continuity Task Force Nearly all businesses have been deemed “essential” Vast majority of affected manufacturing facilities are open and operational Minimal supply chain disruptions Our recent transformation has positioned Altra to respond swiftly and mai
Slide 9: Playing our Part in the Fight Against COVID-19
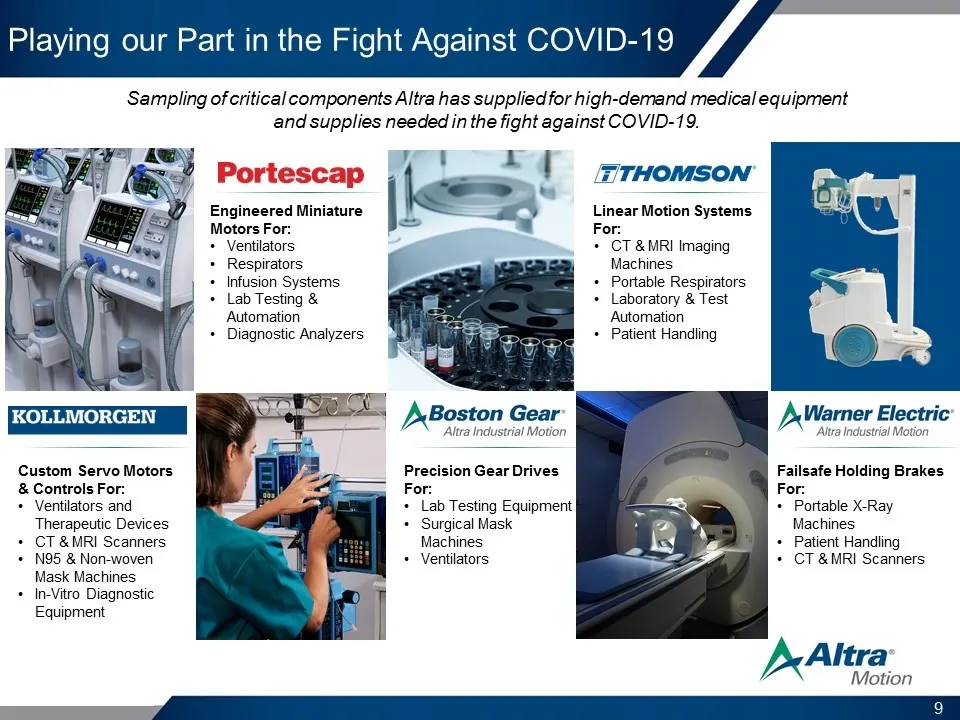
Playing our Part in the Fight Against COVID-19 Custom Servo Motors & Controls For: Ventilators and Therapeutic Devices CT & MRI Scanners N95 & Non-woven Mask Machines In-Vitro Diagnostic Equipment Engineered Miniature Motors For: Ventilators Respirators Infusion Systems Lab Testing & Automation Diag
Slide 10: Managing Costs and Liquidity
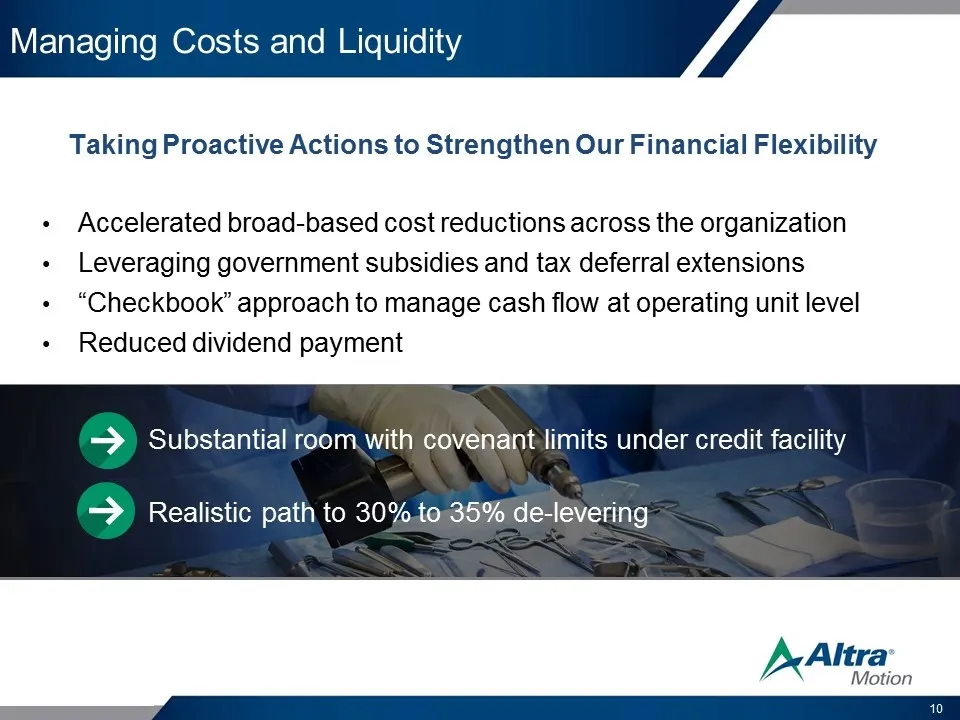
Managing Costs and Liquidity Accelerated broad-based cost reductions across the organization Leveraging government subsidies and tax deferral extensions “Checkbook” approach to manage cash flow at operating unit level Reduced dividend payment Taking Proactive Actions to Strengthen Our Financial Flex
Slide 11: Positioning Altra for the Post-COVID-19 World
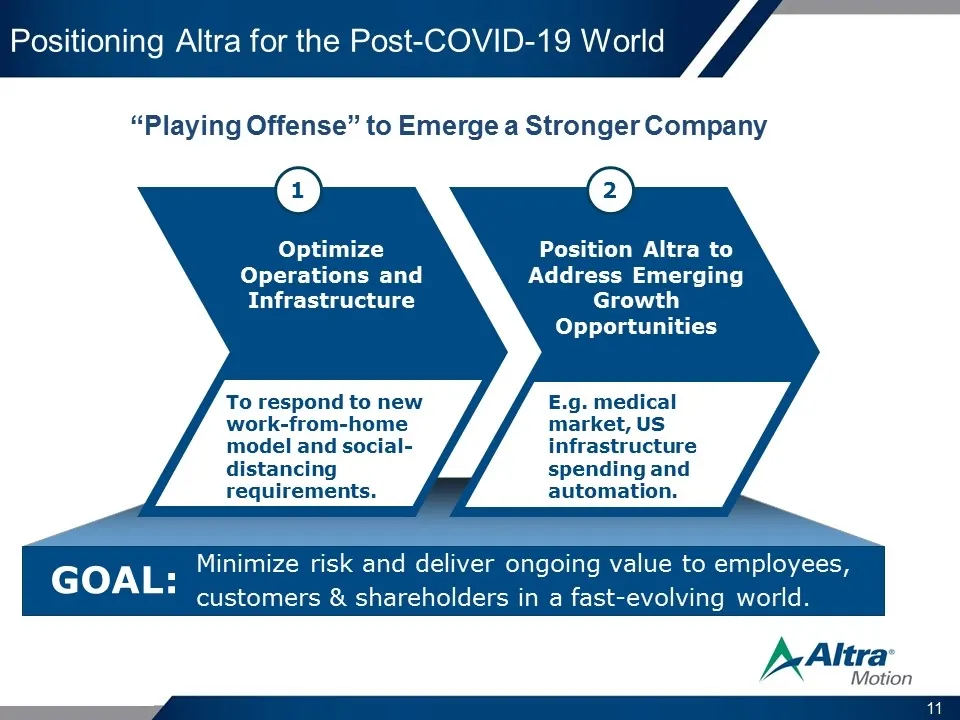
Positioning Altra for the Post-COVID-19 World Optimize Operations and Infrastructure 1 leverage installed base Position Altra to Address Emerging Growth Opportunities 2 Minimize risk and deliver ongoing value to employees, customers & shareholders in a fast-evolving world. To respond to new work-fro
Slide 12: Q1 2020 Key End-Market Drivers
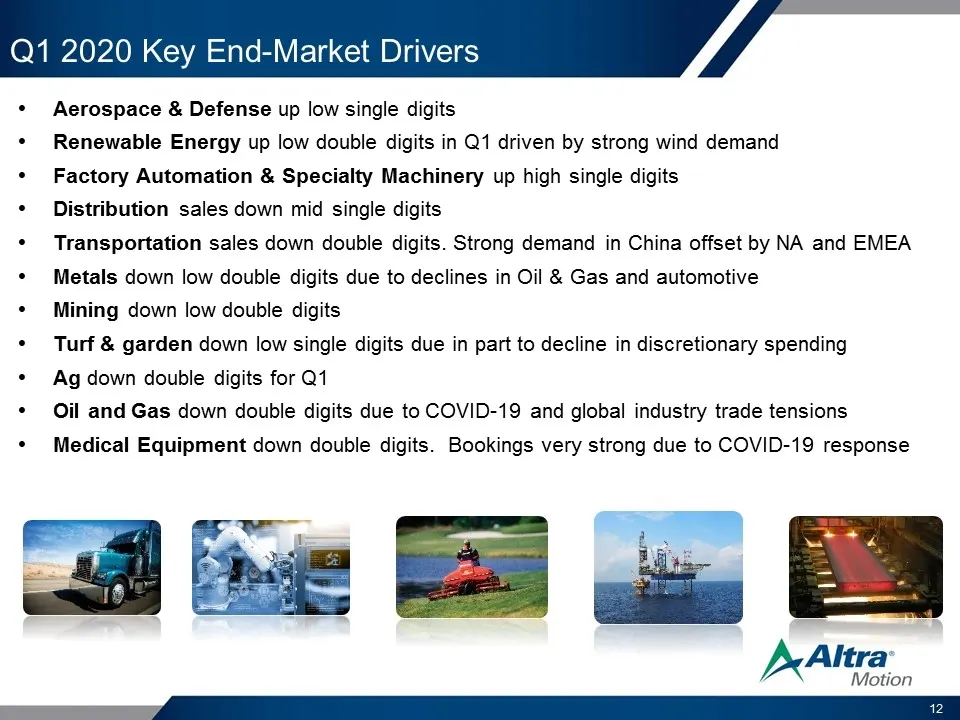
Q1 2020 Key End-Market Drivers Aerospace & Defense up low single digits Renewable Energy up low double digits in Q1 driven by strong wind demand Factory Automation & Specialty Machinery up high single digits Distribution sales down mid single digits Transportation sales down double digits. Strong de
Slide 13: Balance Sheet Highlights
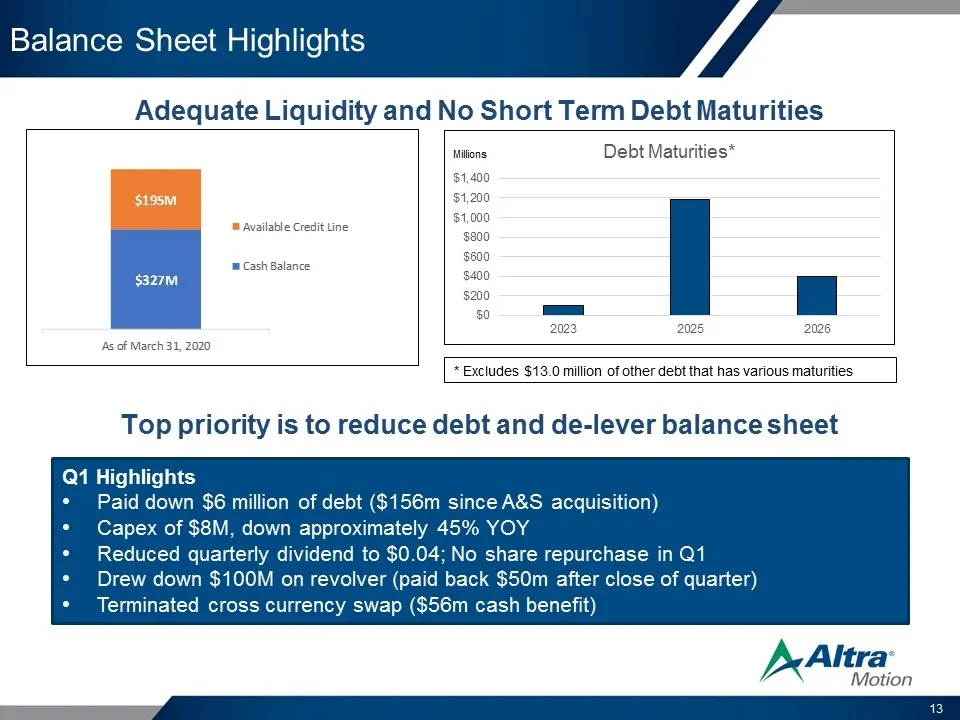
Balance Sheet Highlights Q1 Highlights Paid down $6 million of debt ($156m since A&S acquisition) Capex of $8M, down approximately 45% YOY Reduced quarterly dividend to $0.04; No share repurchase in Q1 Drew down $100M on revolver (paid back $50m after close of quarter) Terminated cross currency swap
Slide 14: Q1 2020 Financial Highlights
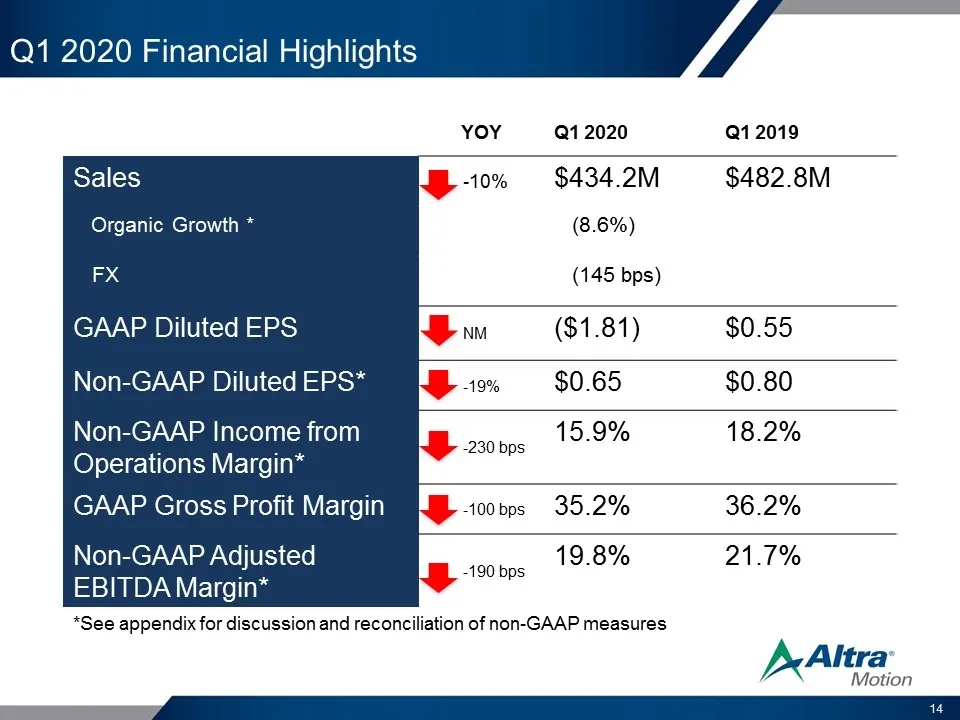
Q1 2020 Financial Highlights YOY Q1 2020 Q1 2019 Sales -10% $434.2M $482.8M Organic Growth * (8.6%) FX (145 bps) GAAP Diluted EPS NM ($1.81) $0.55 Non-GAAP Diluted EPS* -19% $0.65 $0.80 Non-GAAP Income from Operations Margin* -230 bps 15.9% 18.2% GAAP Gross Profit Margin -100 bps 35.2% 36.2% Non-GAA
Slide 15: 2020 Guidance – Updated 3/31/2020
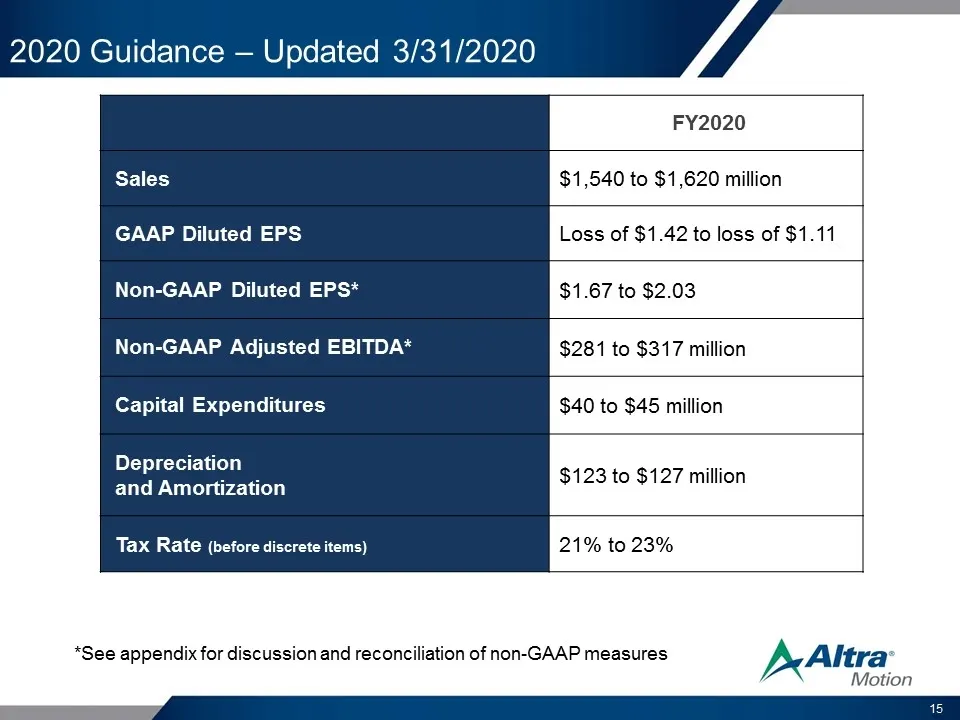
2020 Guidance – Updated 3/31/2020 FY2020 Sales $1,540 to $1,620 million GAAP Diluted EPS Loss of $1.42 to loss of $1.11 Non-GAAP Diluted EPS* $1.67 to $2.03 Non-GAAP Adjusted EBITDA* $281 to $317 million Capital Expenditures $40 to $45 million Depreciation and Amortization $123 to $127 million Tax R
Slide 16: Positioned to Navigate Challenges Ahead
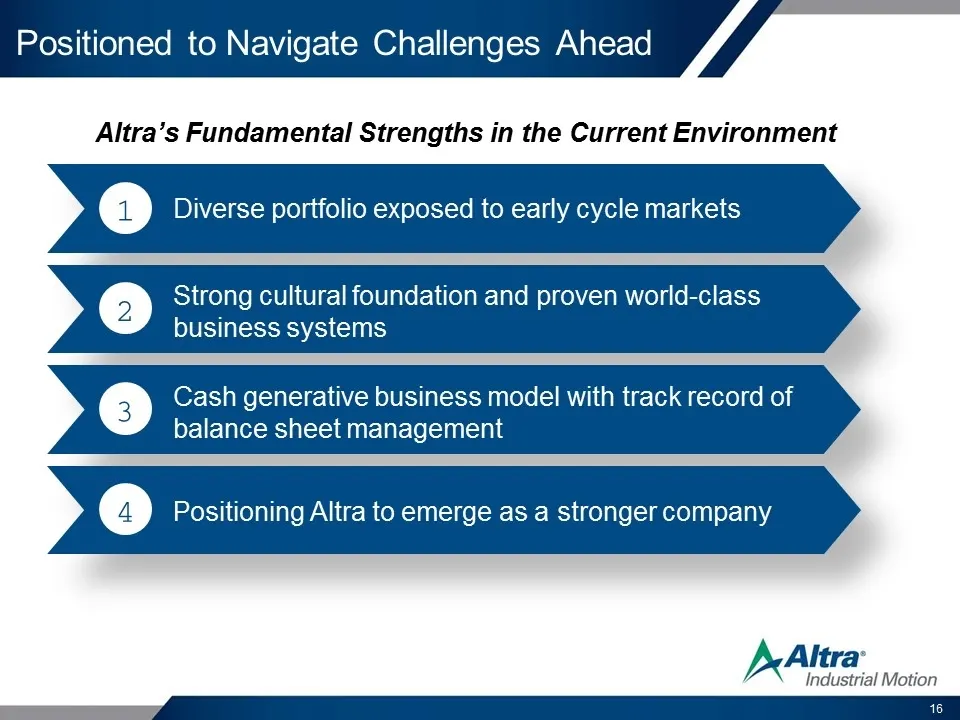
Diverse portfolio exposed to early cycle markets 1 Strong cultural foundation and proven world-class business systems 2 Cash generative business model with track record of balance sheet management 3 Positioning Altra to emerge as a stronger company 4 Positioned to Navigate Challenges Ahead Altra’s F
Slide 17: Discussion of Non-GAAP Measures
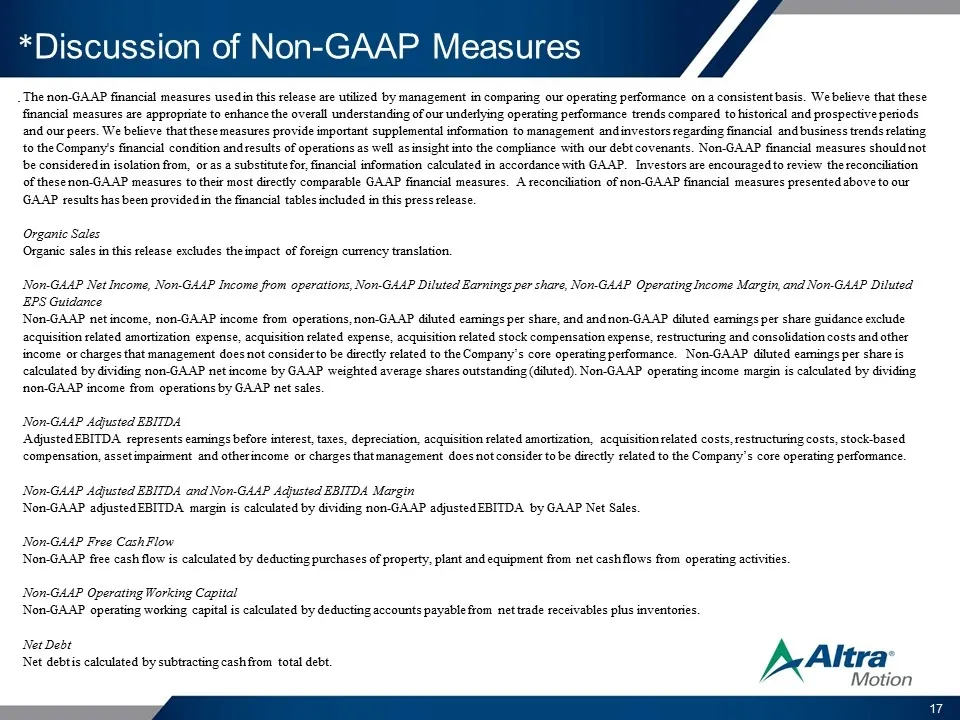
*Discussion of Non-GAAP Measures . The non-GAAP financial measures used in this release are utilized by management in comparing our operating performance on a consistent basis. We believe that these financial measures are appropriate to enhance the overall understanding of our underlying operating p
Slide 18: Appendix Non-GAAP Measures: Net Income
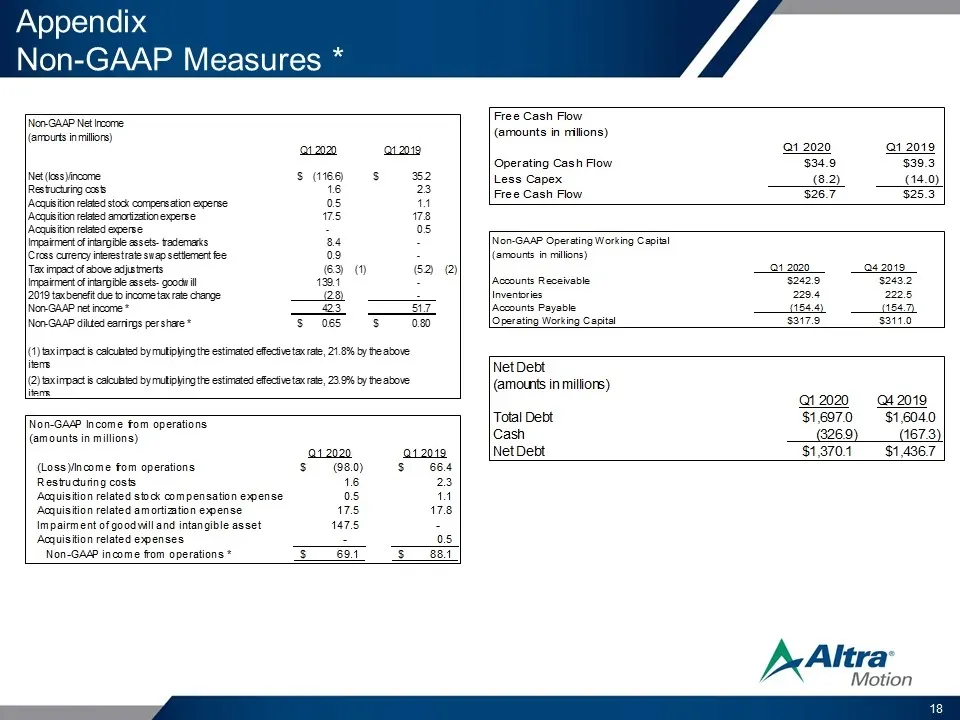
Appendix Non-GAAP Measures * Non-GAAP Net Income (amounts in millions) Q1 2020 Q1 2019 Net (loss)/income $(116.6) $35.2 Restructuring costs 1.6 2.3 Acquisition related stock compensation expense 0.5 1.1 Acquisition related amortization expense 17.5 17.8 Acquisition related expense - 0.5 Impairment o
Slide 19: Appendix Non-GAAP Income from Operations by Segment
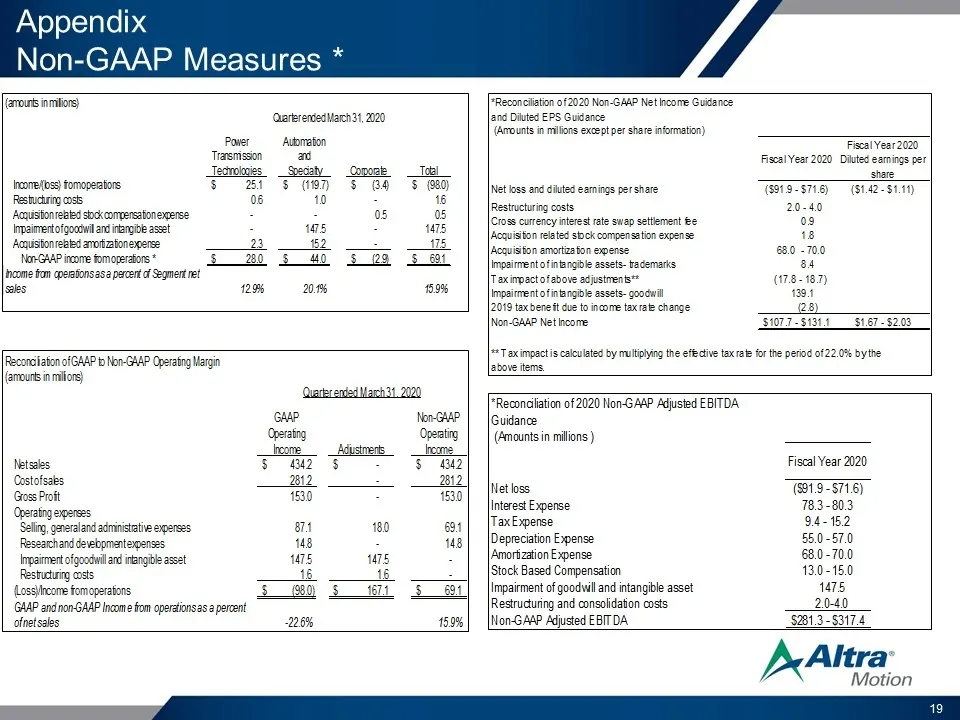
Appendix Non-GAAP Measures * Non-GAAP Income from operations by Segment (amounts in millions) Quarter ended March 31, 2020 Power Transmission Technologies Automation and Specialty Corporate Total Income/(loss) from operations $25.1 $(119.7) $(3.4) $(98.0) Restructuring costs 0.6 1.0 - 1.6 Acquisitio
Slide 20: Non-GAAP Adjusted EBITDA
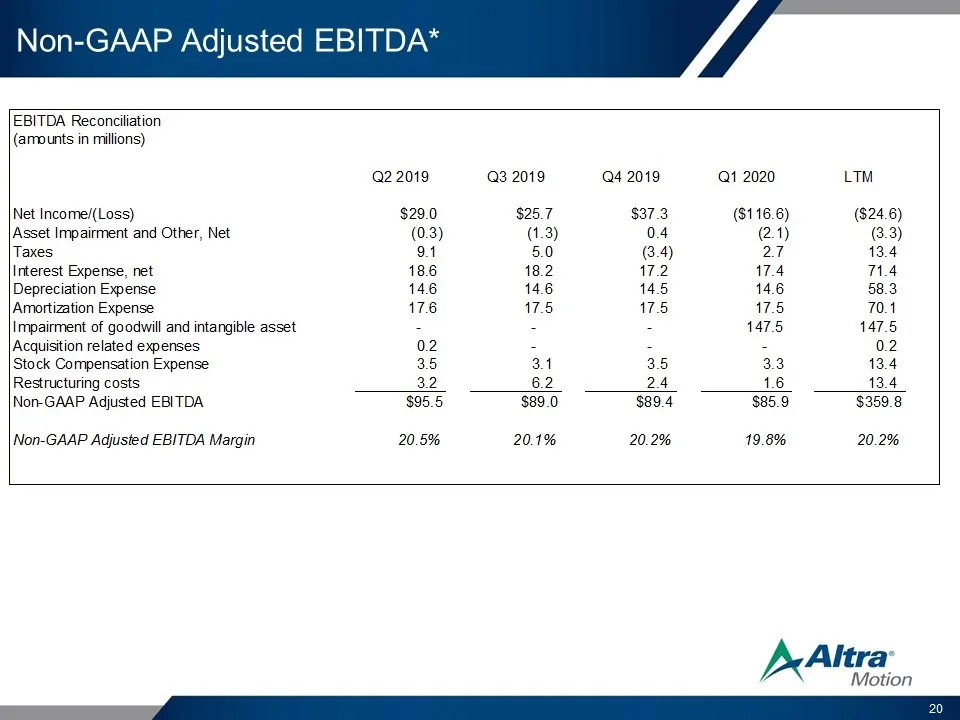
Non-GAAP Adjusted EBITDA* EBITDA Reconciliation (amounts in millions) Q2 2019 Q3 2019 Q4 2019 Q1 2020 LTM Net Income/(Loss) $29.0 $25.7 $37.3 ($116.6) ($24.6) Asset Impairment and Other, Net (0.3) (1.3) 0.4 (2.1) (3.3) Taxes 9.1 5.0 (3.4) 2.7 13.4 Interest Expense, net 18.6 18.2 17.2 17.4 71.4 Depre
Source: SEC EDGAR · 8-K filed Apr 30, 2020
More decks from Altra Industrial Motion Corp
 Q2 2022 Earnings Presentation25 slides · Jul 28, 2022
 Q1 2022 Earnings Presentation25 slides · Apr 28, 2022
 Investor Day (March 2022)135 slides · Mar 11, 2022
 Q4 2021 Earnings Presentation17 slides · Feb 16, 2022
 Q3 2021 Earnings Presentation16 slides · Oct 22, 2021
 Q2 2021 Earnings Presentation16 slides · Jul 23, 2021