PDC Energy — Petroleum Development — EnerCom, Inc. The Oil & Services Conference VIII (February 2010)
26 slides from PDC Energy's conference presentation, Feb 18, 2010

Slide 1: Petroleum Development Corporation - EnerCom Oil & Services Conference VIII
NASDAQ:PETD PETROLEUM DEVELOPMENT CORPORATION EnerCom, Inc. The Oil & Services Conference VIII February 18,

Slide 2: Forward-looking statements
The following information contains forward-looking statements within the meaning of the Private Securities Litigation Reform Act of 1995. These forward-looking statements are based on Management’s current expectations and beliefs, as well as a number of assumptions concerning future events. These st

Slide 3: Richard W. McCullough, Chairman and Chief Executive Officer
Richard W. McCullough Chairman and Chief Executive Officer

Slide 4: Reasons to Invest in PDC
Reasons to Invest in PDC • Long term track record of operational excellence • Long life reserves with reserve life index of appx 20 yrs • Diversified operating basins with low risk predictable growth (over 2,200 projects in inventory) • Emerging opportunity in the Marcellus Shale • Strong balance sh

Slide 5: Corporate Summary and Capitalization
Corporate Summary Enterprise Value Capitalization Share Price (2/12/10) $ 21.20 Diluted Share Outstanding (MM) 19.2 Market Capitalization ($MM) $ 408 Total Debt @ 9/30/09 307 Minority Interest (1) @ 9/30/09 45 Less: Cash @ 9/30/09 (22) Enterprise Value @ 9/30/09 $ 738 52-Week High ($/share) $ 23.06
Slide 6: Core Operating Regions
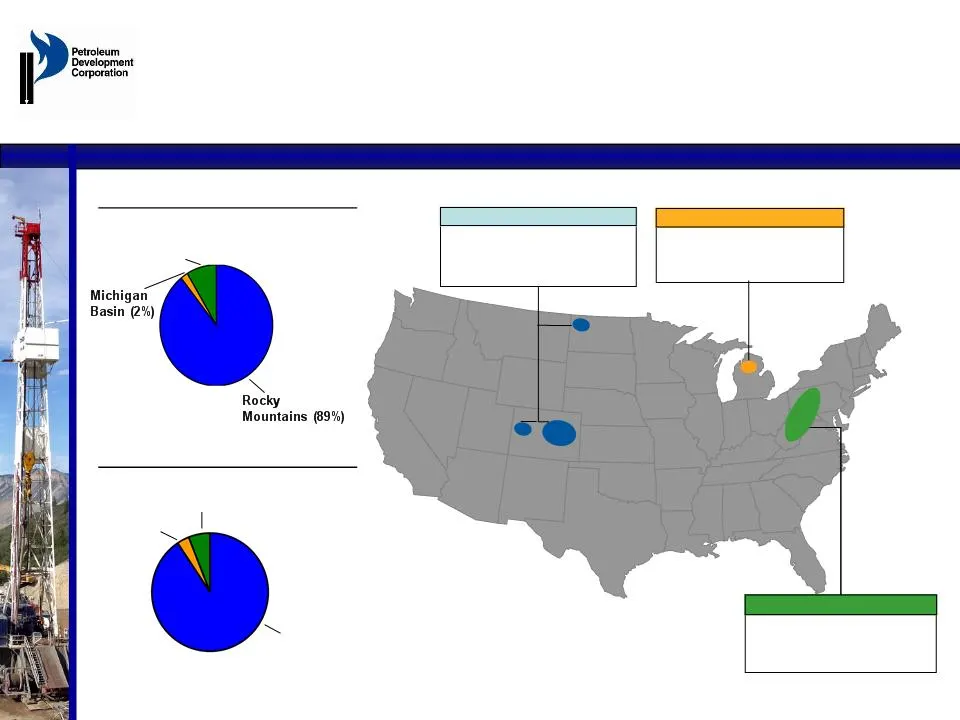
Core Operating Regions Proved Reserves: Bcfe Production: 37.8 Bcfe Rocky Mountains Proved Reserves: Bcfe Production: 1.4 Bcfe Michigan Basin Proved Reserves: Bcfe Production: 4.1 Bcfe Appalachian Basin* Proved Reserves Bcfe Appalachian Basin (9%)* Production 43.3 Bcfe Michigan Basin (3%) Appalachian
Slide 7: PDC Price Snapshot and Year-End 2009 Reserve Summary
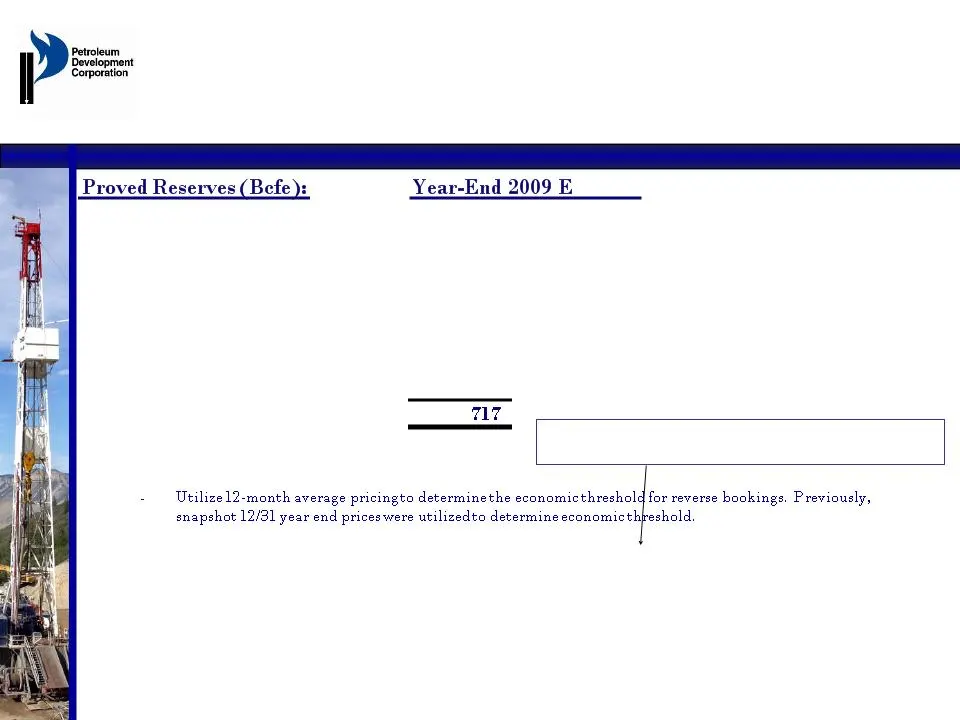
PDC Price Snapshot Snapshot 12 month Avg 12/31/08 12/31/09 12/31/09 Natural Gas (per Mcf) $4.98 $5.51 $3.17 Oil (per Bbl) $37.85 $72.91 $54.64 SEC Year-End reserve reporting changes : - 5 year rule related to PUD bookings Year-End 2009 Reserve Summary Using flat 12/31/09 pricing, (2008 SEC pricing m
Slide 8: Summary - Production and Capital Spending
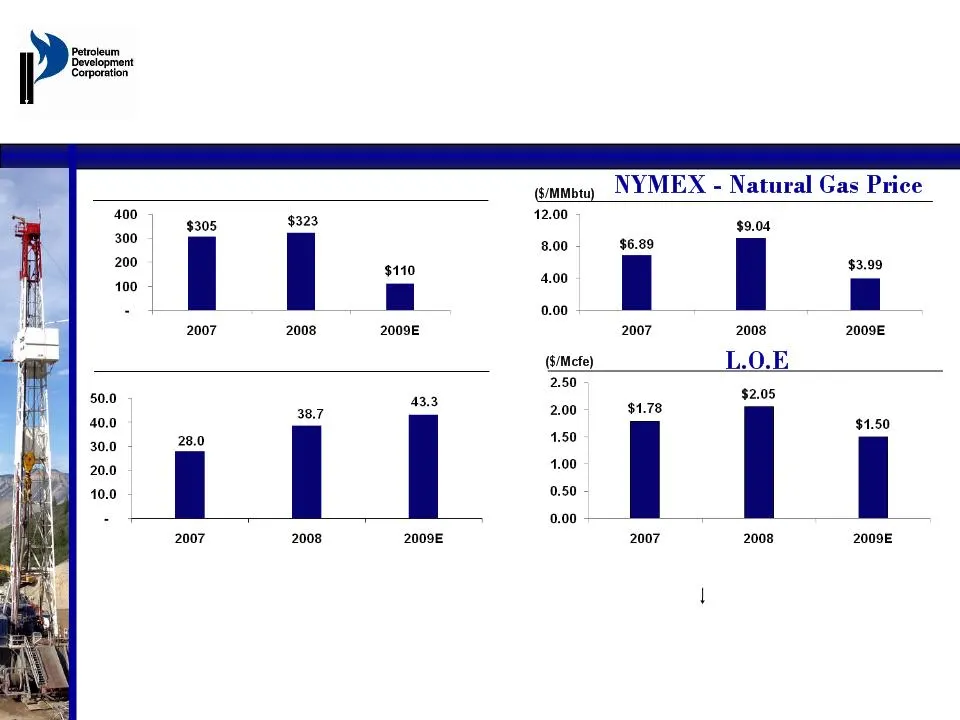
Summary Production (Bcfe) ($MM) Capital Spending • Reduced capital spending by 56% in response to poor natural gas price conditions ( 56%) • Increase production by 12% and reduced L.O.E $/Mcfe by just under 30%. • Reduced L.O.E $/Mcfe should be sustainable beyond 2009 and will improve incremental ca
Slide 9: Summary - Credit Ratios
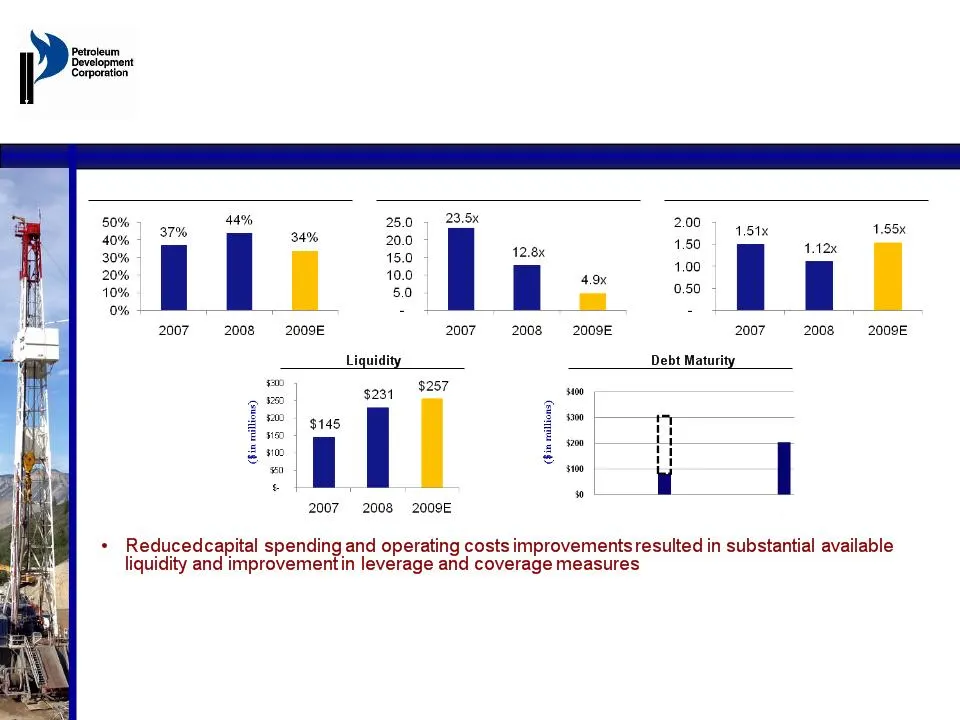
Summary - Credit Ratios Total Debt / EBITDAX (1) (TTM) Total Debt / Capital Base (%) (1) EBITDAX: Earnings before Interest, Taxes, Depreciation, Depletion and Amortization and Exploration Expense. EBITDAX (1) / Interest, net (TTM) • ~$50MM equity raise, and ~$160MM PDC and Lime Rock Partners joint v
Slide 10: Summary - Oil and Gas Hedges
2010 2011 2012 2013 Weighted Average Hedge Price (Mcfe) (1) With Floors $7.84 $6.87 $6.39 $6.39 With Ceilings $8.76 $7.76 $7.97 $8.21 % of Forecasted Production (1) 73% 74% 66% 65% Weighted Avg Forward Price (2) $6.70 $7.20 $7.36 $7.51 Weighted Avg Price of Forecasted Production (3) $7.54 $6.96 $6.7

Slide 11: Strategic Positioning
STRATEGIC POSITIONING • Enhanced A&D team through the hiring of new Senior Vice President of Business Development and the hiring of senior engineering support personnel. • Initiate three-year plan to buyback Partnerships. • Developed an intrinsic valuation model which will be utilized to evaluate ca

Slide 12: Capex Budget
2009E 2010E % Change Net Development Capital (MM$) 79 127 61% Exploration, Land, G&G (MM$) 15 6 -60% Leasehold and Partnership Puts 9 9 3% Miscellaneous Capital (MM$) 8 8 -3% Total Net Capital (MM$) $110 $150 36% CAPEX BUDGET
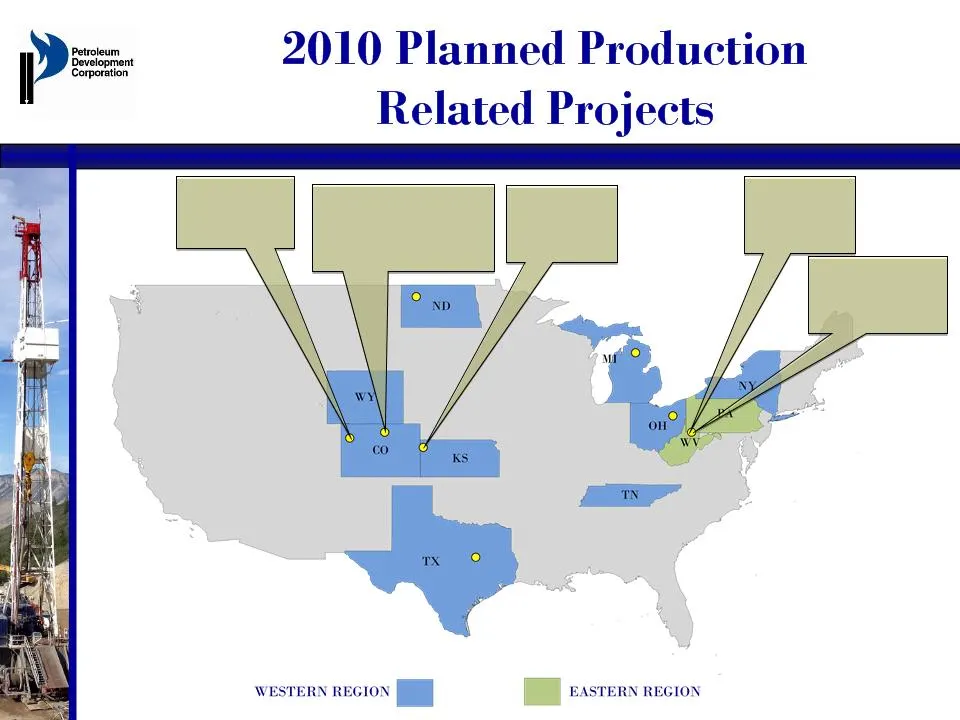
Slide 13: 2010 Projects: Marcellus, Wattenberg, Piceance and others
Marcellus • 16 Verticals • 10 Horizontals Shallow Devonian • 50 Recompletes • 29 Workovers NECO • 25 New Drills • 50 Workovers Wattenberg • 180 New Drills -138 Operated New Drills -42 Non-Op New Drills • 12 Refracs/Recompletes Piceance • 21 New Drills -11 Mesa -10Valley PDC has over 2,200 identified

Slide 14: Operations Forecast 2009 vs. 2010
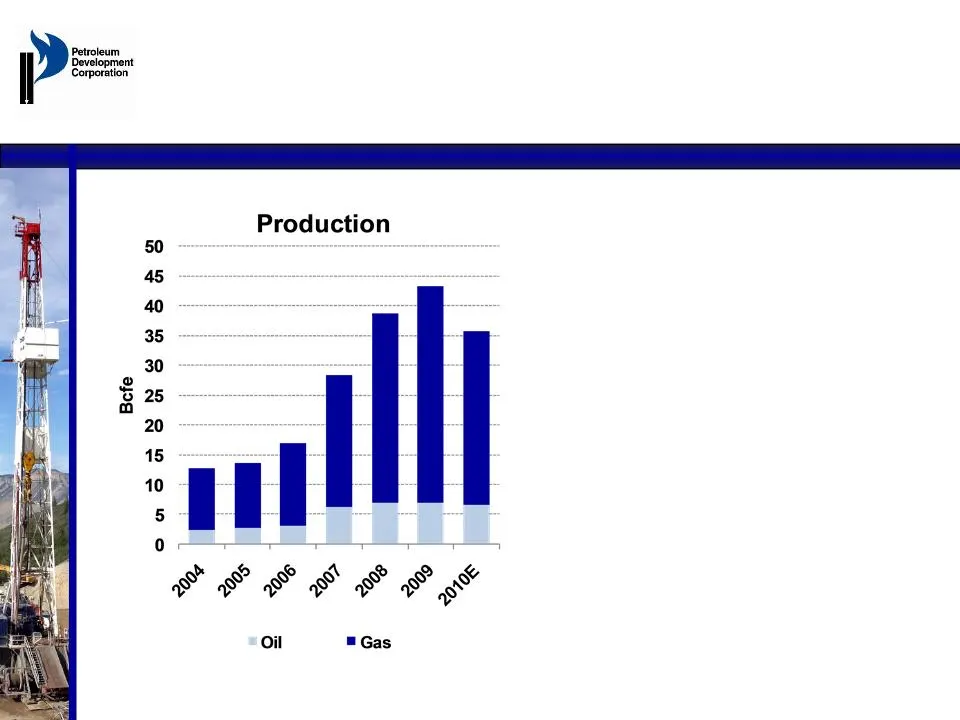
2009E 2010E % Change Total Net Production (Bcfe) (1) 43.3 35.7 -18% Gross Exit Rate (MMcfe/d) 187 185 -1% Net Exit Rate (MMcfe/d) 107 106 -1% Net Development Capital (MM$) $79 $127 61% Gross Number of Drilling Projects 100 257 157% Gross Number of Other Projects 38 62 63% Operations Forecast 2009 vs
Slide 15: Production Guidance
Net Production 35.7 43.3 • Production decline vs. 2009 primarily due to: – Decision to limit drilling in late 2008/2009 (price / economy) and to preserve liquidity – Formation of Mountaineer JV Partnership (2.3 Bcfe) • PDC has over 2,200 Identified projects in Inventory to organically grow productio

Slide 16: Increasing Value in 2010 and Beyond
IncreasingValue in 2010 and Beyond • Additional Organic Drilling - Possibly beginning 2 nd half - Ramp up in Piceance and Wattenberg - Focus on enhancing Piceance economics • Marcellus JV - drilling 26 horizontal and vertical wells in 2010 - Large operator in WVA achieved reserves of 3.6 Bcfe per ho

Slide 17: Partnership Purchases: Three year plan
Partnership Purchases: Three year plan • Limited Partners’ non-operated interest is typically at 60-80% of certain PDC operated wells (Rockies principally) • 28 Limited Partnerships have net reserves of approximately Bcfe owned by the Limited Partners • 28 Limited Partnerships have net production of

Slide 18: PDC in Summary
• Strong Focus on creating Shareholder value • Great core assets with improved drilling economics • Marcellus Shale JV with Lime Rock provides potential catalyst for strong production and cash flow growth • Evaluating potential acquisition, joint venture, and exploration opportunities that could pro

Slide 19: | Petroleum
| Petroleum my \ Ue qi oa
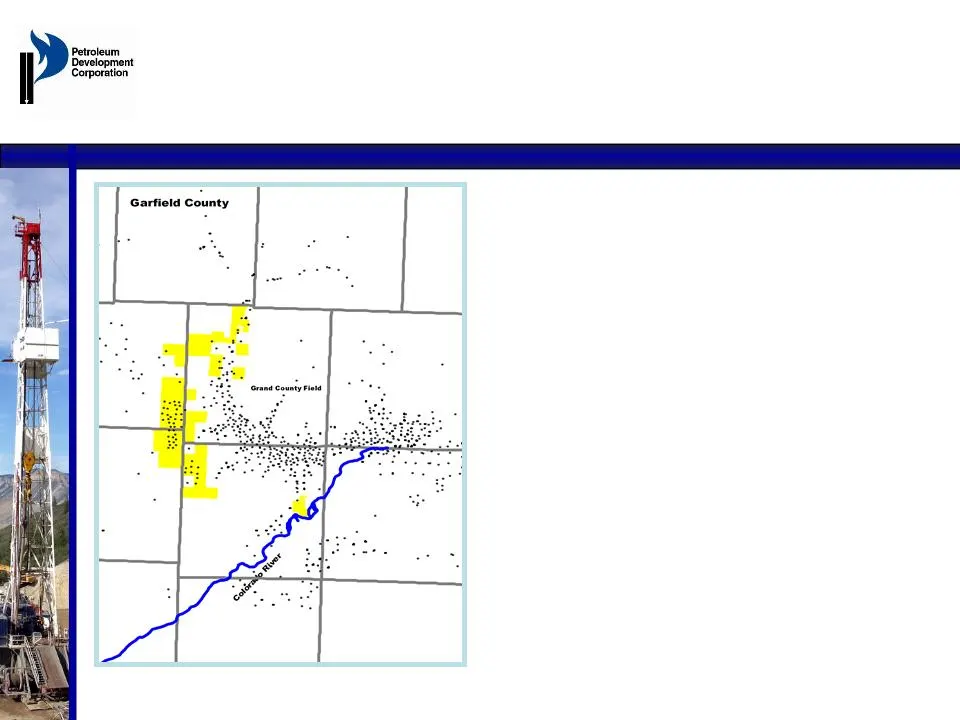
Slide 20: Piceance Basin at December 31, 2009
Piceance Basin at December 31, 2009 • Gross operated wells 288 • Undeveloped acreage 5,300 • Undeveloped, gross, 10 acre locations 433 • 362 total net PDC • Number of net remaining locations - PUD 251 - Probable 97 - Possible 14
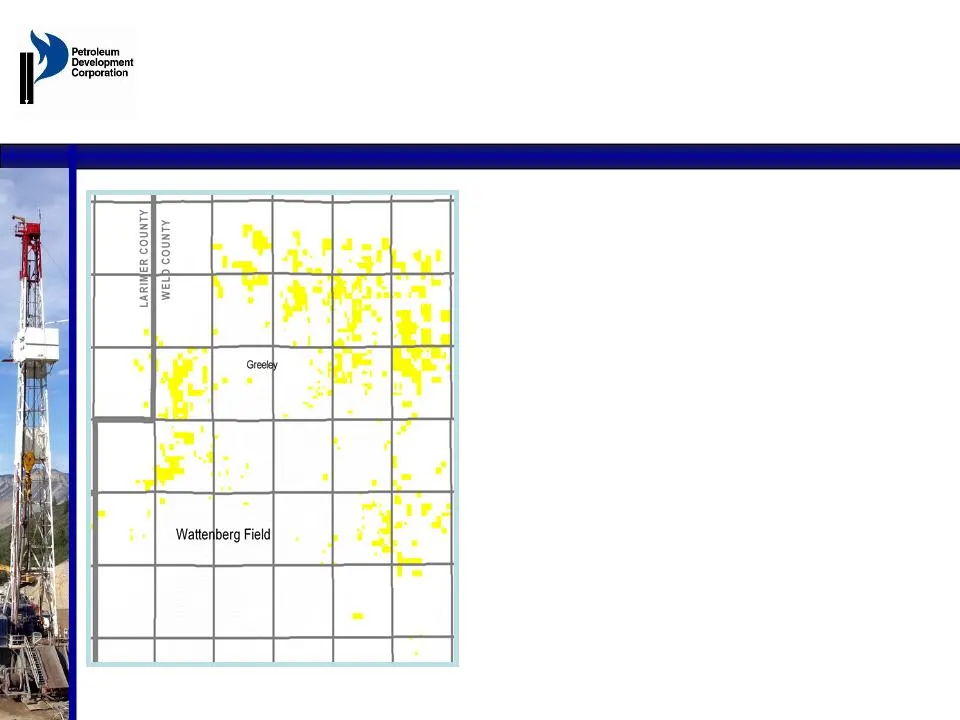
Slide 21: Wattenberg Field at December 31, 2009
Wattenberg Field at December 31, 2009 • Gross Operated wells 1,410 • Undeveloped acreage 19,400 • Undeveloped, gross, locations 1,533 • 831 total net PDC - PUD 373 - Probable 316 - Possible 142
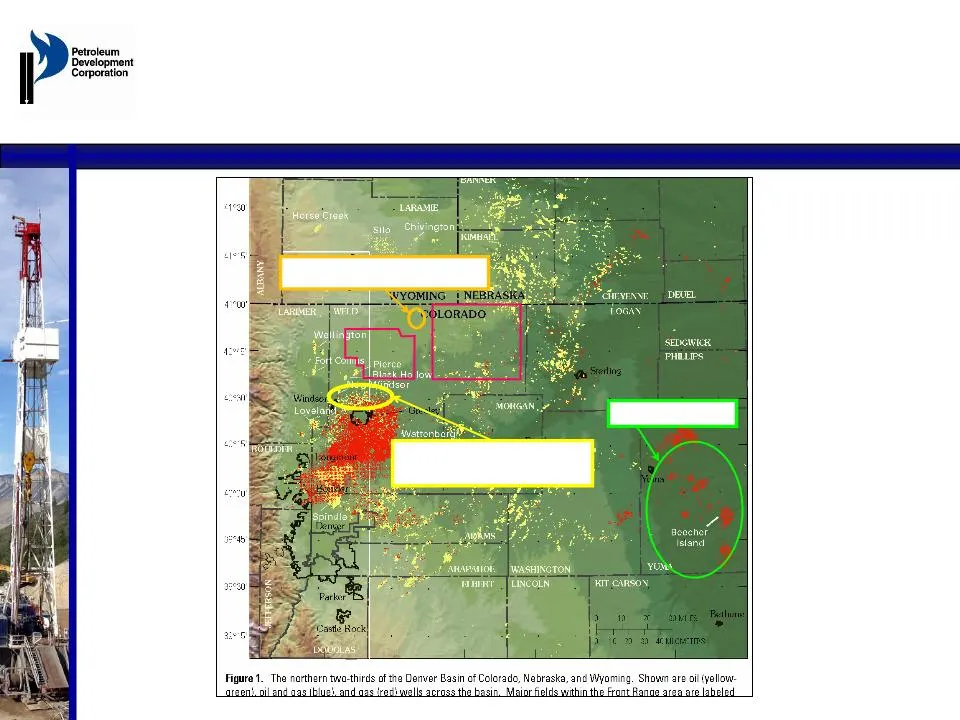
Slide 22: PDC Undeveloped Northern Wattenberg Acreage Area
PDC Undeveloped Northern Wattenberg Acreage Area EOG Niobrara Horizontal Well plus Drilling Permits Approved & Pending PDC Undeveloped Acreage in Northern Wattenberg Area. Approximately 24,000 Acres. PDC NECO Area: Niobrara Biogenic Gas Production Pawnee National Grasslands Pawnee National Grassland

Slide 23: Marcellus JV
Marcellus JV • Formed JV with Lime Rock in October 2009 valuing assets at $158.5 million (Lime Rock will fund first $68.5 million). • Organization in place and fully operational for future development of Devonian and Marcellus assets. • Marcellus assets: – Focus has been on solidifying current acrea
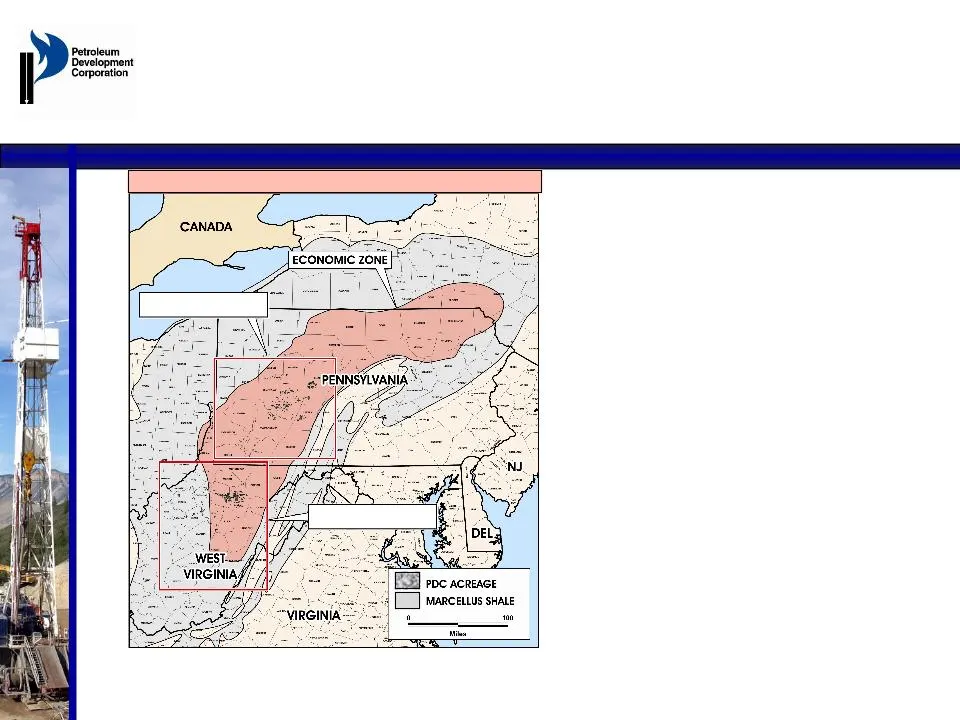
Slide 24: Appalachian Operating Presence
Appalachian Operating Presence Ø 44 Employees - Indiana, PA – Production – Drilling/Completion – Trucking/Pipeline/Construction Ø 133 Employees - Bridgeport, WV – Production – Drilling/Completion – Pipeline - DOT Compliance – Gas Marketing – Accounting – Administration Ø 13 Senior Technical Team Emp

Slide 25: Acreage Inventory
Area Lease Gross Acres PDC Net Acres Net Developed Acres Net Undeveloped Acres State Grand Valley 8,000 8,000 2,700 5,300 Colorado Wattenberg 72,200 64,900 45,500 19,400 Colorado NECO 127,100 105,100 19,600 85,500 Colorado/Kansas Michigan 26,800 23,300 14,800 8,500 Michigan New York 18,700 15,900 0

Slide 26: Petroleum Development Corporation - EnerCom Conference
NASDAQ:PETD PETROLEUM DEVELOPMENT CORPORATION EnerCom, Inc. The Oil & Services Conference VIII February 18,
Source: SEC EDGAR · 8-K filed Feb 18, 2010
More decks from PDC Energy Inc
 Merger or Acquisition (May 2023)9 slides · May 22, 2023
 Merger or Acquisition (August 2019)16 slides · Aug 26, 2019
 Proxy Contest (May 2019)60 slides · May 21, 2019
 Proxy Contest (May 2019)18 slides · May 15, 2019
 Proxy Contest (May 2019)17 slides · May 14, 2019
 Proxy Contest (May 2019)48 slides · May 8, 2019