Holly Energy Partners LP — Investor Presentation (March 2021)
20 slides from Holly Energy Partners LP's investor presentation, Mar 2, 2021
Slide 1: Investor Presentation March 2021
INVESTOR PRESENTATION MARCH 2021
Slide 2: Safe Harbor Disclosure Statement
Holly Energy Partners (NYSE: HEP) 2 Safe Harbor Disclosure Statement Statements made during the course of this presentation that are not historical facts are “forward-looking statements” within the meaning of the U.S. Private Securities Litigation Reform Act of 1995. Words such as “anticipate,” “pro
Slide 3: Company Profile
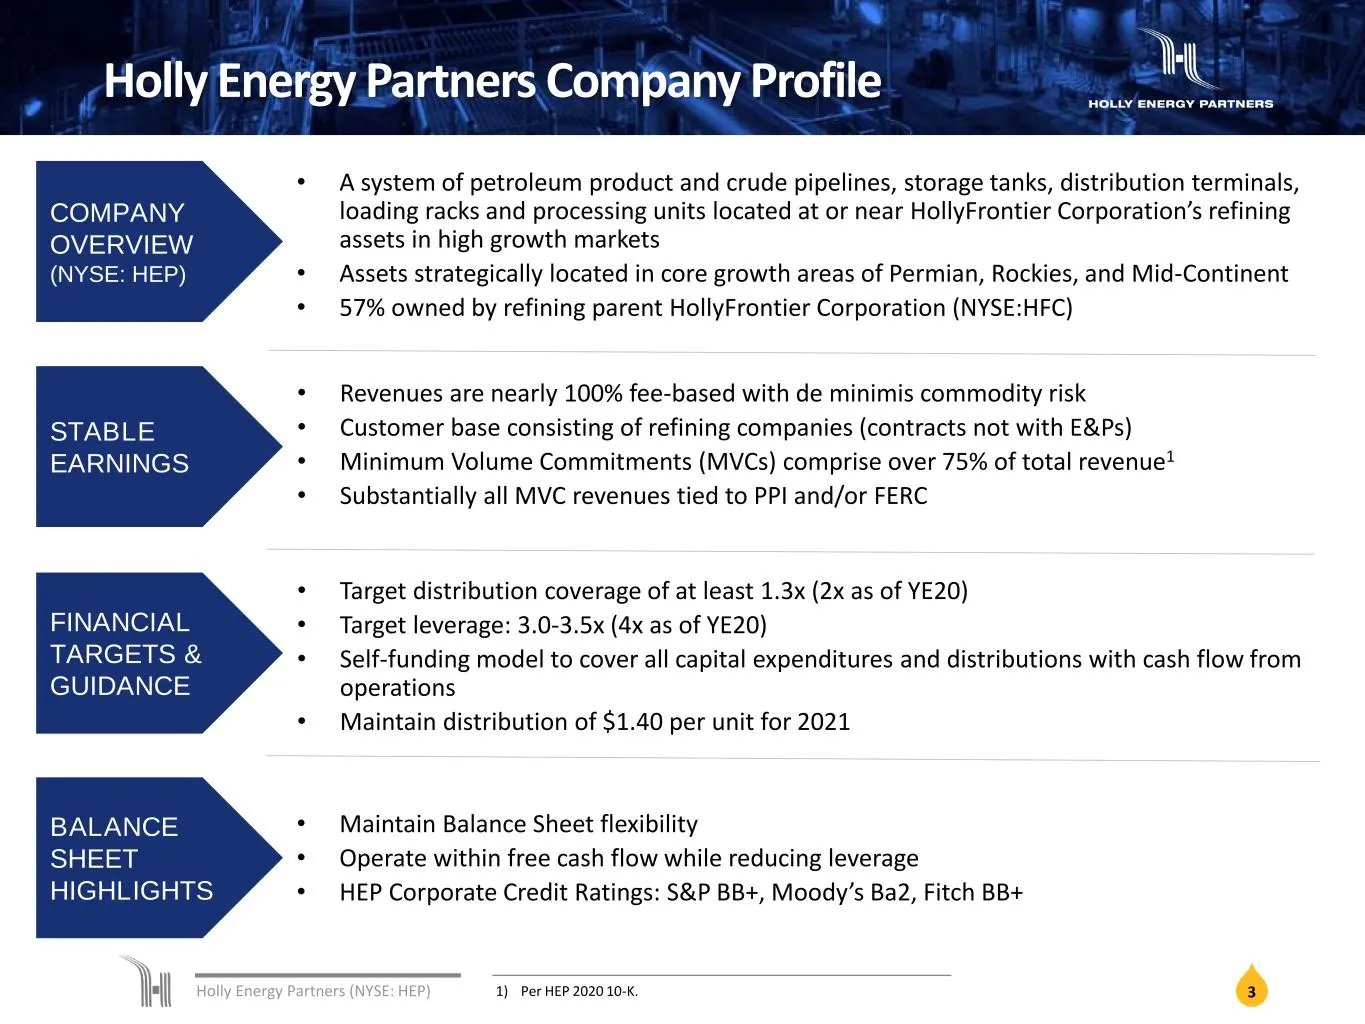
Holly Energy Partners (NYSE: HEP) Holly Energy Partners Company Profile STABLE EARNINGS FINANCIAL TARGETS & GUIDANCE BALANCE SHEET HIGHLIGHTS • Revenues are nearly 100% fee-based with de minimis commodity risk • Customer base consisting of refining companies (contracts not with E&Ps) • Minimum Volum
Slide 4: Minimum Volume Commitments Contract Renewal Schedule
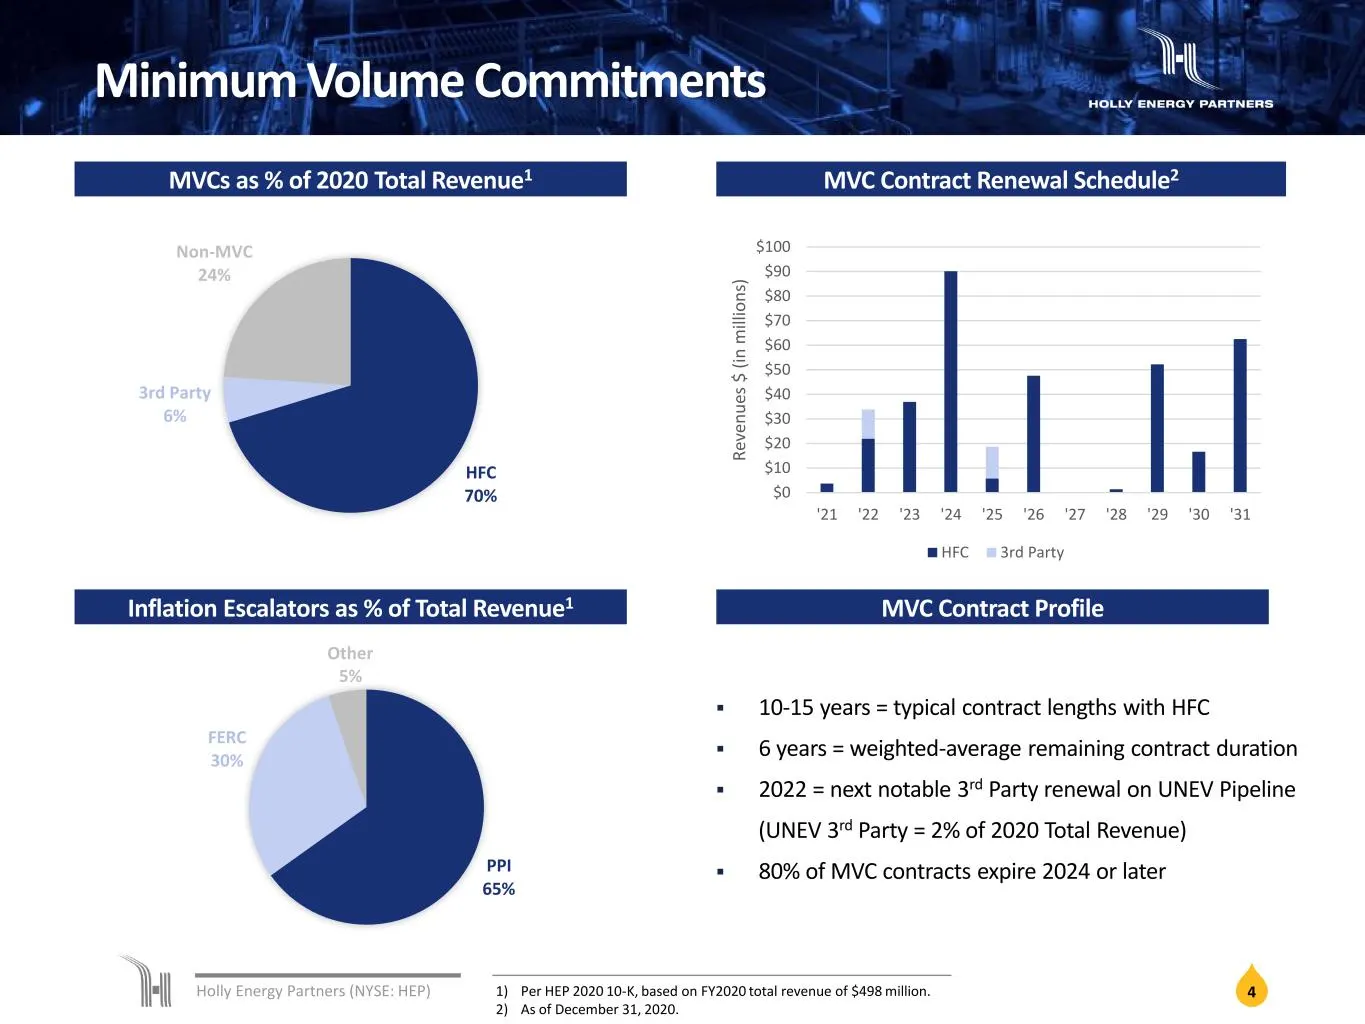
Holly Energy Partners (NYSE: HEP) 4 Minimum Volume Commitments MVC Contract Renewal Schedule2 10-15 years = typical contract lengths with HFC 6 years = weighted-average remaining contract duration 2022 = next notable 3rd Party renewal on UNEV Pipeline (UNEV 3rd Party = 2% of 2020 Total Revenue
Slide 5: Historical Leverage and Coverage Ratios
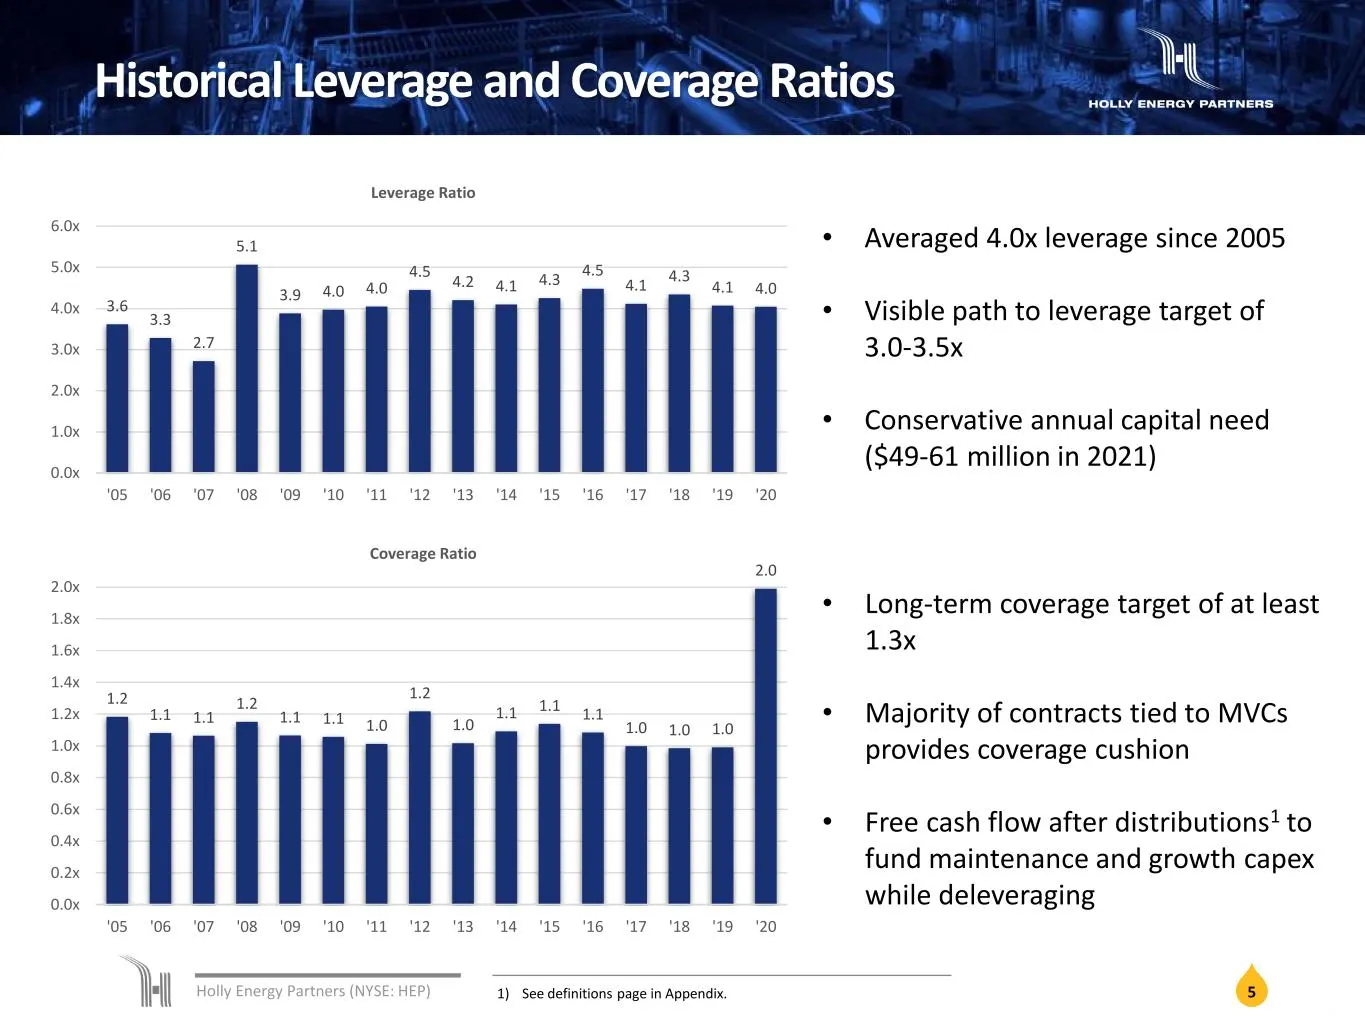
Holly Energy Partners (NYSE: HEP) 5 Historical Leverage and Coverage Ratios • Long-term coverage target of at least 1.3x • Majority of contracts tied to MVCs provides coverage cushion • Free cash flow after distributions1 to fund maintenance and growth capex while deleveraging • Averaged 4.0x levera
Slide 6: HEP Financial Strength
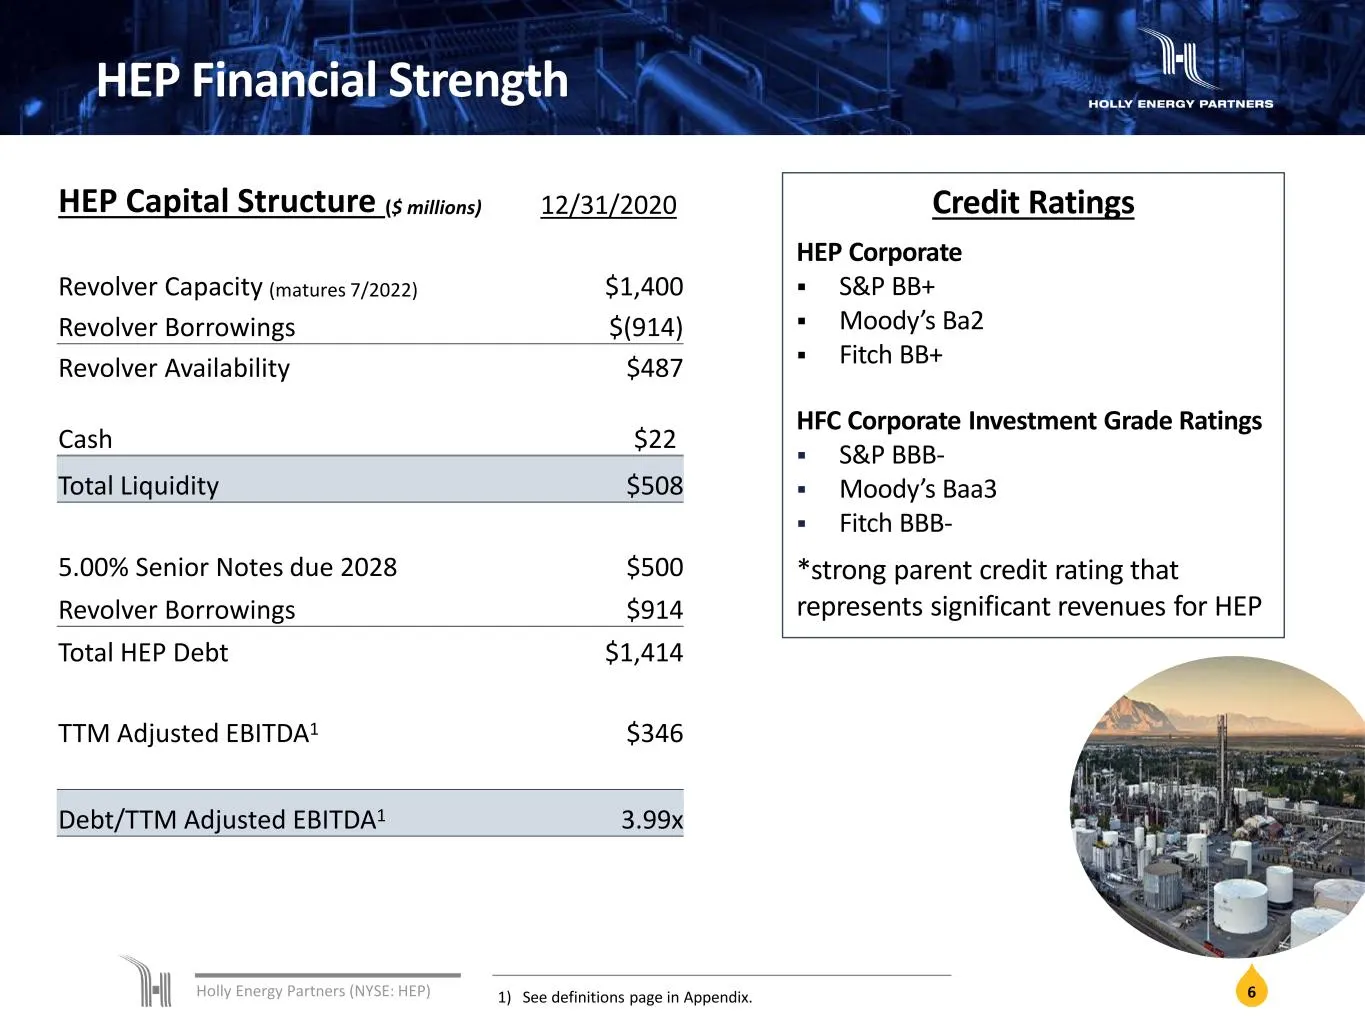
Holly Energy Partners (NYSE: HEP) HEP Financial Strength Reimbursable $15-20mm Maintenance $10-15mm Expansion $40-50mm HEP Capital Structure ($ millions) 12/31/2020 Revolver Capacity (matures 7/2022) $1,400 Revolver Borrowings $(914) Revolver Availability $487 $22Cash Total Liquidity $508 5.00% Seni
Slide 7: Distributable Cash Flow / LP Unit Since Inception
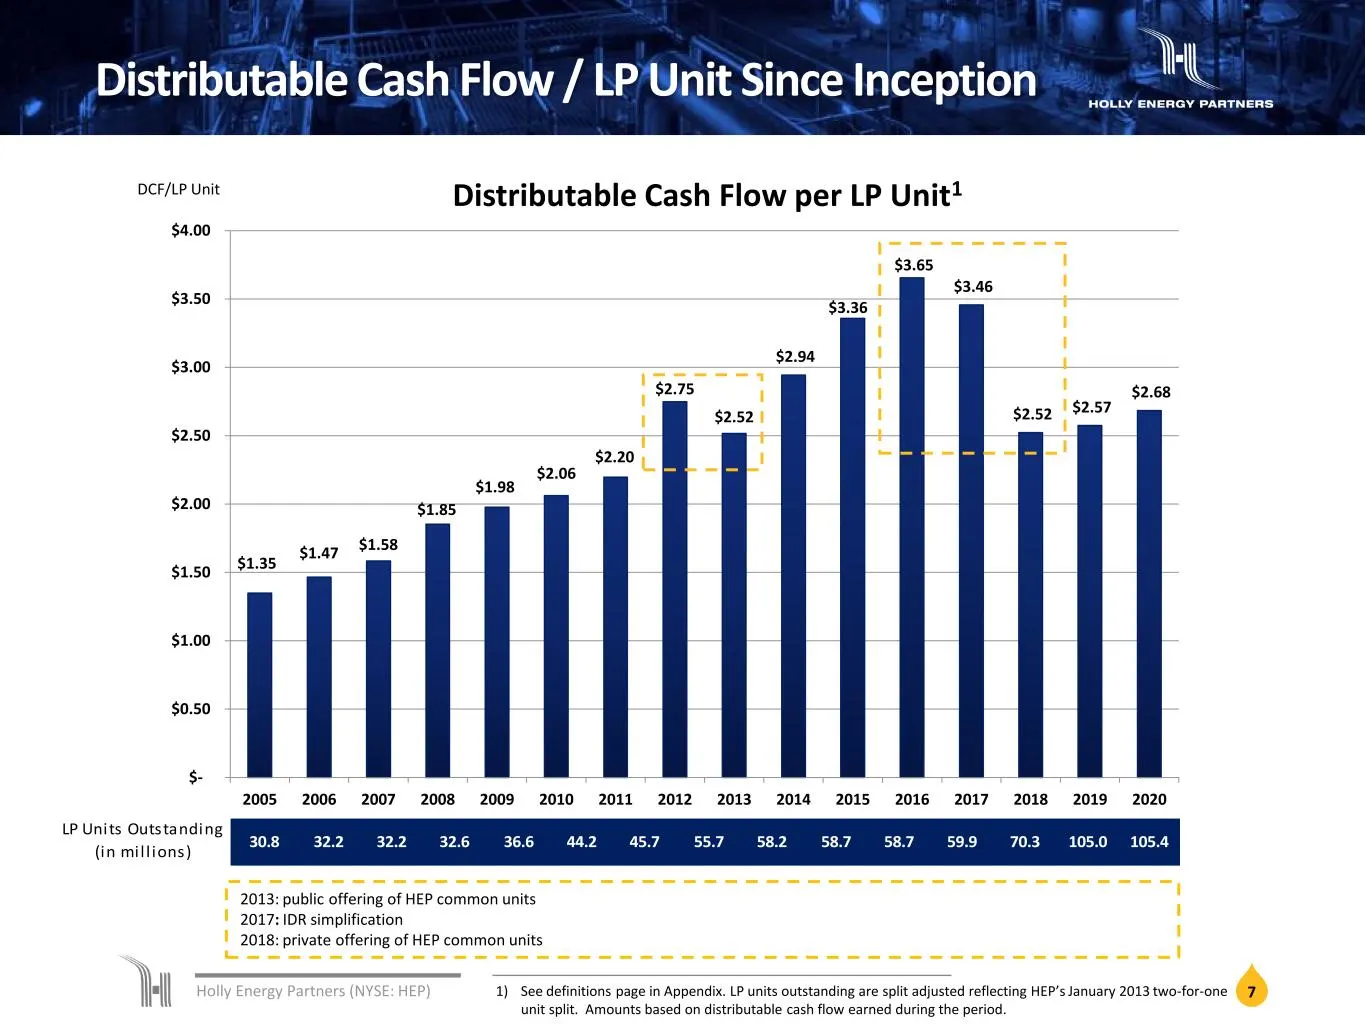
Holly Energy Partners (NYSE: HEP) 7 Distributable Cash Flow / LP Unit Since Inception $1.35 $1.47 $1.58 $1.85 $1.98 $2.06 $2.20 $2.75 $2.52 $2.94 $3.36 $3.65 $3.46 $2.52 $2.57 $2.68 $- $0.50 $1.00 $1.50 $2.00 $2.50 $3.00 $3.50 $4.00 2005 2006 2007 2008 2009 2010 2011 2012 2013 2014 2015 2016 2017 20
Slide 8: HEP Capital Budget
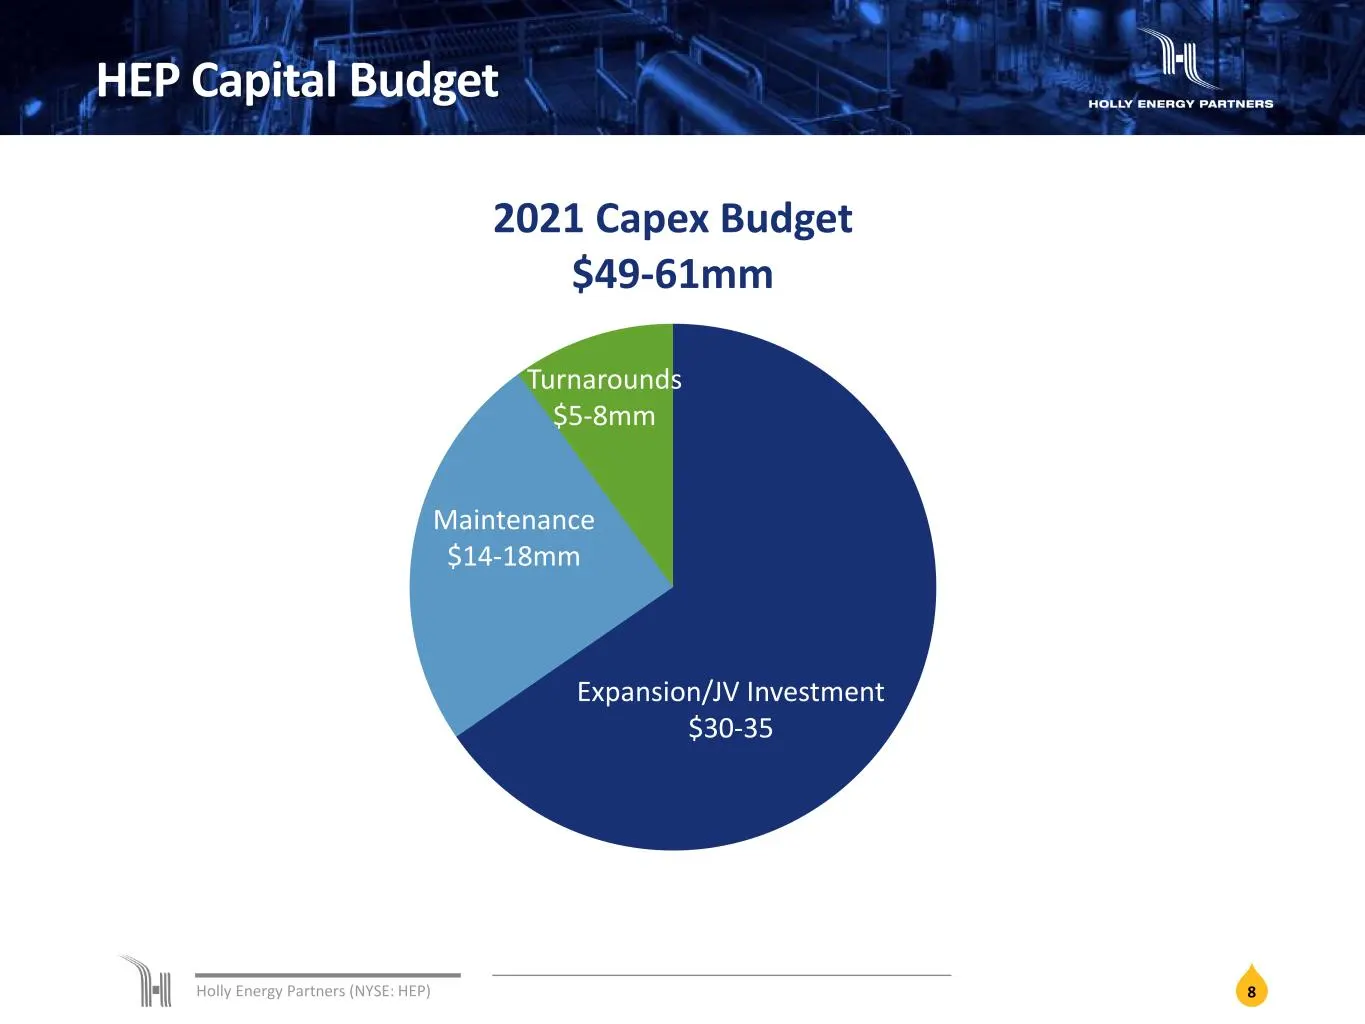
Holly Energy Partners (NYSE: HEP) HEP Capital Budget 2021 Capex Budget $49-61mm Turnarounds $5-8mm Maintenance $14-18mm Expansion/JV Investment $30-35 8
Slide 9: HEP Avenues for Growth
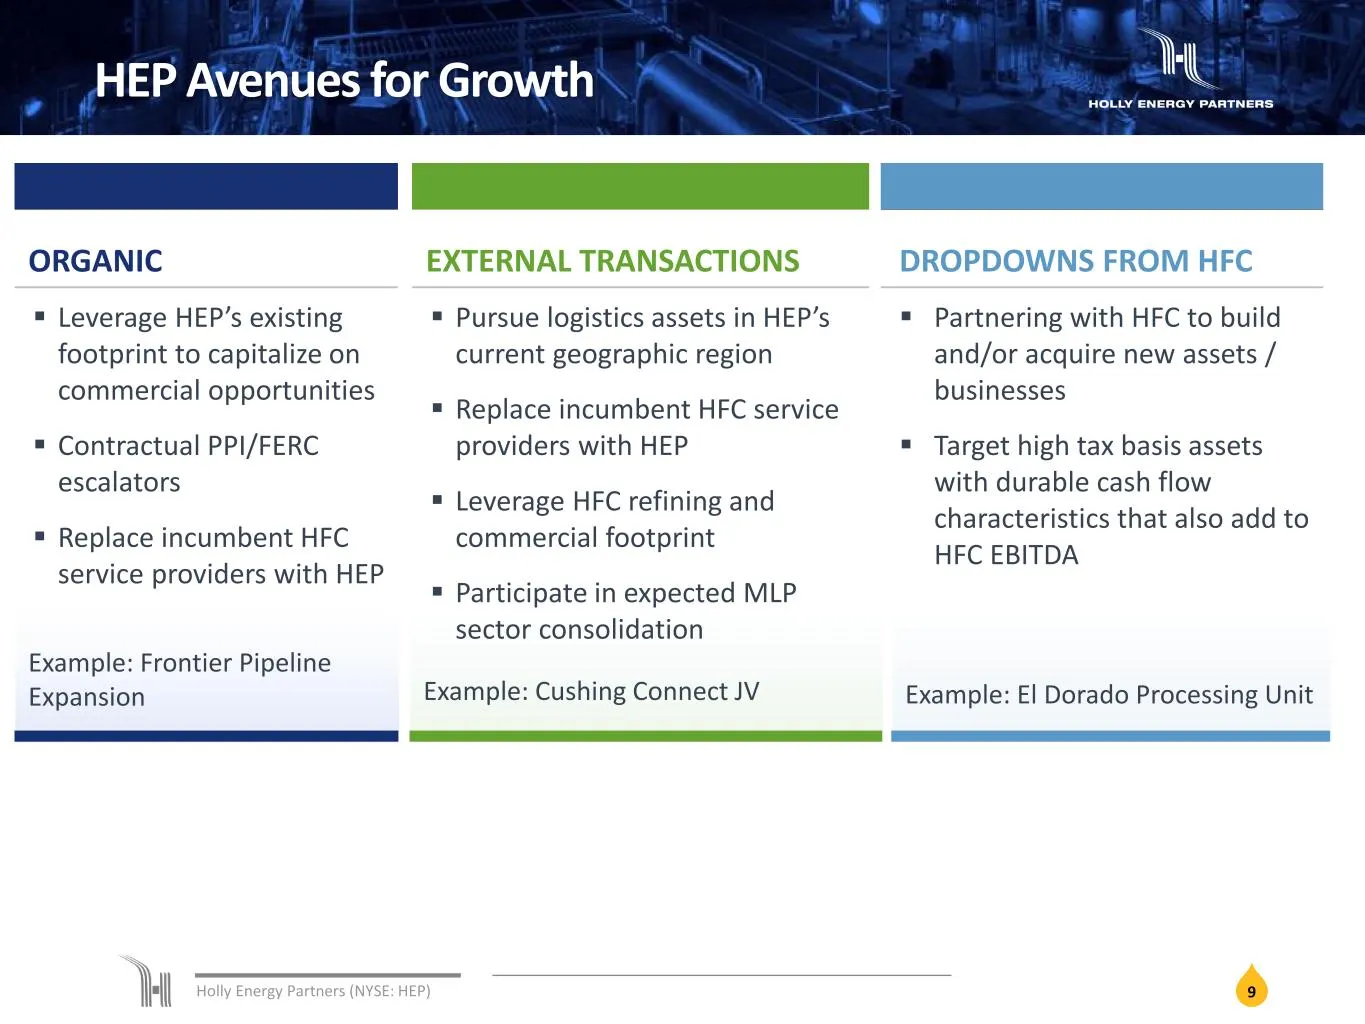
Holly Energy Partners (NYSE: HEP) 9 HEP Avenues for Growth ORGANIC EXTERNAL TRANSACTIONS DROPDOWNS FROM HFC Leverage HEP’s existing footprint to capitalize on commercial opportunities Contractual PPI/FERC escalators Replace incumbent HFC service providers with HEP Pursue logistics assets in
Slide 10: Cushing Connect Joint Venture
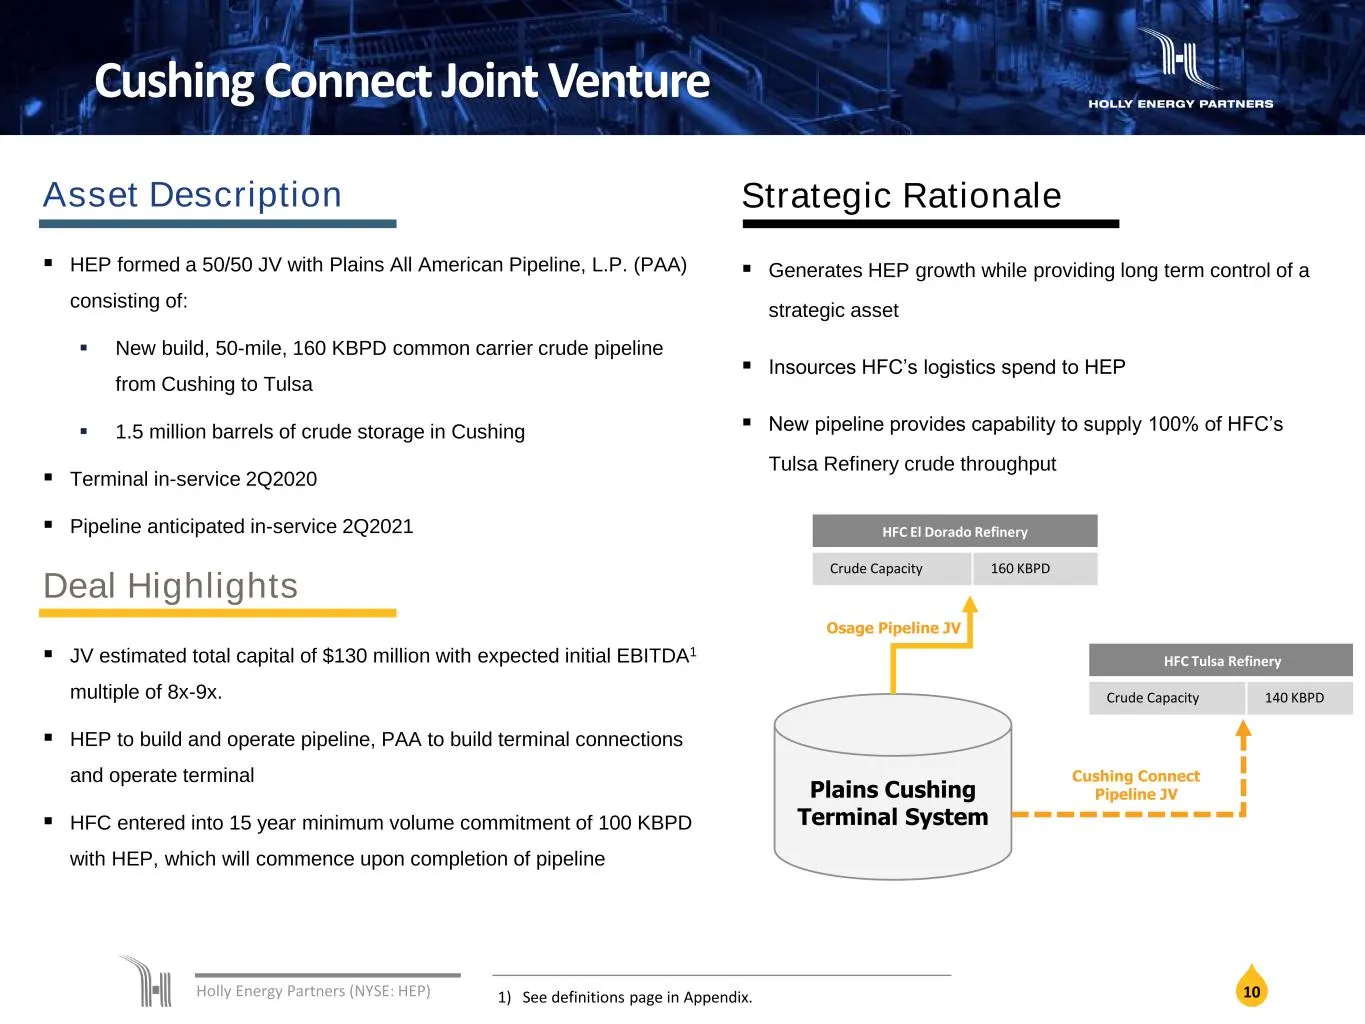
Holly Energy Partners (NYSE: HEP) 10 Cushing Connect Joint Venture Deal Highlights JV estimated total capital of $130 million with expected initial EBITDA1 multiple of 8x-9x. HEP to build and operate pipeline, PAA to build terminal connections and operate terminal HFC entered into 15 year mini
Slide 11: HEP Ownership Structure
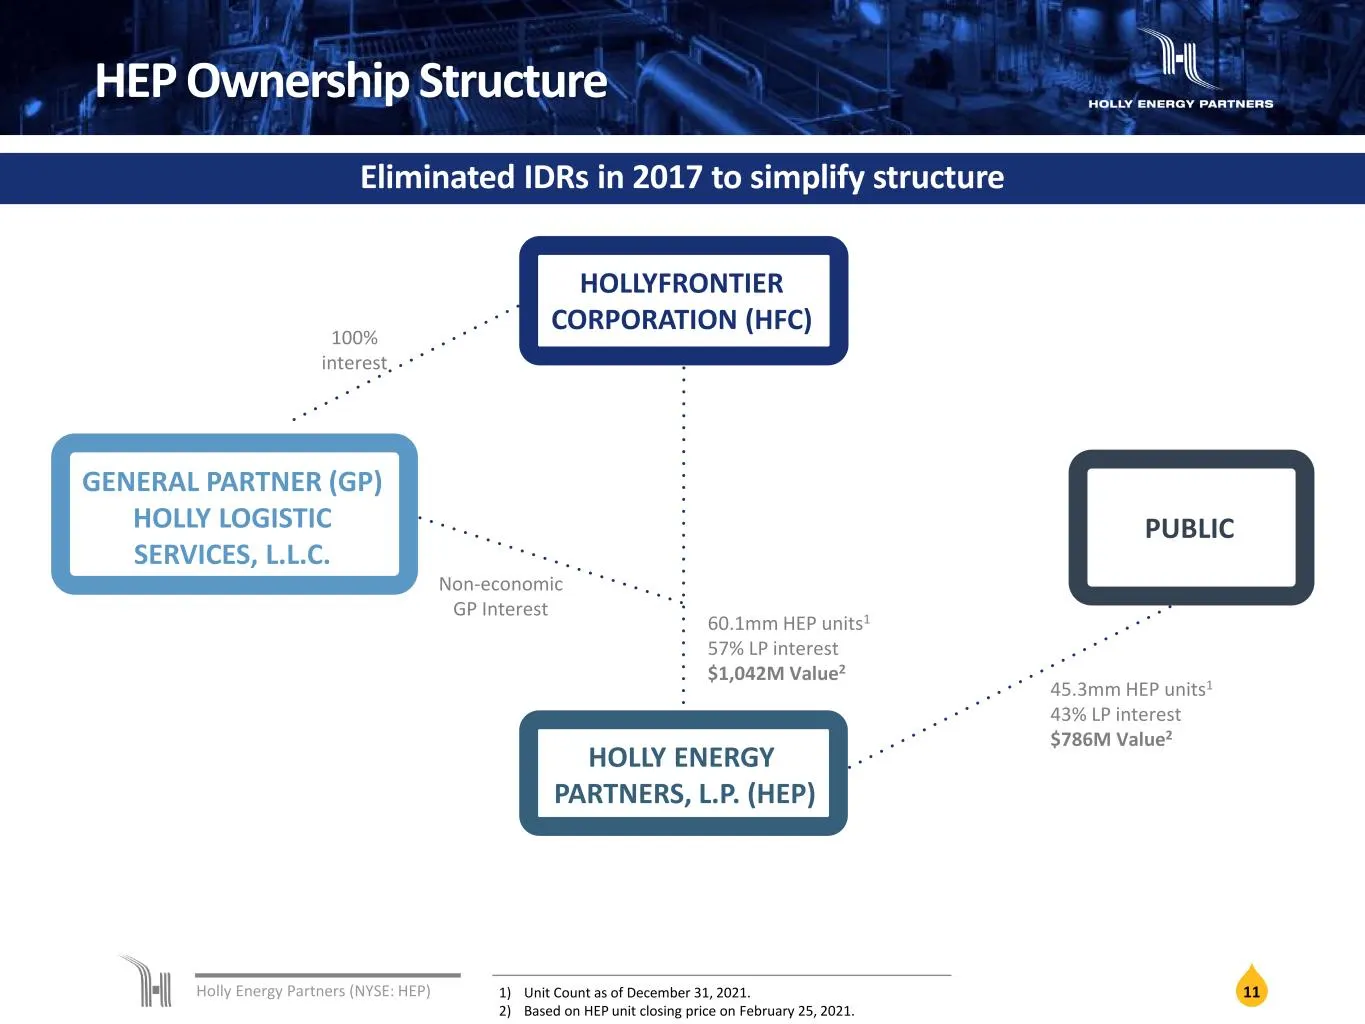
Holly Energy Partners (NYSE: HEP) 100% interest 45.3mm HEP units1 43% LP interest $786M Value2 60.1mm HEP units1 57% LP interest $1,042M Value2 HOLLYFRONTIER CORPORATION (HFC) GENERAL PARTNER (GP) HOLLY LOGISTIC SERVICES, L.L.C. HOLLY ENERGY PARTNERS, L.P. (HEP) PUBLIC Non-economic GP Interest HEP O
Slide 12: HollyFrontier and Holly Energy Partners Footprint
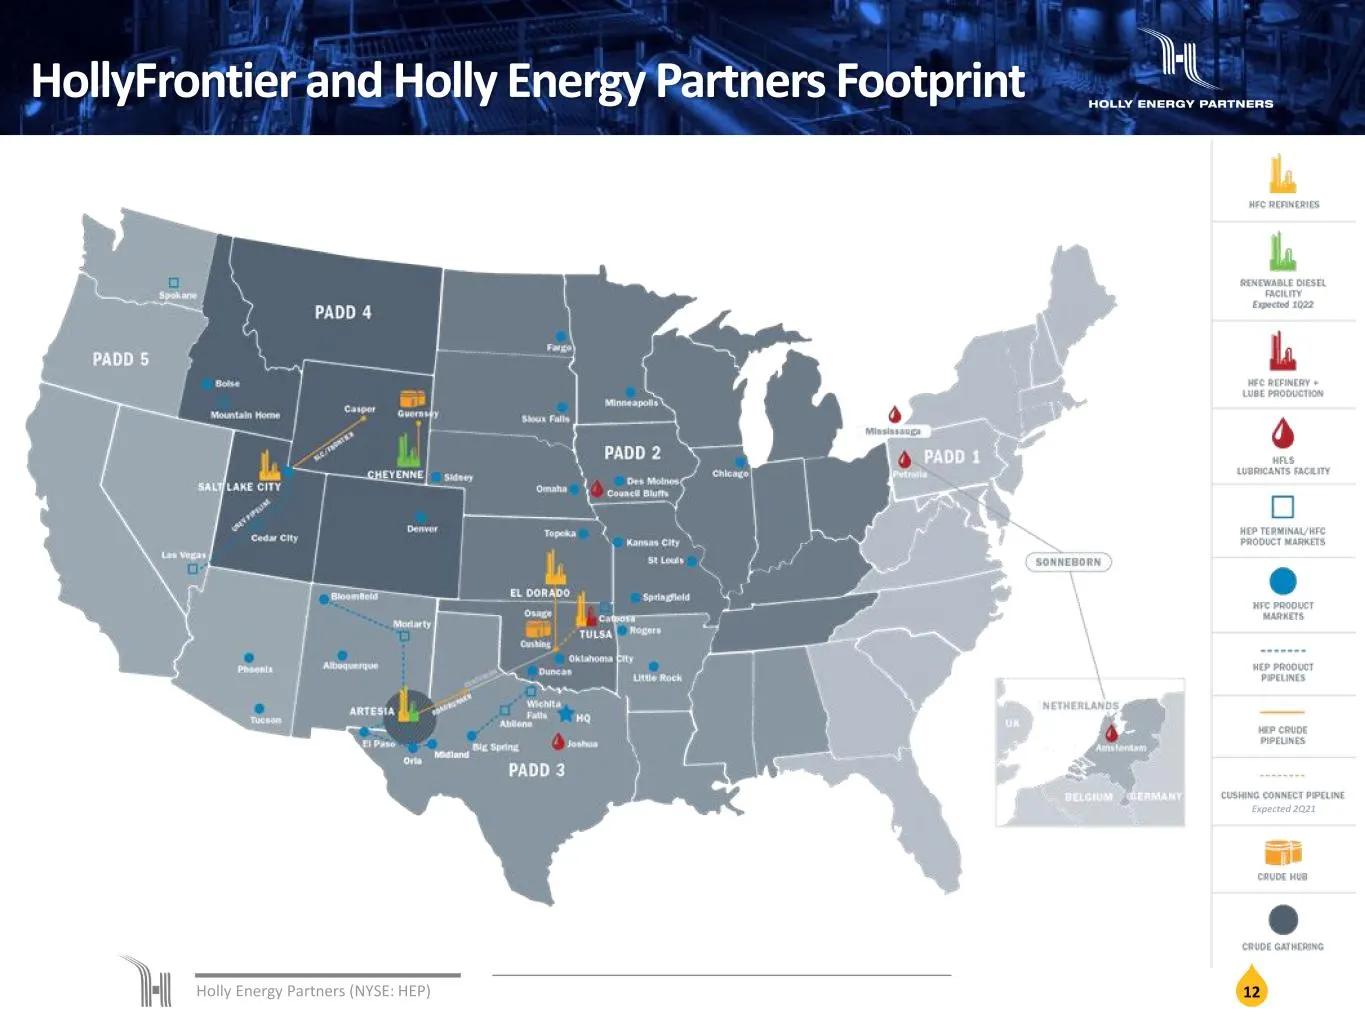
Holly Energy Partners (NYSE: HEP) 12 HollyFrontier and Holly Energy Partners Footprint Expected 2Q21
Slide 13: HollyFrontier Business Segment Highlights
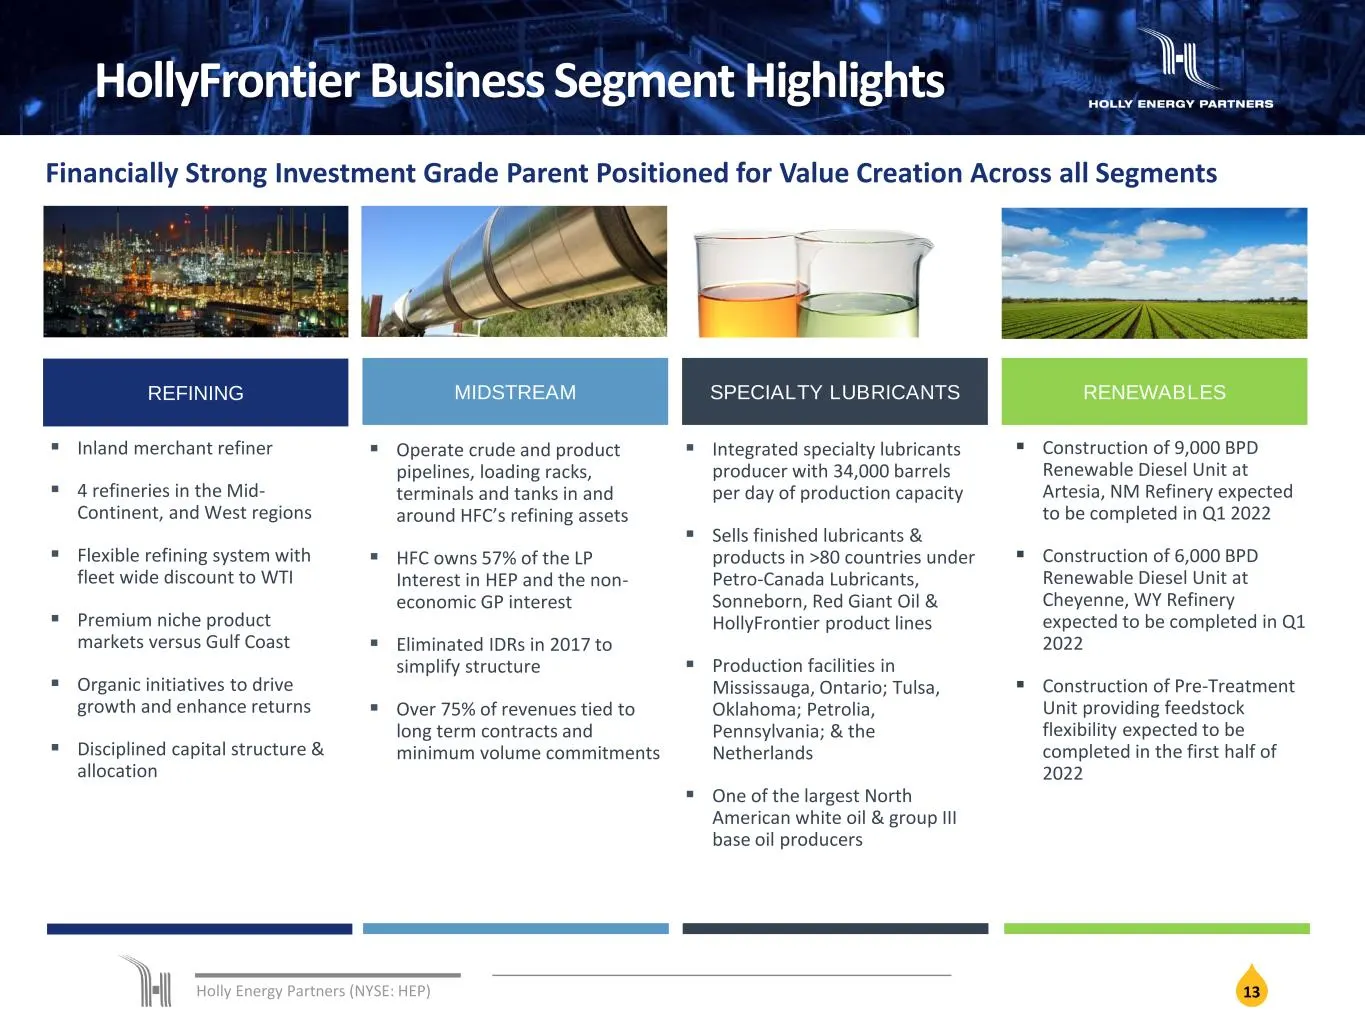
Holly Energy Partners (NYSE: HEP) 13 HollyFrontier Business Segment Highlights Financially Strong Investment Grade Parent Positioned for Value Creation Across all Segments MIDSTREAM SPECIALTY LUBRICANTSREFINING RENEWABLES Inland merchant refiner 4 refineries in the Mid- Continent, and West regio
Slide 14: HEP Historical Growth
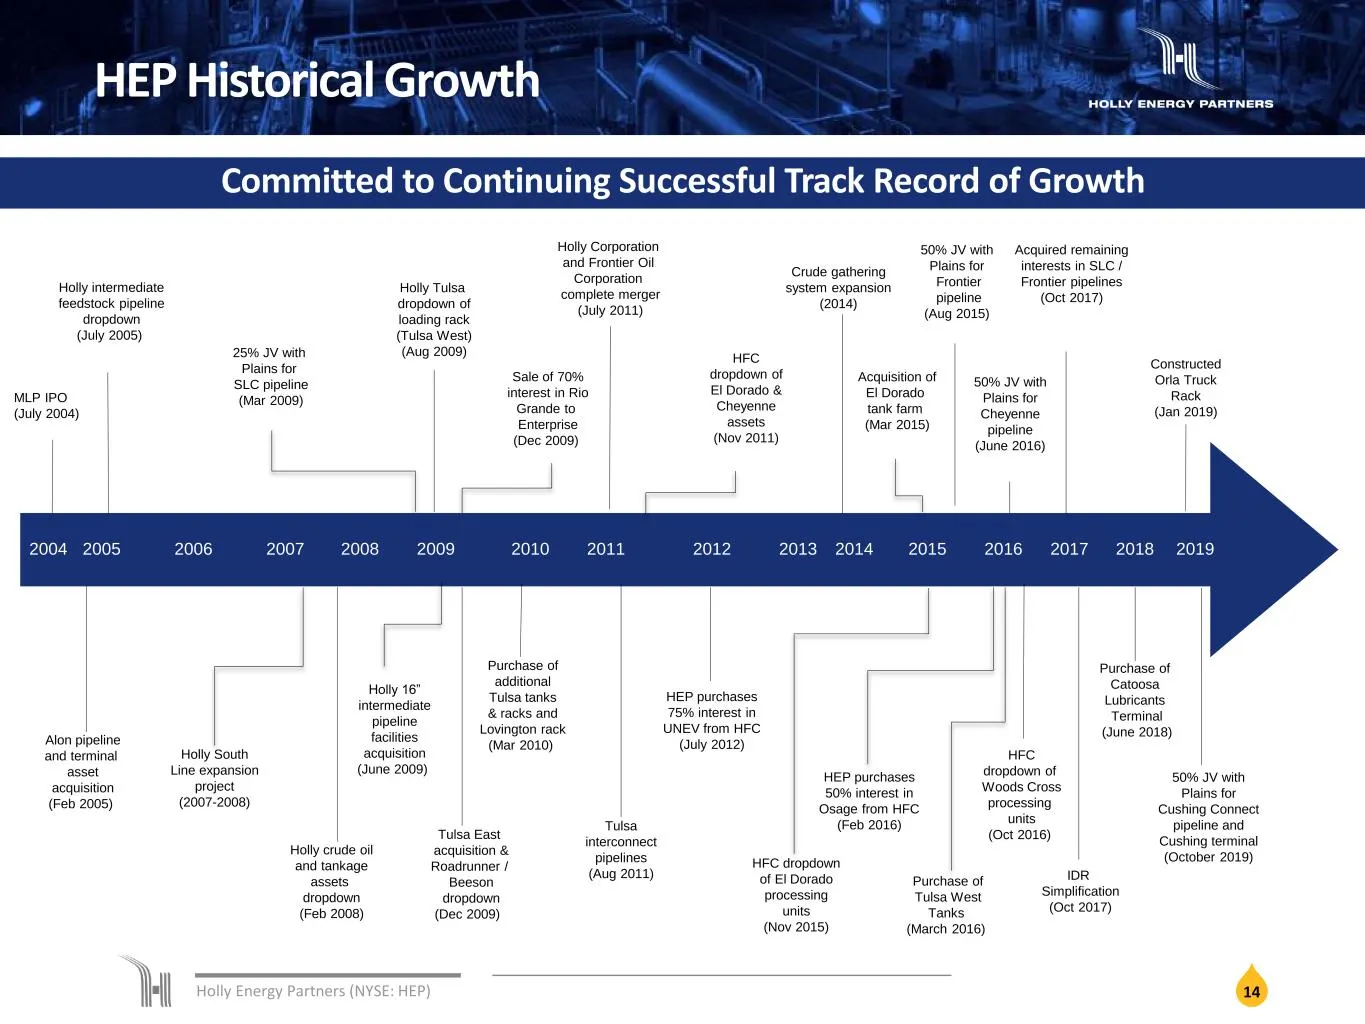
Holly Energy Partners (NYSE: HEP) 14 HEP Historical Growth Committed to Continuing Successful Track Record of Growth 2004 2005 2006 2007 2008 2009 MLP IPO (July 2004) Holly intermediate feedstock pipeline dropdown (July 2005) 25% JV with Plains for SLC pipeline (Mar 2009) Holly Tulsa dropdown of loa
Slide 15: HFC Environmental, Social, and Governance (ESG)
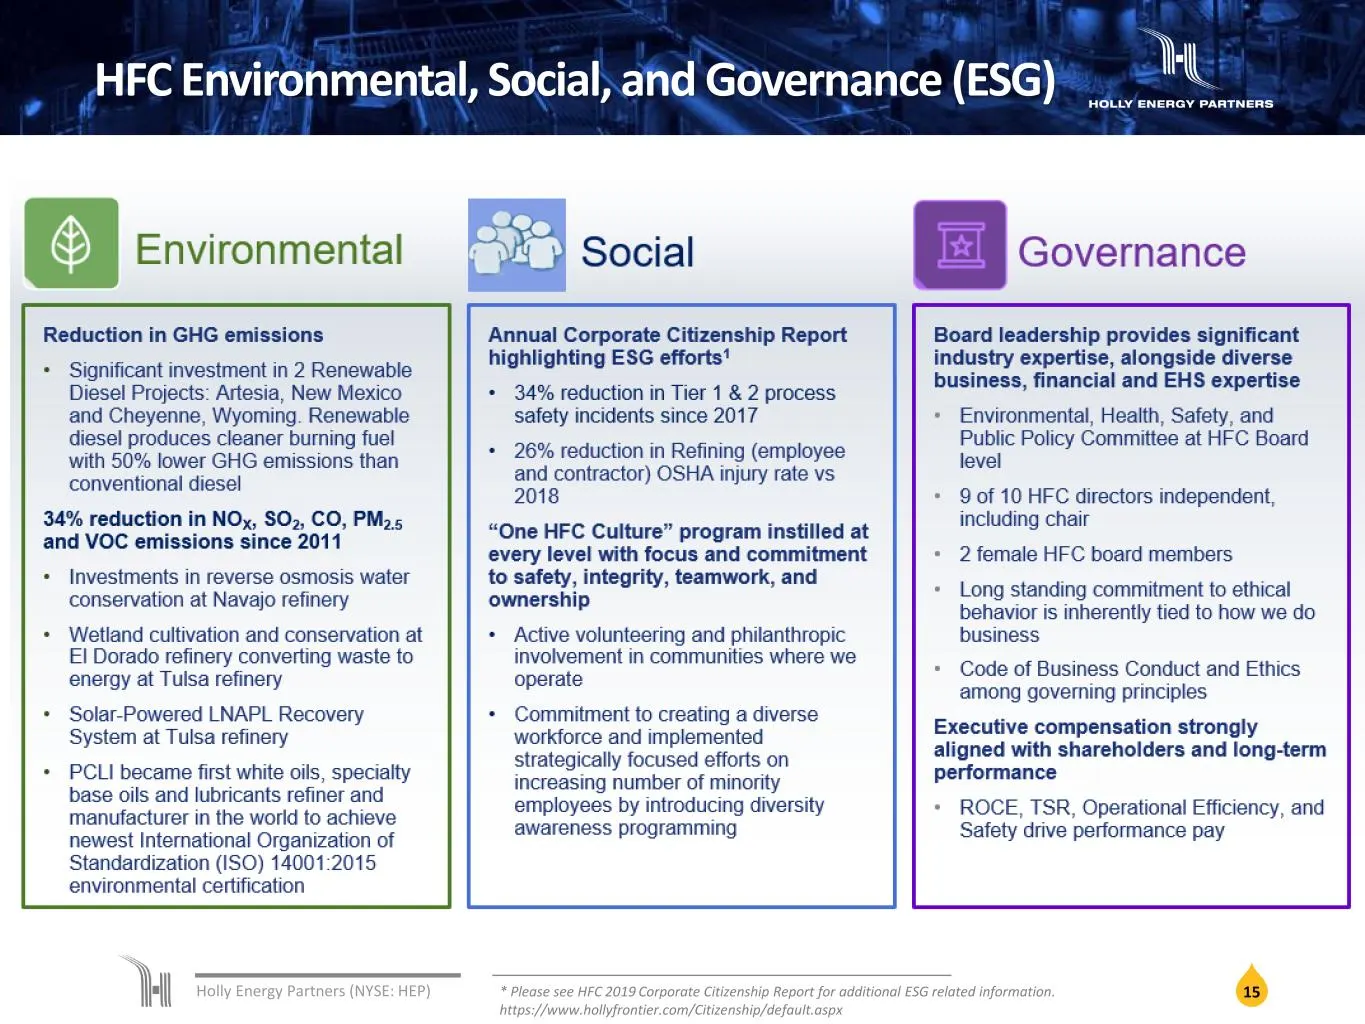
Holly Energy Partners (NYSE: HEP) 15 HFC Environmental, Social, and Governance (ESG) * Please see HFC 2019 Corporate Citizenship Report for additional ESG related information. https://www.hollyfrontier.com/Citizenship/default.aspx
Slide 16: Appendix
Holly Energy Partners (NYSE: HEP) 16 Appendix
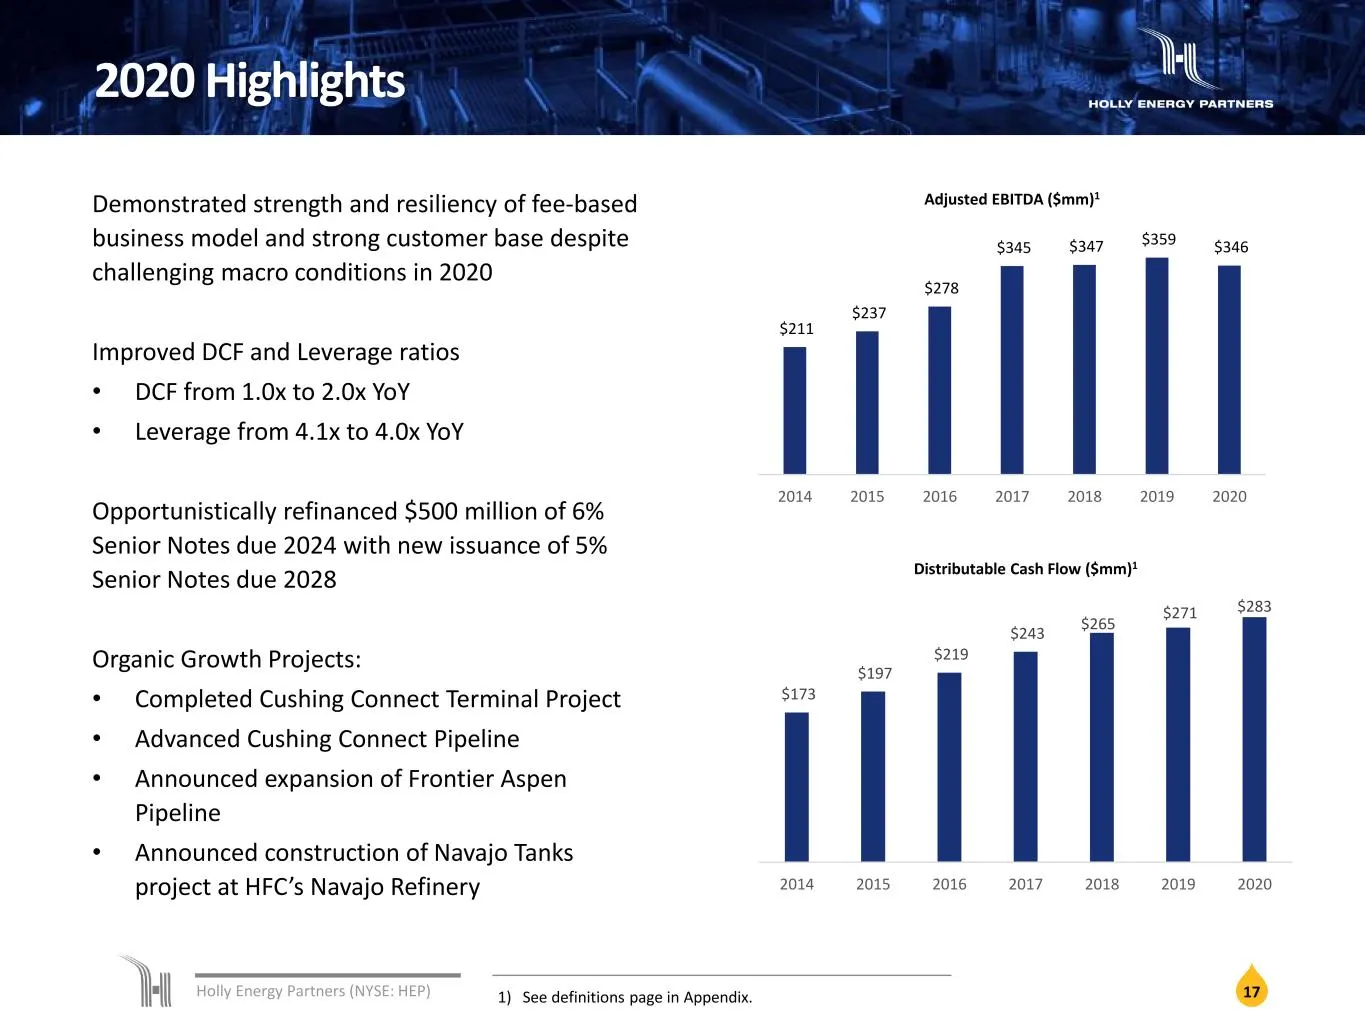
Slide 17: 2020 Highlights
Holly Energy Partners (NYSE: HEP) 17 2020 Highlights Demonstrated strength and resiliency of fee-based business model and strong customer base despite challenging macro conditions in 2020 Improved DCF and Leverage ratios • DCF from 1.0x to 2.0x YoY • Leverage from 4.1x to 4.0x YoY Opportunistically
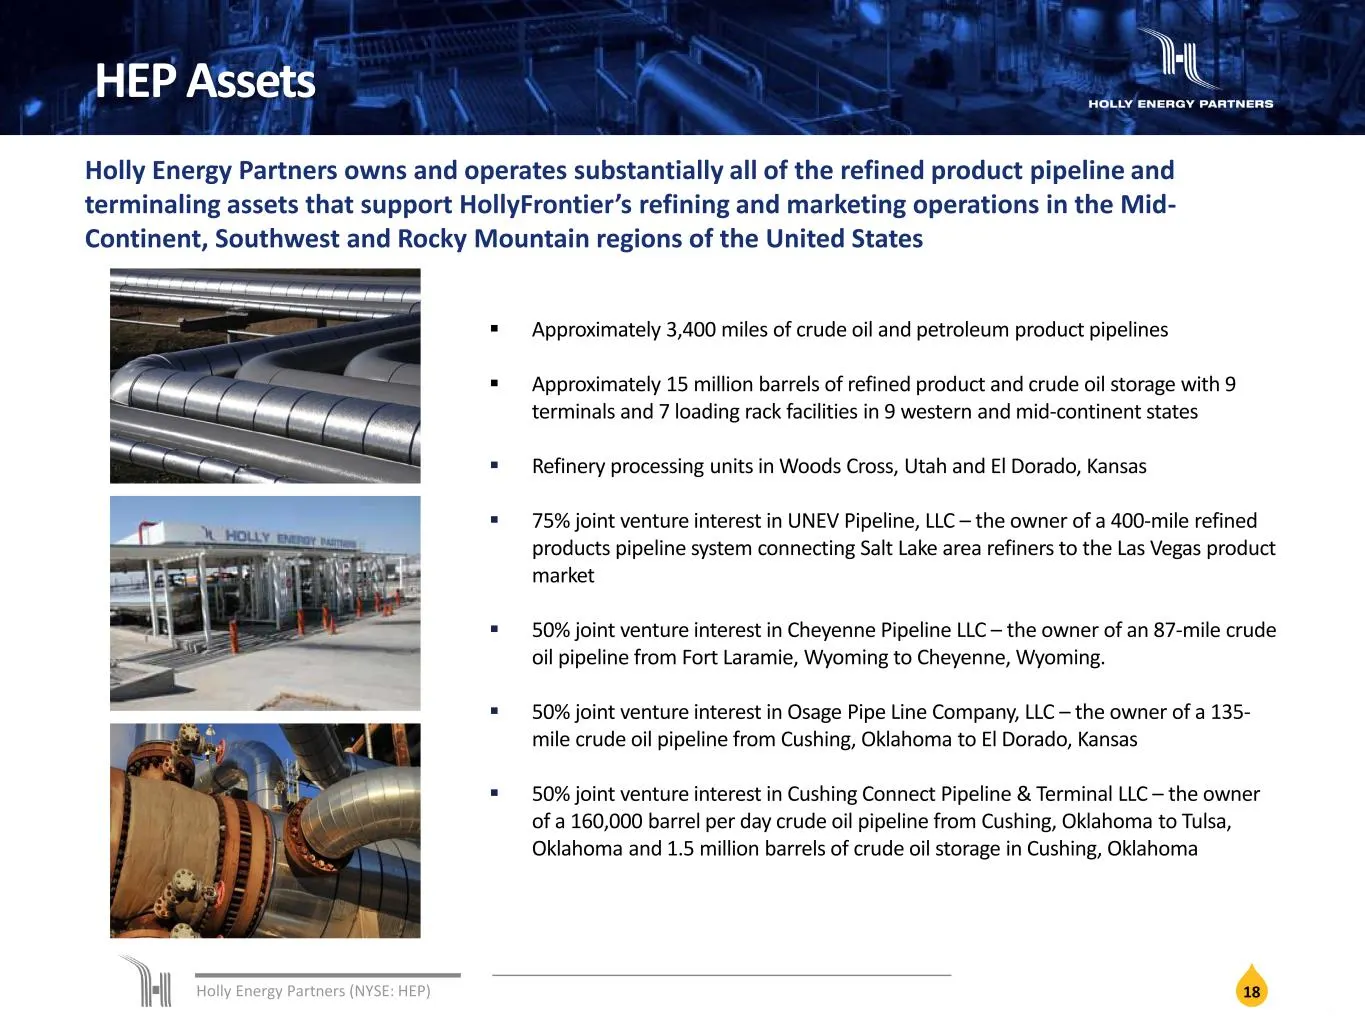
Slide 18: HEP Assets
Holly Energy Partners (NYSE: HEP) 18 HEP Assets Holly Energy Partners owns and operates substantially all of the refined product pipeline and terminaling assets that support HollyFrontier’s refining and marketing operations in the Mid- Continent, Southwest and Rocky Mountain regions of the United St
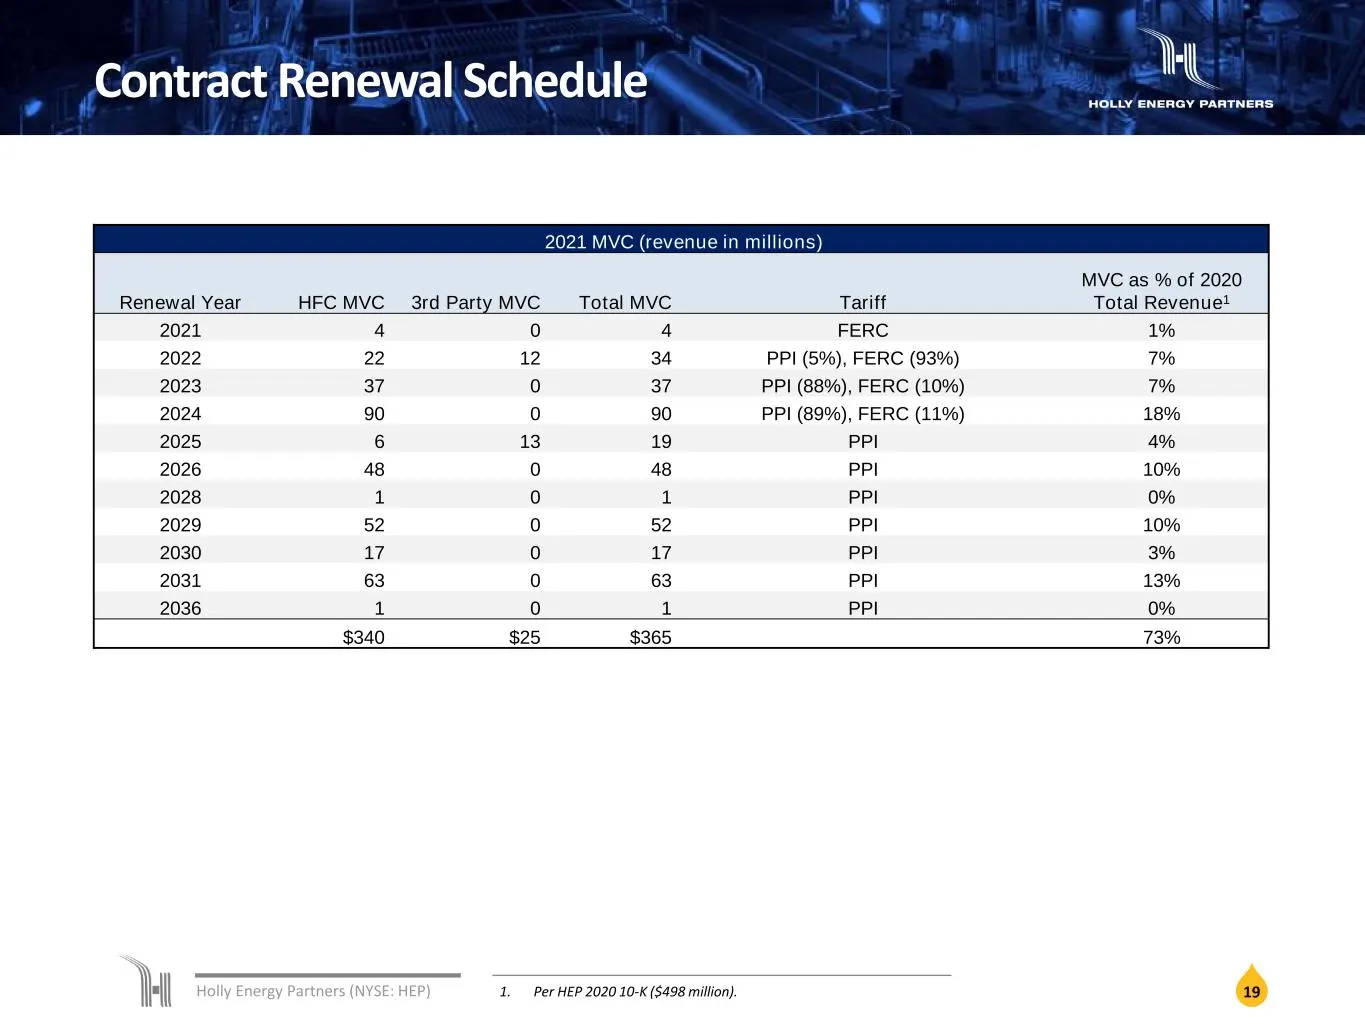
Slide 19: Contract Renewal Schedule
Holly Energy Partners (NYSE: HEP) 19 Contract Renewal Schedule 1. Per HEP 2020 10-K ($498 million). 2021 MVC (revenue in millions) Renewal Year HFC MVC 3rd Party MVC Total MVC Tariff MVC as % of 2020 Total Revenue1 2021 4 0 4 FERC 1% 2022 22 12 34 PPI (5%), FERC (93%) 7% 2023 37 0 37 PPI (88%), FERC
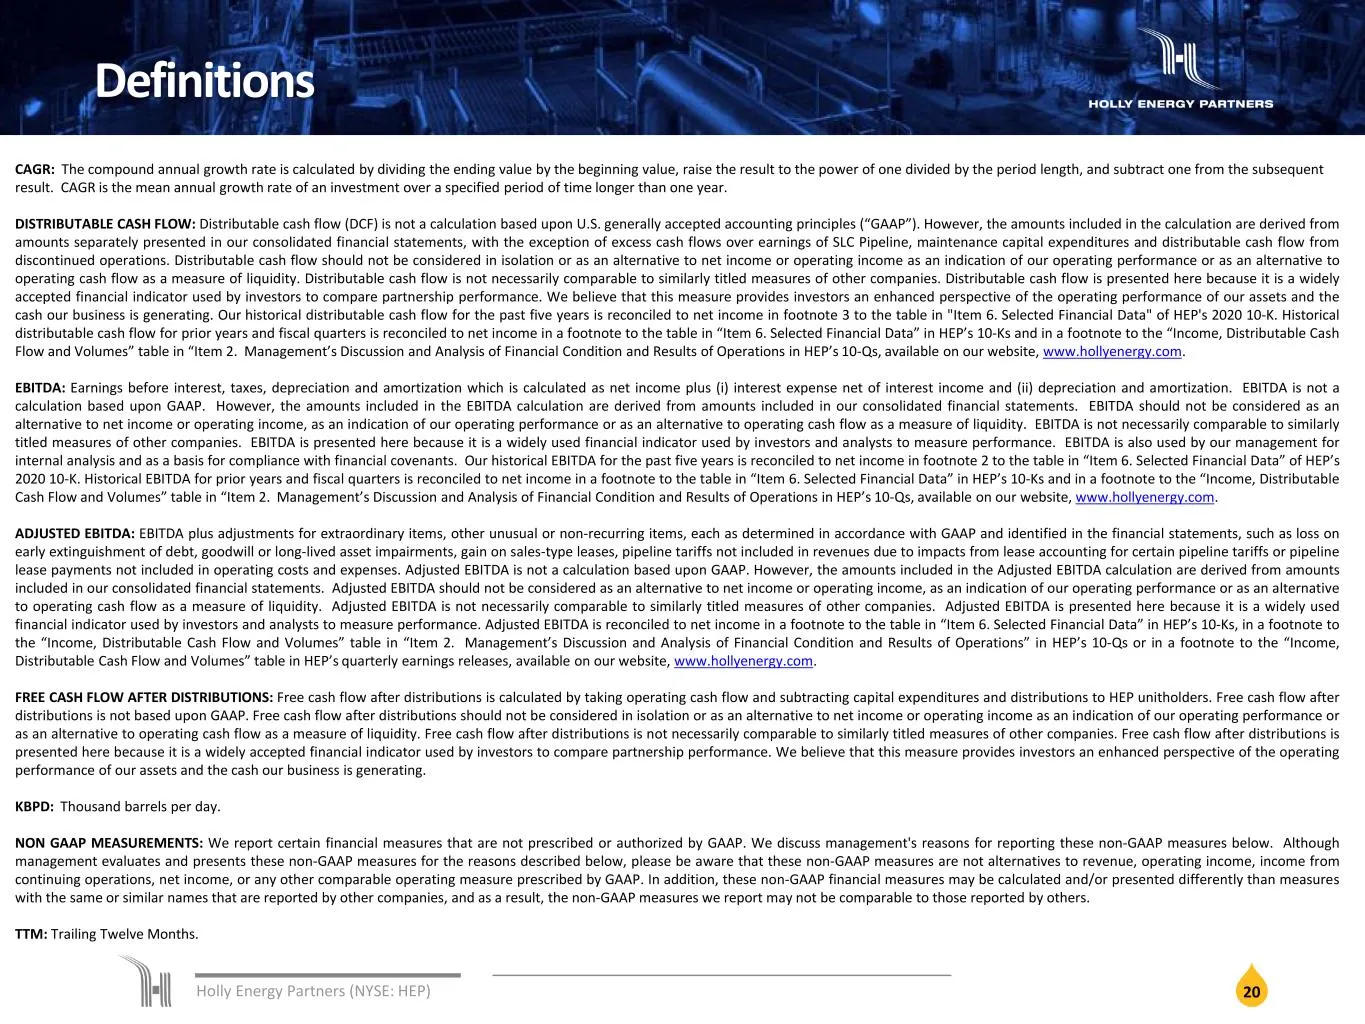
Slide 20: Definitions
Holly Energy Partners (NYSE: HEP) 20 Definitions CAGR: The compound annual growth rate is calculated by dividing the ending value by the beginning value, raise the result to the power of one divided by the period length, and subtract one from the subsequent result. CAGR is the mean annual growth rat
Source: SEC EDGAR · 8-K filed Mar 2, 2021
More decks from Holly Energy Partners LP
 Investor Presentation (March 2023)20 slides · Mar 2, 2023
 Investor Presentation (August 2022)24 slides · Aug 16, 2022
 Investor Presentation (May 2022)23 slides · May 17, 2022
 Investor Presentation (March 2022)12 slides · Mar 22, 2022
 Investor Presentation (March 2022)18 slides · Mar 1, 2022
 Investor Presentation (December 2021)18 slides · Dec 9, 2021