Newalliance Bancshares — Sterne Agee Financial Services Symposium 2009
40 slides from Newalliance Bancshares's conference presentation, Feb 6, 2009
Slide 1: NewAlliance Bancshares
NewAlliance Bancshares Sterne Agee Financial Services Symposium February 9, 2009
Slide 2: Discussion Topics
Discussion Topics Company Profile and Business Focus Key 2008 Business Priorities Highlights of 2008 Credit Quality Key 2009 Business Priorities 2
Slide 3: Company Profile
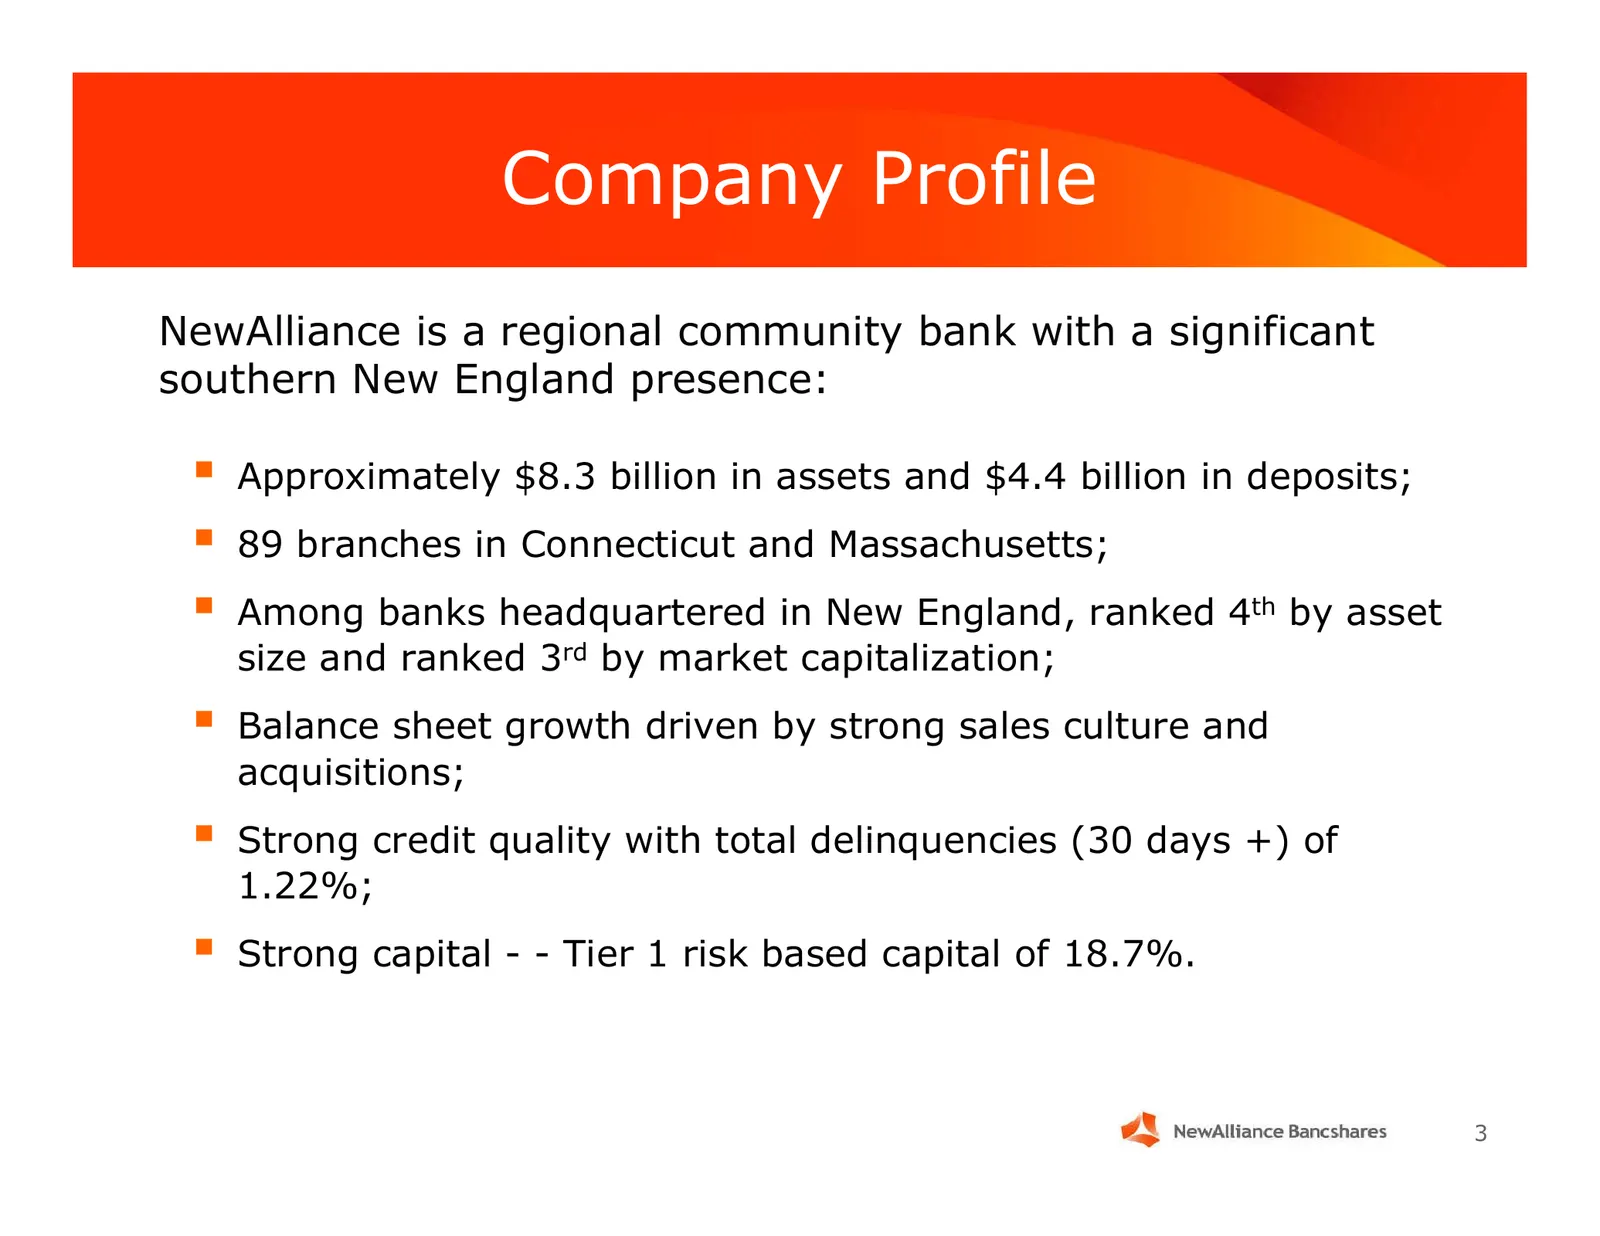
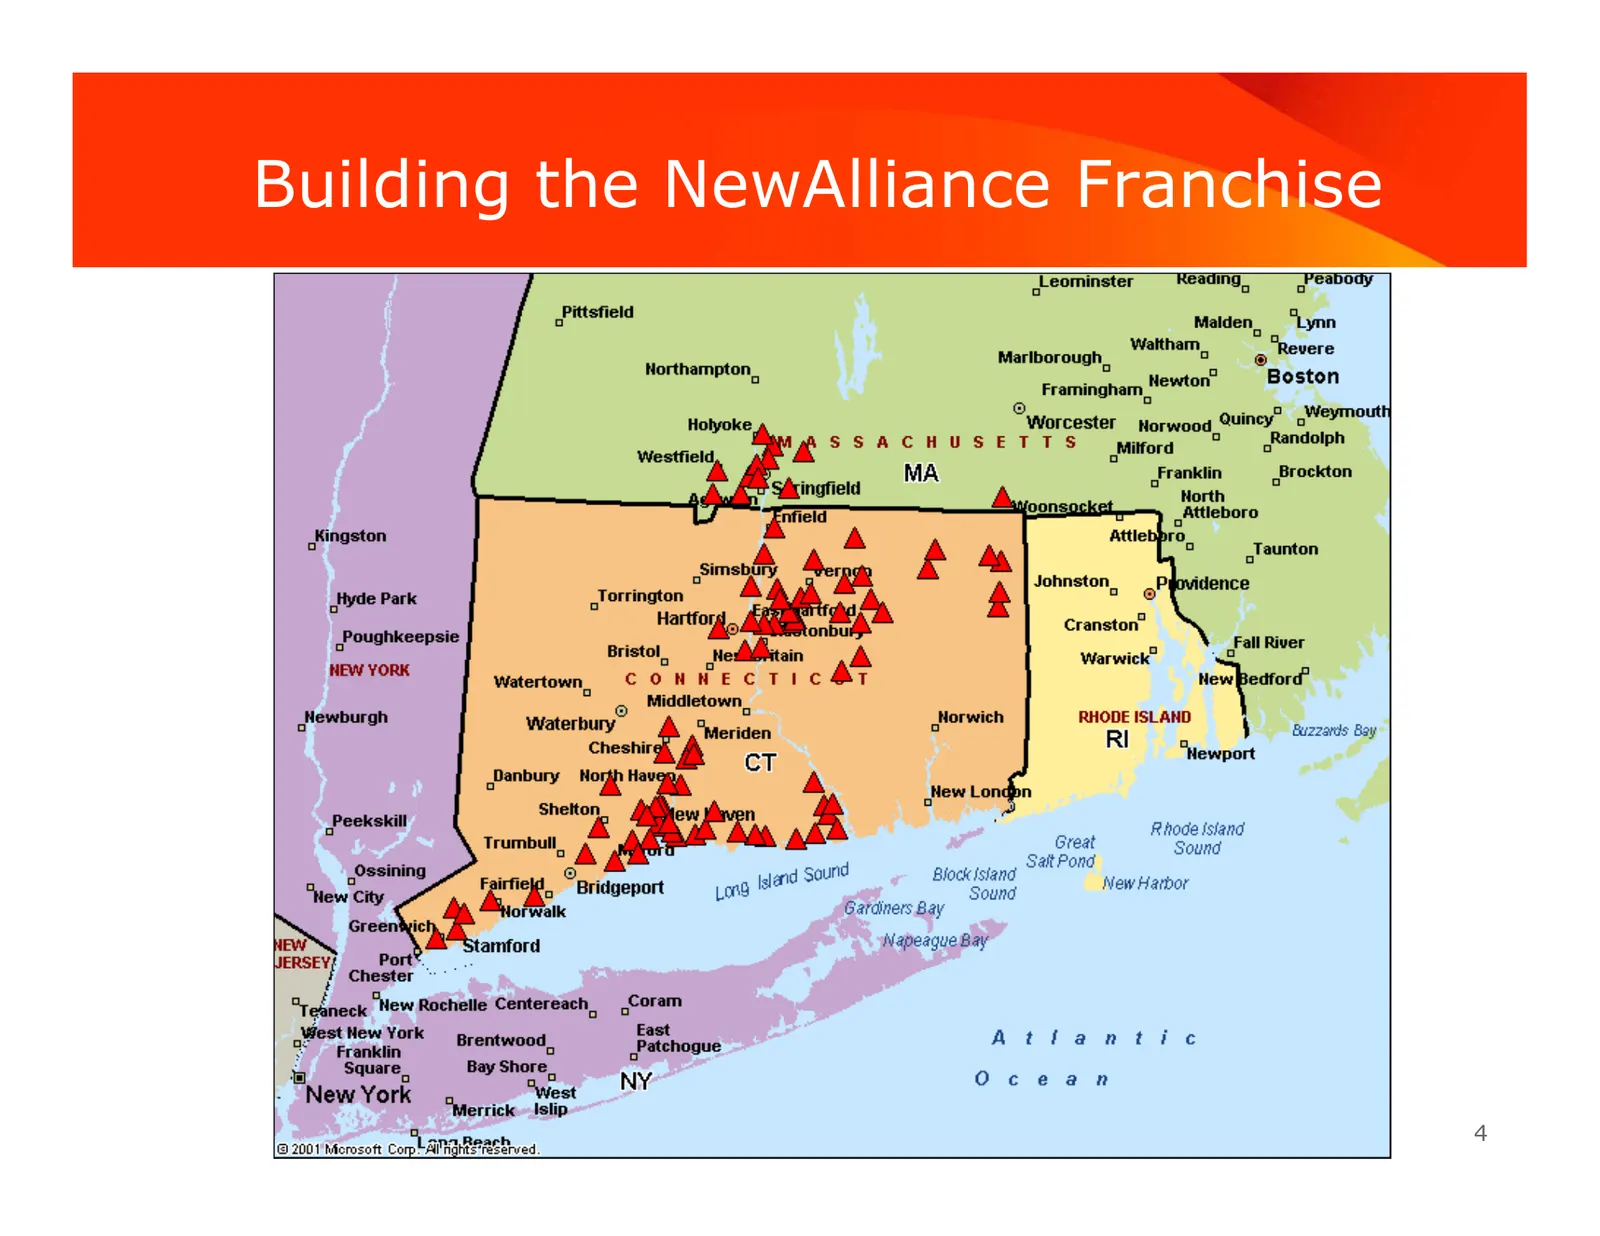
Company Profile NewAlliance is a regional community bank with a significant southern New England presence: Approximately $8.3 billion in assets and $4.4 billion in deposits; 89 branches in Connecticut and Massachusetts; Among banks headquartered in New England, ranked 4th by asset size and ran
Slide 4: Building the NewAlliance Franchise
Building the NewAlliance Franchise 4
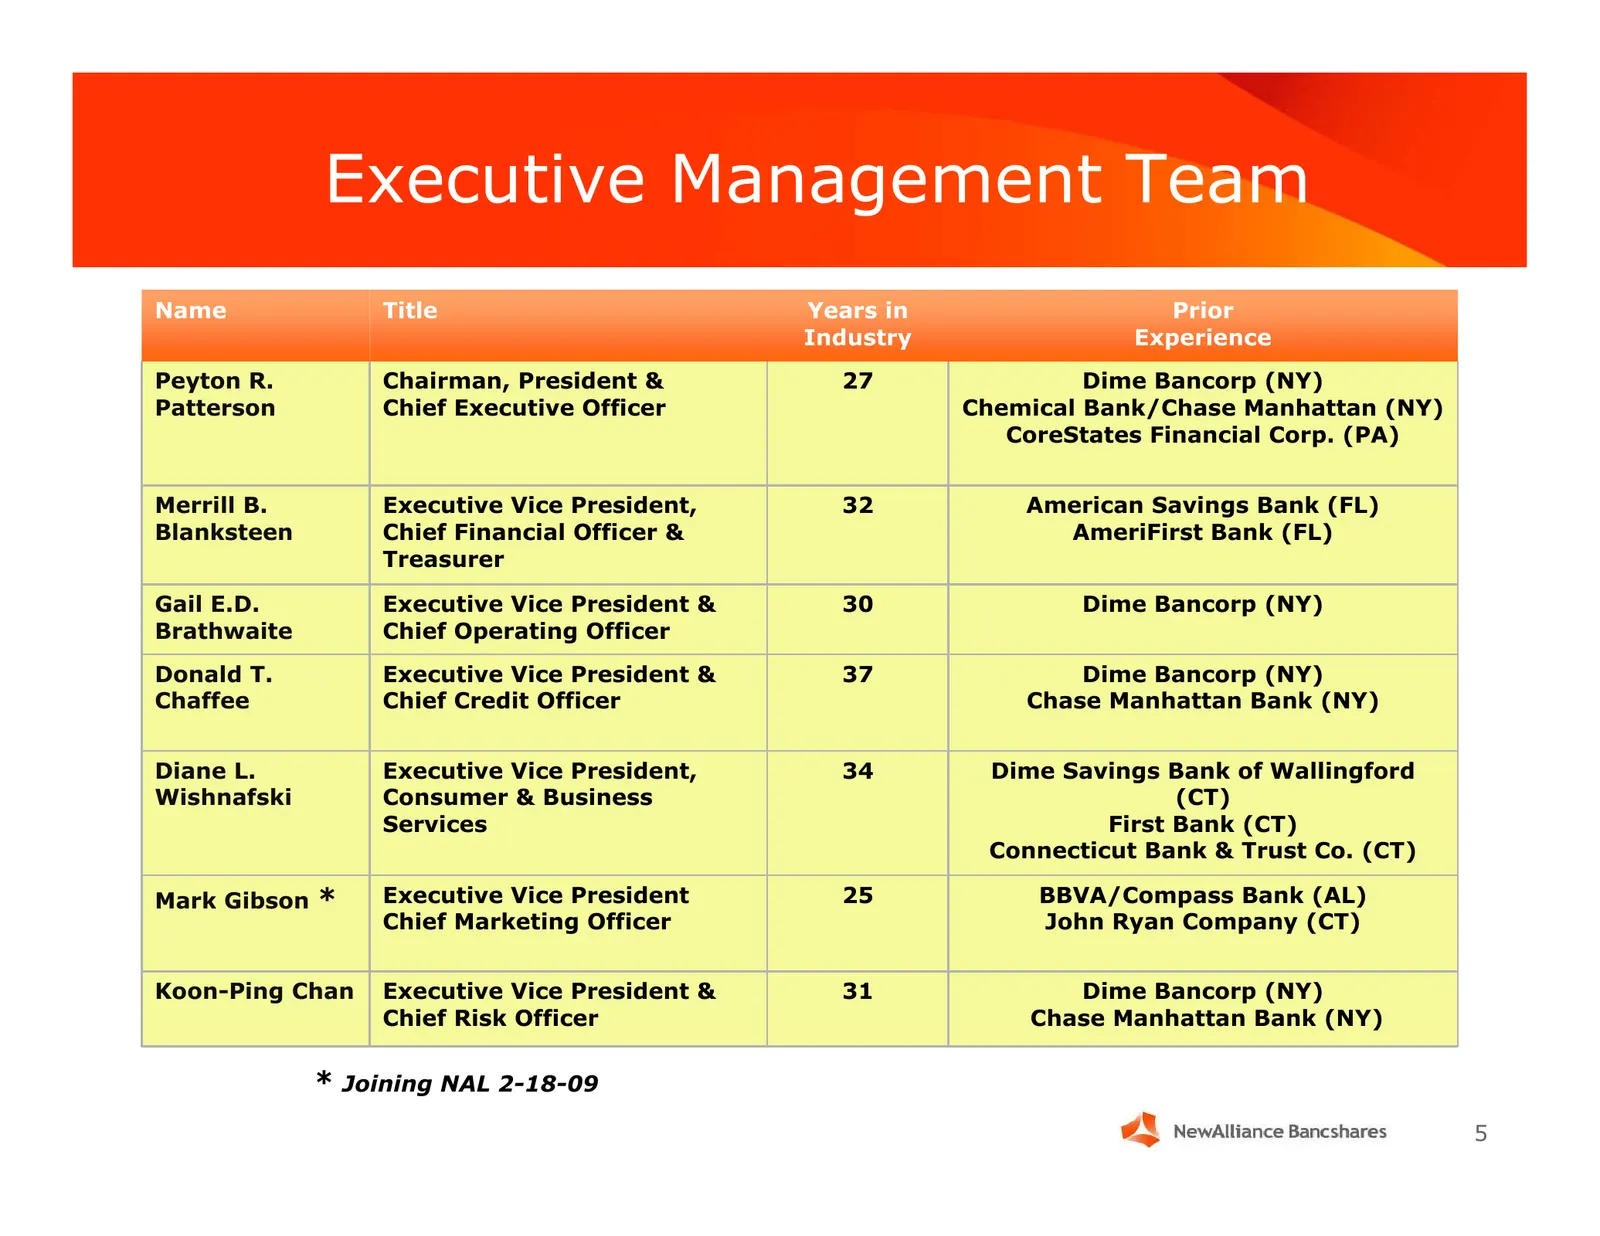
Slide 5: Executive Management Team
Executive Management Team Name Title Years in Prior Industry Experience Peyton R. Chairman, President & 27 Dime Bancorp (NY) Patterson Chief Executive Officer Chemical Bank/Chase Manhattan (NY) CoreStates Financial Corp. (PA) Merrill B. Executive Vice President, 32 American Savings Bank (FL) Blankst
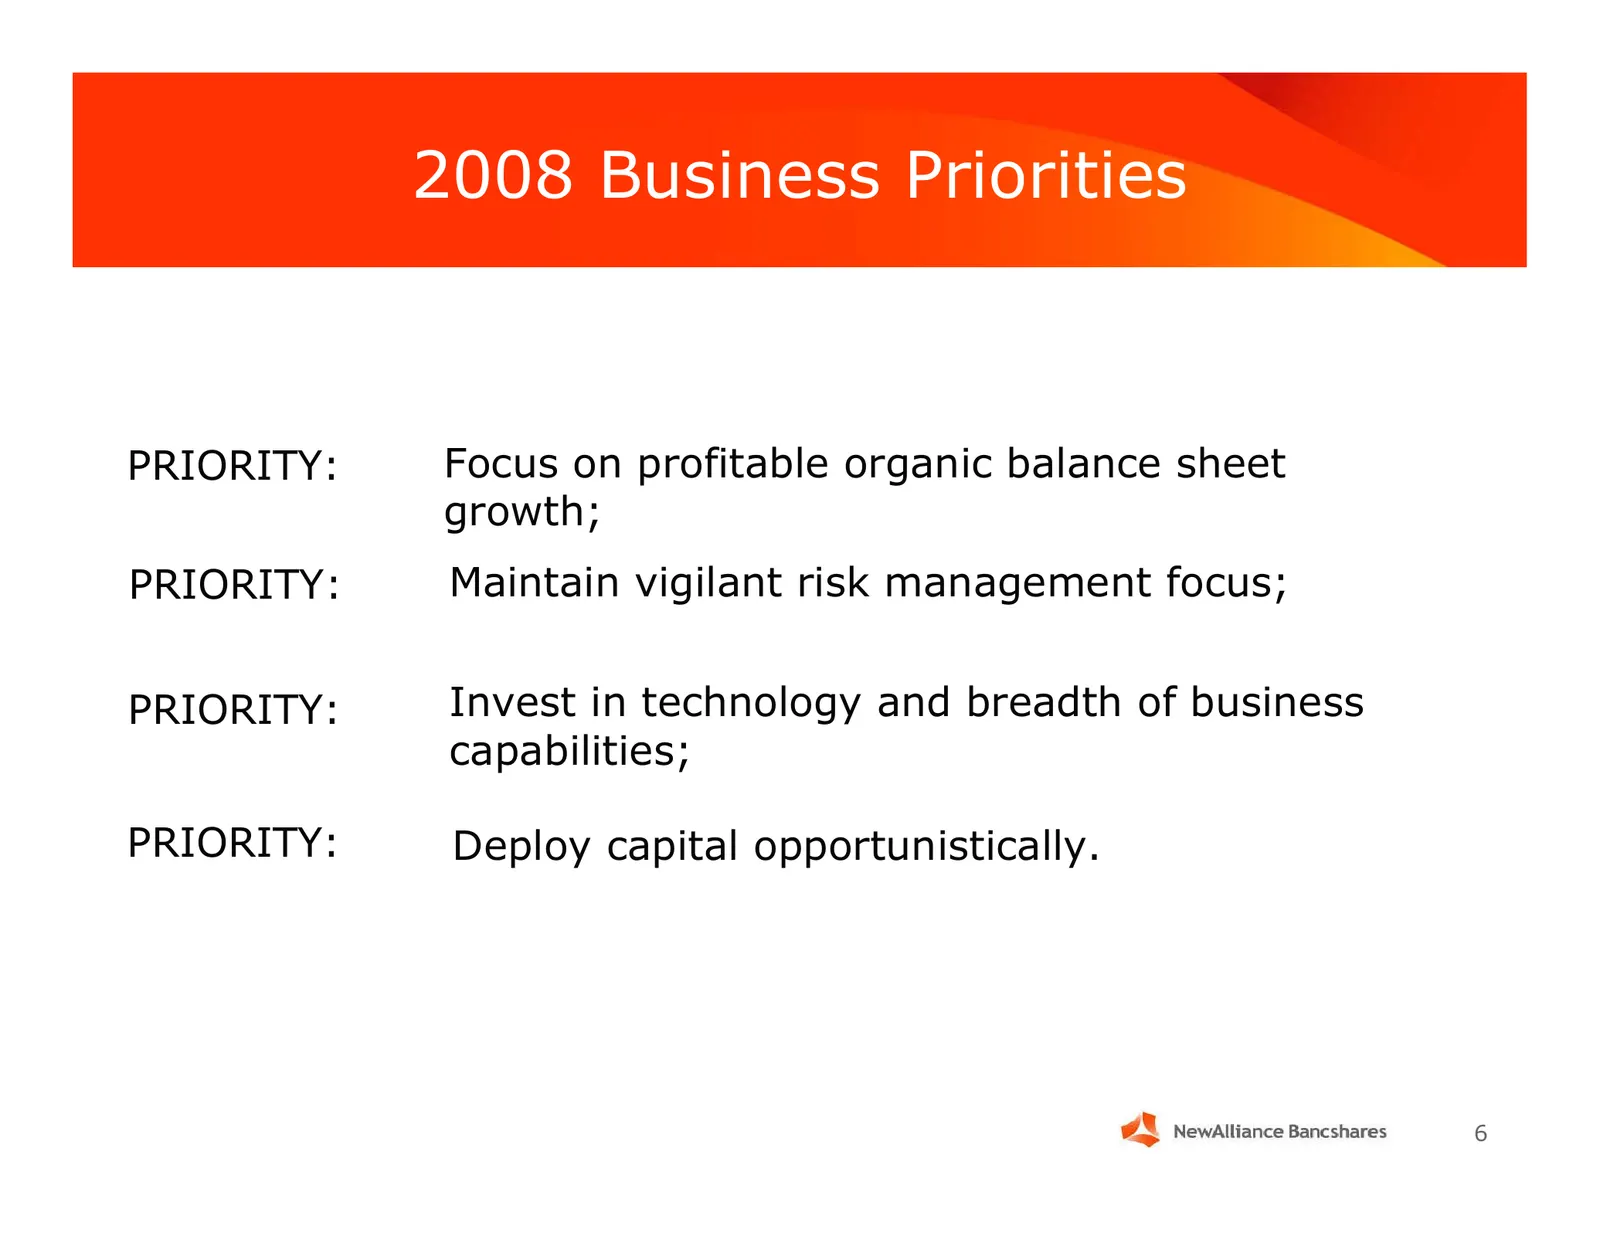
Slide 6: 2008 Business Priorities
2008 Business Priorities PRIORITY: Focus on profitable organic balance sheet growth; PRIORITY: Maintain vigilant risk management focus; PRIORITY: Invest in technology and breadth of business capabilities; PRIORITY: Deploy capital opportunistically. 6
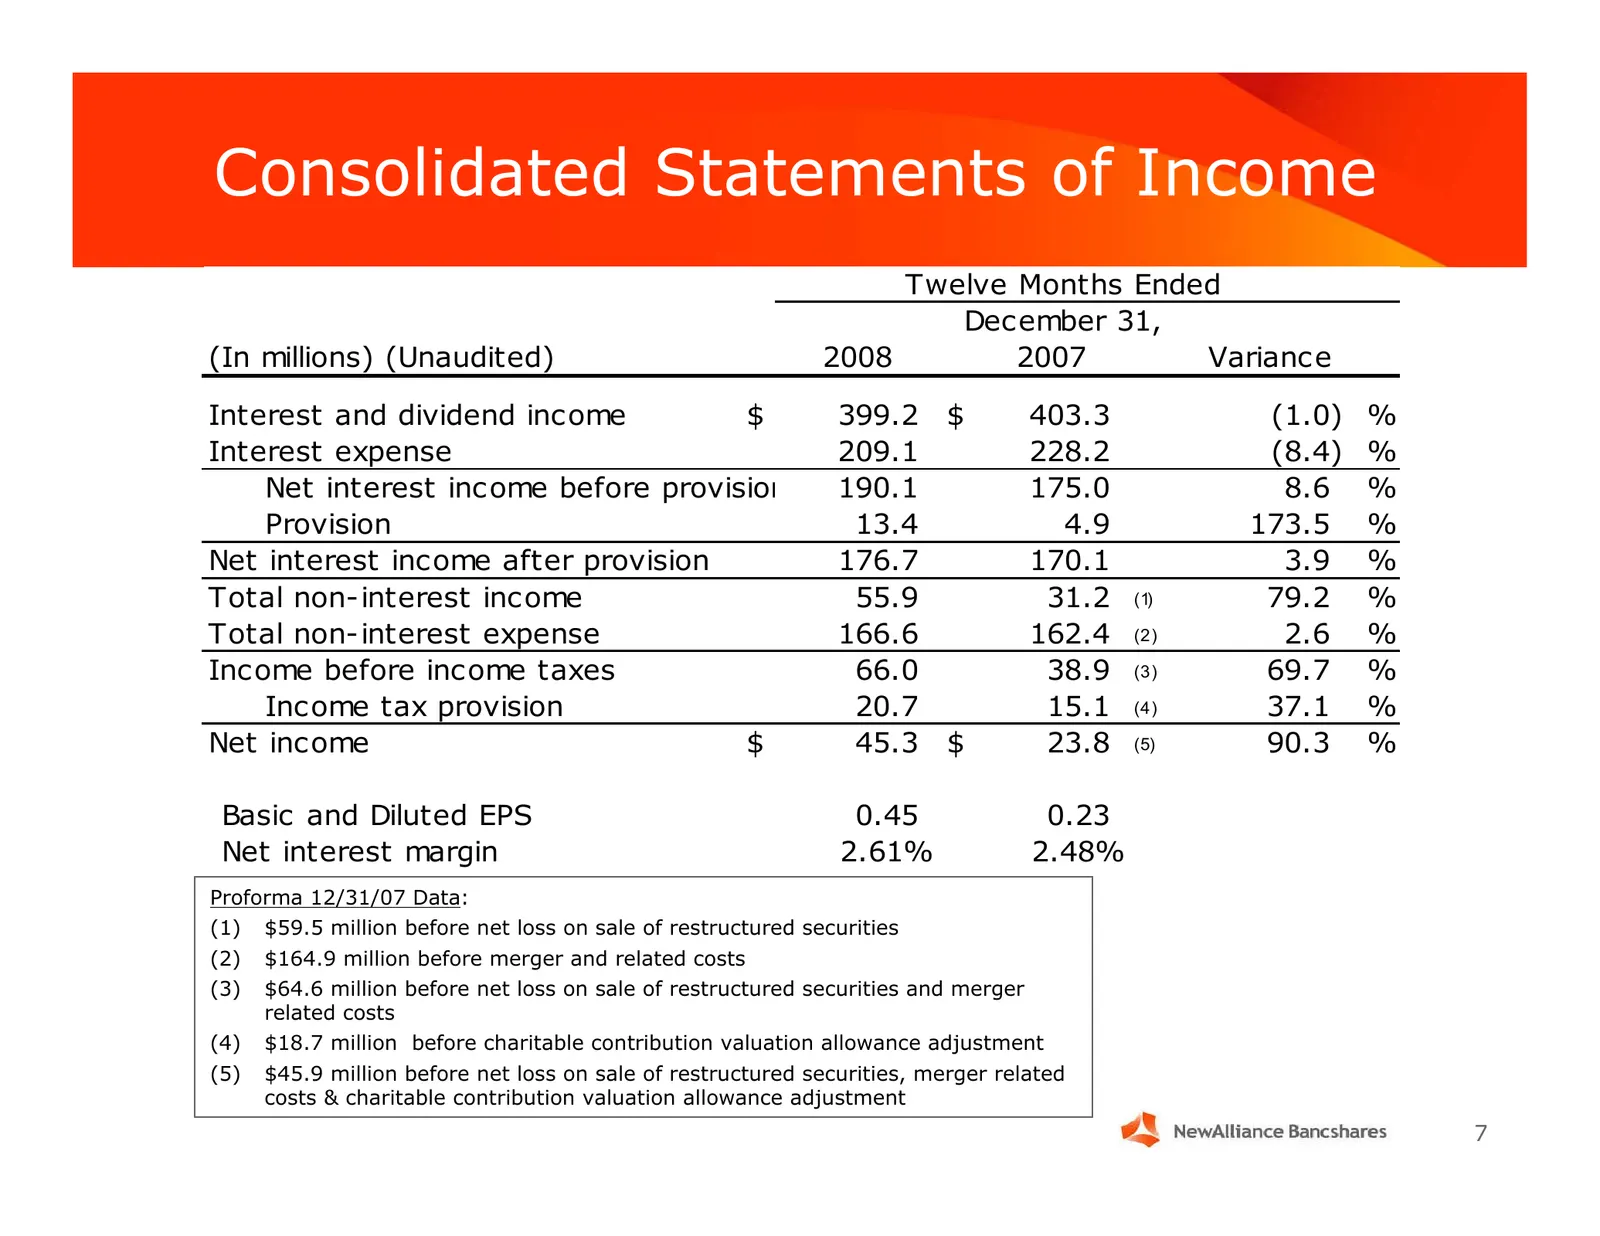
Slide 7: Consolidated Statements of Income
Consolidated Statements of Income Twelve Months Ended December 31, (In millions) (Unaudited) 2008 2007 Variance Interest and dividend income $ 399.2 $ 403.3 (1.0) % Interest expense 209.1 228.2 (8.4) % Net interest income before provision 190.1 175.0 8.6 % Provision 13.4 4.9 173.5 % Net interest inc
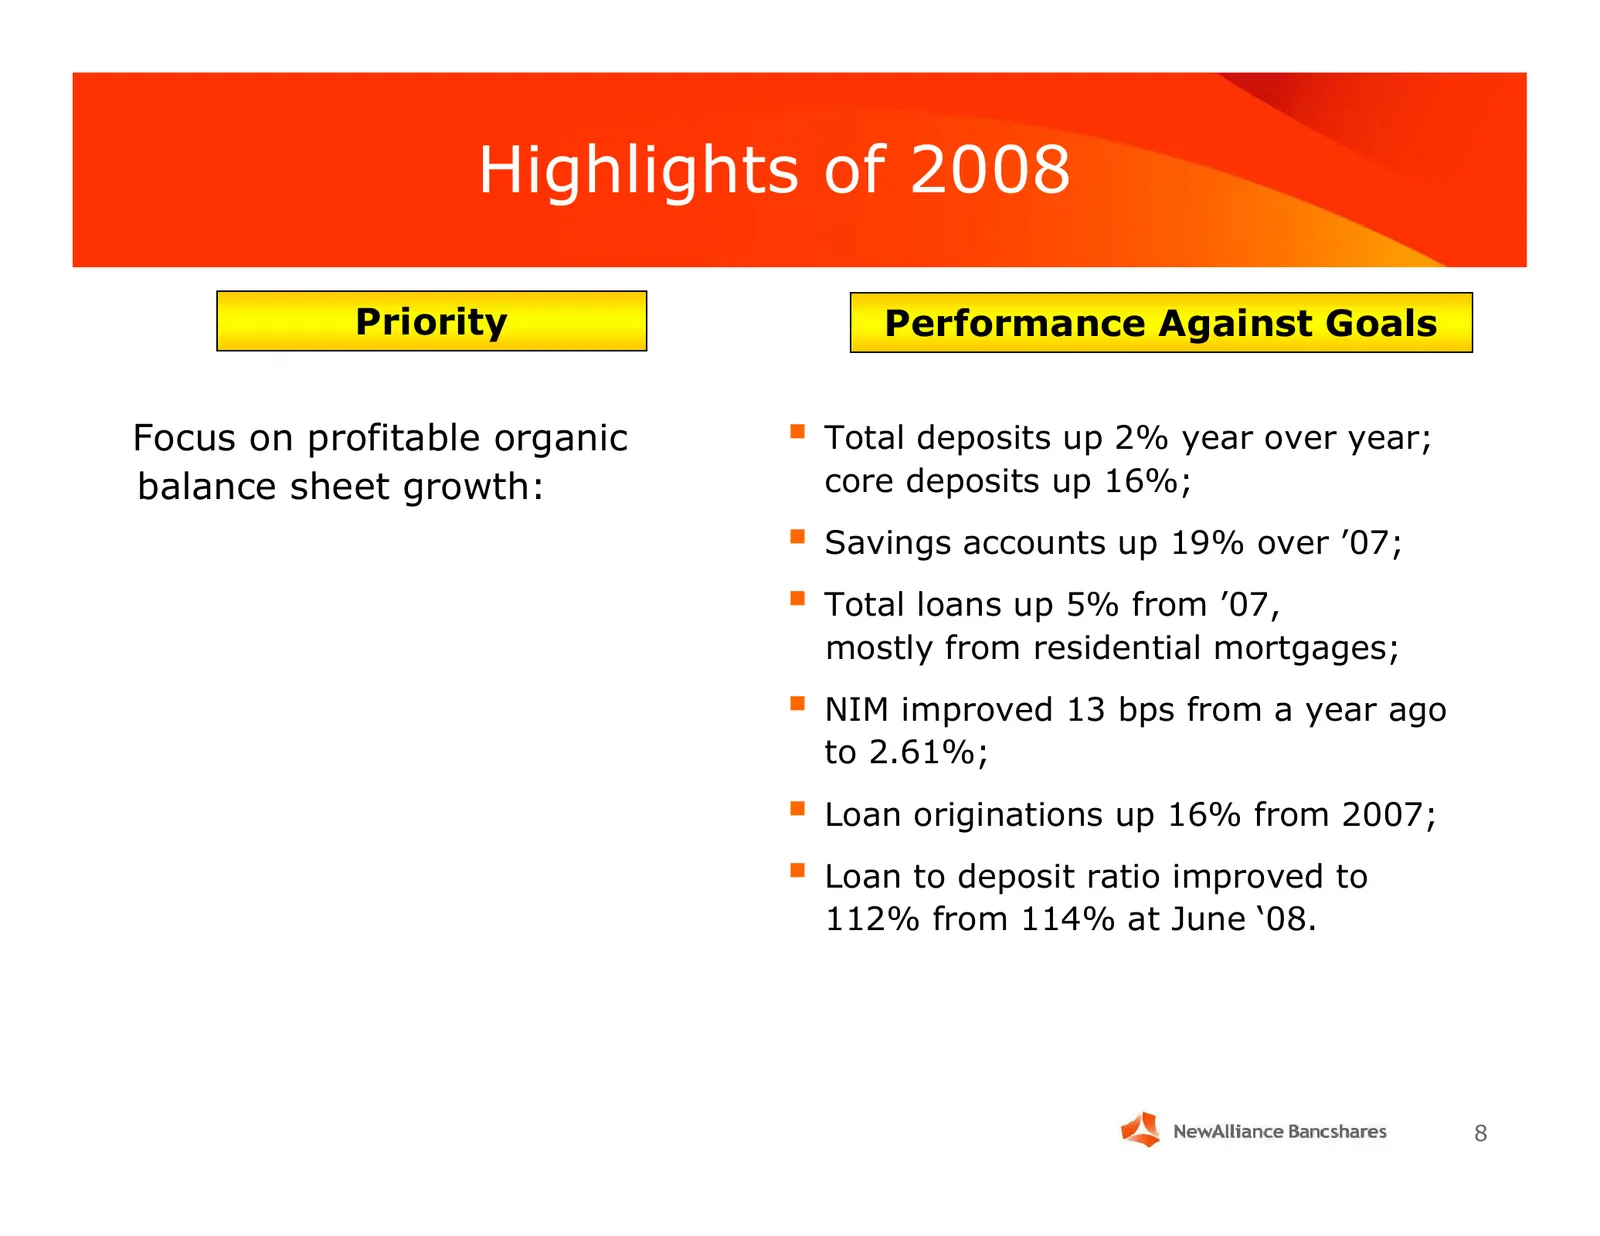
Slide 8: Highlights of 2008
Highlights of 2008 Priority Performance Against Goals Focus on profitable organic Total deposits up 2% year over year; balance sheet growth: core deposits up 16%; Savings accounts up 19% over ’07; Total loans up 5% from ’07, mostly from residential mortgages; NIM improved 13 bps from a year
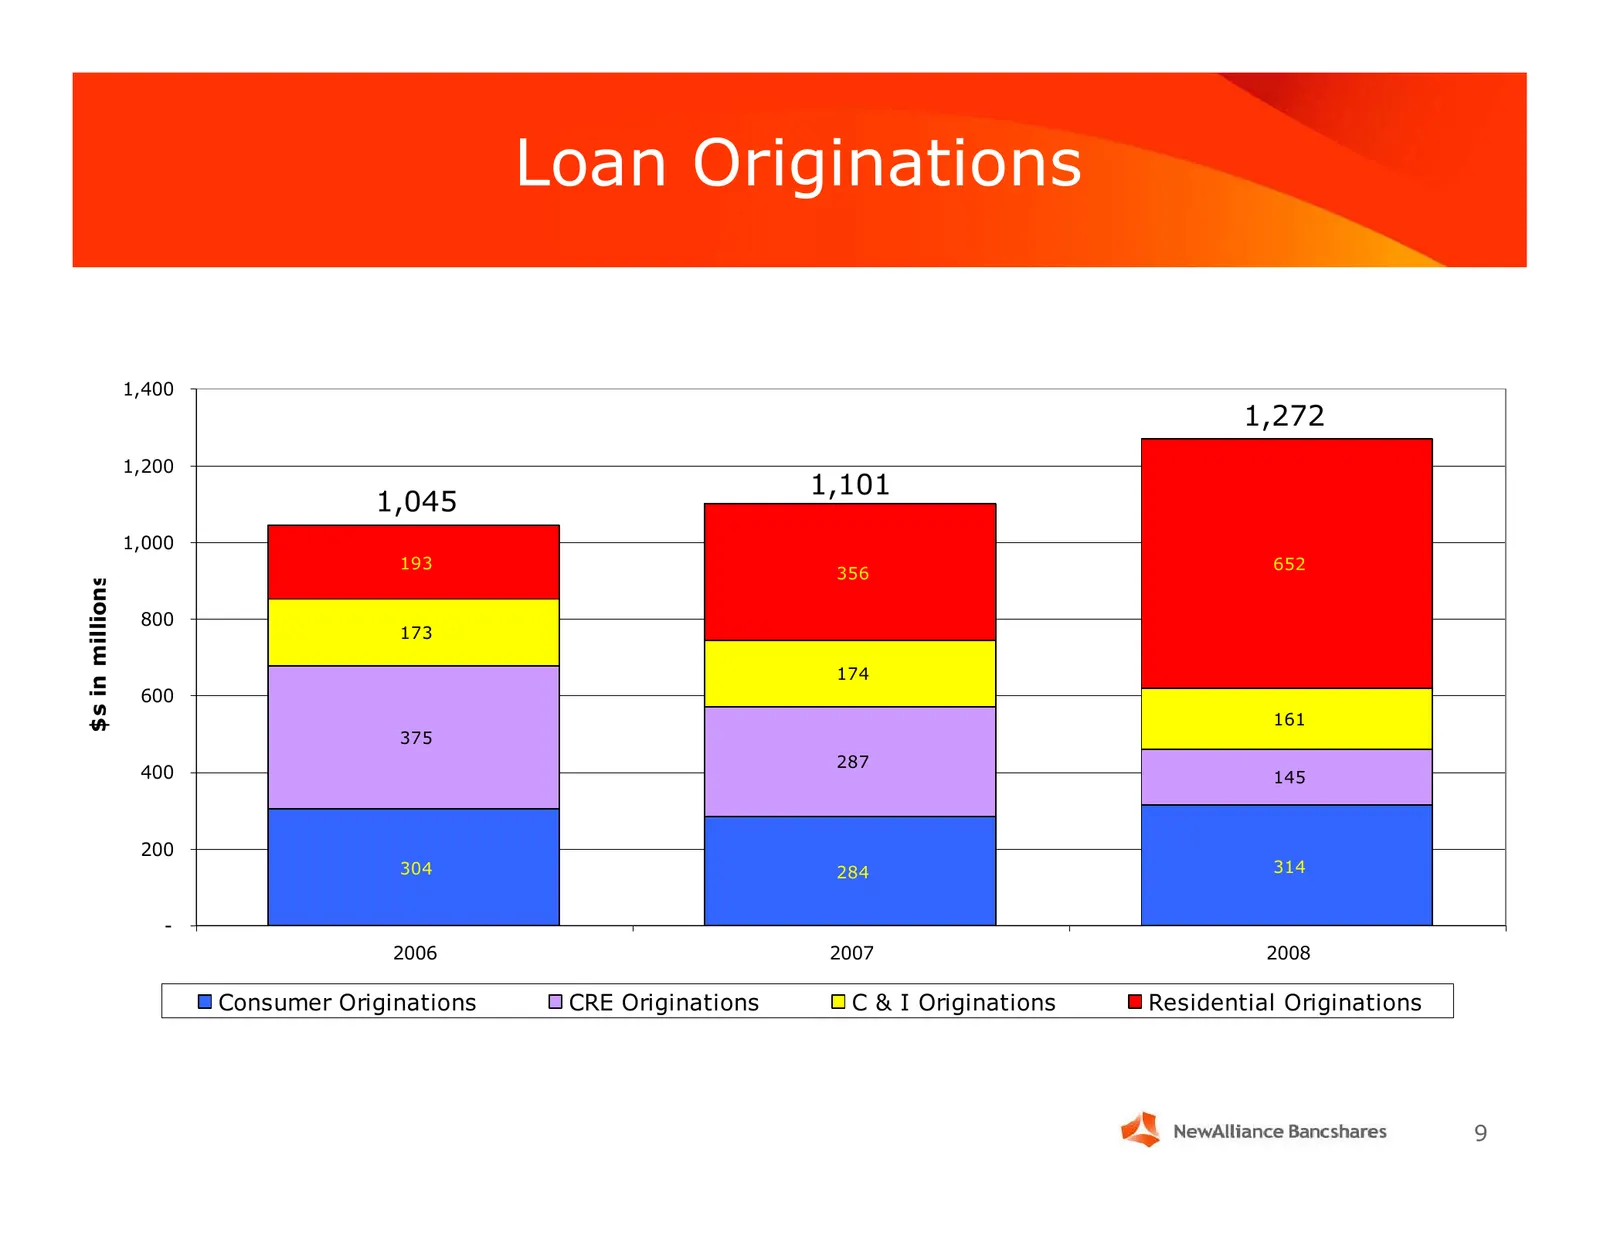
Slide 9: Loan Originations
Loan Originations 1,400 1,272 1,200 1,101 1,045 1,000 193 652 356 $s in millions 800 173 174 600 161 375 287 400 145 200 304 284 314 - 2006 2007 2008 Consumer Originations CRE Originations C & I Originations Residential Originations 9
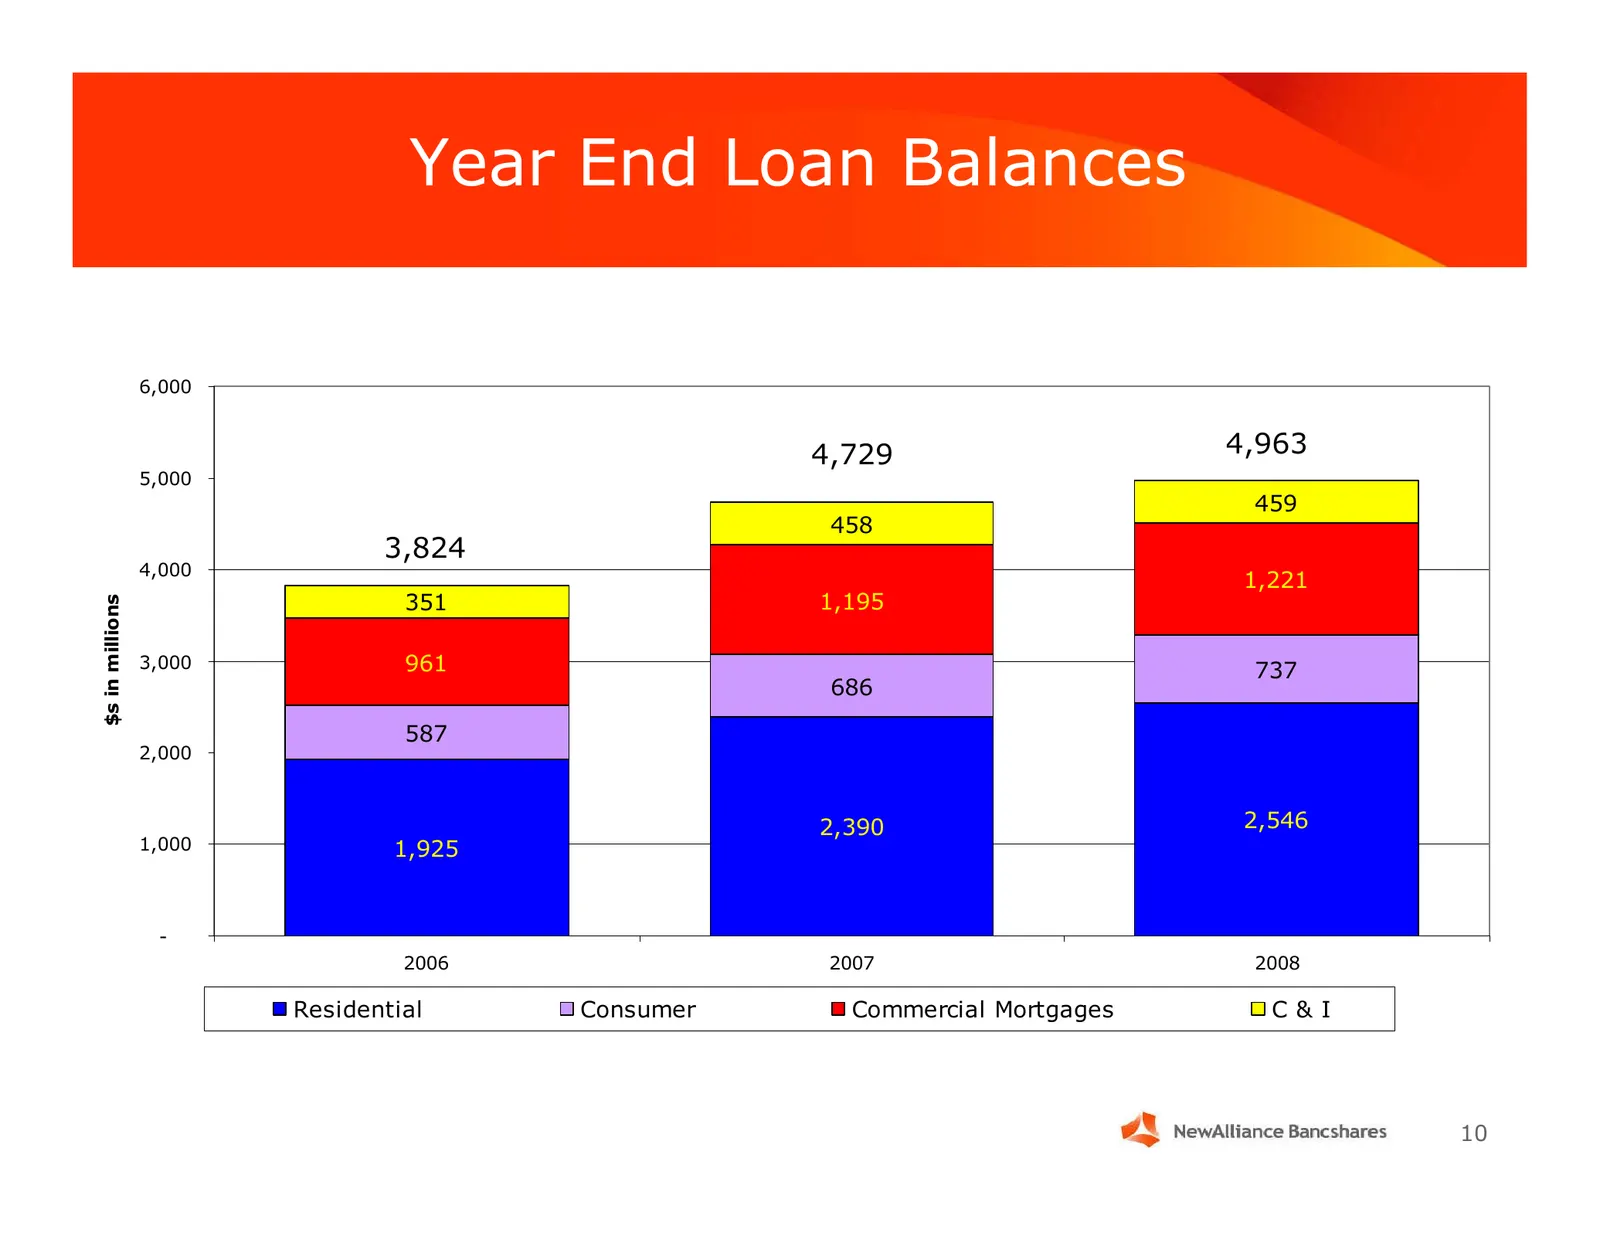
Slide 10: Year End Loan Balances
Year End Loan Balances 6,000 4,729 4,963 5,000 459 458 3,824 4,000 1,221 351 1,195 $s in millions 3,000 961 737 686 587 2,000 2,390 2,546 1,000 1,925 - 2006 2007 2008 Residential Consumer Commercial Mortgages C&I 10
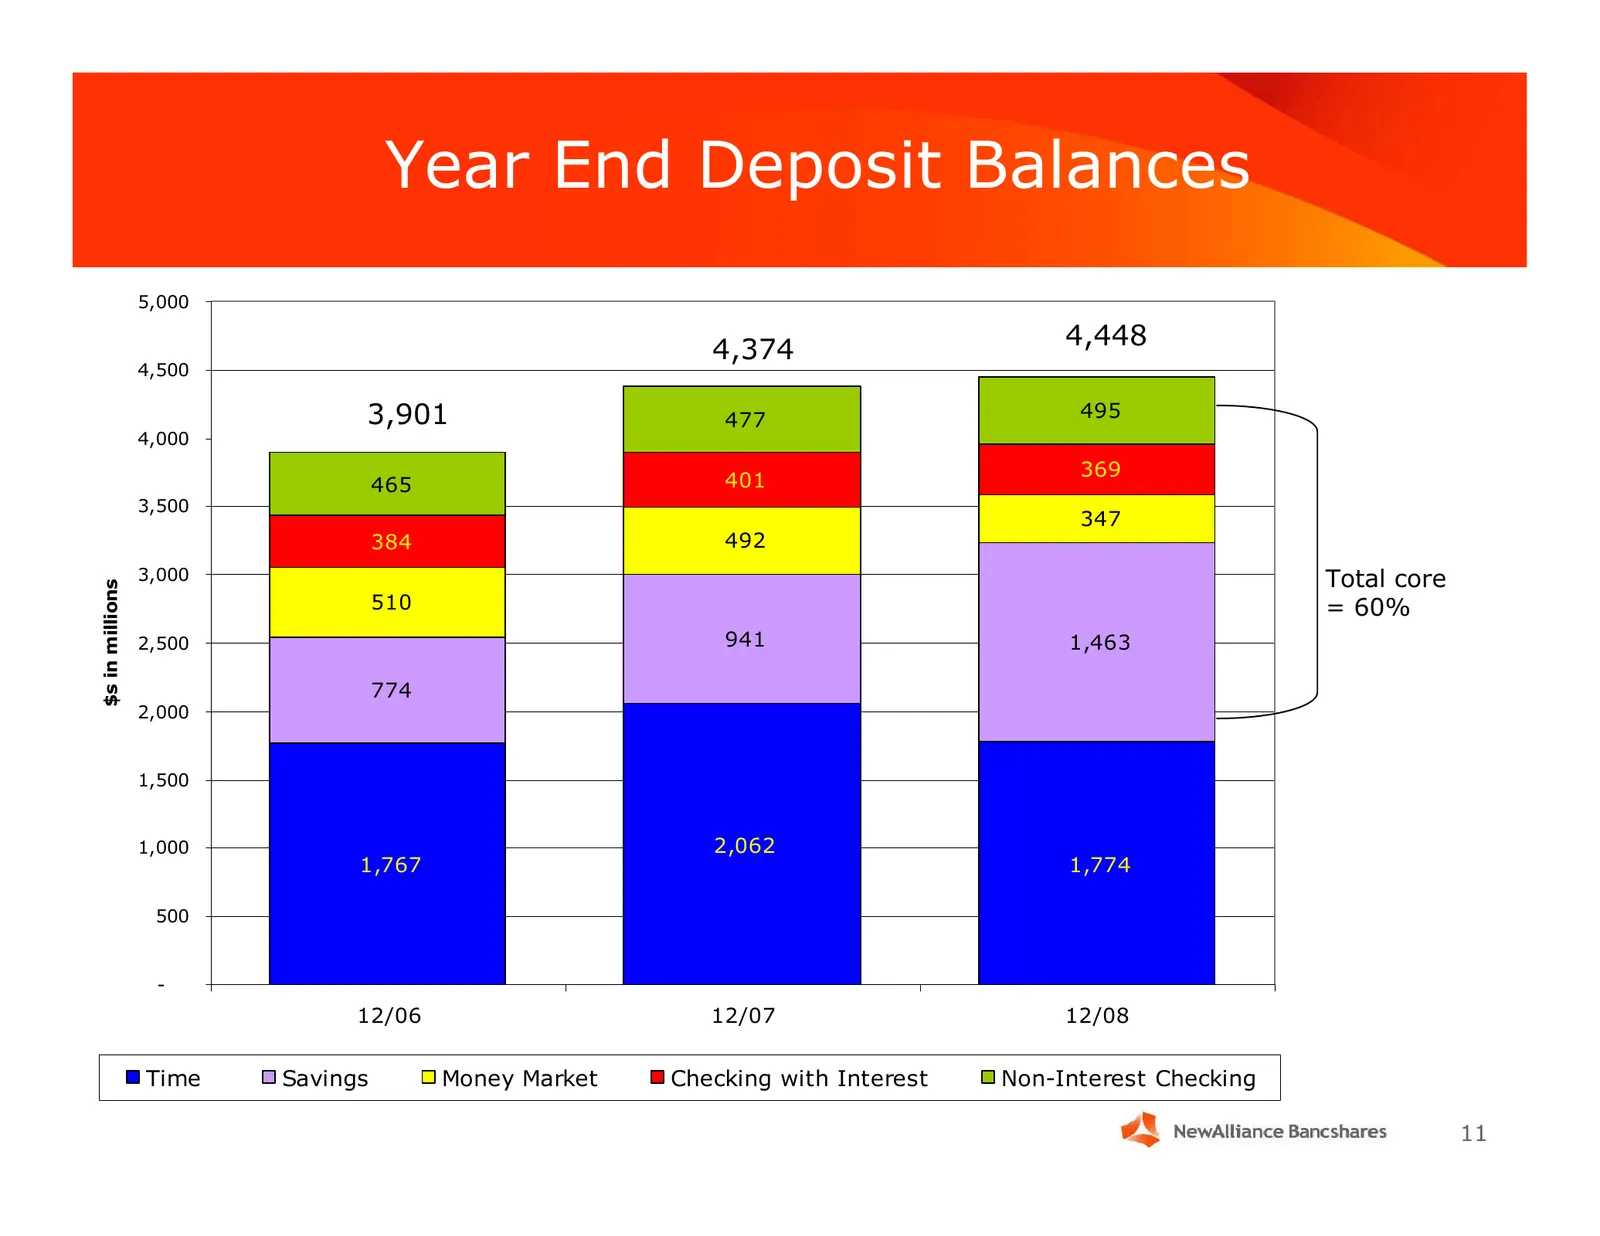
Slide 11: Year End Deposit Balances
Year End Deposit Balances 5,000 4,448 4,374 4,500 3,901 477 495 4,000 369 465 401 3,500 347 384 492 3,000 Total core $s in millions 510 = 60% 2,500 941 1,463 774 2,000 1,500 1,000 2,062 1,767 1,774 500 - 12/06 12/07 12/08 Time Savings Money Market Checking with Interest Non-Interest Checking 11
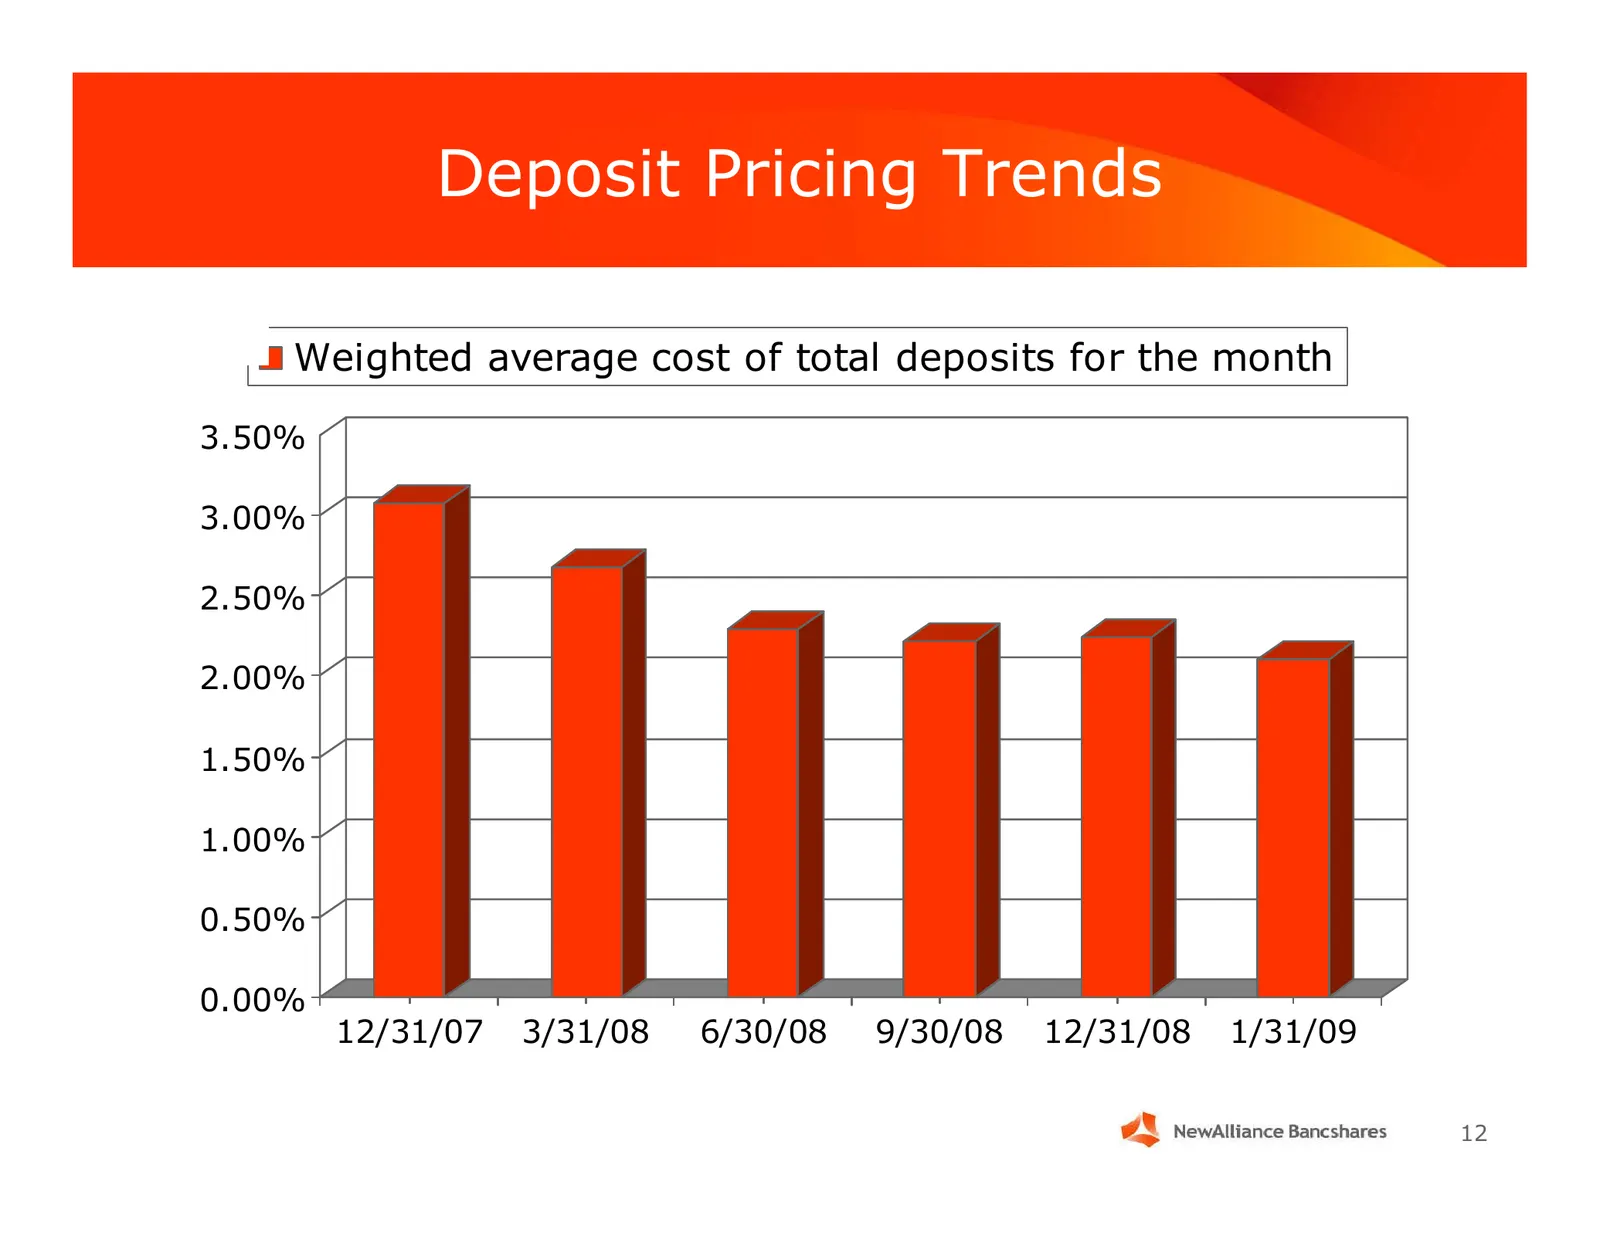
Slide 12: Deposit Pricing Trends
Deposit Pricing Trends Weighted average cost of total deposits for the month 3.50% 3.00% 2.50% 2.00% 1.50% 1.00% 0.50% 0.00% 12/31/07 3/31/08 6/30/08 9/30/08 12/31/08 1/31/09 12
Slide 13: 2008 Year End Highlights
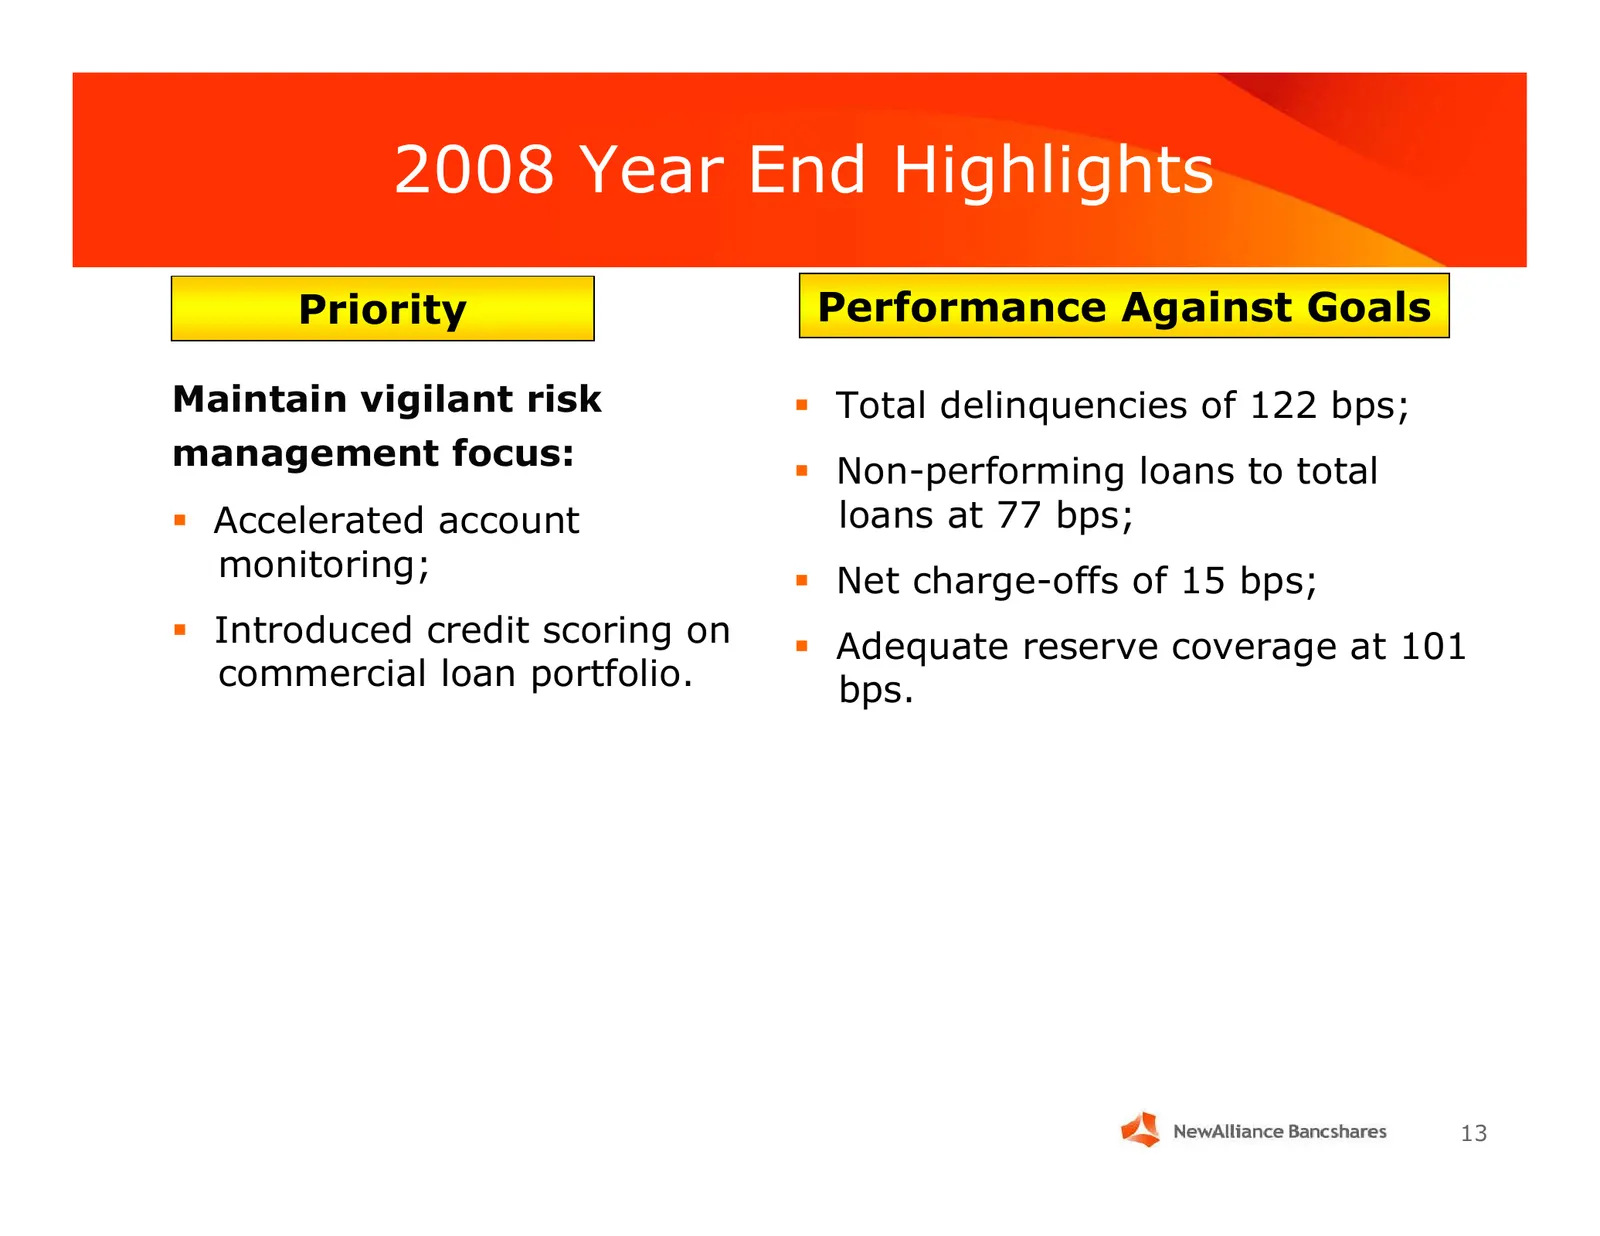
2008 Year End Highlights Priority Performance Against Goals Maintain vigilant risk Total delinquencies of 122 bps; management focus: Non-performing loans to total Accelerated account loans at 77 bps; monitoring; Net charge-offs of 15 bps; Introduced credit scoring on Adequate reserve cov
Slide 14: 2008 Year End Highlights
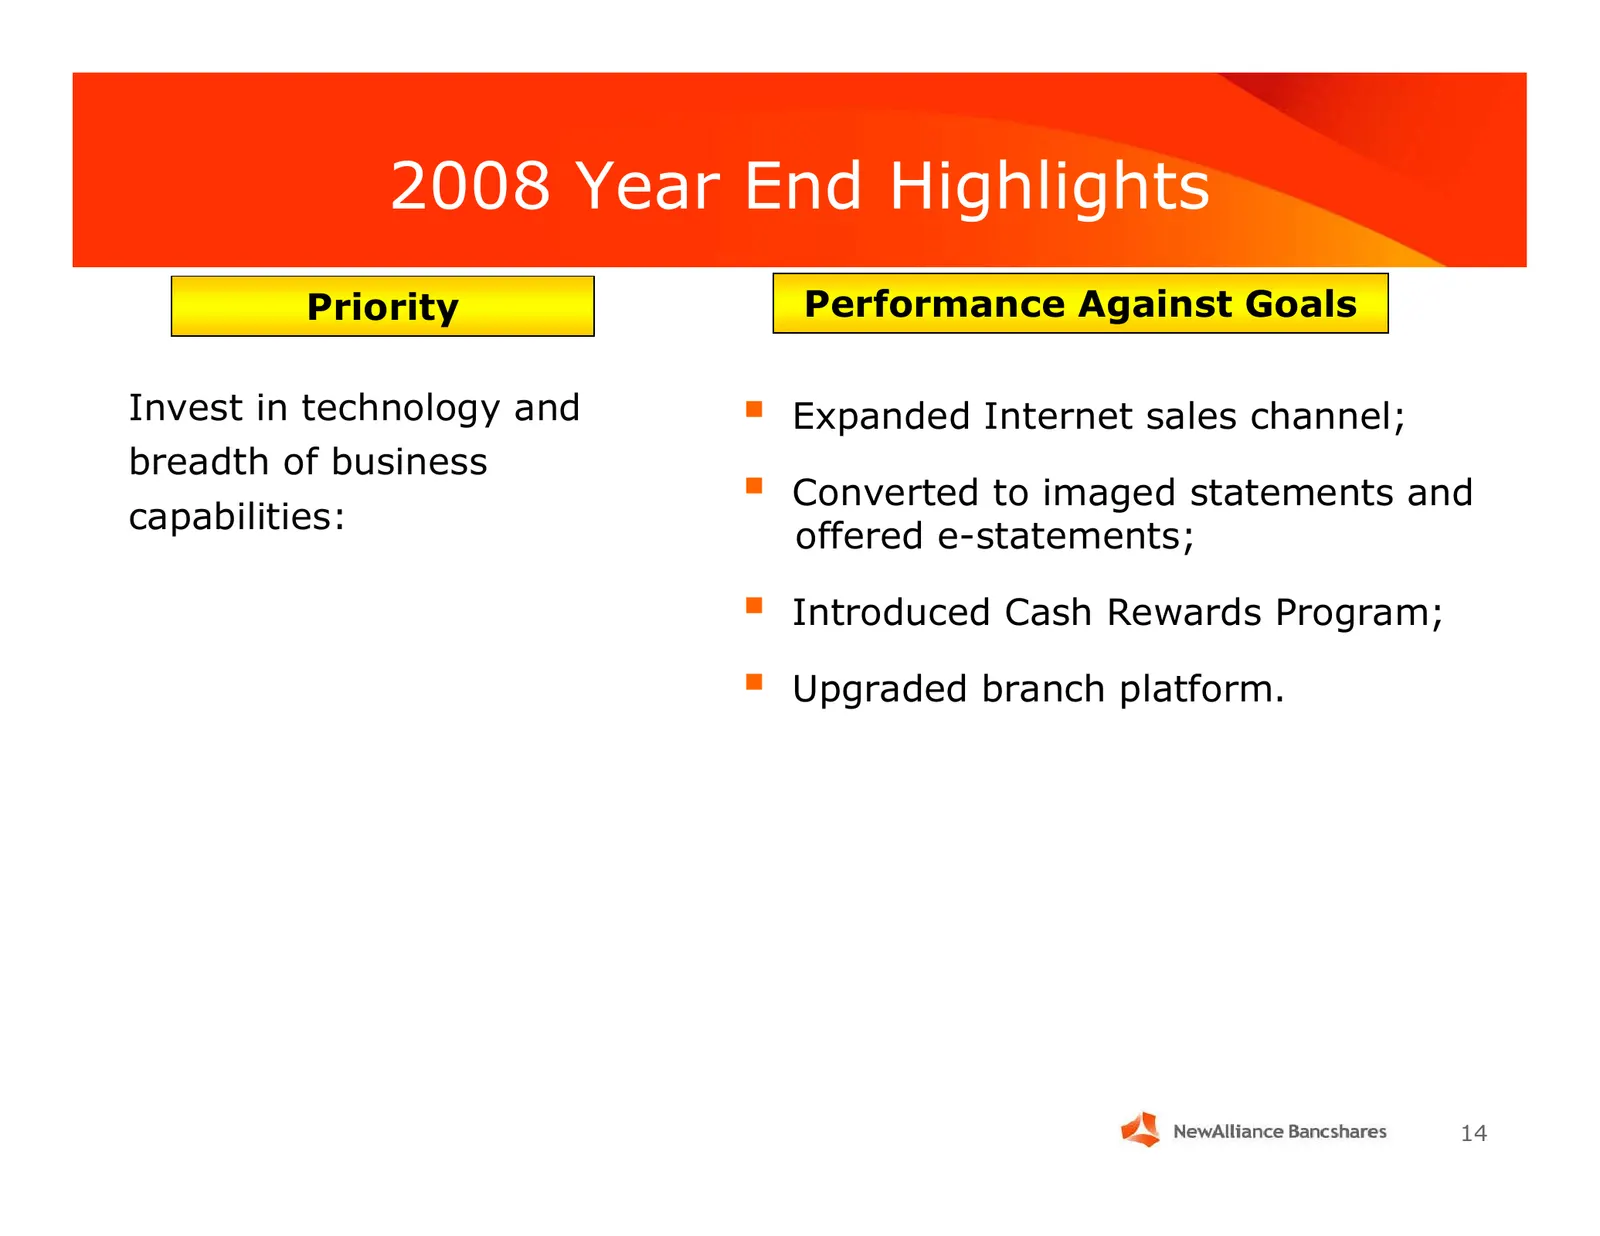
2008 Year End Highlights Priority Performance Against Goals Invest in technology and Expanded Internet sales channel; breadth of business capabilities: Converted to imaged statements and offered e-statements; Introduced Cash Rewards Program; Upgraded branch platform. 14
Slide 15: 2008 Year End Highlights
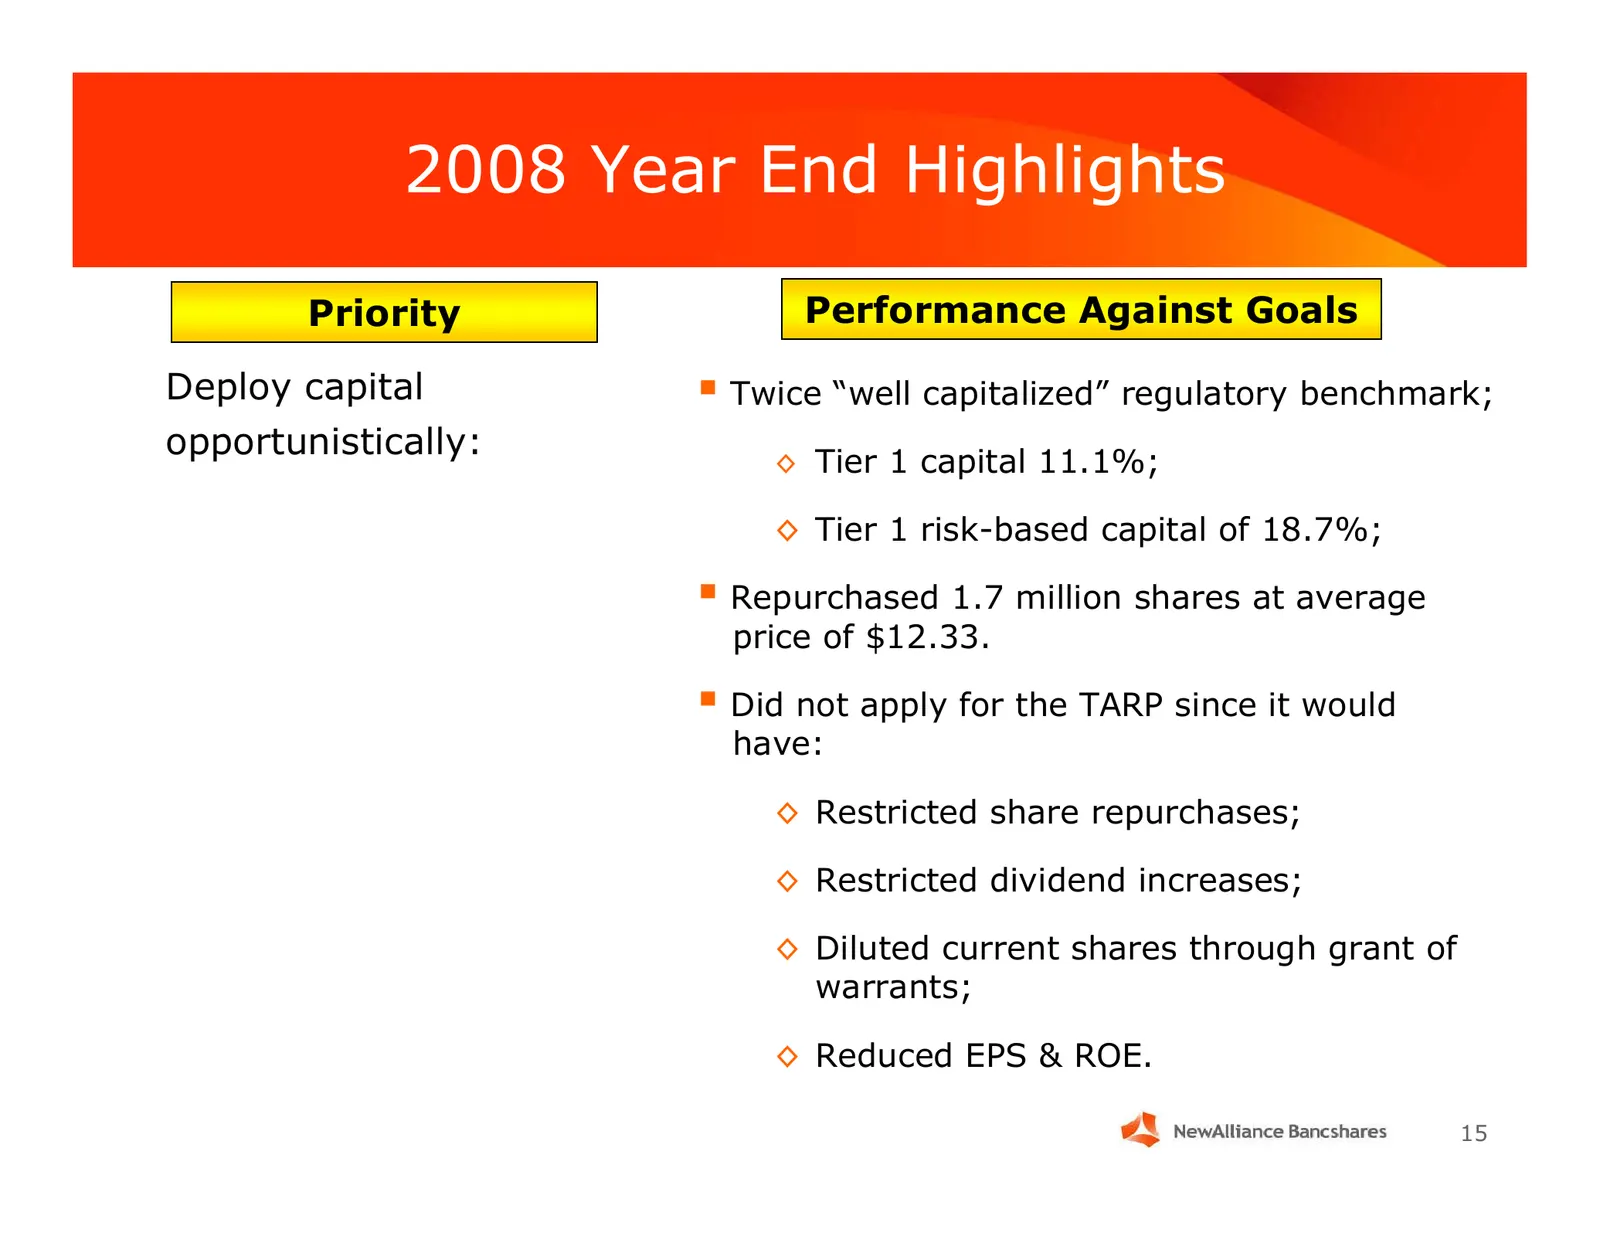
2008 Year End Highlights Priority Performance Against Goals Deploy capital Twice “well capitalized” regulatory benchmark; opportunistically: ◊ Tier 1 capital 11.1%; ◊ Tier 1 risk-based capital of 18.7%; Repurchased 1.7 million shares at average price of $12.33. Did not apply for the TARP since
Slide 16: 2008 Year End Stock Price Performance
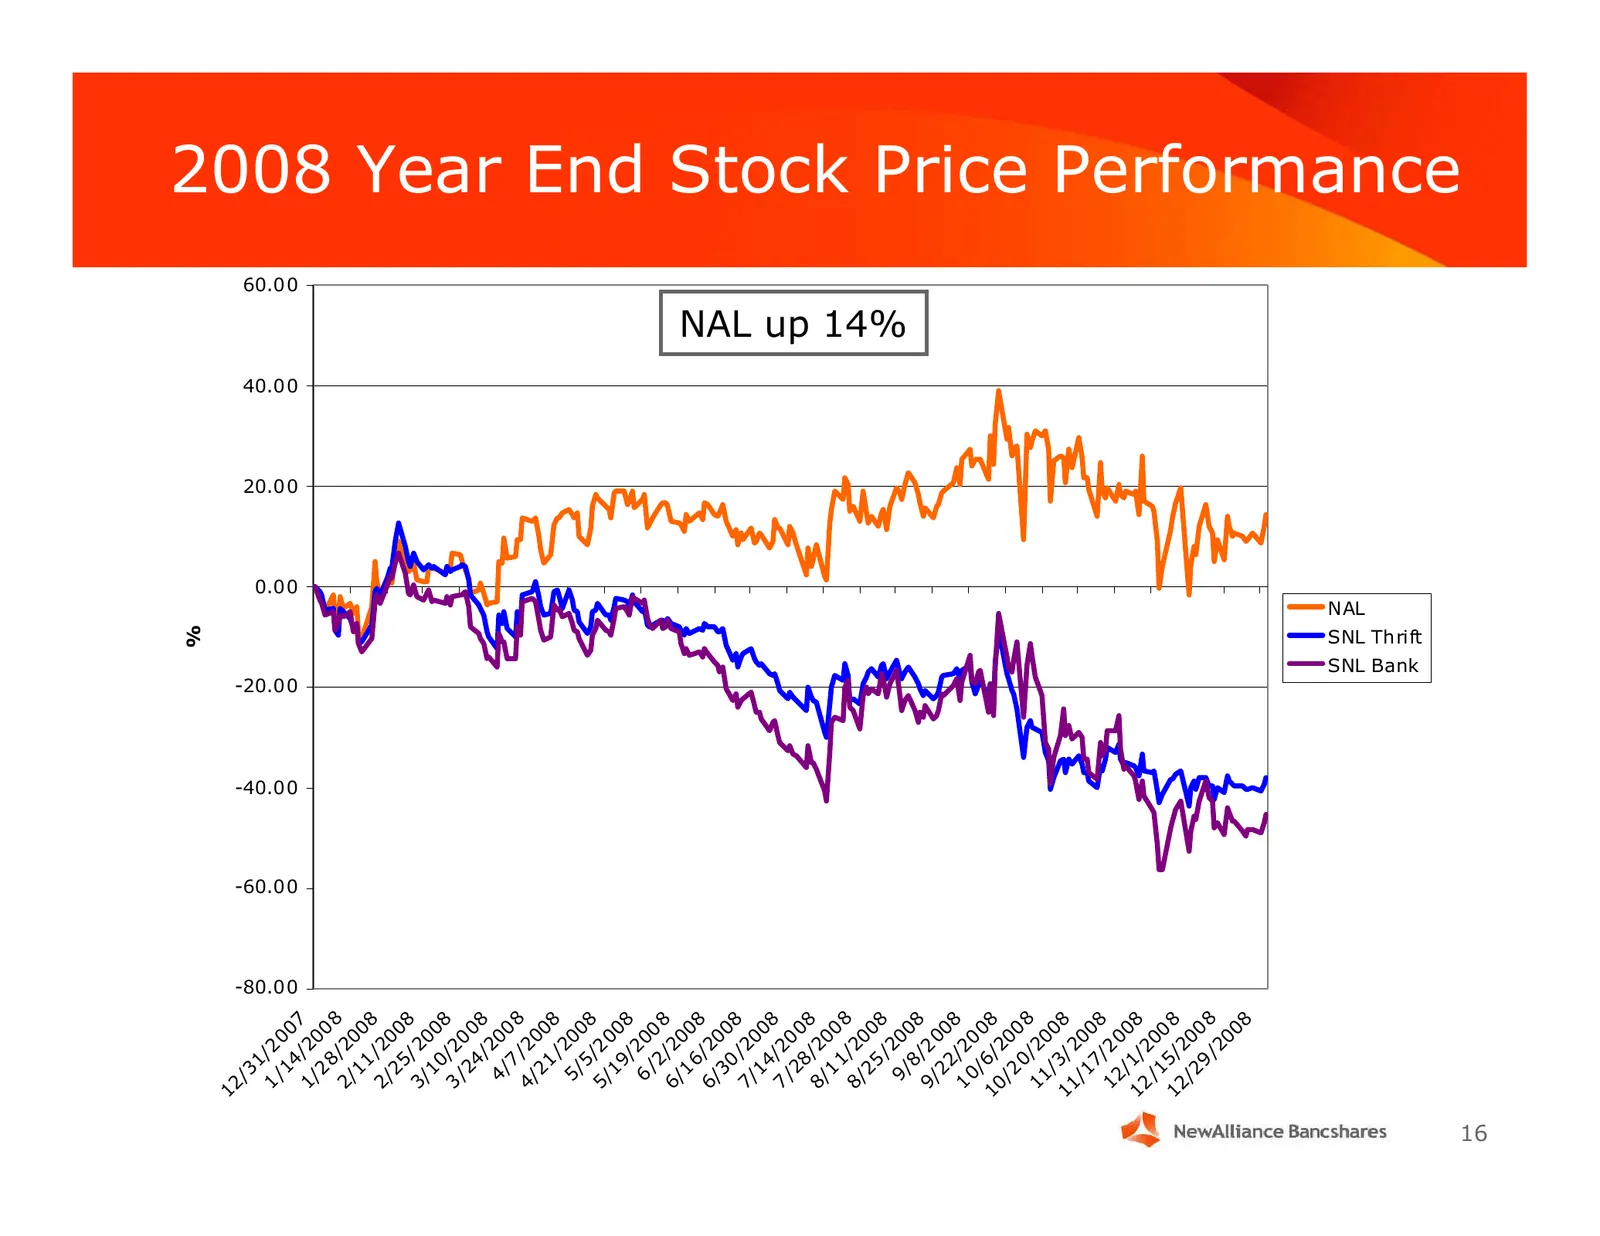
% 12 /3 1 1 /2 /1 0 -80.00 -60.00 -40.00 -20.00 0.00 20.00 40.00 4 0 60.00 1/ /2 7 2 00 8 8 2/ /2 11 00 8 2/ /2 25 0 0 8 3/ / 2 10 00 3 /2 8 /2 0 4/ 08 4/ 20 7 08 4/ /2 21 00 / 8 5/ 20 5 08 5/ /2 19 00 / 8 6 20 /2 0 6/ /2 8 1 00 6 8 6/ /2 30 00 8 7/ /2 14 00 8 7 /2 /2 0 8 0 8/ /2 8 1 00 1 8 8/ /2 25

Slide 17: Credit Quality
; . . : > ap na Credit Quality
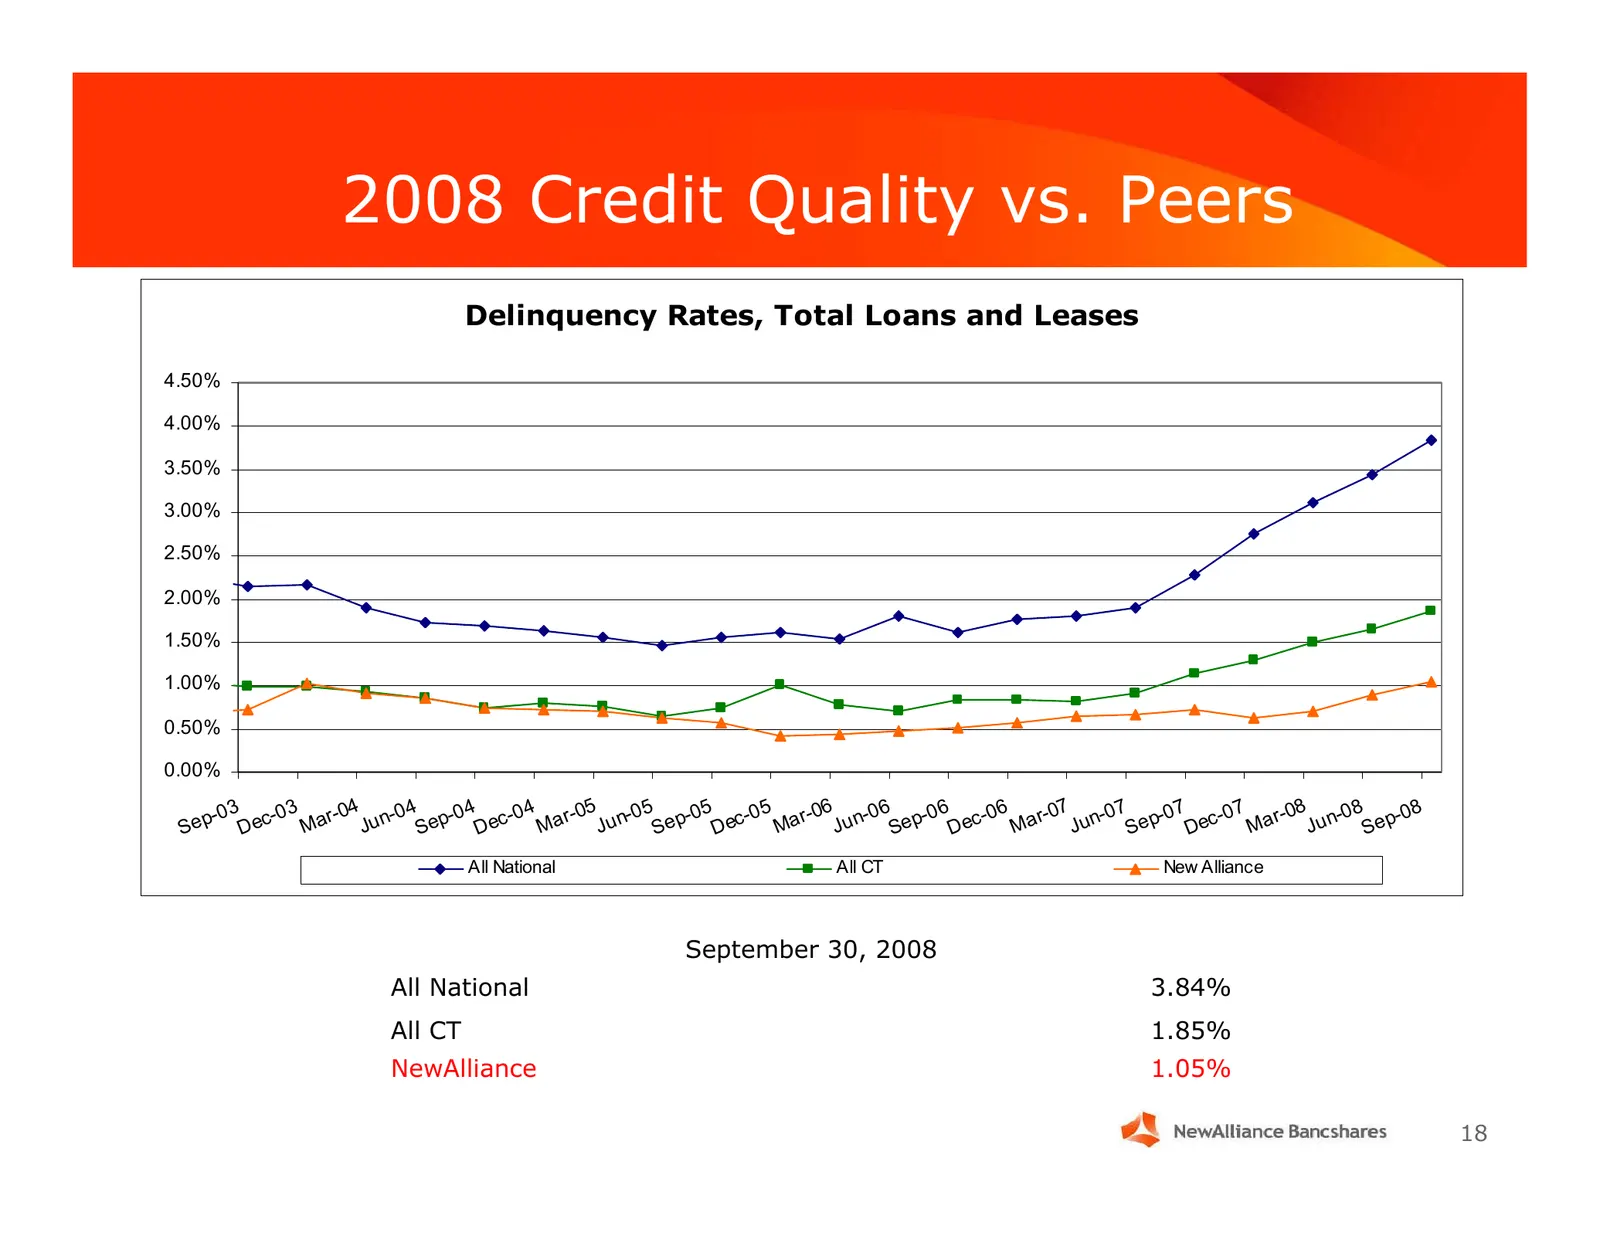
Slide 18: 2008 Credit Quality vs. Peers
2008 Credit Quality vs. Peers Delinquency Rates, Total Loans and Leases 4.50% 4.00% 3.50% 3.00% 2.50% 2.00% 1.50% 1.00% 0.50% 0.00% -03 -03 ar-04 un-04 ep-04 ec-04 ar-05 u n-05 ep-05 ec-05 ar-06 un-06 ep-06 ec-06 ar-07 un-07 ep-07 ec-07 ar-08 un-08 ep-08 Sep Dec M J S D M J S D M J S D M J S D M J S
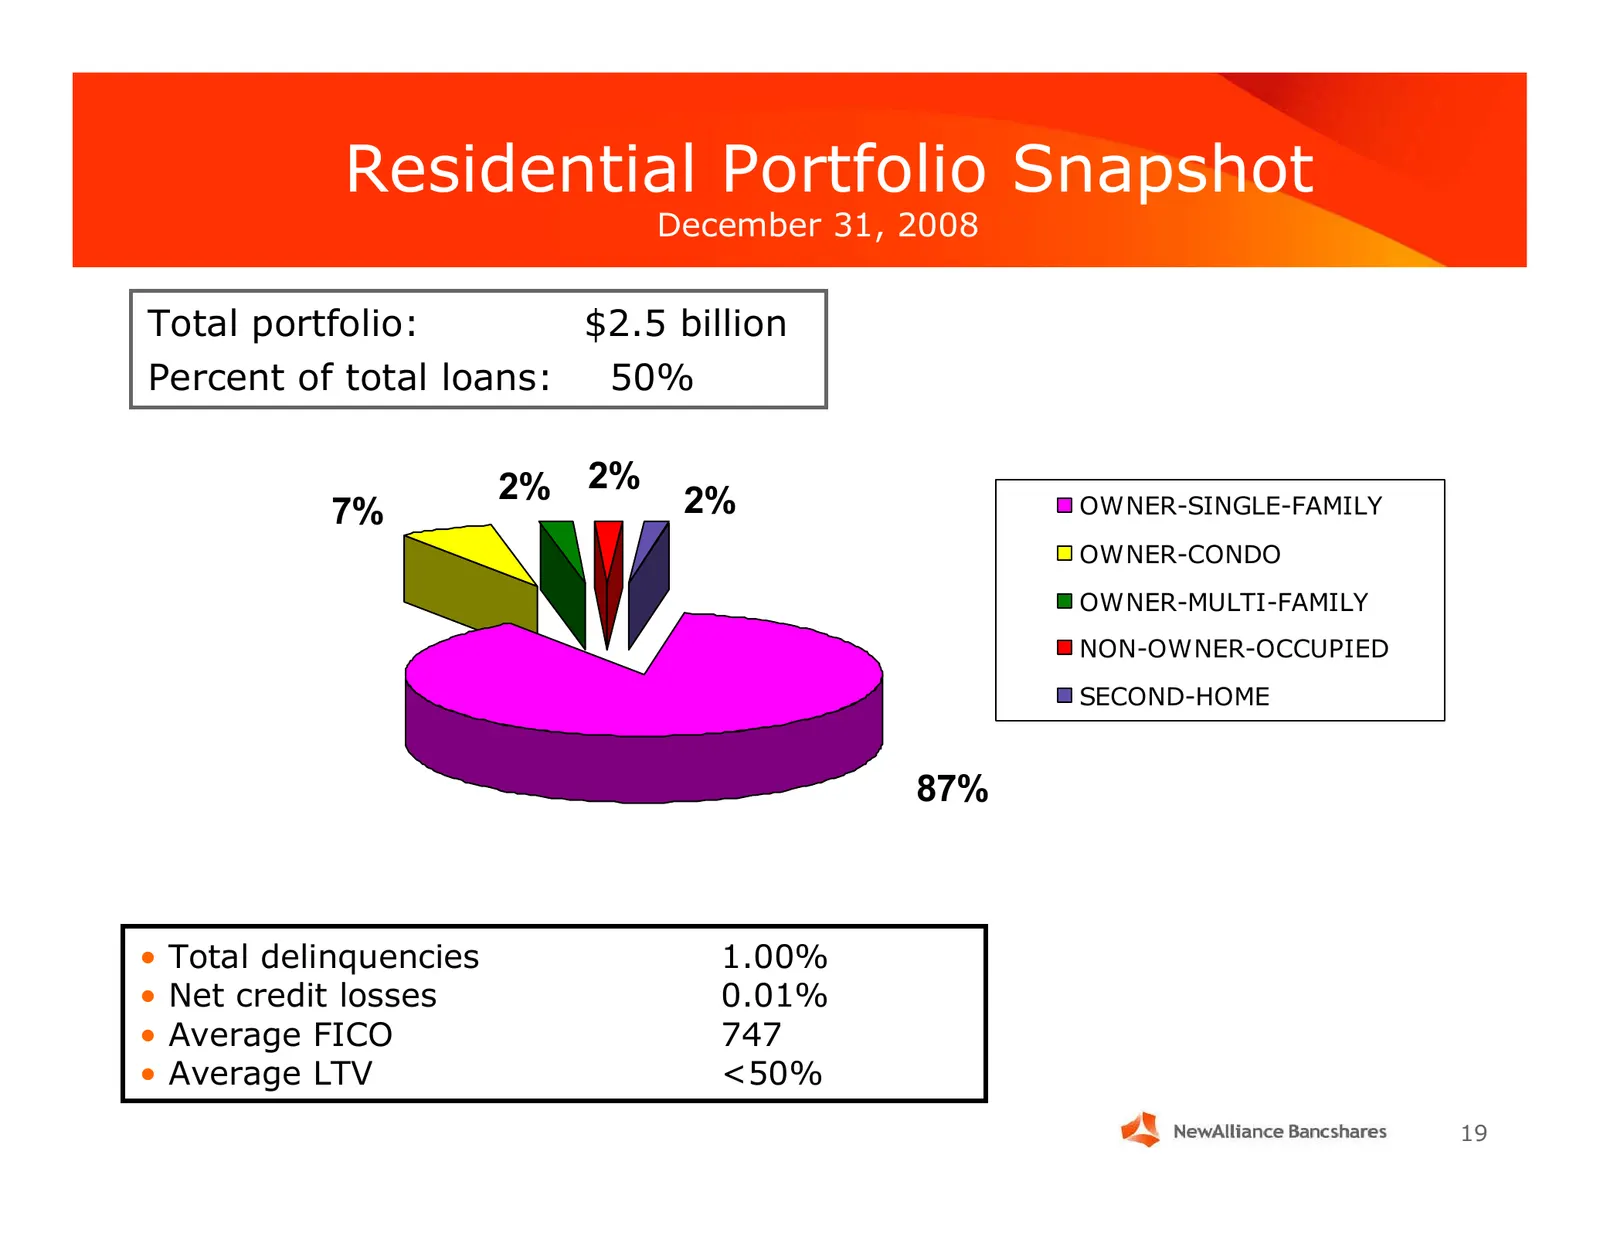
Slide 19: Residential Portfolio Snapshot
Residential Portfolio Snapshot December 31, 2008 Total portfolio: $2.5 billion Percent of total loans: 50% 2% 2% 2% OWNER-SINGLE-FAMILY 7% OWNER-CONDO OWNER-MULTI-FAMILY NON-OWNER-OCCUPIED SECOND-HOME 87% • Total delinquencies 1.00% • Net credit losses 0.01% • Average FICO 747 • Average LTV <50% 19
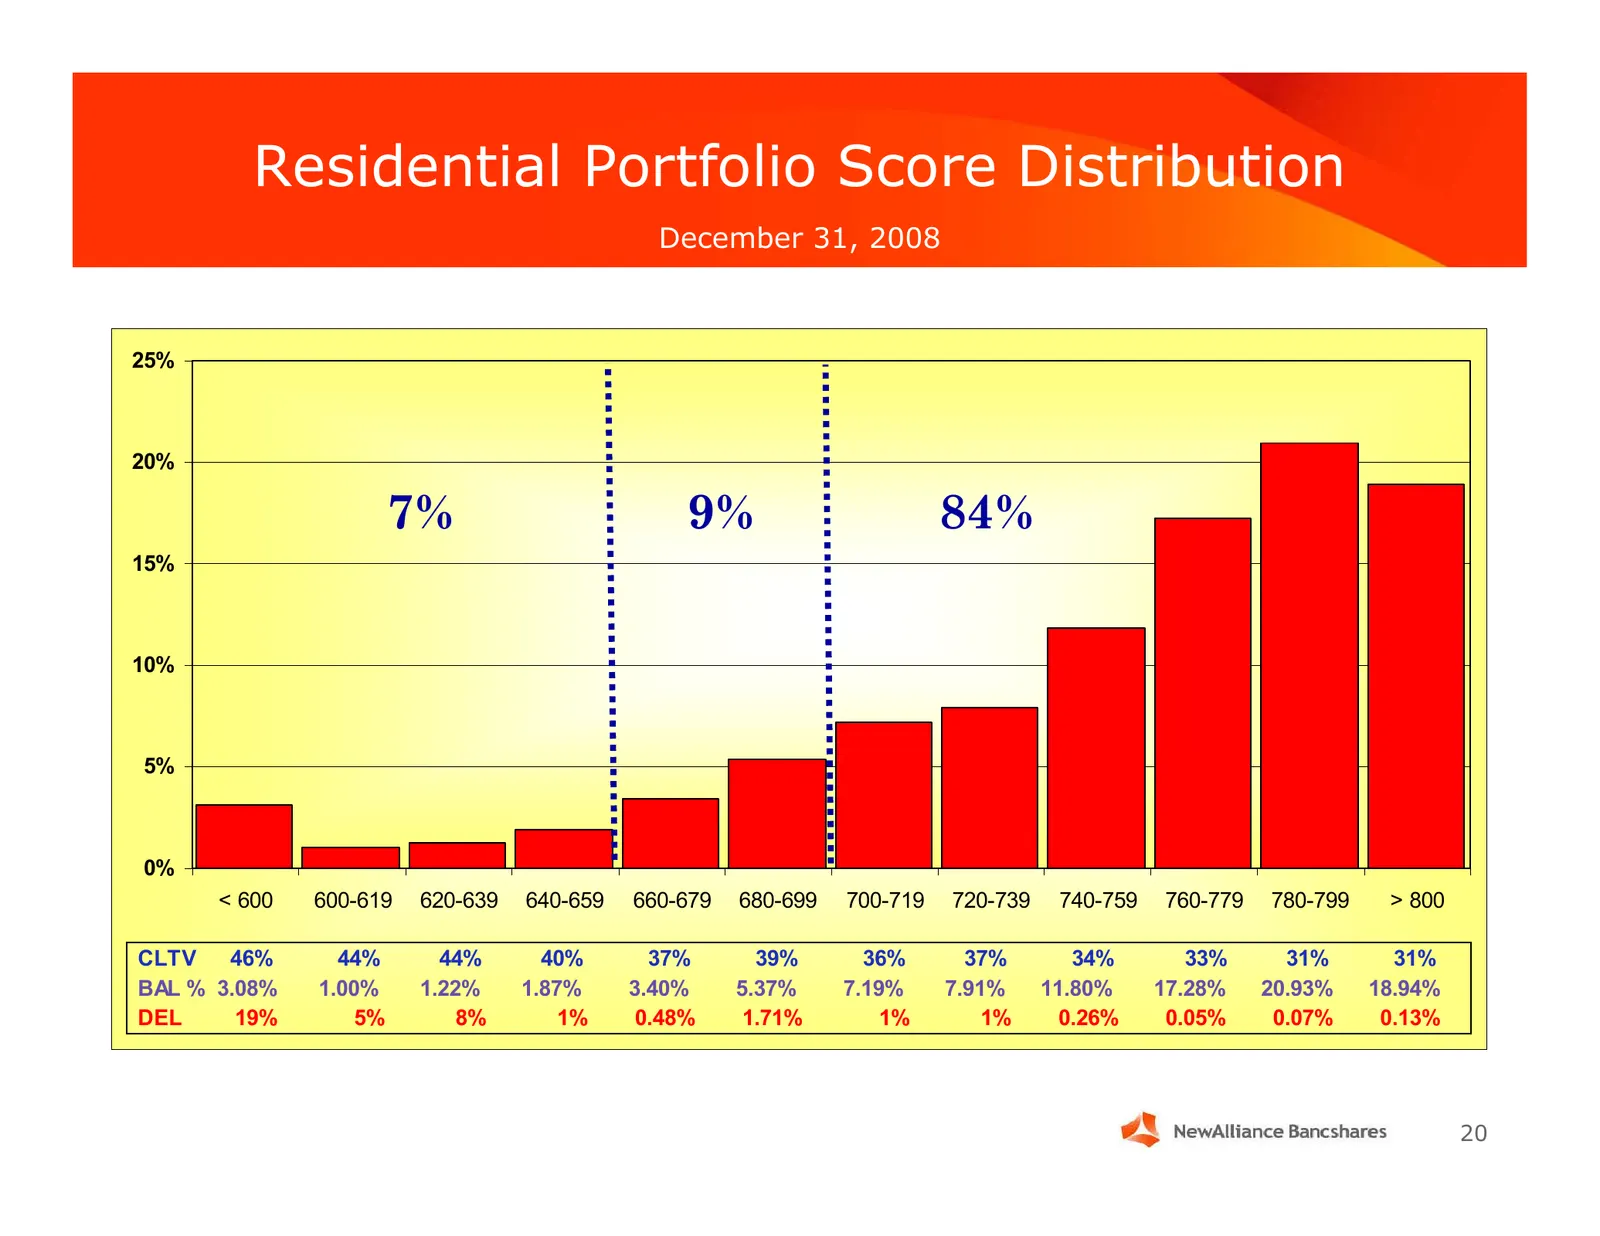
Slide 20: Residential Portfolio Score Distribution
Residential Portfolio Score Distribution December 31, 2008 25% 20% 7% 9% 84% 15% 10% 5% 0% < 600 600-619 620-639 640-659 660-679 680-699 700-719 720-739 740-759 760-779 780-799 > 800 CLTV 46% 44% 44% 40% 37% 39% 36% 37% 34% 33% 31% 31% BAL % 3.08% 1.00% 1.22% 1.87% 3.40% 5.37% 7.19% 7.91% 11.80% 17.
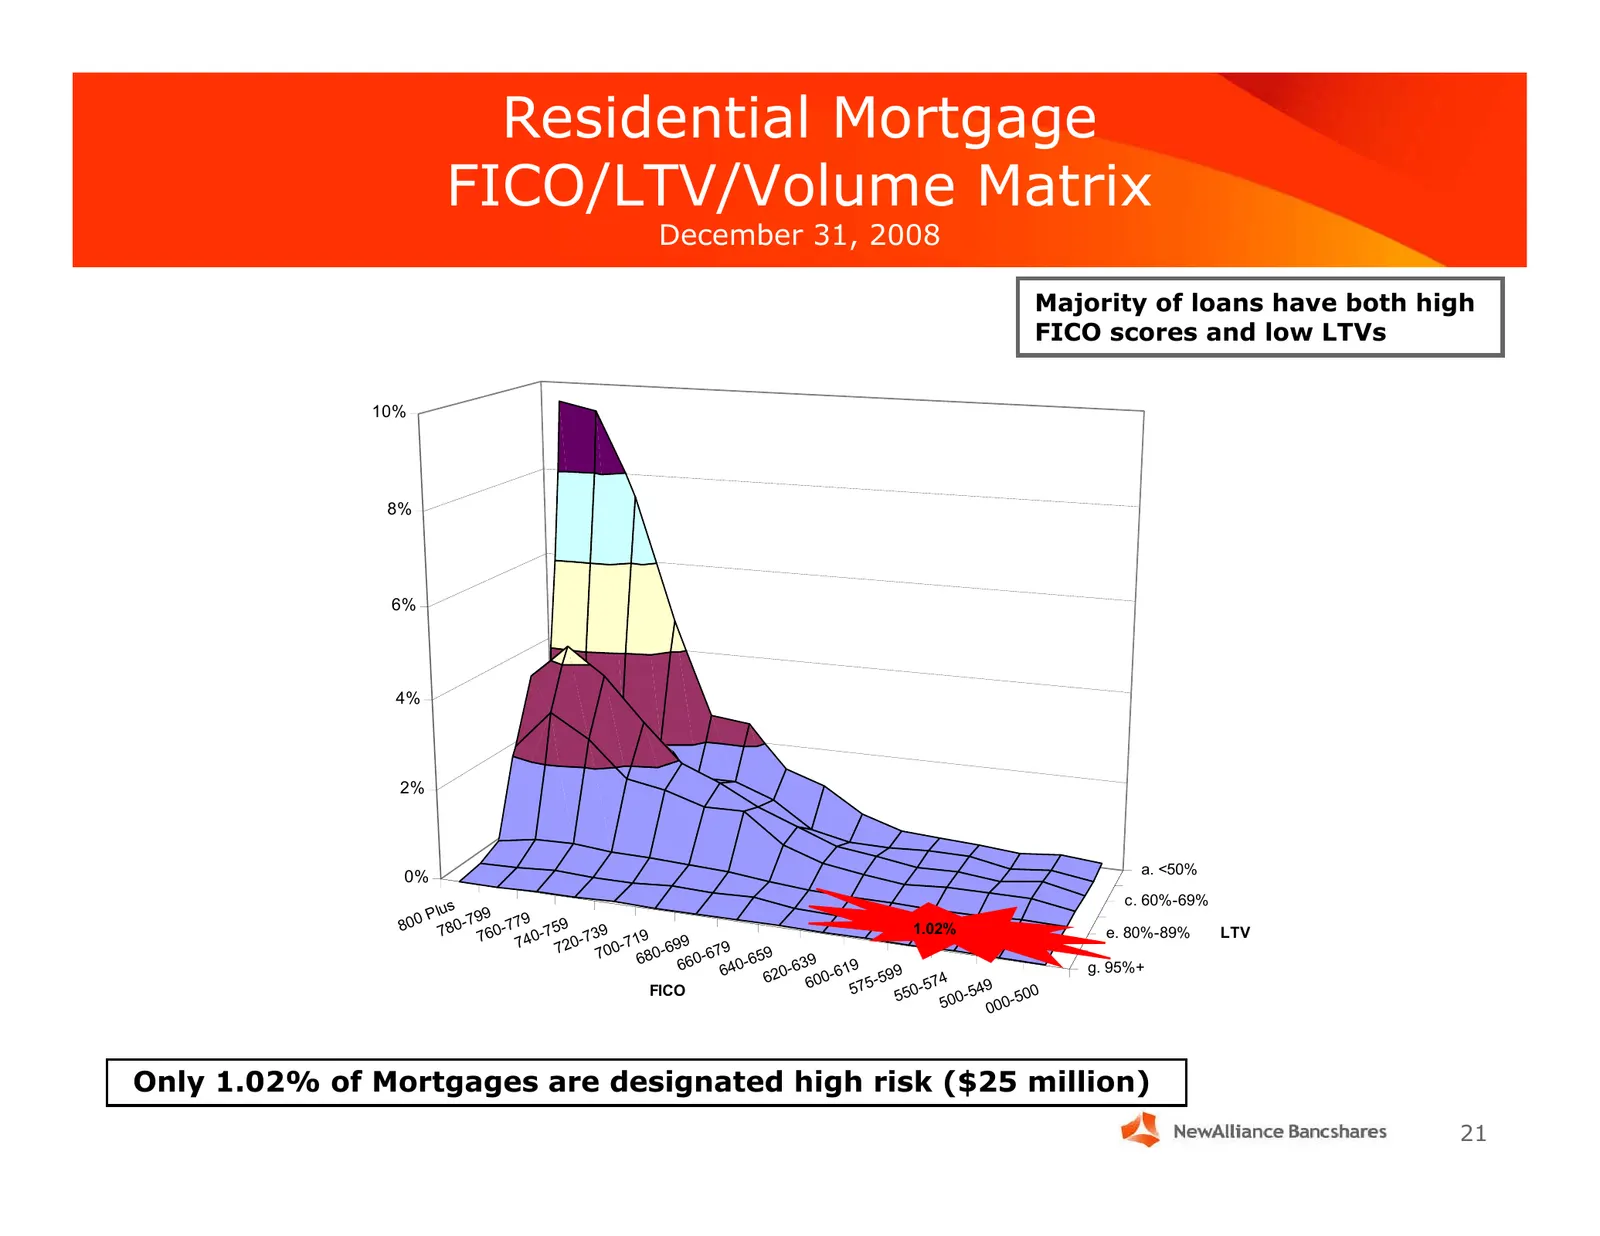
Slide 21: Residential Mortgage FICO/LTV/Volume Matrix
Residential Mortgage FICO/LTV/Volume Matrix December 31, 2008 Majority of loans have both high FICO scores and low LTVs 10% 8% 6% 4% 2% a. <50% 0% s c. 60%-69% P lu 99 800 780-7 0- 779 - 759 9 1.02% e. 80%-89% LTV 76 740 -73 19 720 700- 7 0-699 -679 9 68 5 660 640-6 0-639 619 g. 95%+ 62 - 99 600 575
Slide 22: Home Equity Portfolio Snapshot
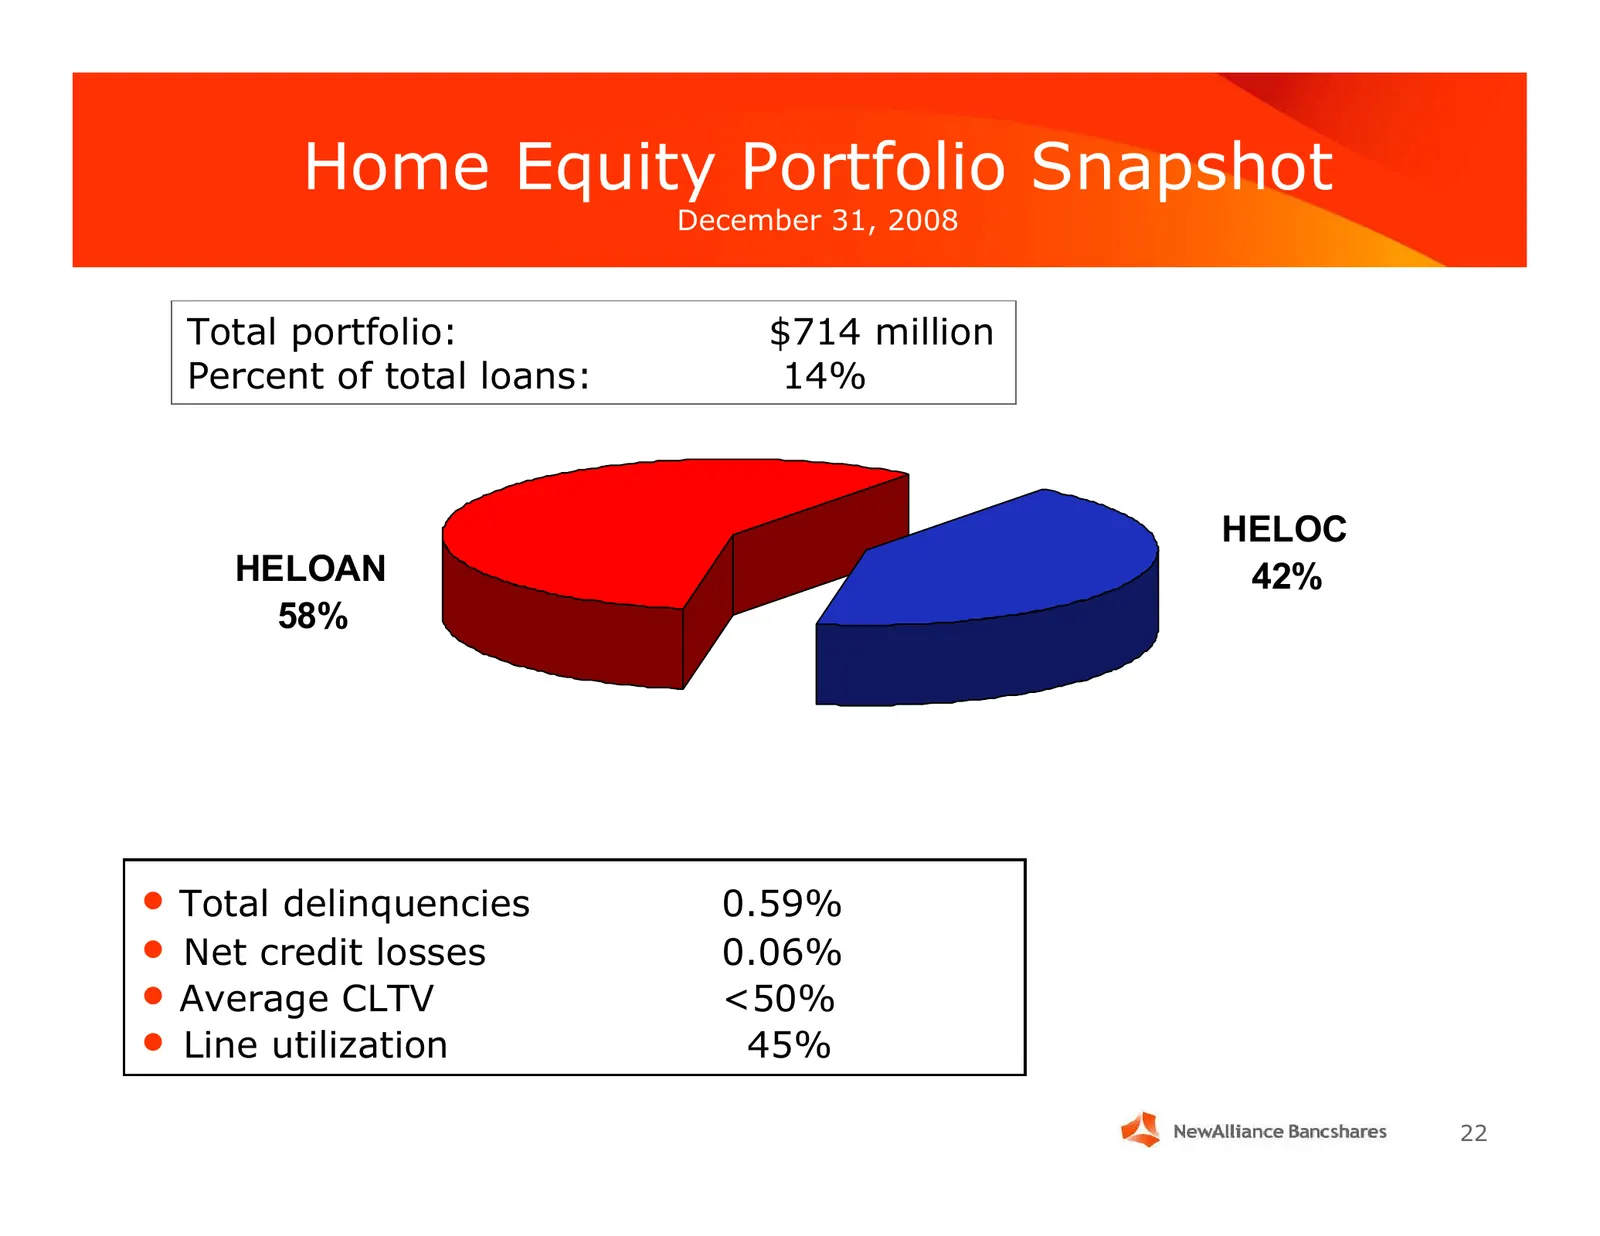
Home Equity Portfolio Snapshot December 31, 2008 Total portfolio: $714 million Percent of total loans: 14% HELOC HELOAN 42% 58% • Total delinquencies 0.59% • Net credit losses 0.06% • Average CLTV <50% • Line utilization 45% 22
Slide 23: Total CRE Portfolio Snapshot
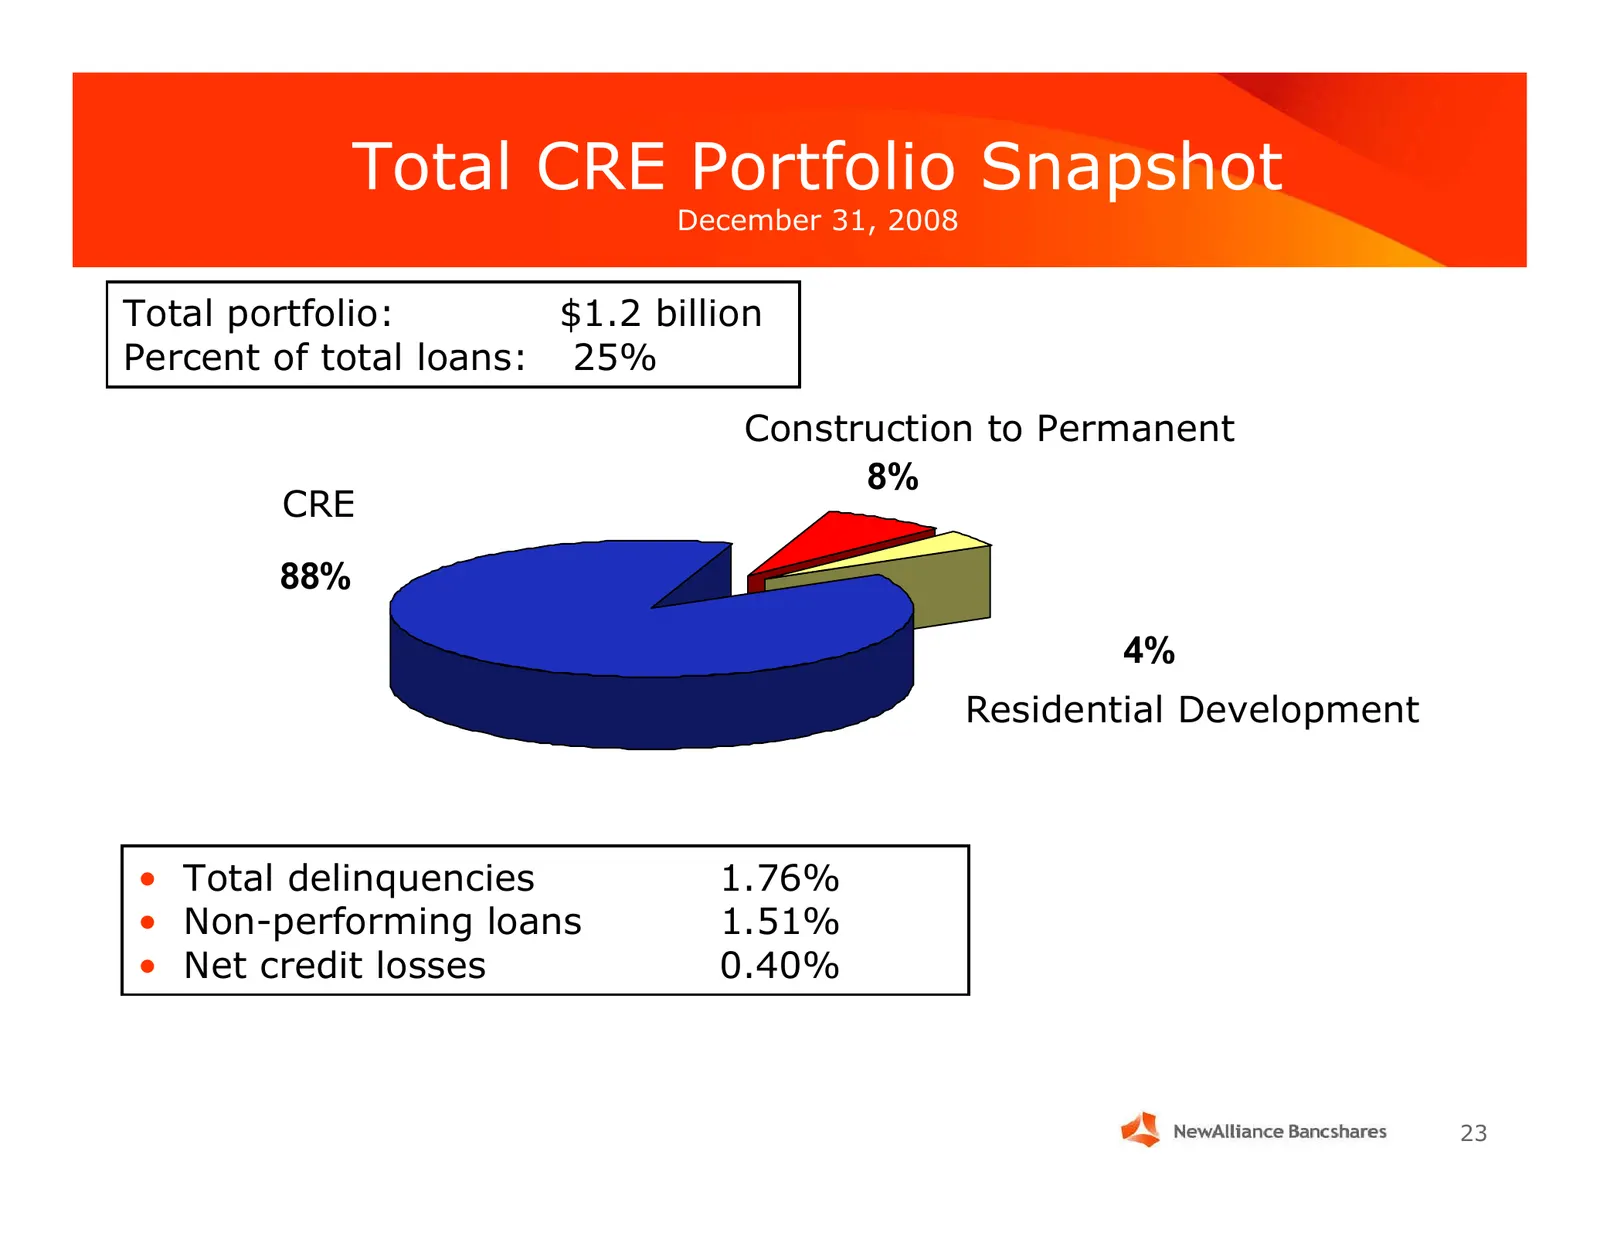
Total CRE Portfolio Snapshot December 31, 2008 Total portfolio: $1.2 billion Percent of total loans: 25% Construction to Permanent 8% CRE 88% 4% Residential Development • Total delinquencies 1.76% • Non-performing loans 1.51% • Net credit losses 0.40% 23
Slide 24: CRE Portfolio Snapshot
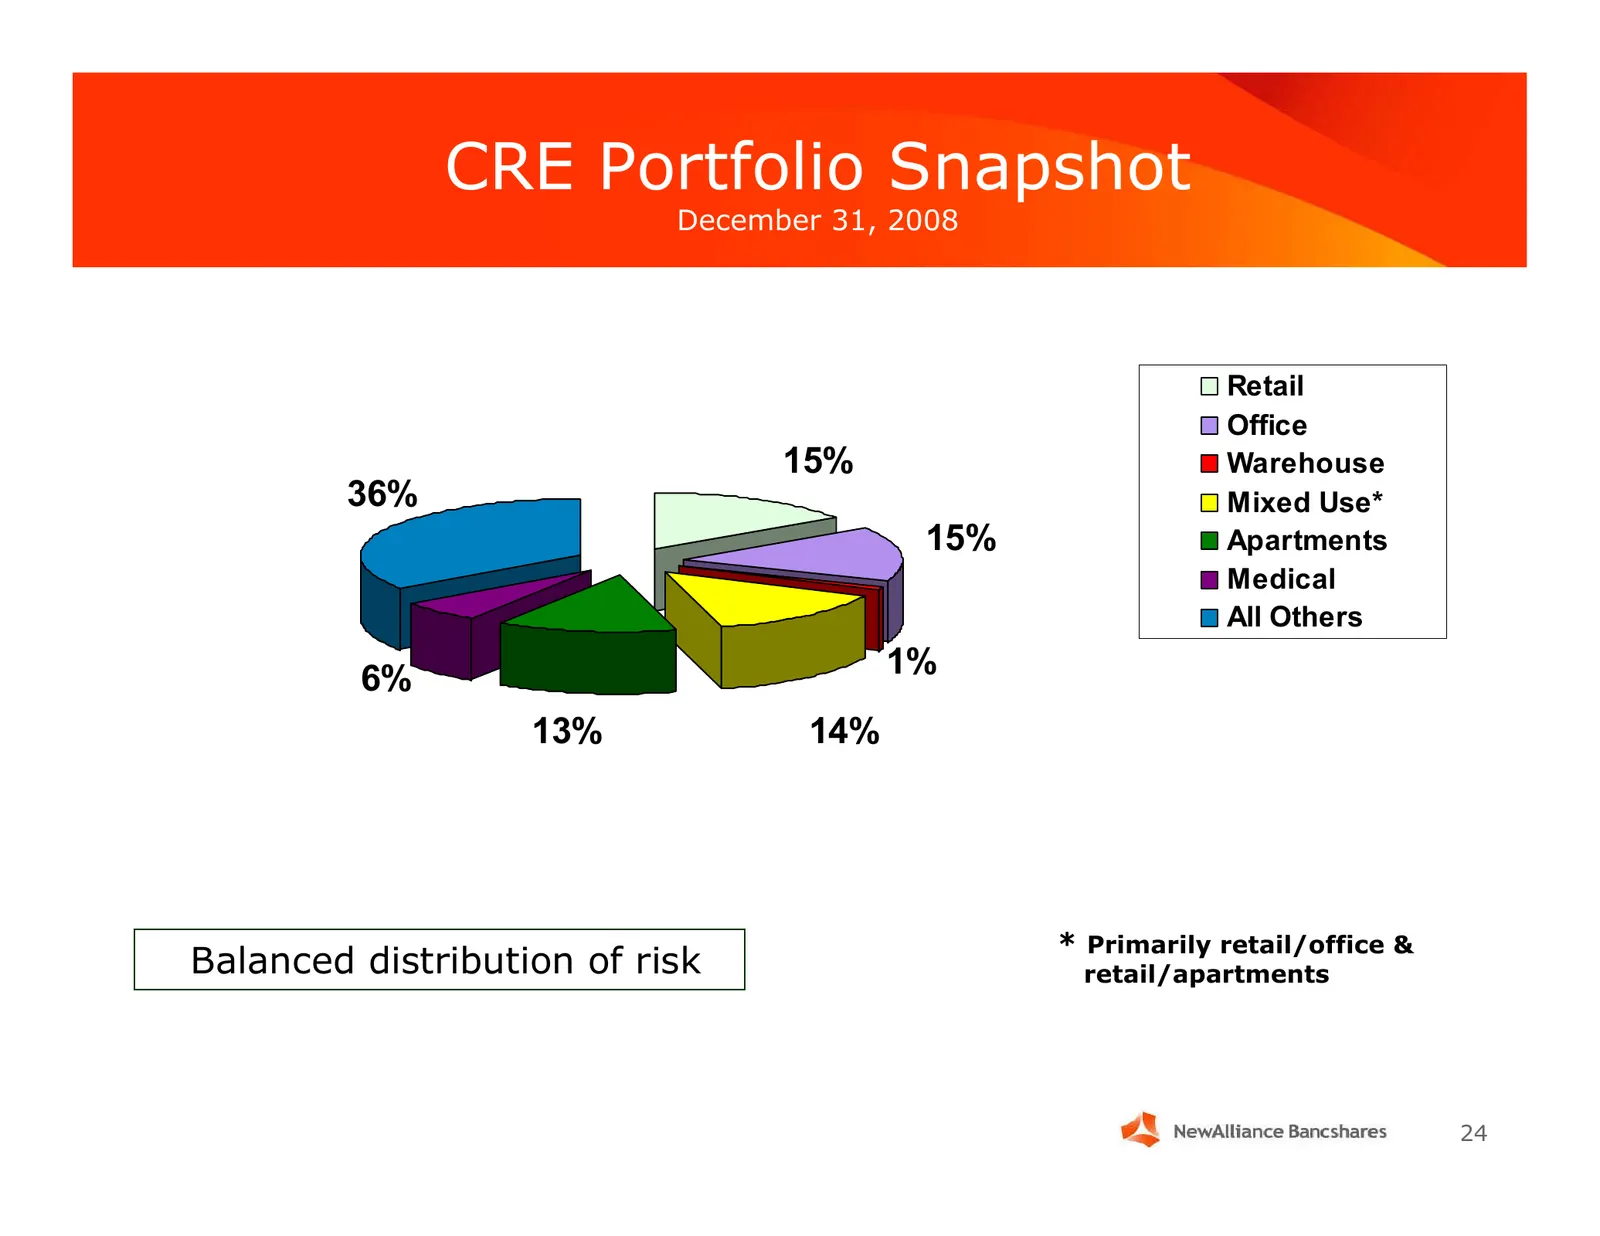
CRE Portfolio Snapshot December 31, 2008 Retail Office 15% Warehouse 36% Mixed Use* 15% Apartments Medical All Others 6% 1% 13% 14% * Primarily retail/office & Balanced distribution of risk retail/apartments 24
Slide 25: Residential Development Portfolio Snapshot
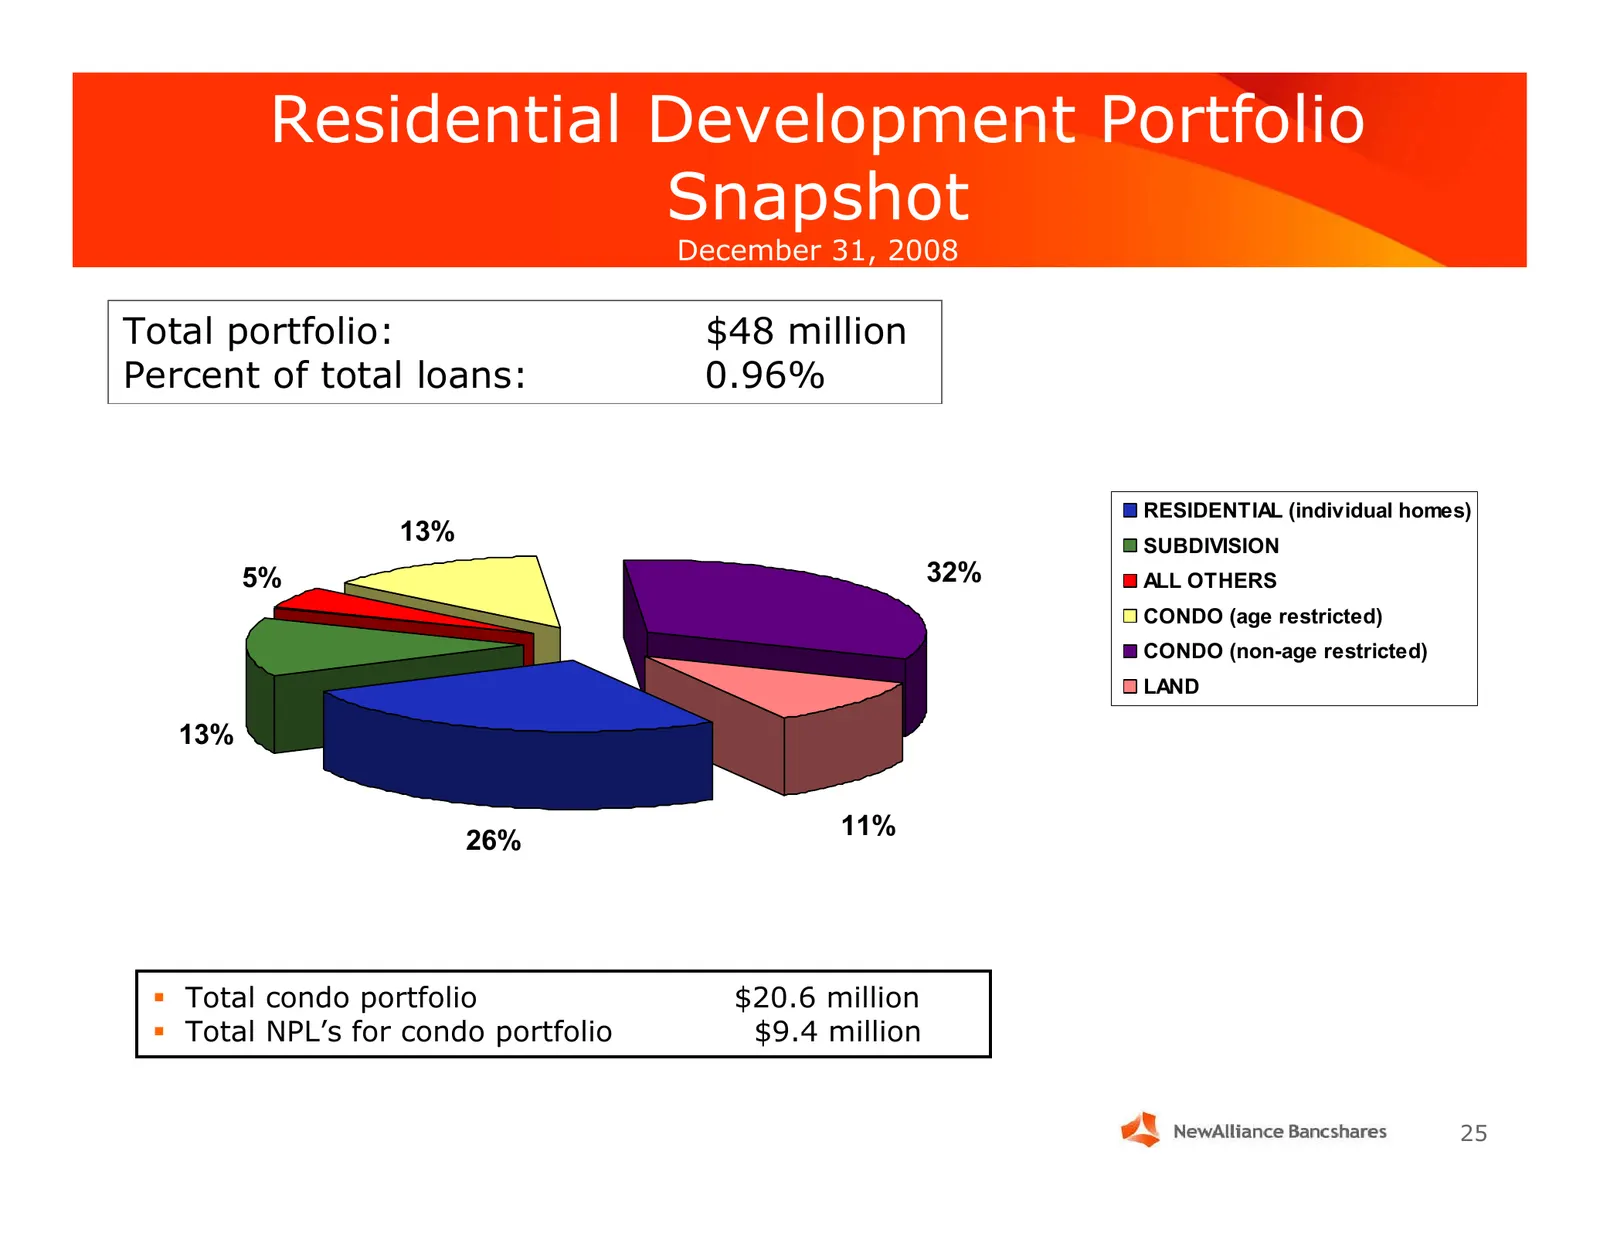
Residential Development Portfolio Snapshot December 31, 2008 Total portfolio: $48 million Percent of total loans: 0.96% RESIDENTIAL (individual homes) 13% SUBDIVISION 5% 32% ALL OTHERS CONDO (age restricted) CONDO (non-age restricted) LAND 13% 26% 11% Total condo portfolio $20.6 million Total NP
Slide 26: C&I Portfolio Snapshot
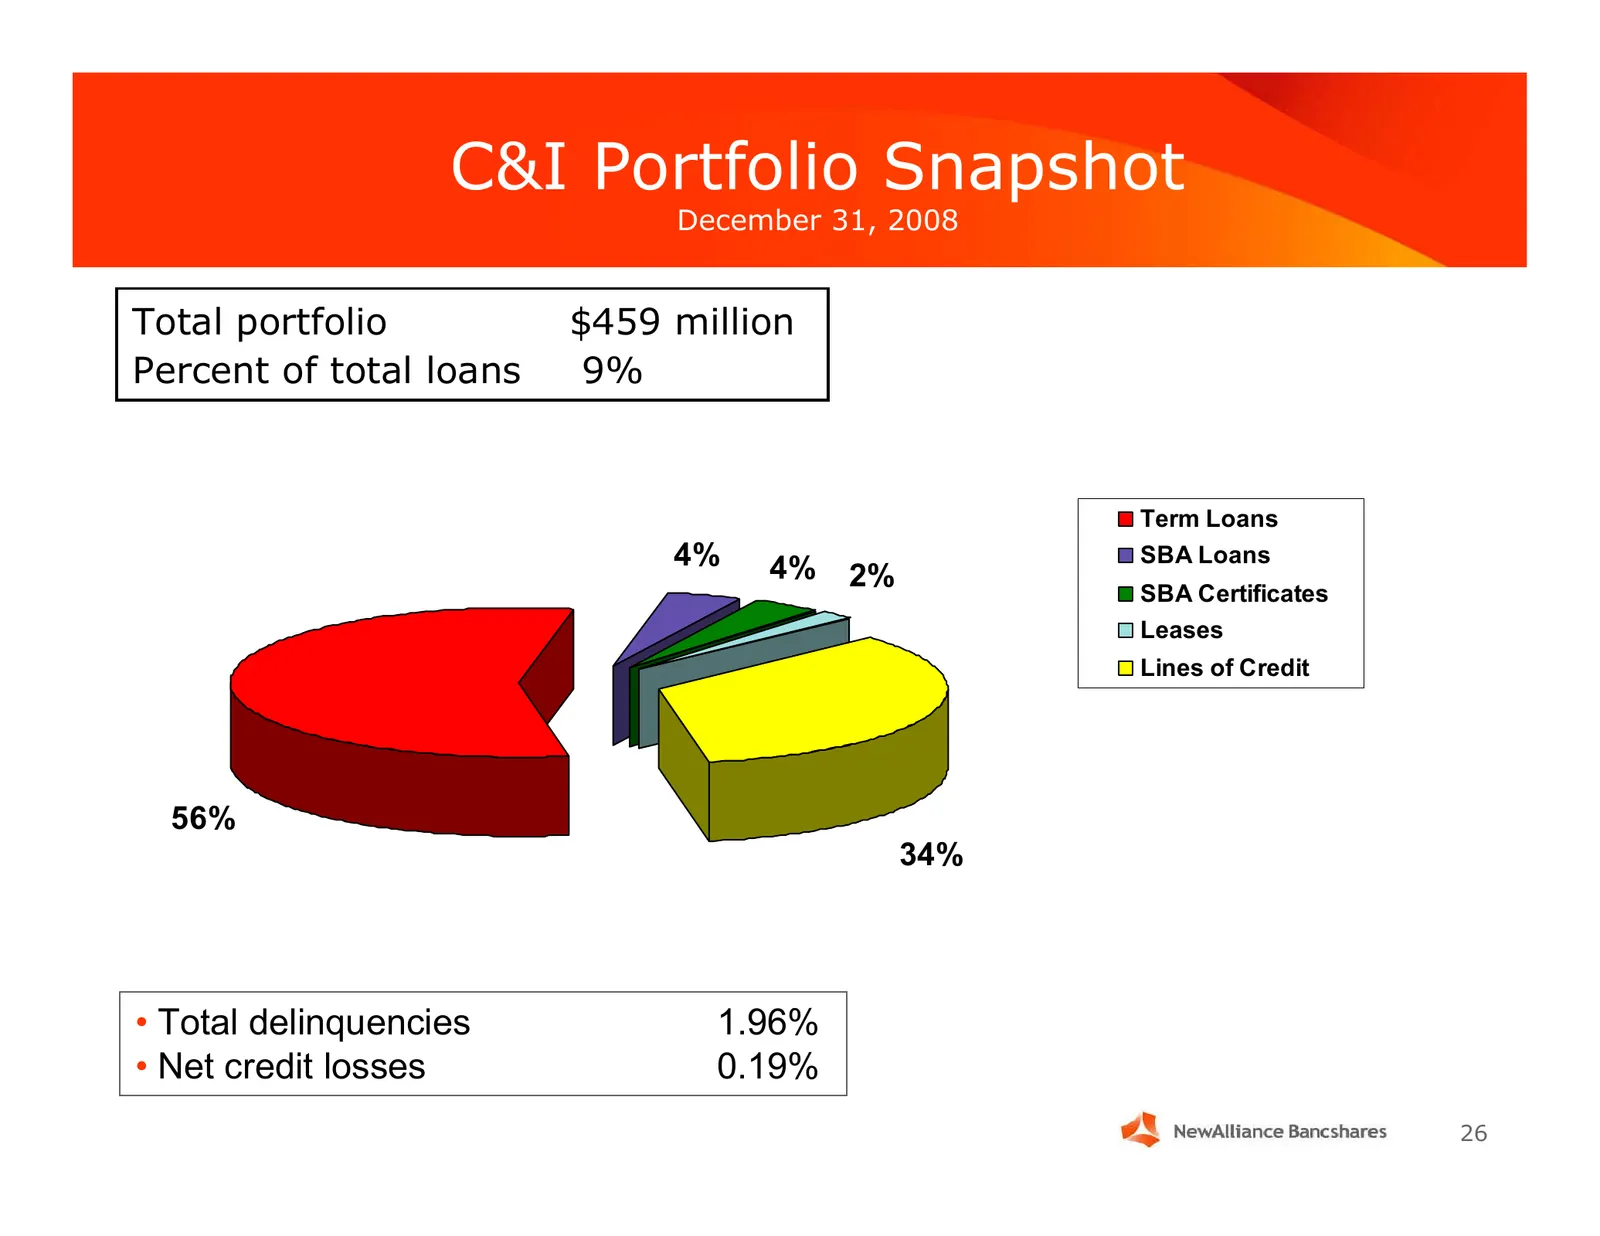
C&I Portfolio Snapshot December 31, 2008 Total portfolio $459 million Percent of total loans 9% Term Loans 4% 4% SBA Loans 2% SBA Certificates Leases Lines of Credit 56% 34% • Total delinquencies 1.96% • Net credit losses 0.19% 26
Slide 27: C&I Portfolio Snapshot
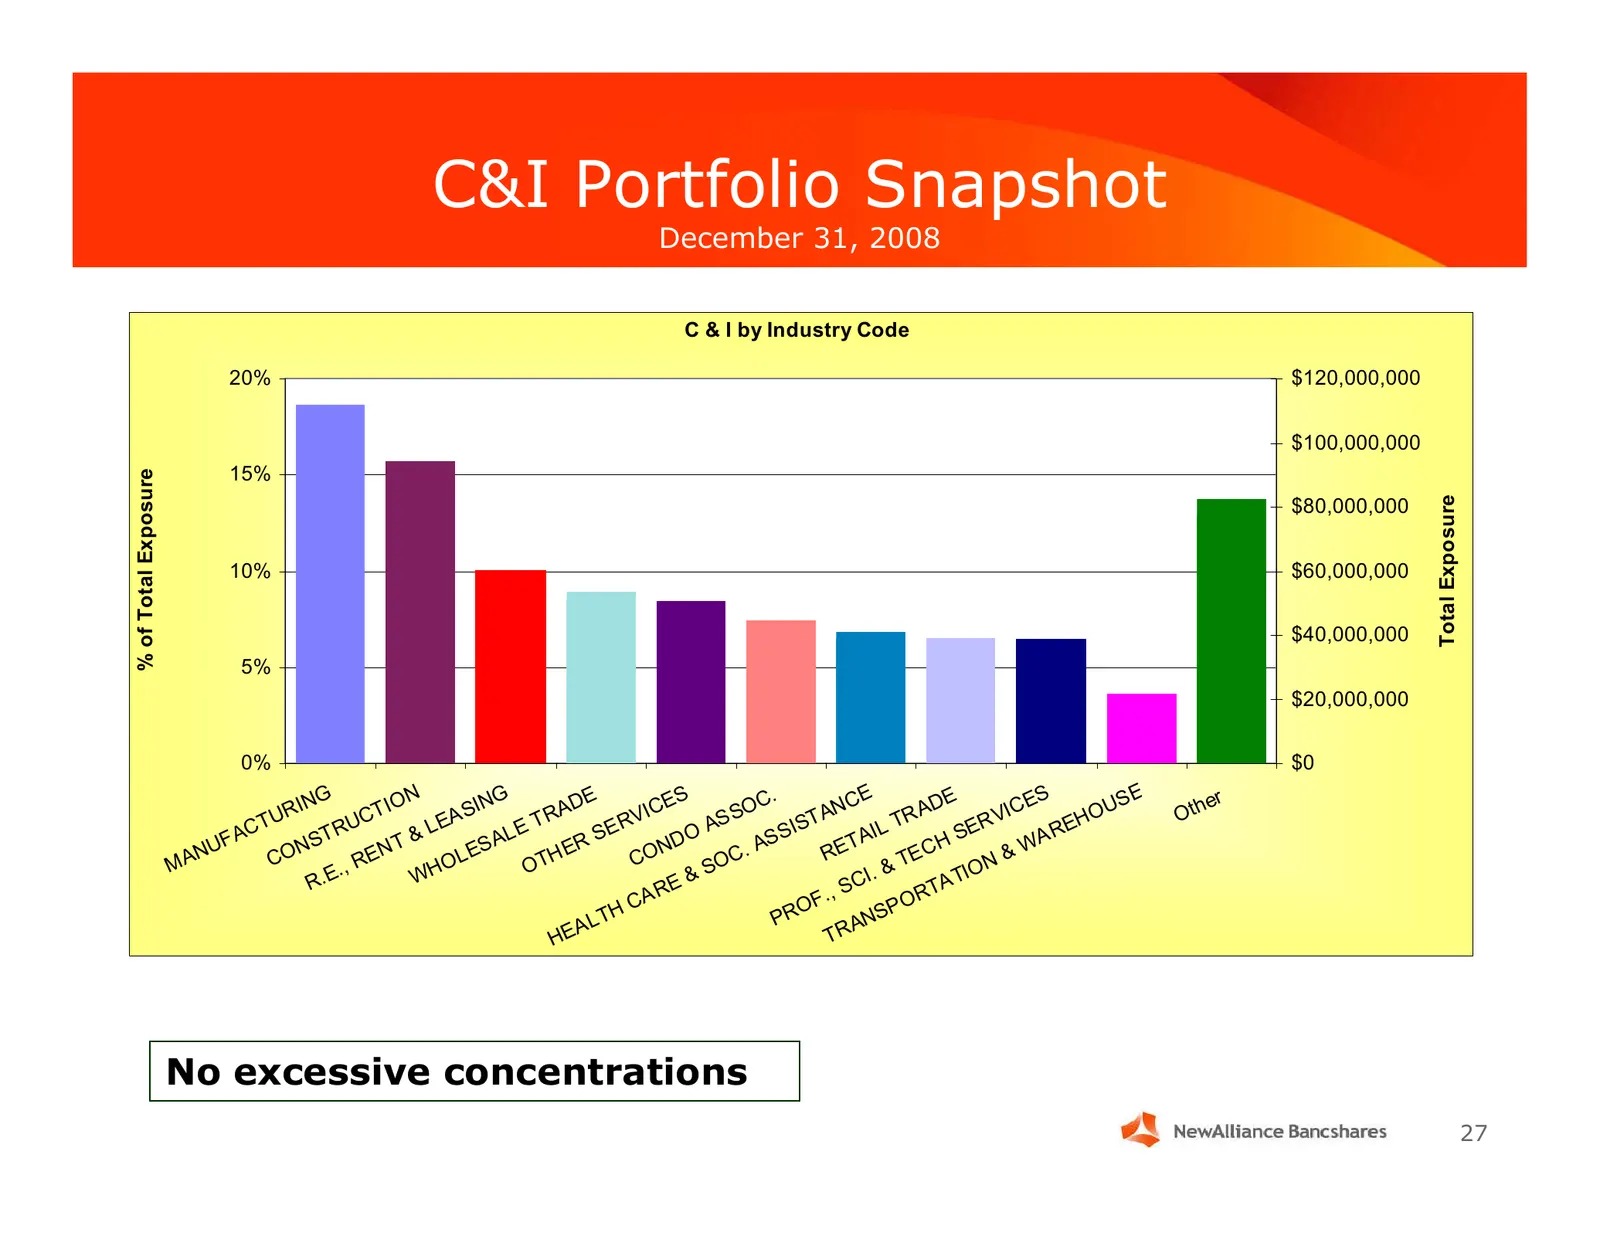
C&I Portfolio Snapshot December 31, 2008 C & I by Industry Code 20% $120,000,000 $100,000,000 15% % of Total Exposure $80,000,000 Total Exposure 10% $60,000,000 $40,000,000 5% $20,000,000 0% $0 ING ION ING DE ES C. CE AD E ICE S SE er T UR U CT EAS T RA RVIC S SO T AN TR R V HOU Oth L OA SI S E RE U
Slide 28: 2008 Net Charge-offs by Category
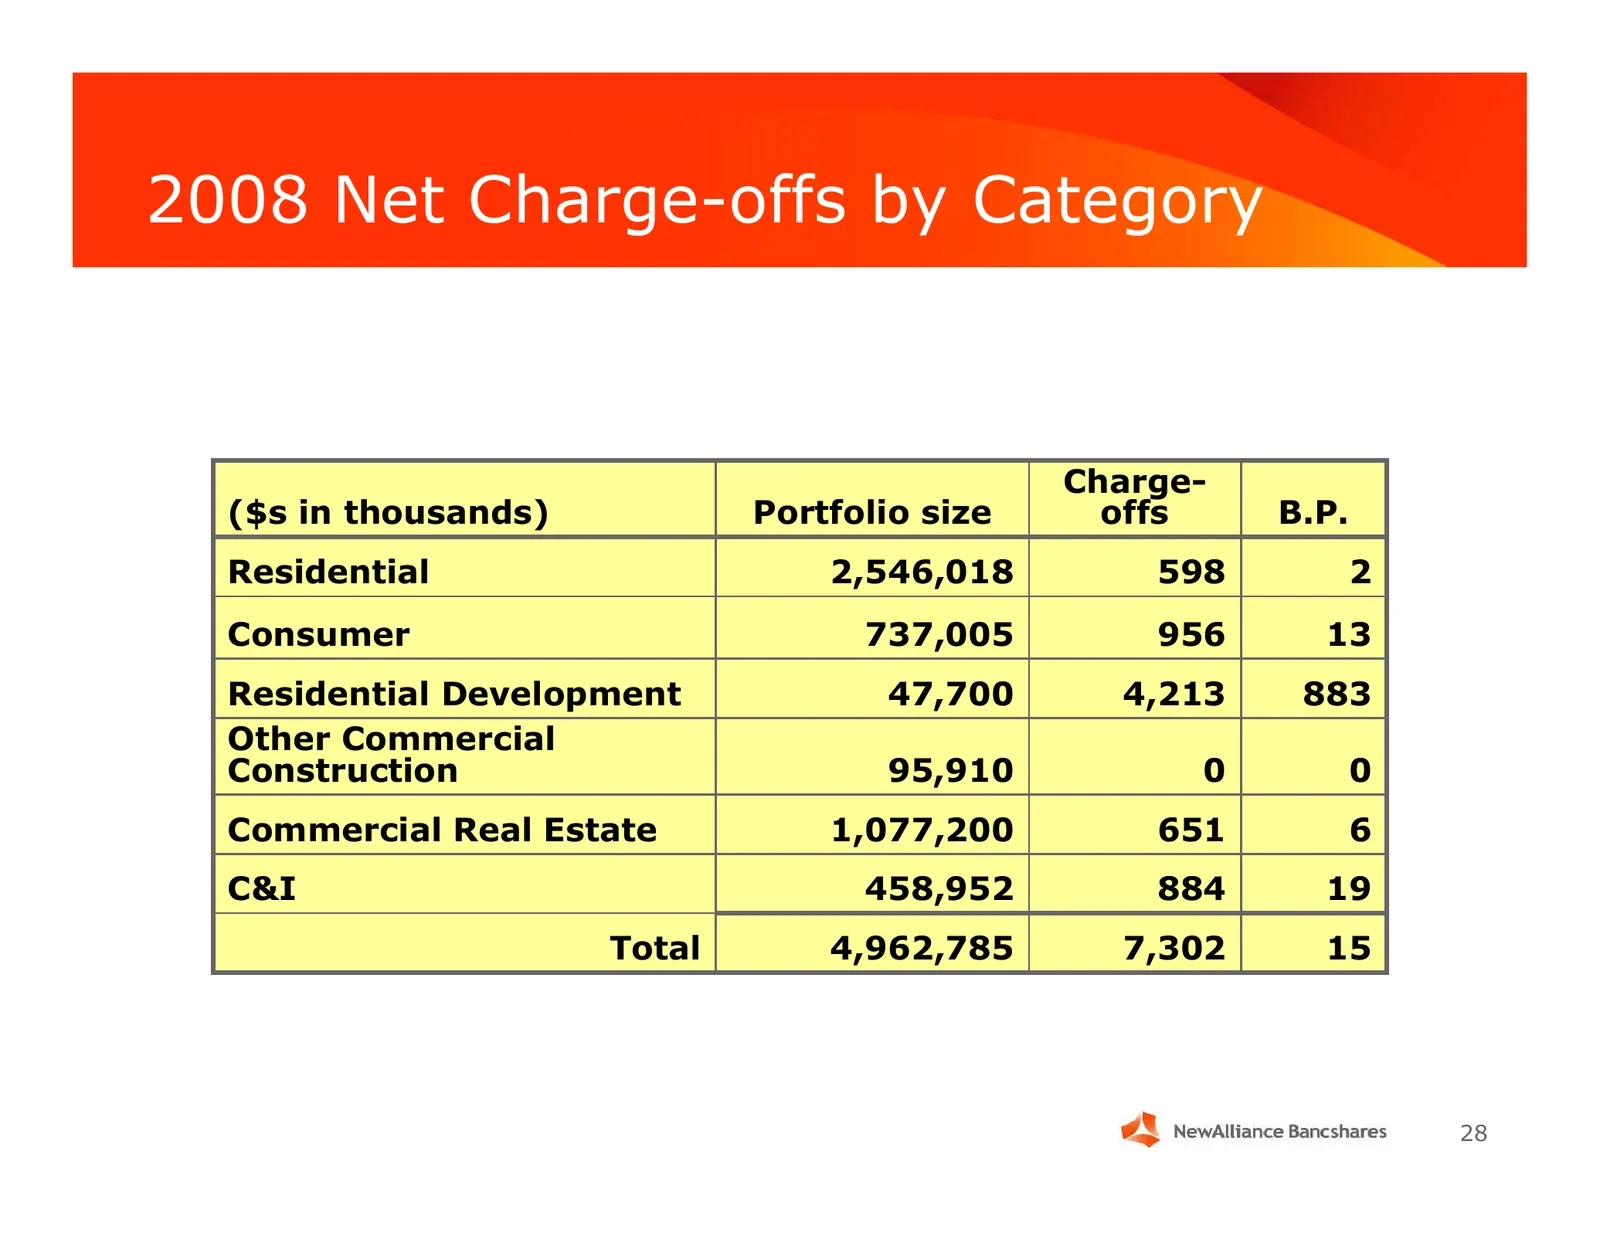
2008 Net Charge-offs by Category Charge- ($s in thousands) Portfolio size offs B.P. Residential 2,546,018 598 2 Consumer 737,005 956 13 Residential Development 47,700 4,213 883 Other Commercial Construction 95,910 0 0 Commercial Real Estate 1,077,200 651 6 C&I 458,952 884 19 Total 4,962,785 7,302 15
Slide 29: Investment Portfolio
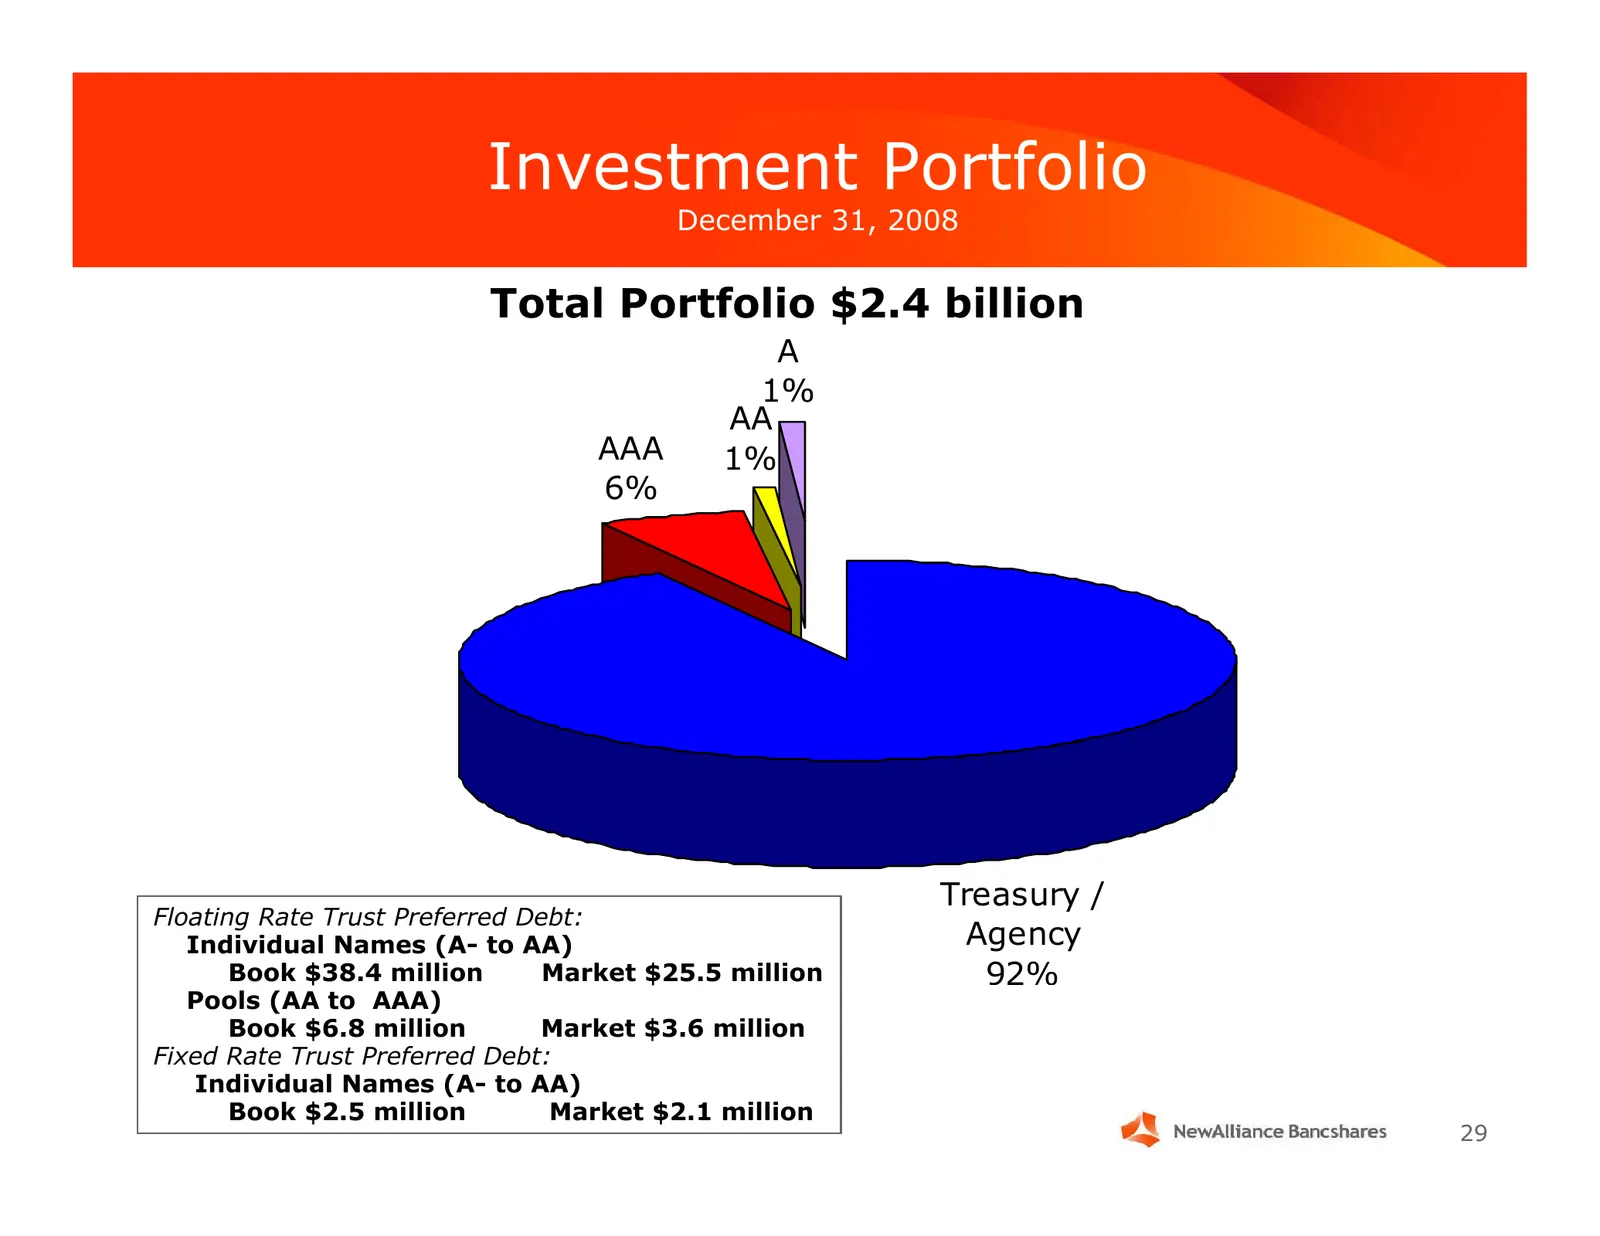
Investment Portfolio December 31, 2008 Total Portfolio $2.4 billion A 1% AA AAA 1% 6% Treasury / Floating Rate Trust Preferred Debt: Individual Names (A- to AA) Agency Book $38.4 million Market $25.5 million 92% Pools (AA to AAA) Book $6.8 million Market $3.6 million Fixed Rate Trust Preferred Debt:
Slide 30: Gap Report December 2008
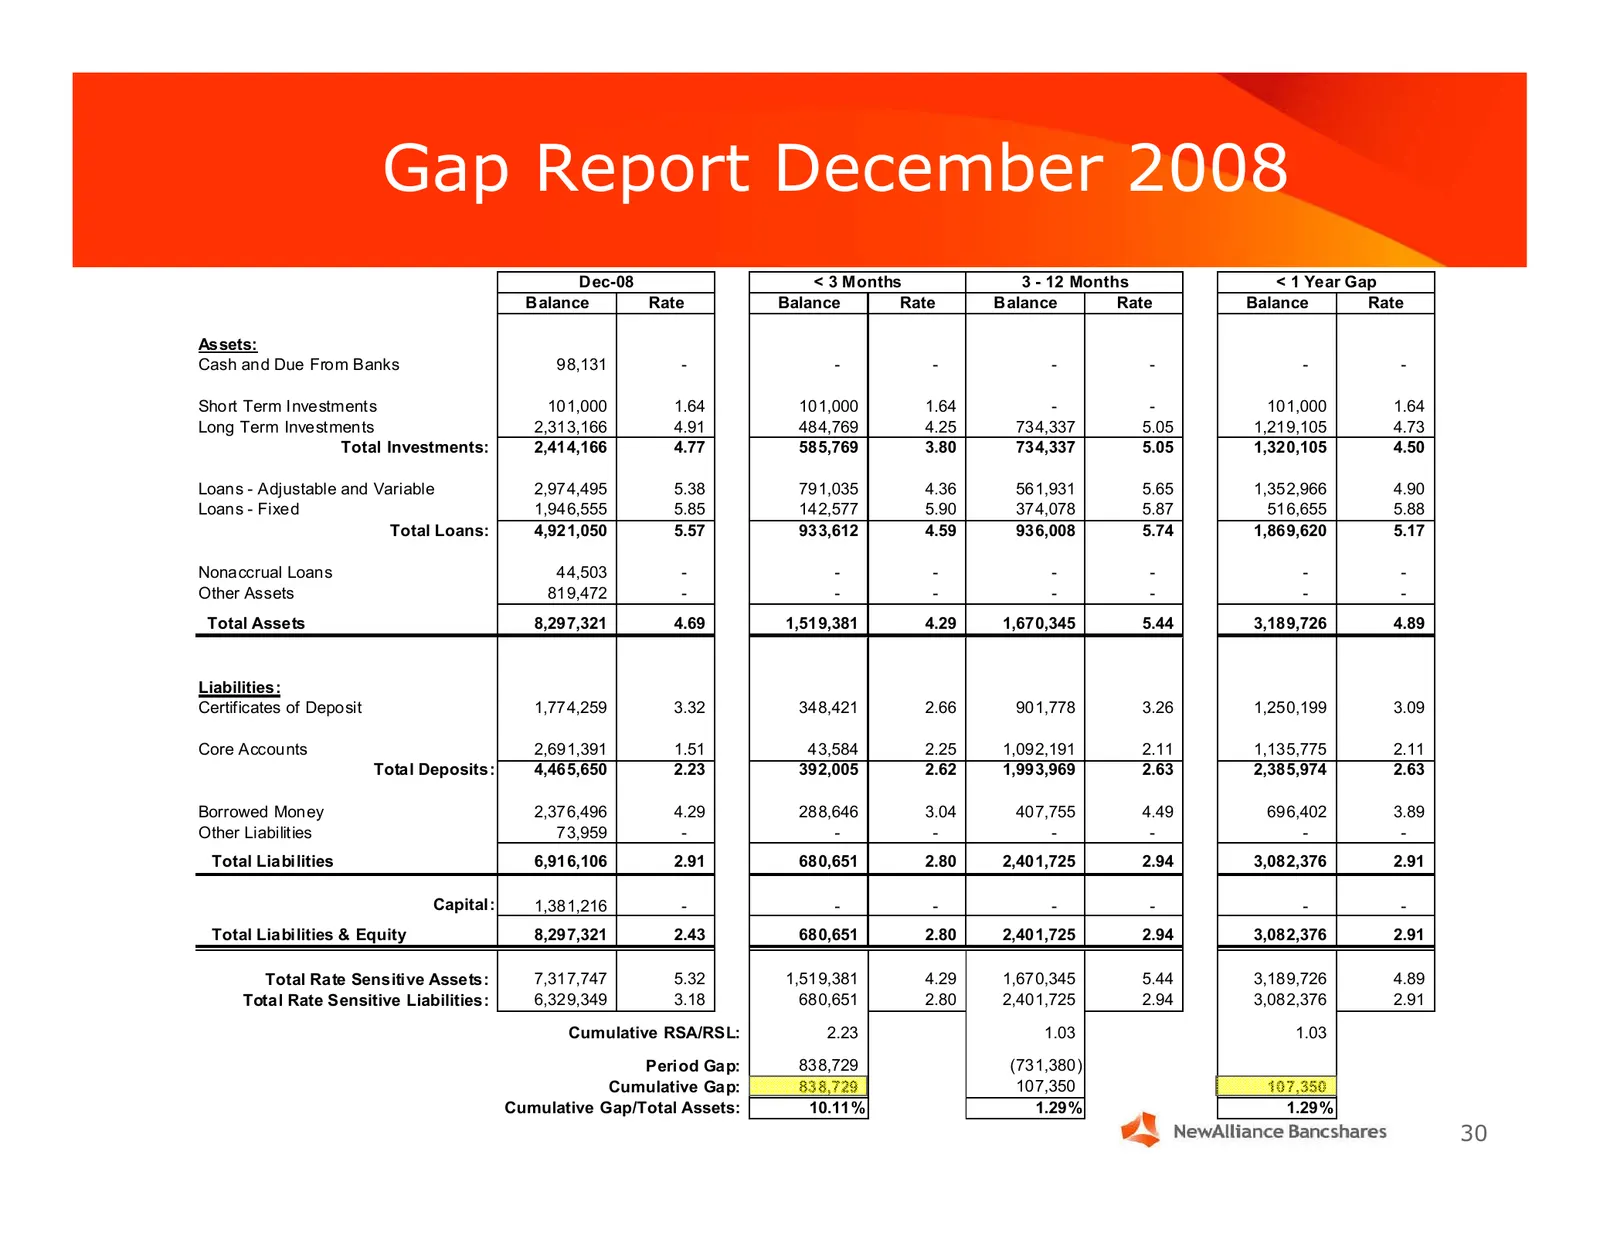
Gap Report December 2008 Dec-08 < 3 Months 3 - 12 Months < 1 Year Gap Balance Rate Balance Rate Balance Rate Balance Rate Assets: Cash and Due From Banks 98,131 - - - - - - - Short Term Investments 101,000 1.64 101,000 1.64 - - 101,000 1.64 Long Term Investments 2,313,166 4.91 484,769 4.25 734,337 5

Slide 31: Outlook for 2009
/ : ‘ . > Outlook for 2009
Slide 32: Outlook for 2009
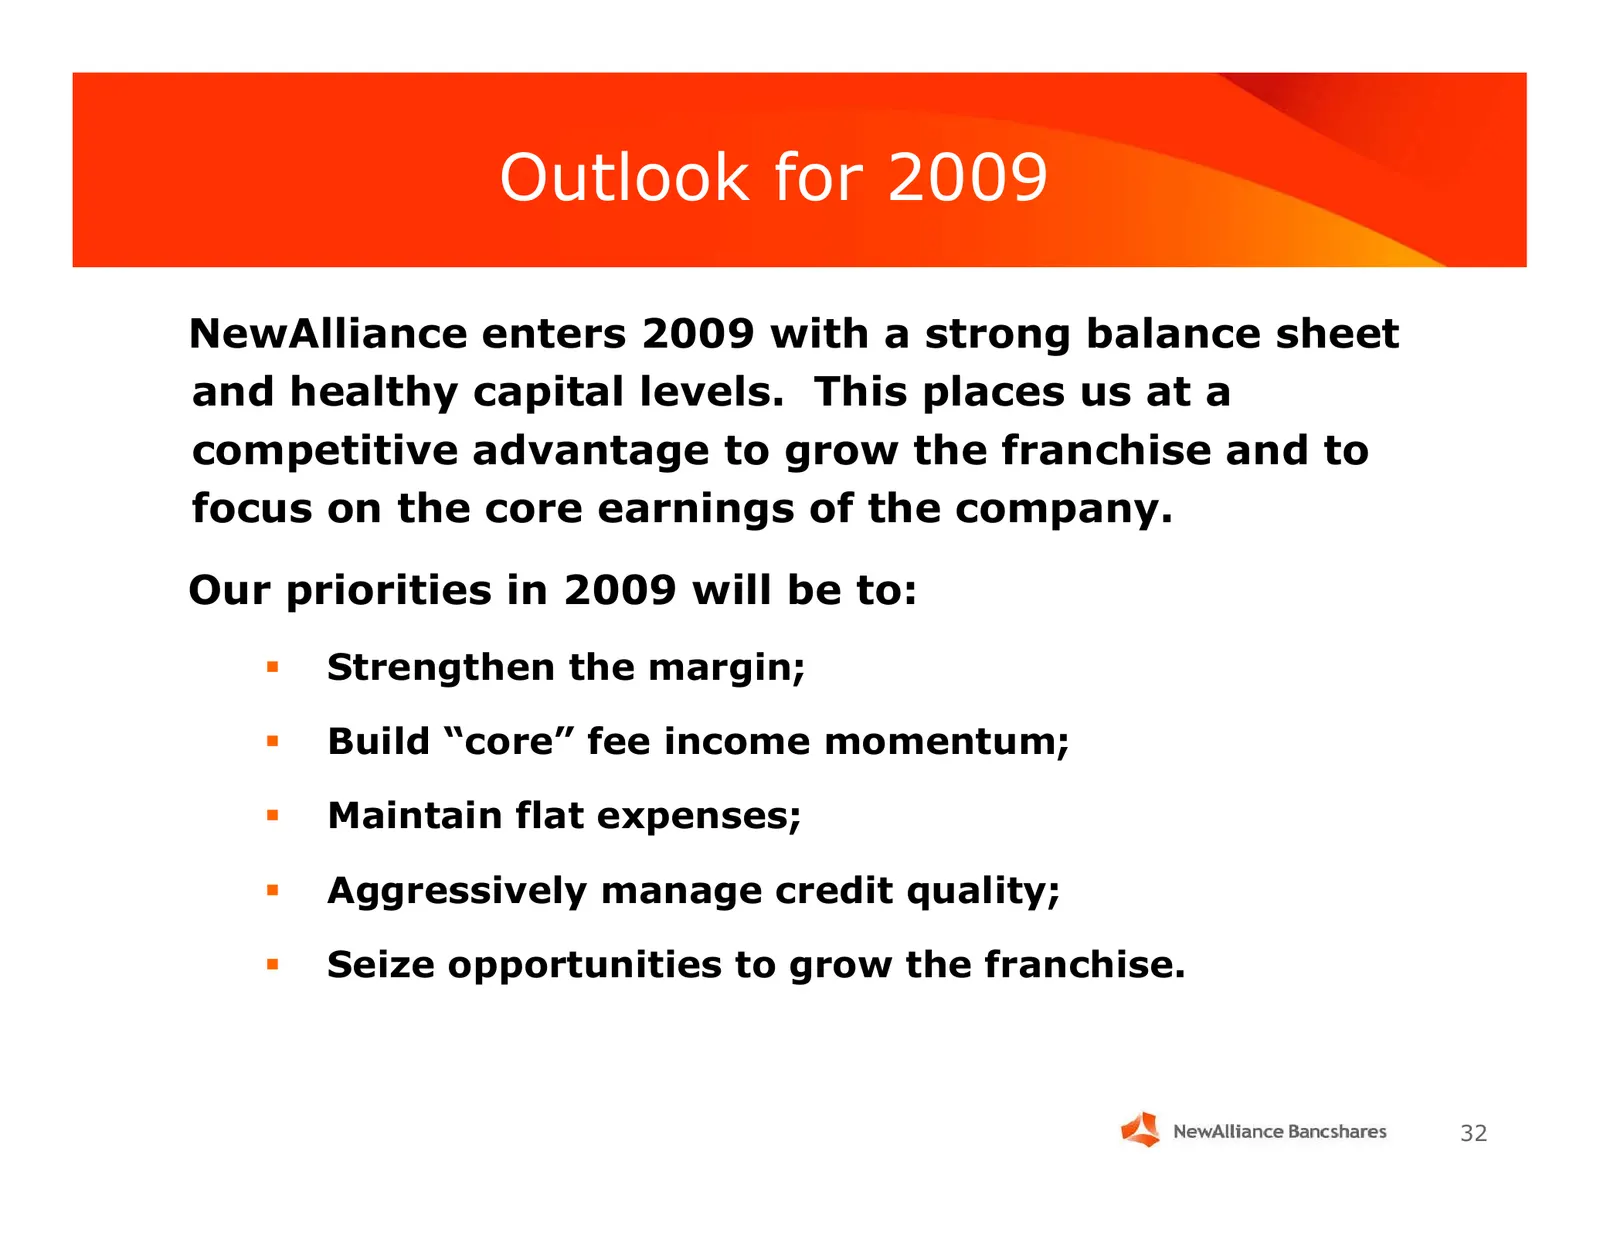
Outlook for 2009 NewAlliance enters 2009 with a strong balance sheet and healthy capital levels. This places us at a competitive advantage to grow the franchise and to focus on the core earnings of the company. Our priorities in 2009 will be to: Strengthen the margin; Build “core” fee income mom
Slide 33: Outlook for 2009: Strengthen the Margin
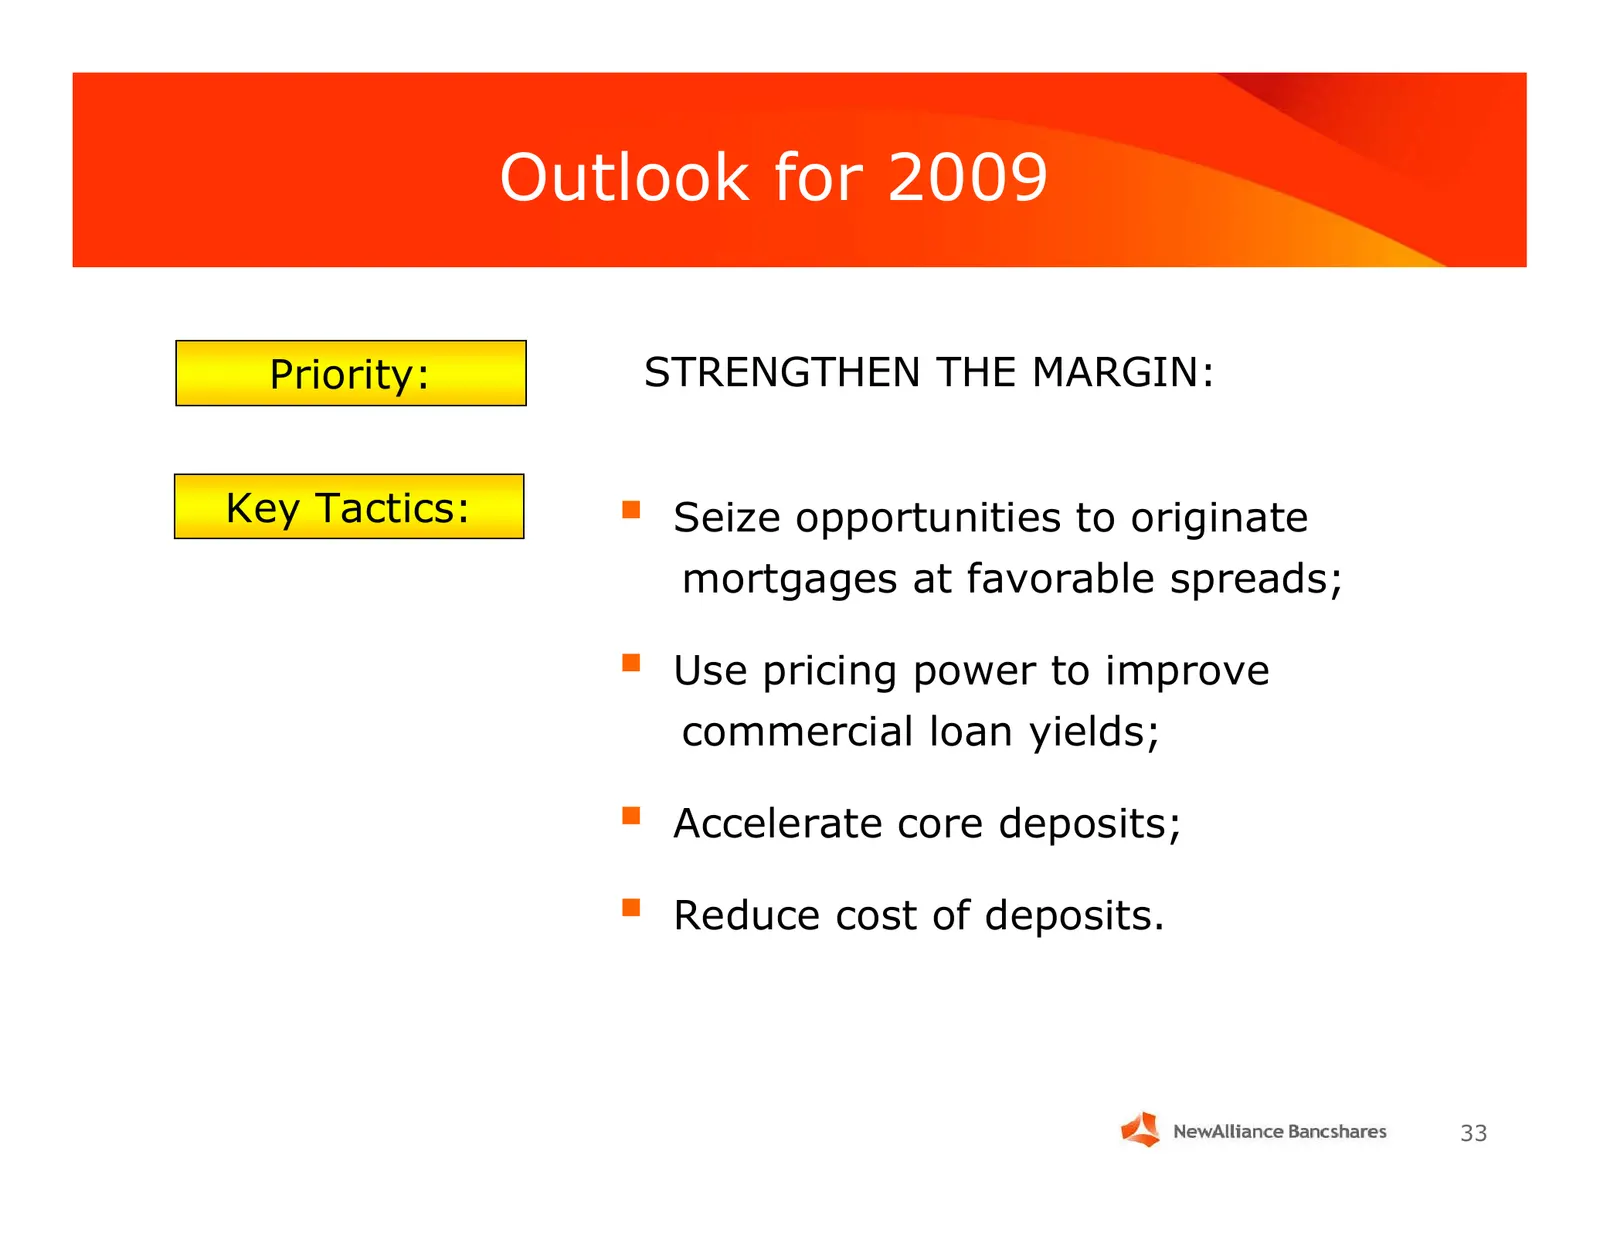
Outlook for 2009 Priority: STRENGTHEN THE MARGIN: Key Tactics: Seize opportunities to originate mortgages at favorable spreads; Use pricing power to improve commercial loan yields; Accelerate core deposits; Reduce cost of deposits. 33
Slide 34: Outlook for 2009: Build Core Fee Income
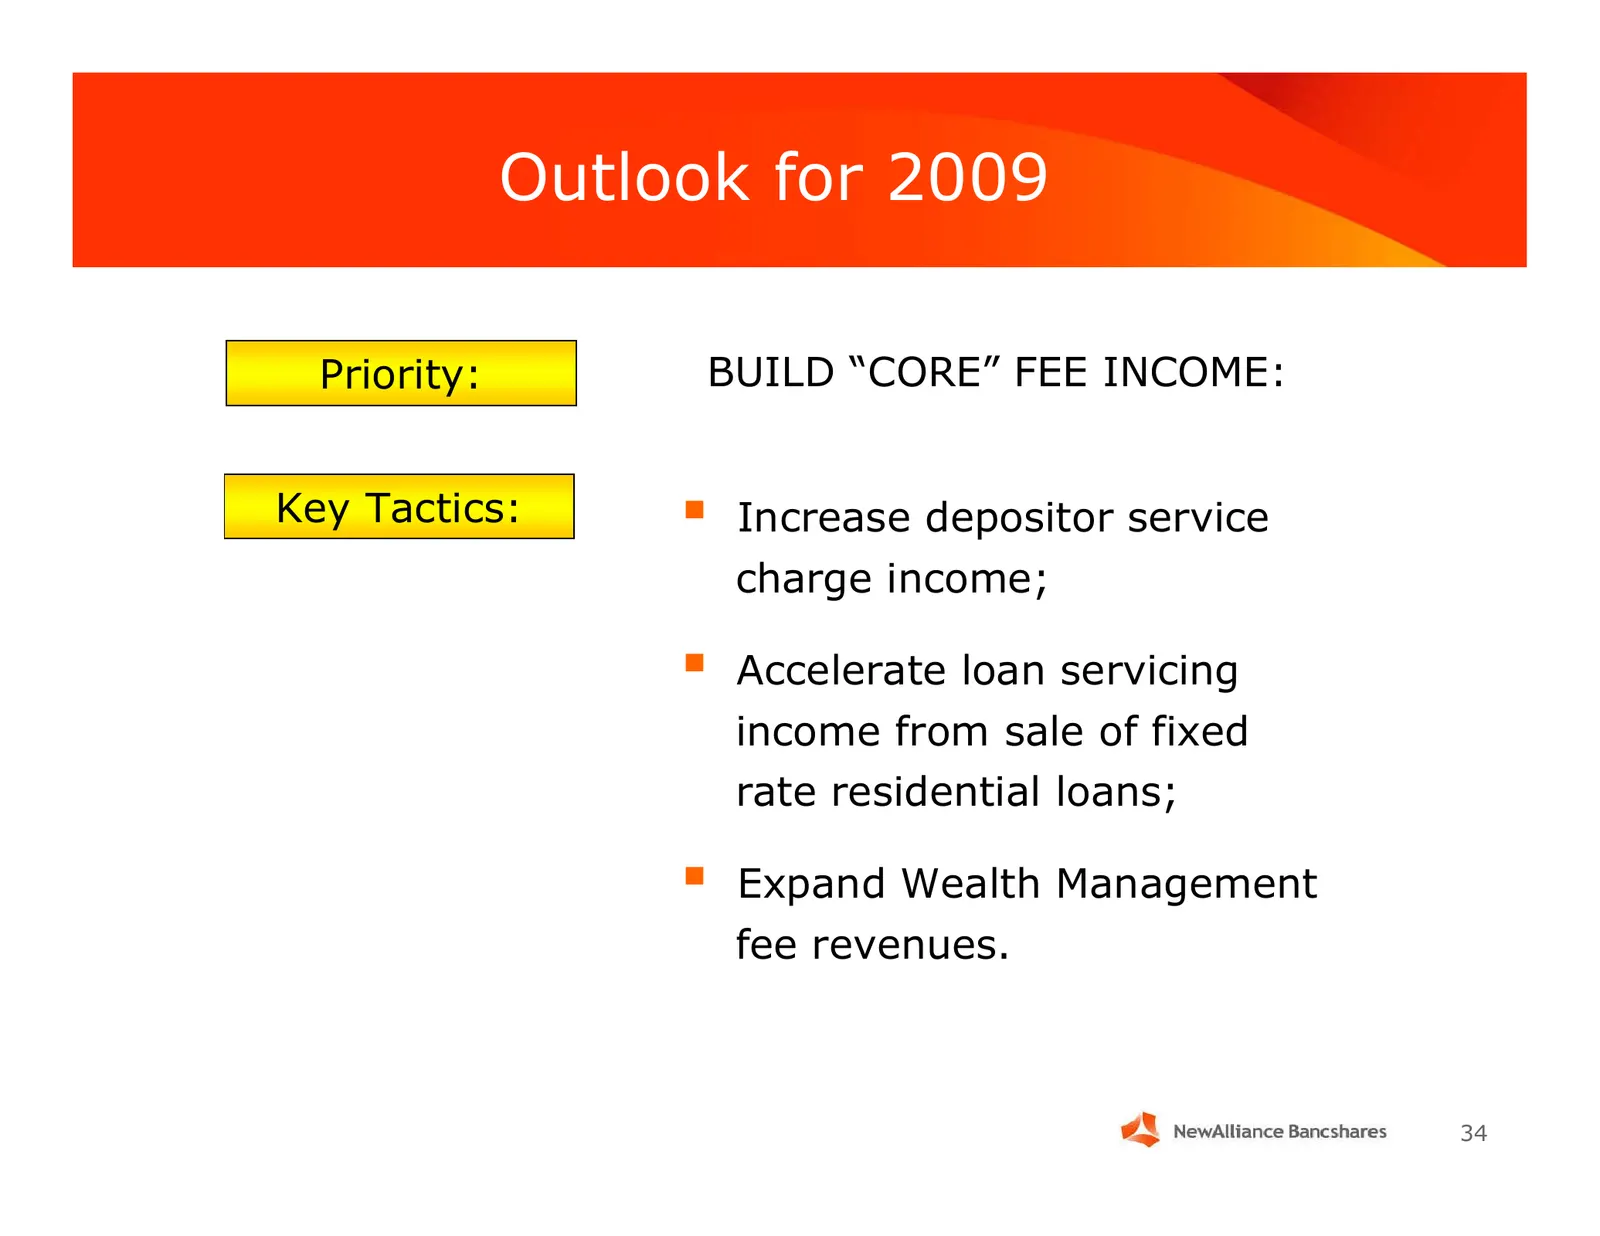
Outlook for 2009 Priority: BUILD “CORE” FEE INCOME: Key Tactics: Increase depositor service charge income; Accelerate loan servicing income from sale of fixed rate residential loans; Expand Wealth Management fee revenues. 34
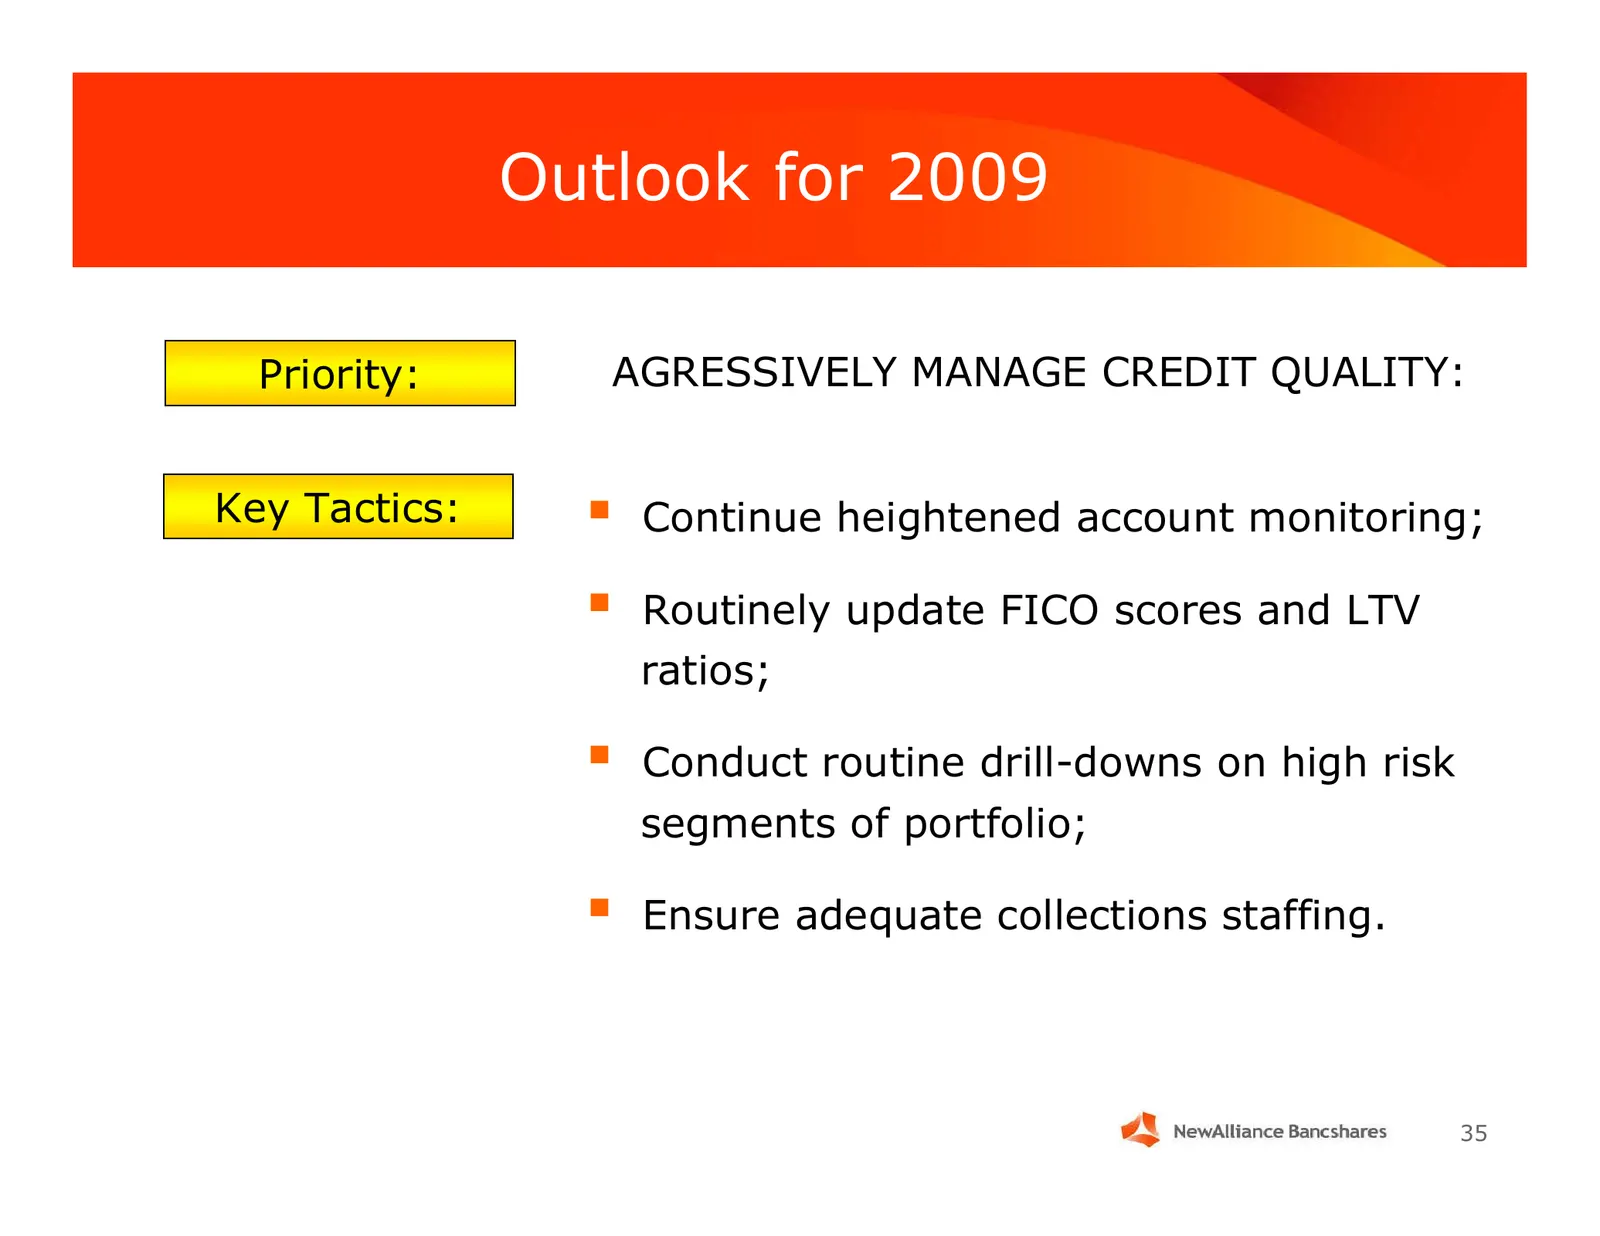
Slide 35: Outlook for 2009: Manage Credit Quality
Outlook for 2009 Priority: AGRESSIVELY MANAGE CREDIT QUALITY: Key Tactics: Continue heightened account monitoring; Routinely update FICO scores and LTV ratios; Conduct routine drill-downs on high risk segments of portfolio; Ensure adequate collections staffing. 35
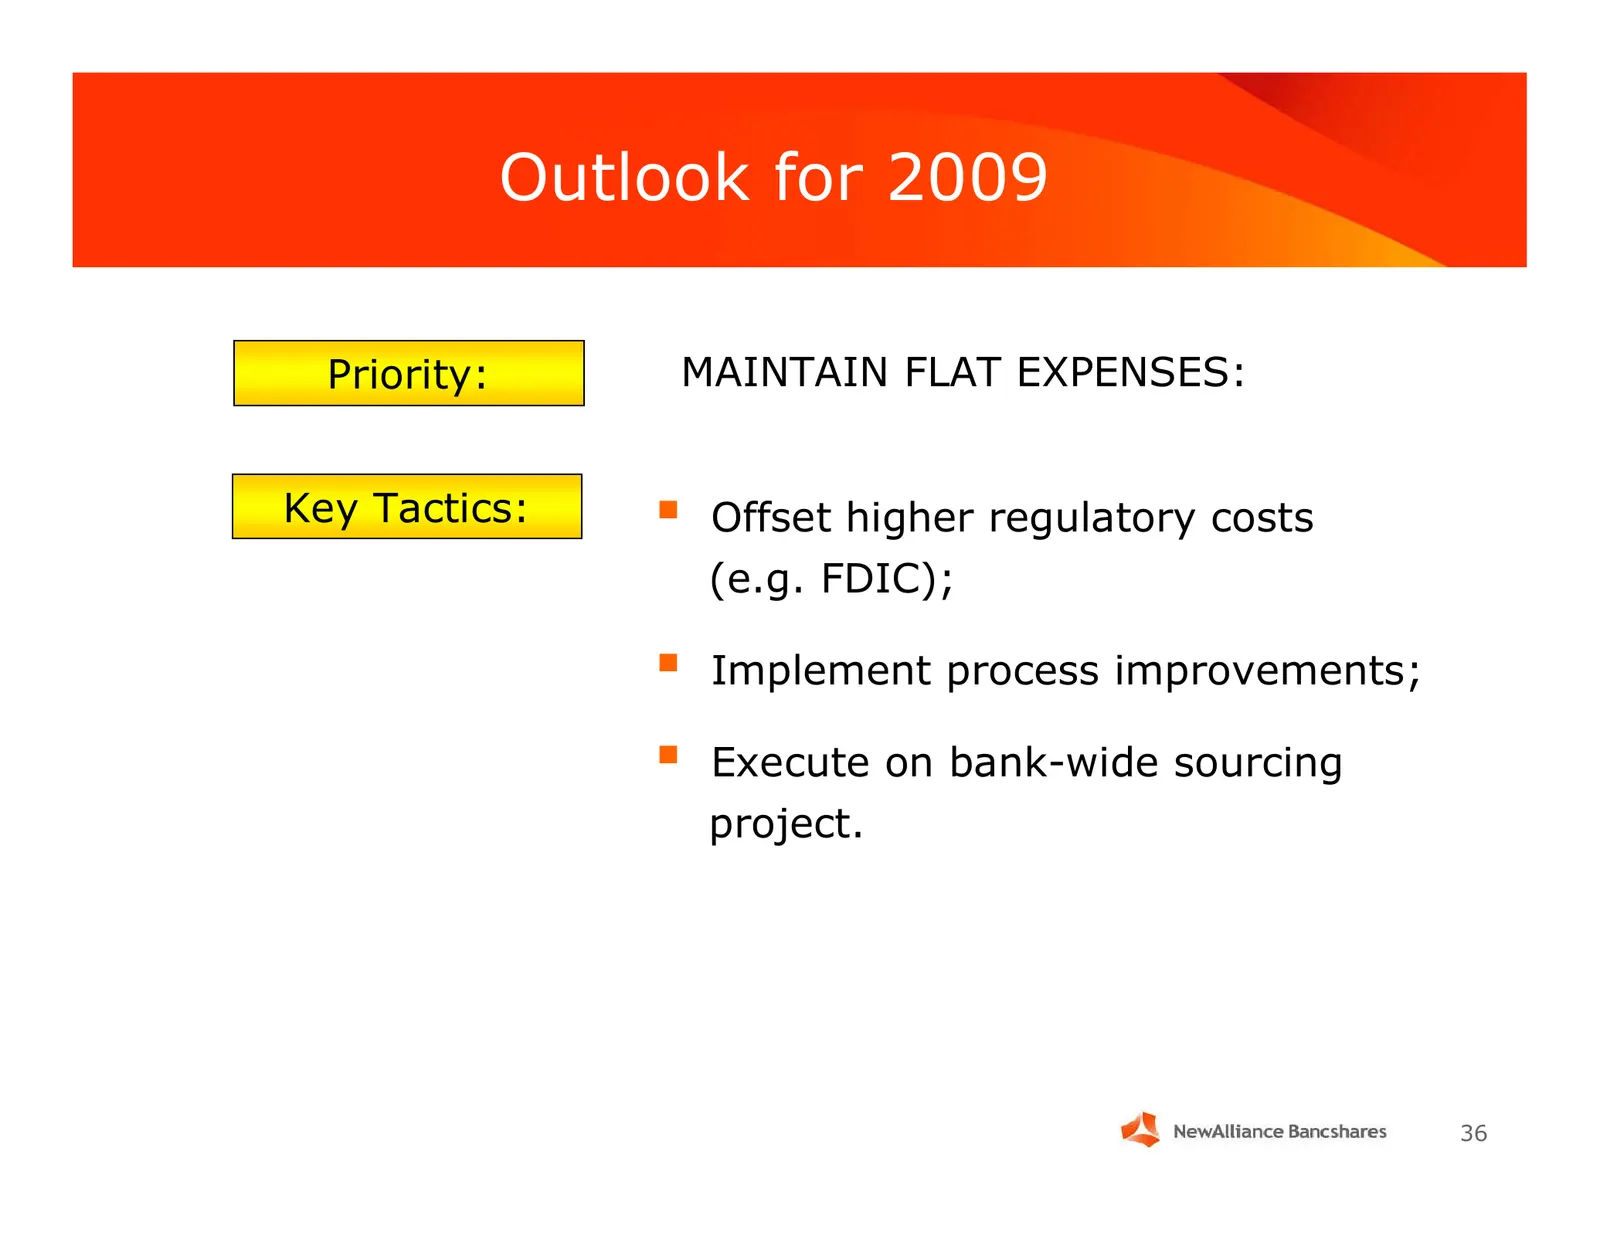
Slide 36: Outlook for 2009: Maintain Flat Expenses
Outlook for 2009 Priority: MAINTAIN FLAT EXPENSES: Key Tactics: Offset higher regulatory costs (e.g. FDIC); Implement process improvements; Execute on bank-wide sourcing project. 36
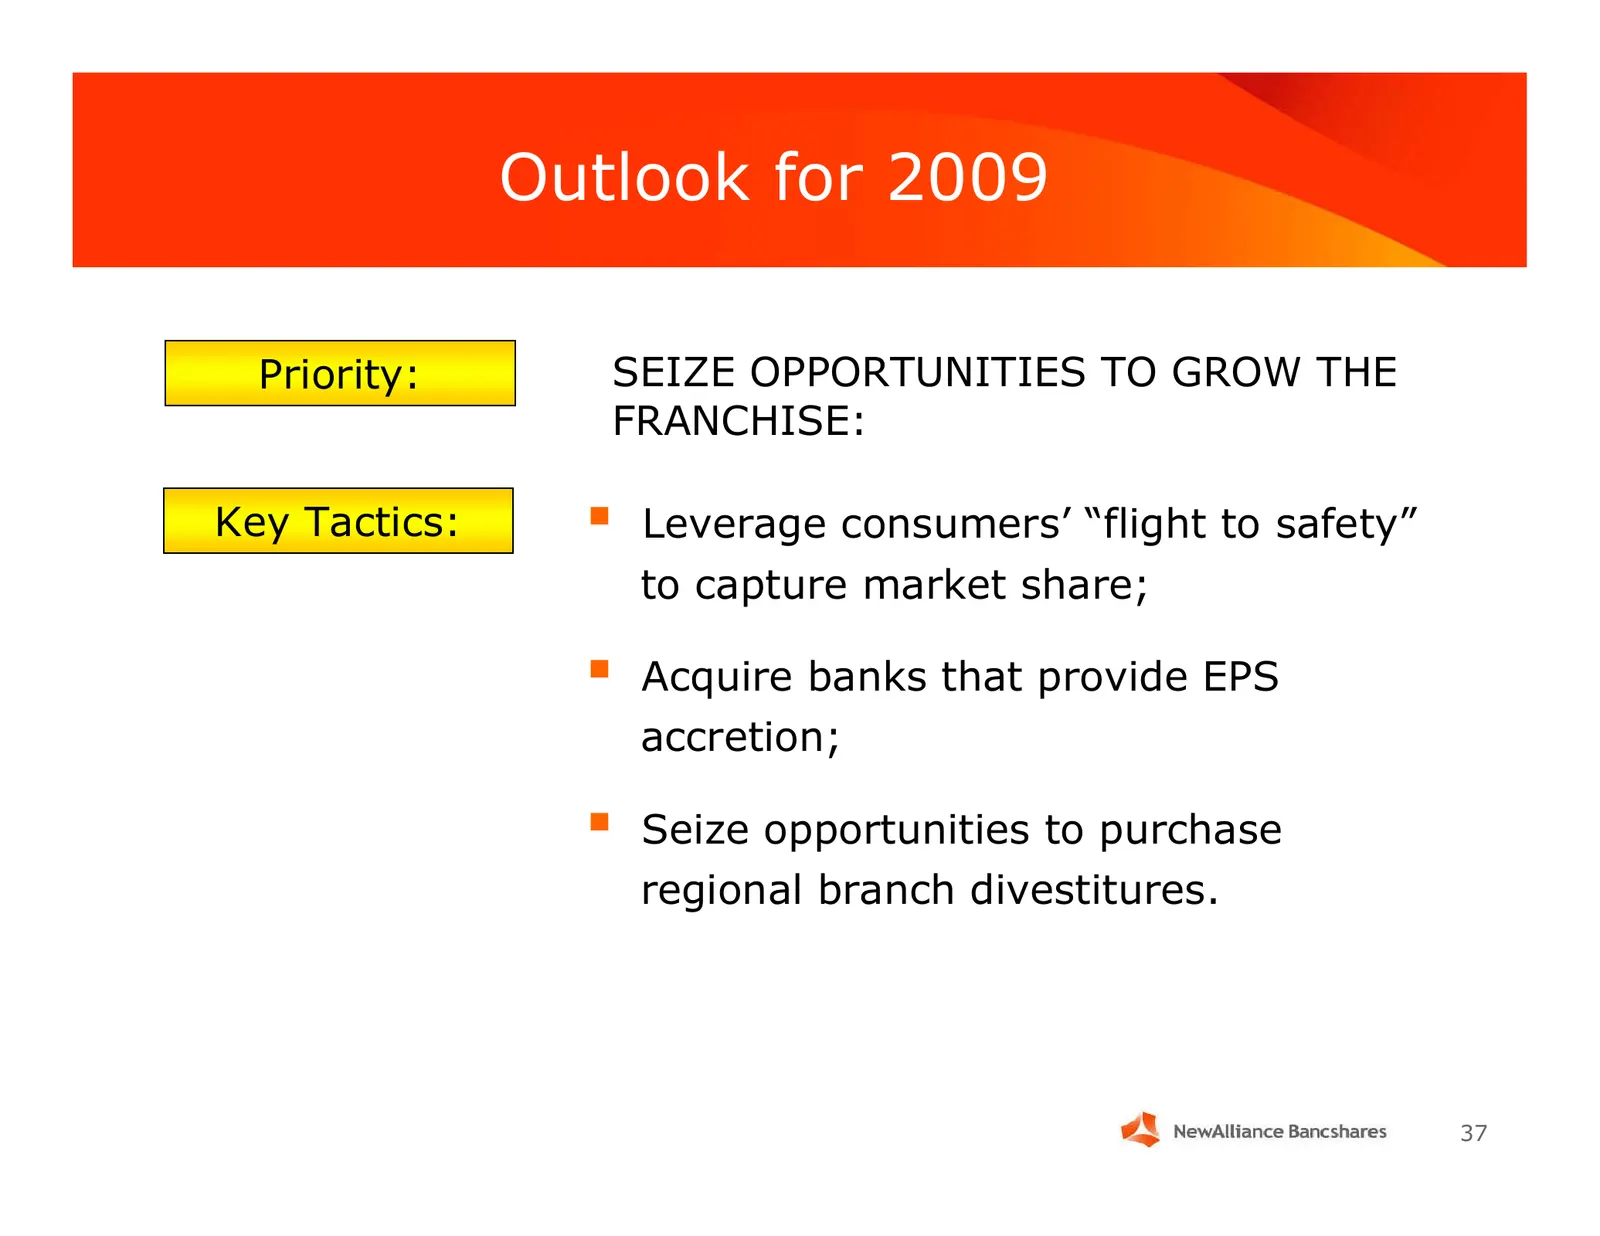
Slide 37: Outlook for 2009: Grow the Franchise
Outlook for 2009 Priority: SEIZE OPPORTUNITIES TO GROW THE FRANCHISE: Key Tactics: Leverage consumers’ “flight to safety” to capture market share; Acquire banks that provide EPS accretion; Seize opportunities to purchase regional branch divestitures. 37
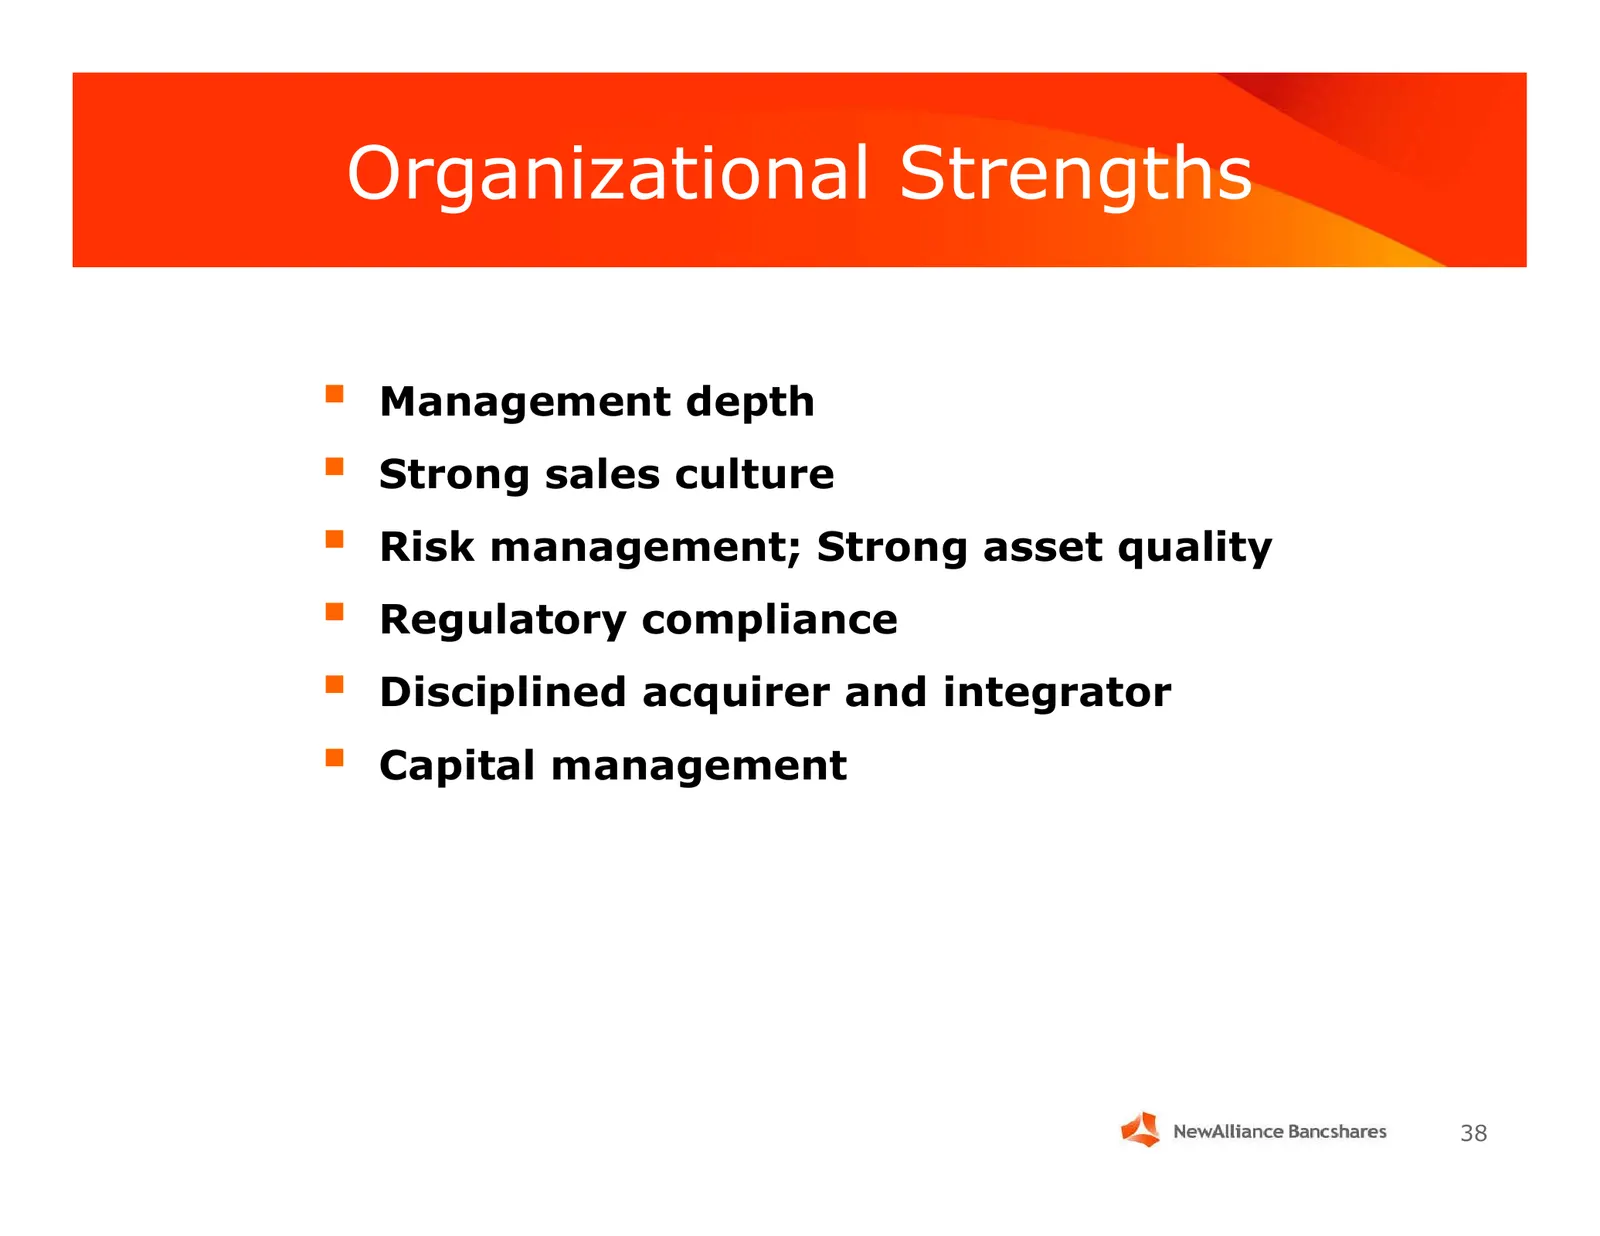
Slide 38: Organizational Strengths
Organizational Strengths Management depth Strong sales culture Risk management; Strong asset quality Regulatory compliance Disciplined acquirer and integrator Capital management 38
Slide 39: Disclaimer & Forward-Looking Statements
Disclaimer & Forward-Looking Statements Statements in this document and presented orally at the conference, if any, concerning future results, performance, expectations or intentions are forward-looking statements. Actual results, performance or developments may differ materially from forward-lookin

Slide 40
Source: SEC EDGAR · 8-K filed Feb 6, 2009
More decks from Newalliance Bancshares Inc
 Merger or Acquisition (November 2010)45 slides · Nov 18, 2010
 Stifel, Nicolaus & Company, Inc. Bank and Thrift Conference 201037 slides · Nov 3, 2010
 Merger or Acquisition (August 2010)25 slides · Aug 25, 2010
 Merger or Acquisition (August 2010)24 slides · Aug 19, 2010
 Merger or Acquisition (August 2010)23 slides · Aug 19, 2010
 Q2 2010 Earnings Presentation31 slides · Jul 28, 2010