Electronic Data Systems — Q1 2003 Earnings Presentation
19 slides from Electronic Data Systems's earnings presentation, May 8, 2003
Slide 1: First Quarter 2003 Earnings Discussion
**3* First Quarter 2003 Earnings Discussion Bob Swan [email protected]
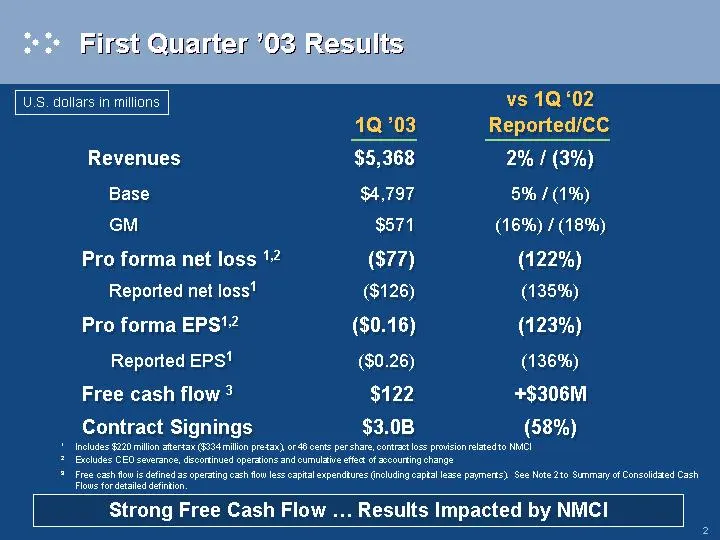
Slide 2: Q1 Results: Strong Free Cash Flow, Results Impacted by NMCI
ter OS Results, U.S. dollars in millions vs 1Q ‘02 1Q°03 Reported/CC Revenues $5,368 2% f (3%) Base $4,797 5% / (1%) GM $571 (16%) / (18%) Pro forma net loss 12 ($77) (122%) Reported net loss? ($126) (135%) Pro forma EPS'2 ($0.16) (123%) Reported EPs" ($0.26) (136%) Free cash flow 3 $122 +$306M Cont
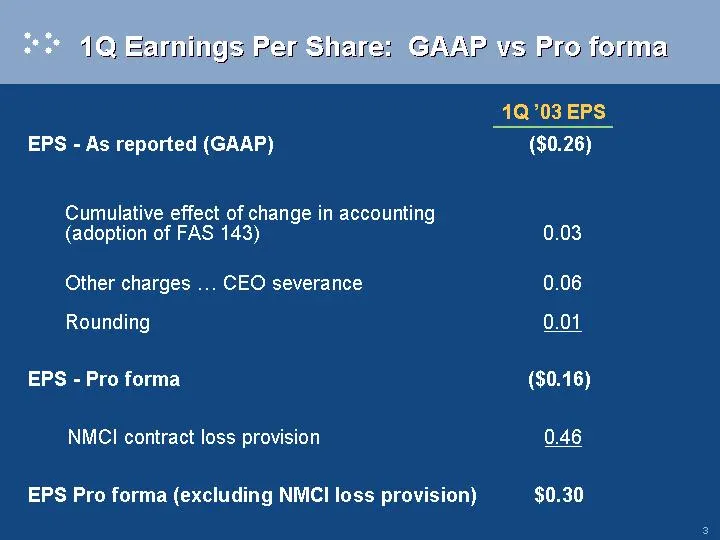
Slide 3: Earnings per share: GAAP to pro forma
AnNngs er sine. CAAR Ys Pro tonnia 1Q 03 EPS EPS - As reported (GAAP) ($0.26) Cumulative effect of change in accounting (adoption of FAS 143) 0.03 Other charges ... CEO severance 0.06 Rounding 0.01 EPS - Pro forma ($0.16) NMCI contract loss provision 0.46 EPS Pro forma (excluding NMCI loss provision
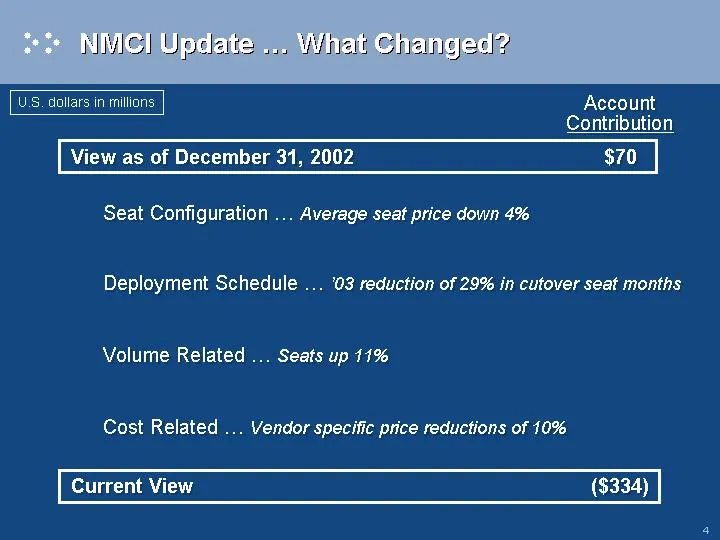
Slide 4: NMCI account contribution
U.S. dollars in millions Account Contribution View as of December 31, 2002 $70 Seat Configuration ... Average seat price down 4% Deployment Schedule ... 03 reduction of 29% in cutover seat months Volume Related ... Seats up 11% Cost Related ... Vendor specific price reductions of 10% Current View ($
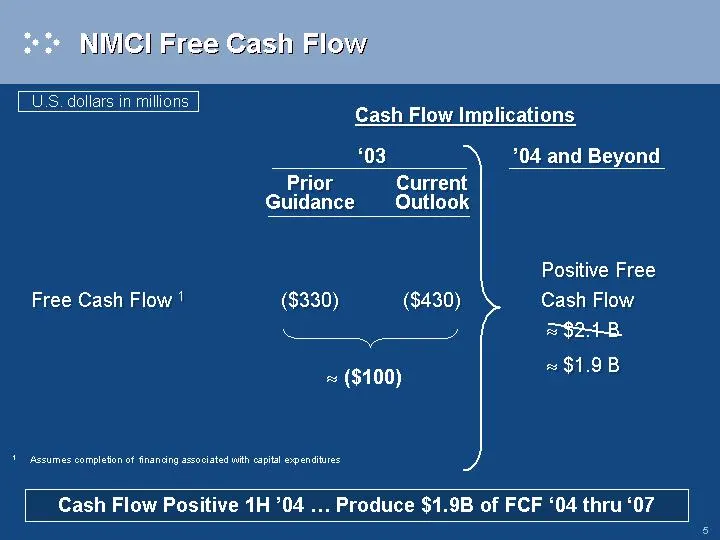
Slide 5: Cash Flow Implications '04 and Beyond
U.S. dollars in millions Cash Flow Implications 03 *04 and Beyond Prior Current Guidance Outlook Positive Free Free Cash Flow ! ($330) ($430) Cash Flow ~ ($100) #$1.9B + Assumes completion of fnancing associated with capital expenditures Cash Flow Positive 1H ’04 ... Produce $1.9B of FCF ‘04 thru ‘0
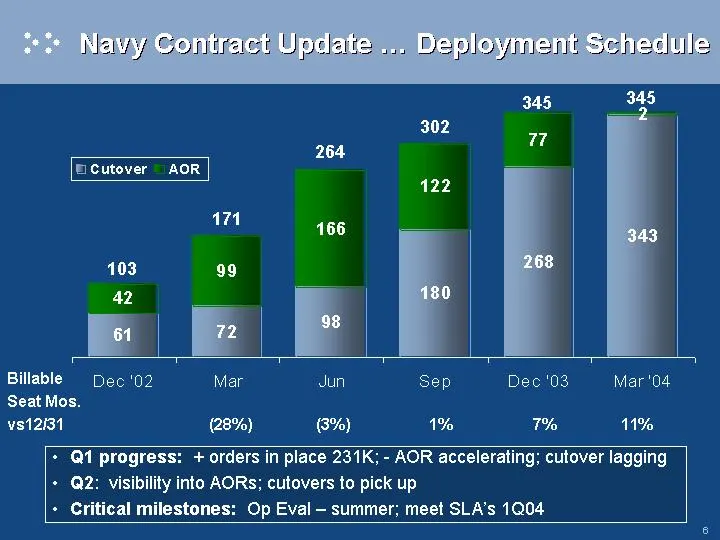
Slide 6: NMCI deployment
OyMent ECutover AOR Billable Dec '02 Mar Jun Sep Dec'08 — Mar'04 Seat Mos. vs12131 (28%) 8%) 1% 1% 11% + Q1 progress: + orders in place 231K; - AOR accelerating; cutover lagging + Q2: visibility into AORs; cutovers to pick up + Critical milestones: Op Eval — summer; meet SLA’s 1004
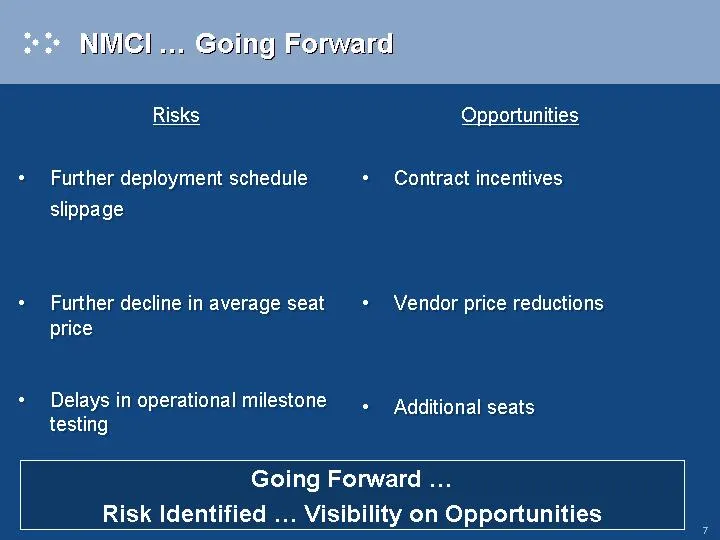
Slide 7: Going Forward: Risks and Opportunities
7 Soing) Forvard. Risks Opportunities Further deployment schedule + Contract incentives slippage Further decline in average seat + Vendor price reductions price Delays in operational milestone . additional seats testing Going Forward ... Risk Identified ... Visibility on Opportunities
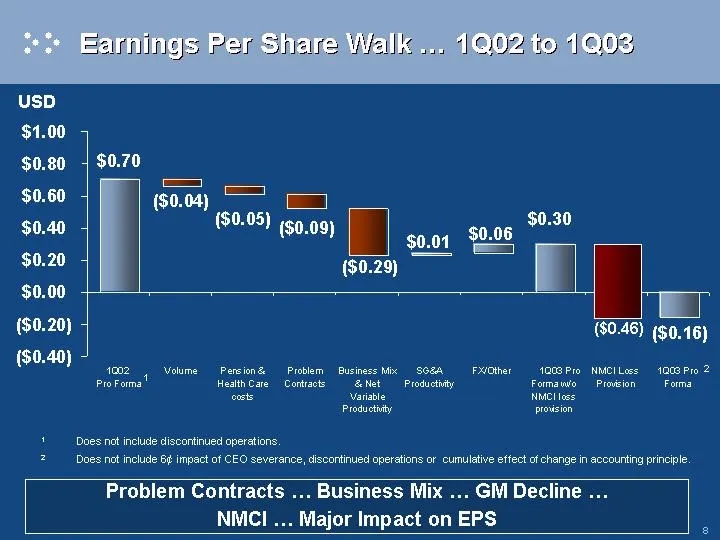
Slide 8: Earnings Per Share 1Q02 to 1Q03
mings Per shire kK... 1902 to 1Q03 usD $1.00 $0.80 + $0.70 = $0.60 ($0.04) ($0.05) = $0.30 $0.40 em? ($0.09) ia 0.01 $0.20 ($0.29) | $0.00 a ($0.20) (60.48) ($0.16) ($0.40) 1002, Vohme Persln& Probl Business Mix 906A FX/Other_ 1008 Pro NMCILoes 1003 10 2 ae HeatnGare Contac aitet Produlny Fomawo Pro
Slide 9: Margin Assessment
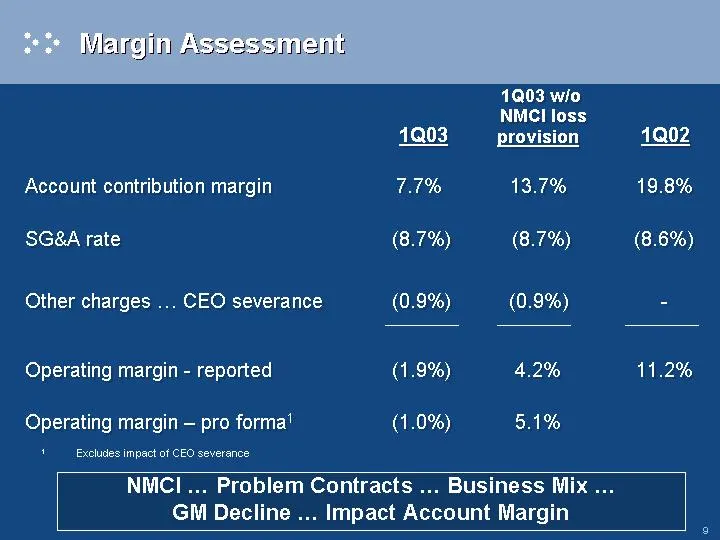
Margin Assessinent 1Q03 wio NMCI loss alelik} provision 1Q02 Account contribution margin 7.7% 13.7% 19.8% SG&A rate (8.7%) (8.7%) (8.6%) Other charges ... CEO severance (0.9%) (0.9%) - Operating margin - reported (1.9%) 4.2% 11.2% Operating margin — pro forma’ (1.0%) 5.1% + Excludes impact of CEO se
Slide 10: Segment Performance
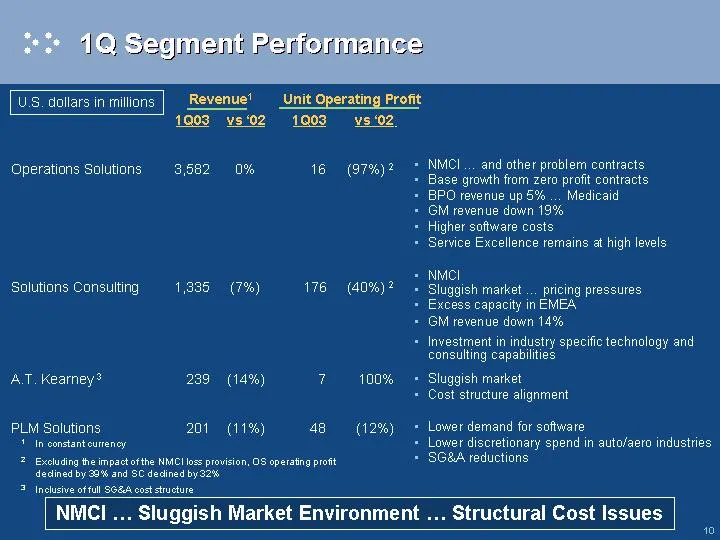
Q Segment Performance: US. dollars inmilions | Revenue’ _Unit Operating Pront 1003 vs02 1003 vs ‘02 Operations Solutions 3,582 0% 16 (97%)? Solutions Consulting «1,385 (7%) 176 (40%)? + AT. Kearney? 239 (14%) 7 100% + PLM Solutions 201 (11%) 48 (12%) + + In constant surency 2 Exeluding the impact of
Slide 11: Diverse Portfolio
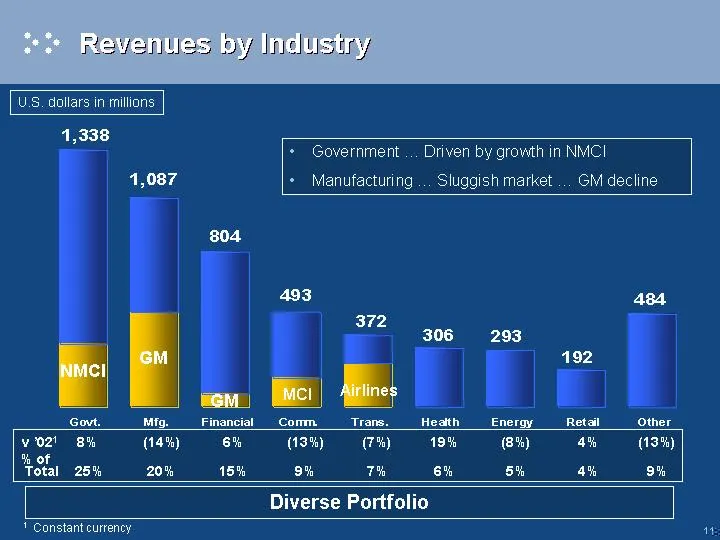
U.S. dollars in millians 1,338 * Government ... Driven by growth in NMCI 1,087 + Manufacturing ... Sluggish market ... GM decline 804 493 484 372 306 293 192 SE uw. Mines v02' 8% (14%) 6% ce 7%) 19% (8%) 4% (13%) % of Total 25% 20% 15% o% Th 6% 5% 4% a Diverse Portfolio © Constant currency 44
Slide 12: Free Cash Flow Priority #1
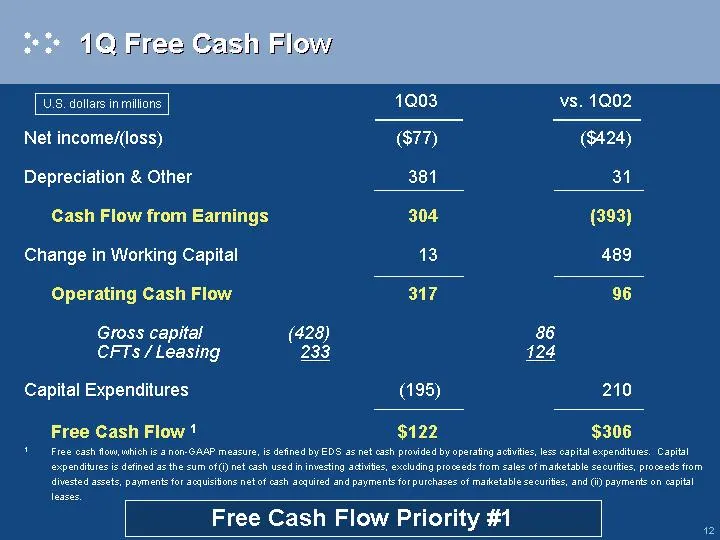
U.S. dollars in milions Net income/(loss) Depreciation & Other Cash Flow from Earnings Change in Working Capital Operating Cash Flow Gross capital (428) CFT s/ Leasing 233 Capital Expenditures Free Cash Flow * 1903 vs. 1002 ($77) ($424) 381 31 304 (393) 13 489 317 96 86 424 (195) 210 $122 $306 + Fre
Slide 13: Working Capital
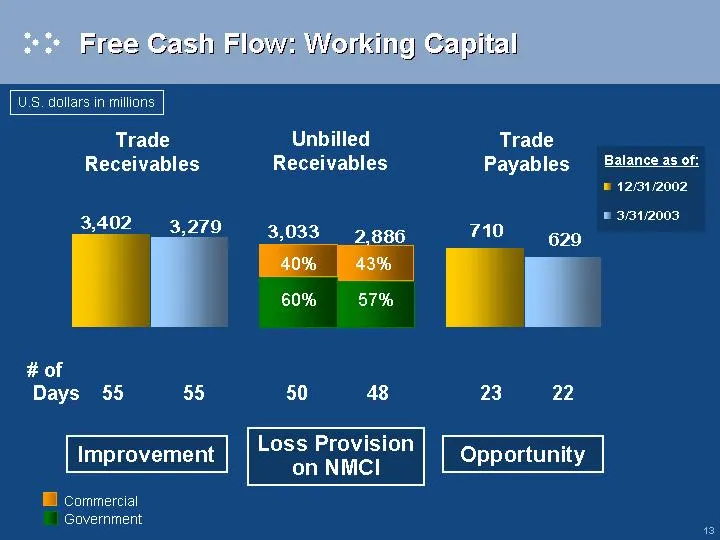
lov Working U.S. dollars in millians Trade Receivables 3,402 # of Days 55 55 3,279 Improvement i commercial Government. Unbilled Receivables 3,033 2.886 60% 87% 50 48 Loss Provision on NMCI Trade Payables 710 629 23 22 Balance as of: = 12/31/2002 = 3/31/2003 Opportunity 2
Slide 14: Cash balance rollforward
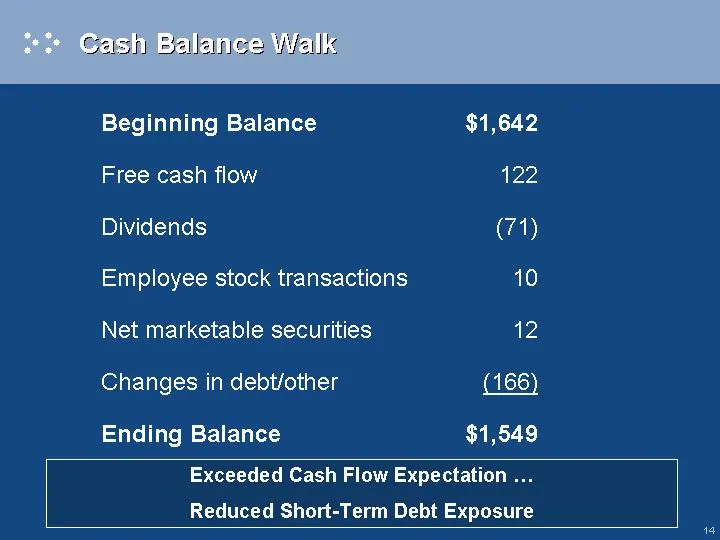
Beginning Balance $1,642 Free cash flow 122 Dividends (71) Employee stock transactions 10 Net marketable securities 12 Changes in debt/other (166) Ending Balance $1,549 Exceeded Cash Flow Expectation ... Reduced Short-Term Debt Exposure 44
Slide 15: Debt
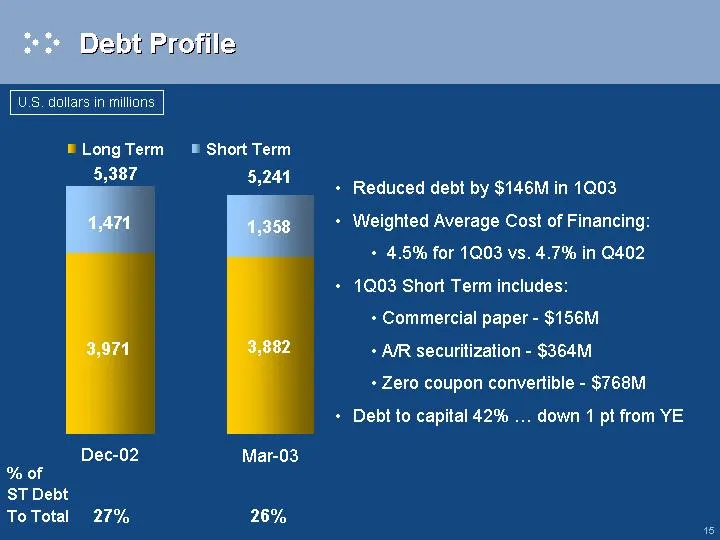
U.S. dollars in millians LongTerm ® Short Term 5,387 oes Reduced debt by $146M in 1003 Weighted Average Cost of Financing: + 4.5% for 1Q03 vs. 4.7% in Q402 1Q03 Short Term includes: + Commercial paper - $156M. 3,971 3,882 + AMR securitization - $364M. + Zero coupon convertible - $768M Debt to capita
Slide 16: Liquidity
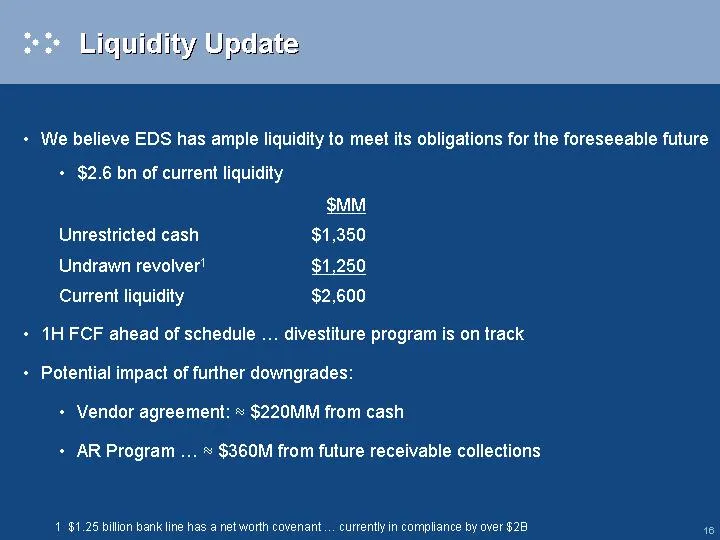
+ We believe EDS has ample liquidity to meet its obligations for the foreseeable future + $2.6 bn of current liquidity $MM Unrestricted cash $1,350 Undrawn revolver! $1,250 Current liquidity $2,600 + 1HFCF ahead of schedule ... divestiture program is on track + Potential impact of further downgrades
Slide 17: 2003 Outlook
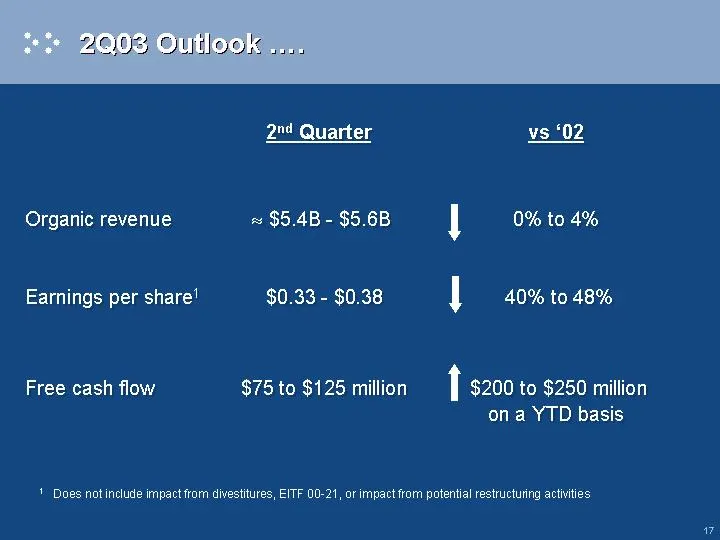
2003 Outlook) 2"¢ Quarter vs ‘02 Organic revenue rs $5.4B - $5.6B | 0% to 4% Earnings per share! $0.33 - $0.38 | 40% to 48% Free cash flow $75 to $125 million t $200 to $250 million ona YTD basis + Does not include impact rom divestitures, EITF 00-21, or impact from potential restructuring activitie
Slide 18: Management priorities
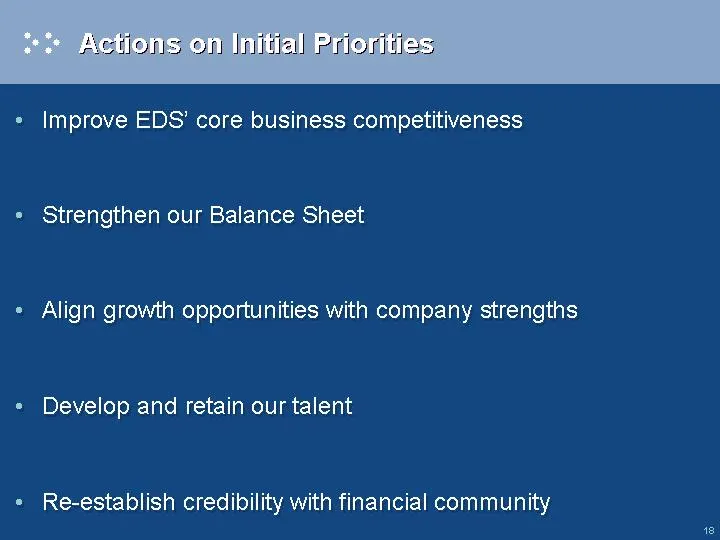
« Improve EDS’ core business competitiveness « Strengthen our Balance Sheet « Align growth opportunities with company strengths « Develop and retain our talent « Re-establish credibility with financial community 8
Slide 19: eds.com
sa" eds.com
Source: SEC EDGAR · 8-K/A filed May 8, 2003