Approach Resources — J.P. Morgan 10th Annual SMid Cap Conference (November 2011)
35 slides from Approach Resources's conference presentation, Nov 30, 2011
Slide 1: J.P. Morgan 10th Annual SMid Cap Conference
Exhibit 99.1 th J.P. Morgan 10 Annual SMid Cap Conference December 1, 2011
Slide 2: Forward-looking statements
Forward-looking statements This presentation containsforward-looking statements within the meaningof Section 27A of the Securities Act of 1933 and Section 21E of the Securities Exchange Act of 1934. All statements, other than statements of historical facts, included in this presentation that address
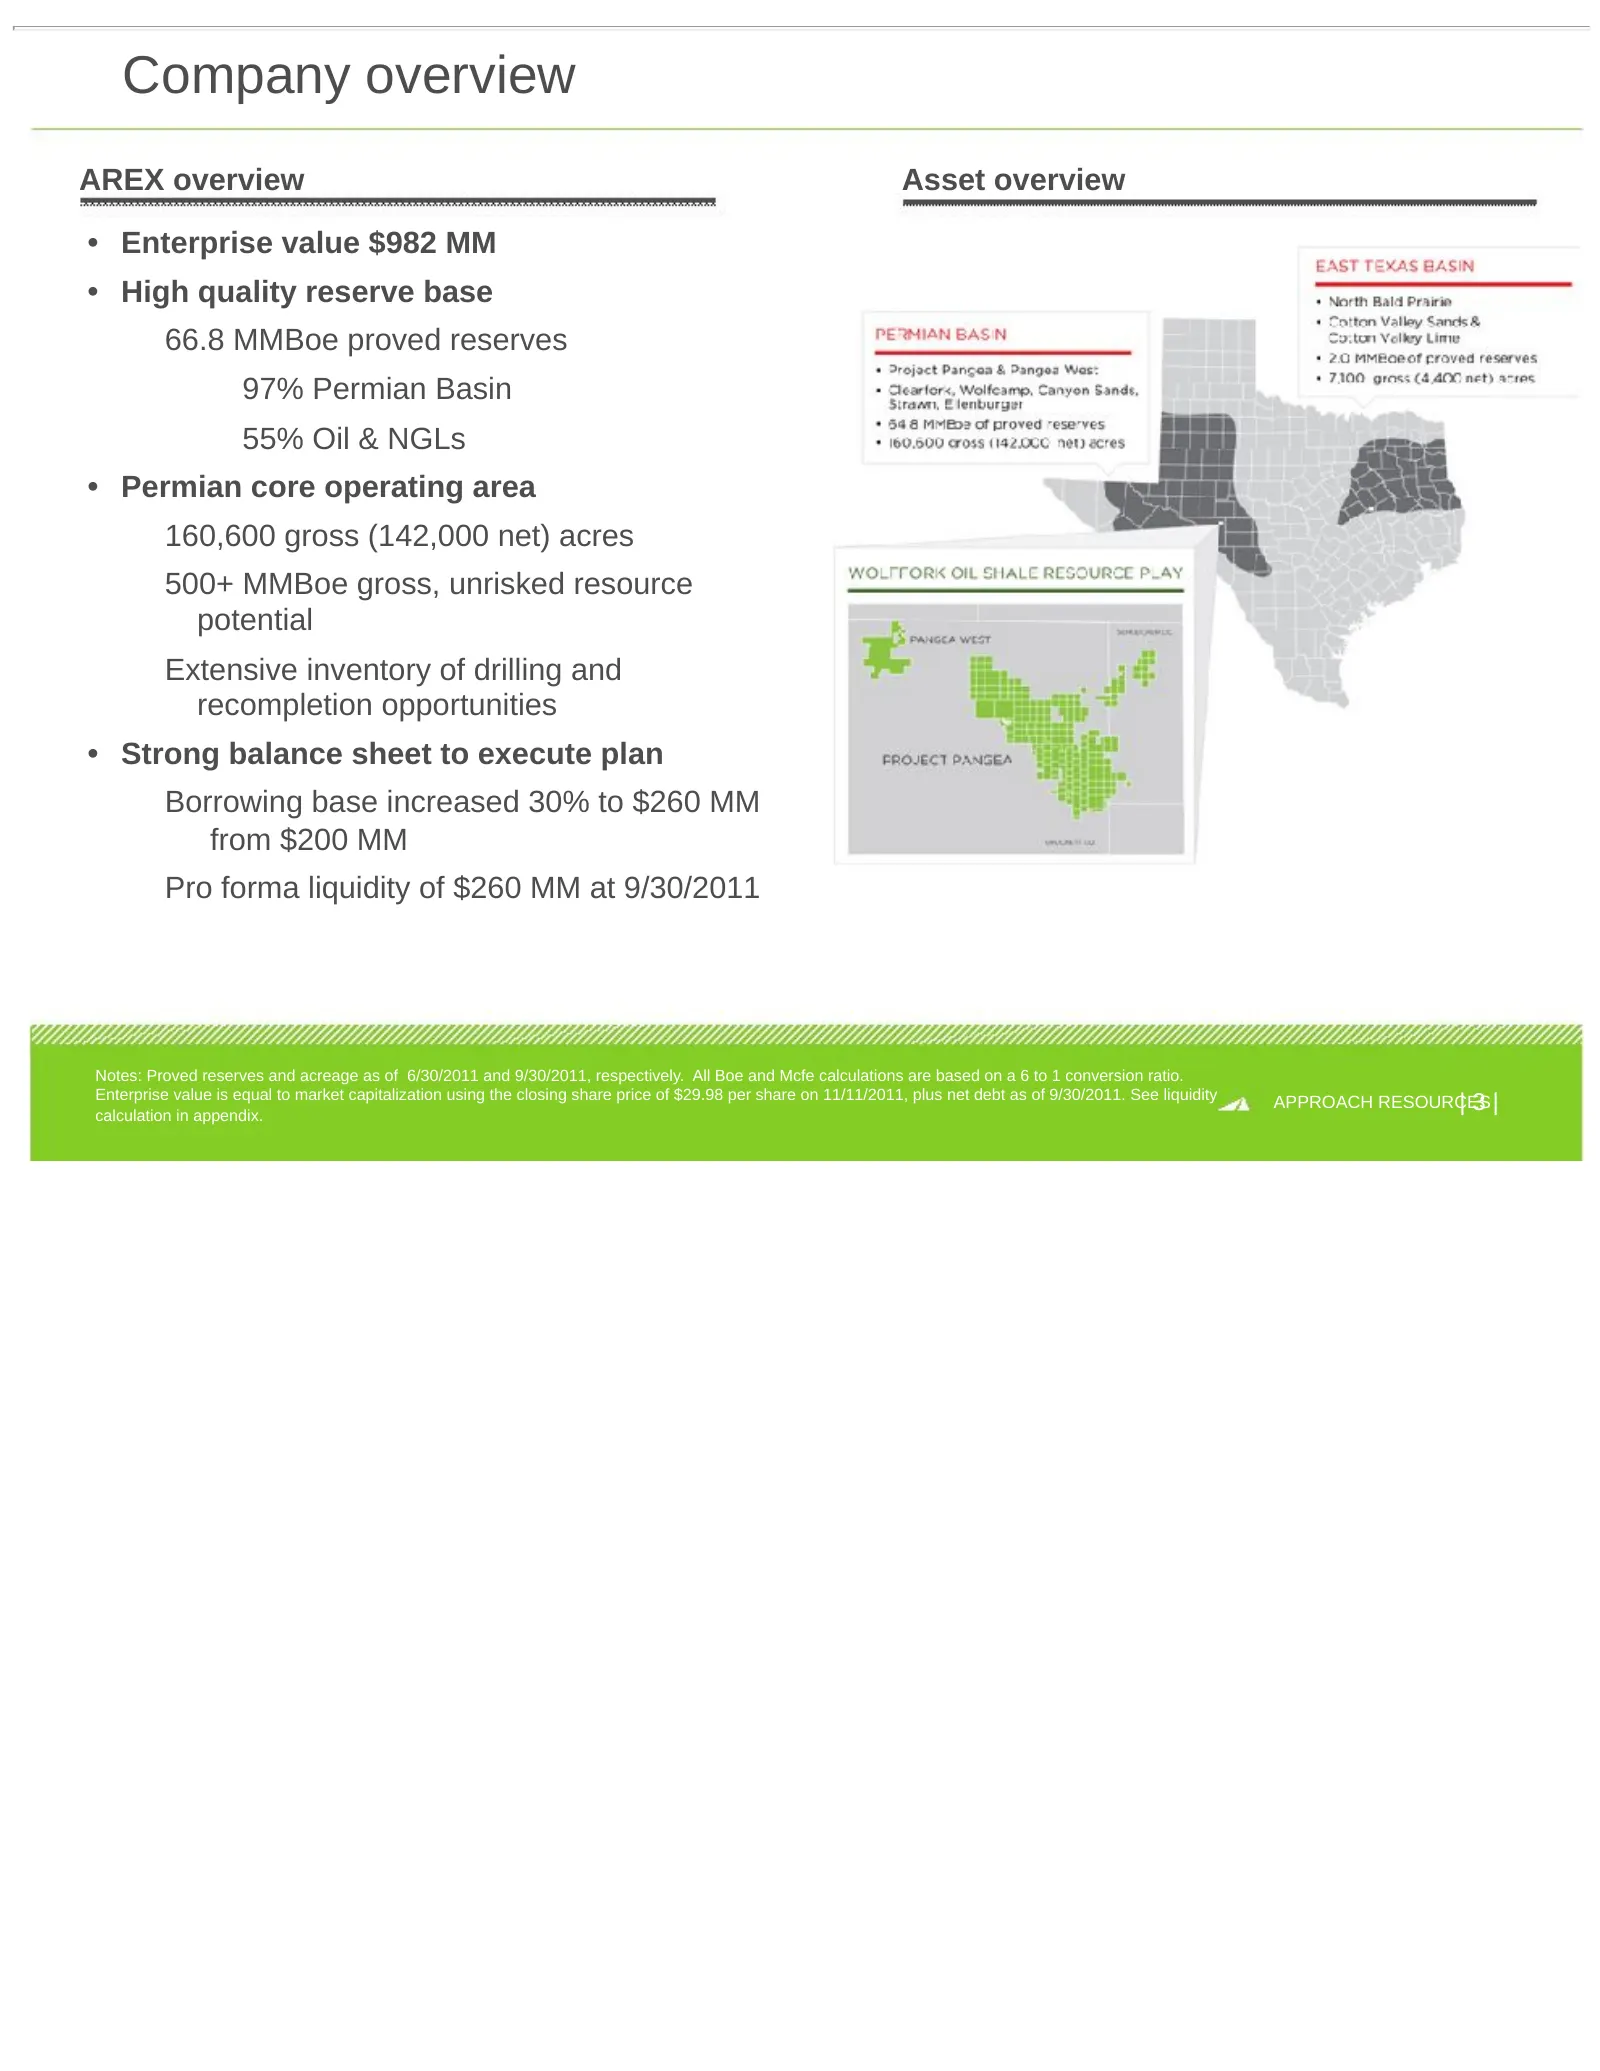
Slide 3: Company overview
Company overview AREX overview Asset overview • Enterprise value $982 MM • High quality reserve base 66.8 MMBoe proved reserves 97% Permian Basin 55% Oil & NGLs • Permian core operating area 160,600 gross (142,000 net) acres 500+ MMBoe gross, unrisked resource potential Extensive inventory of drilli
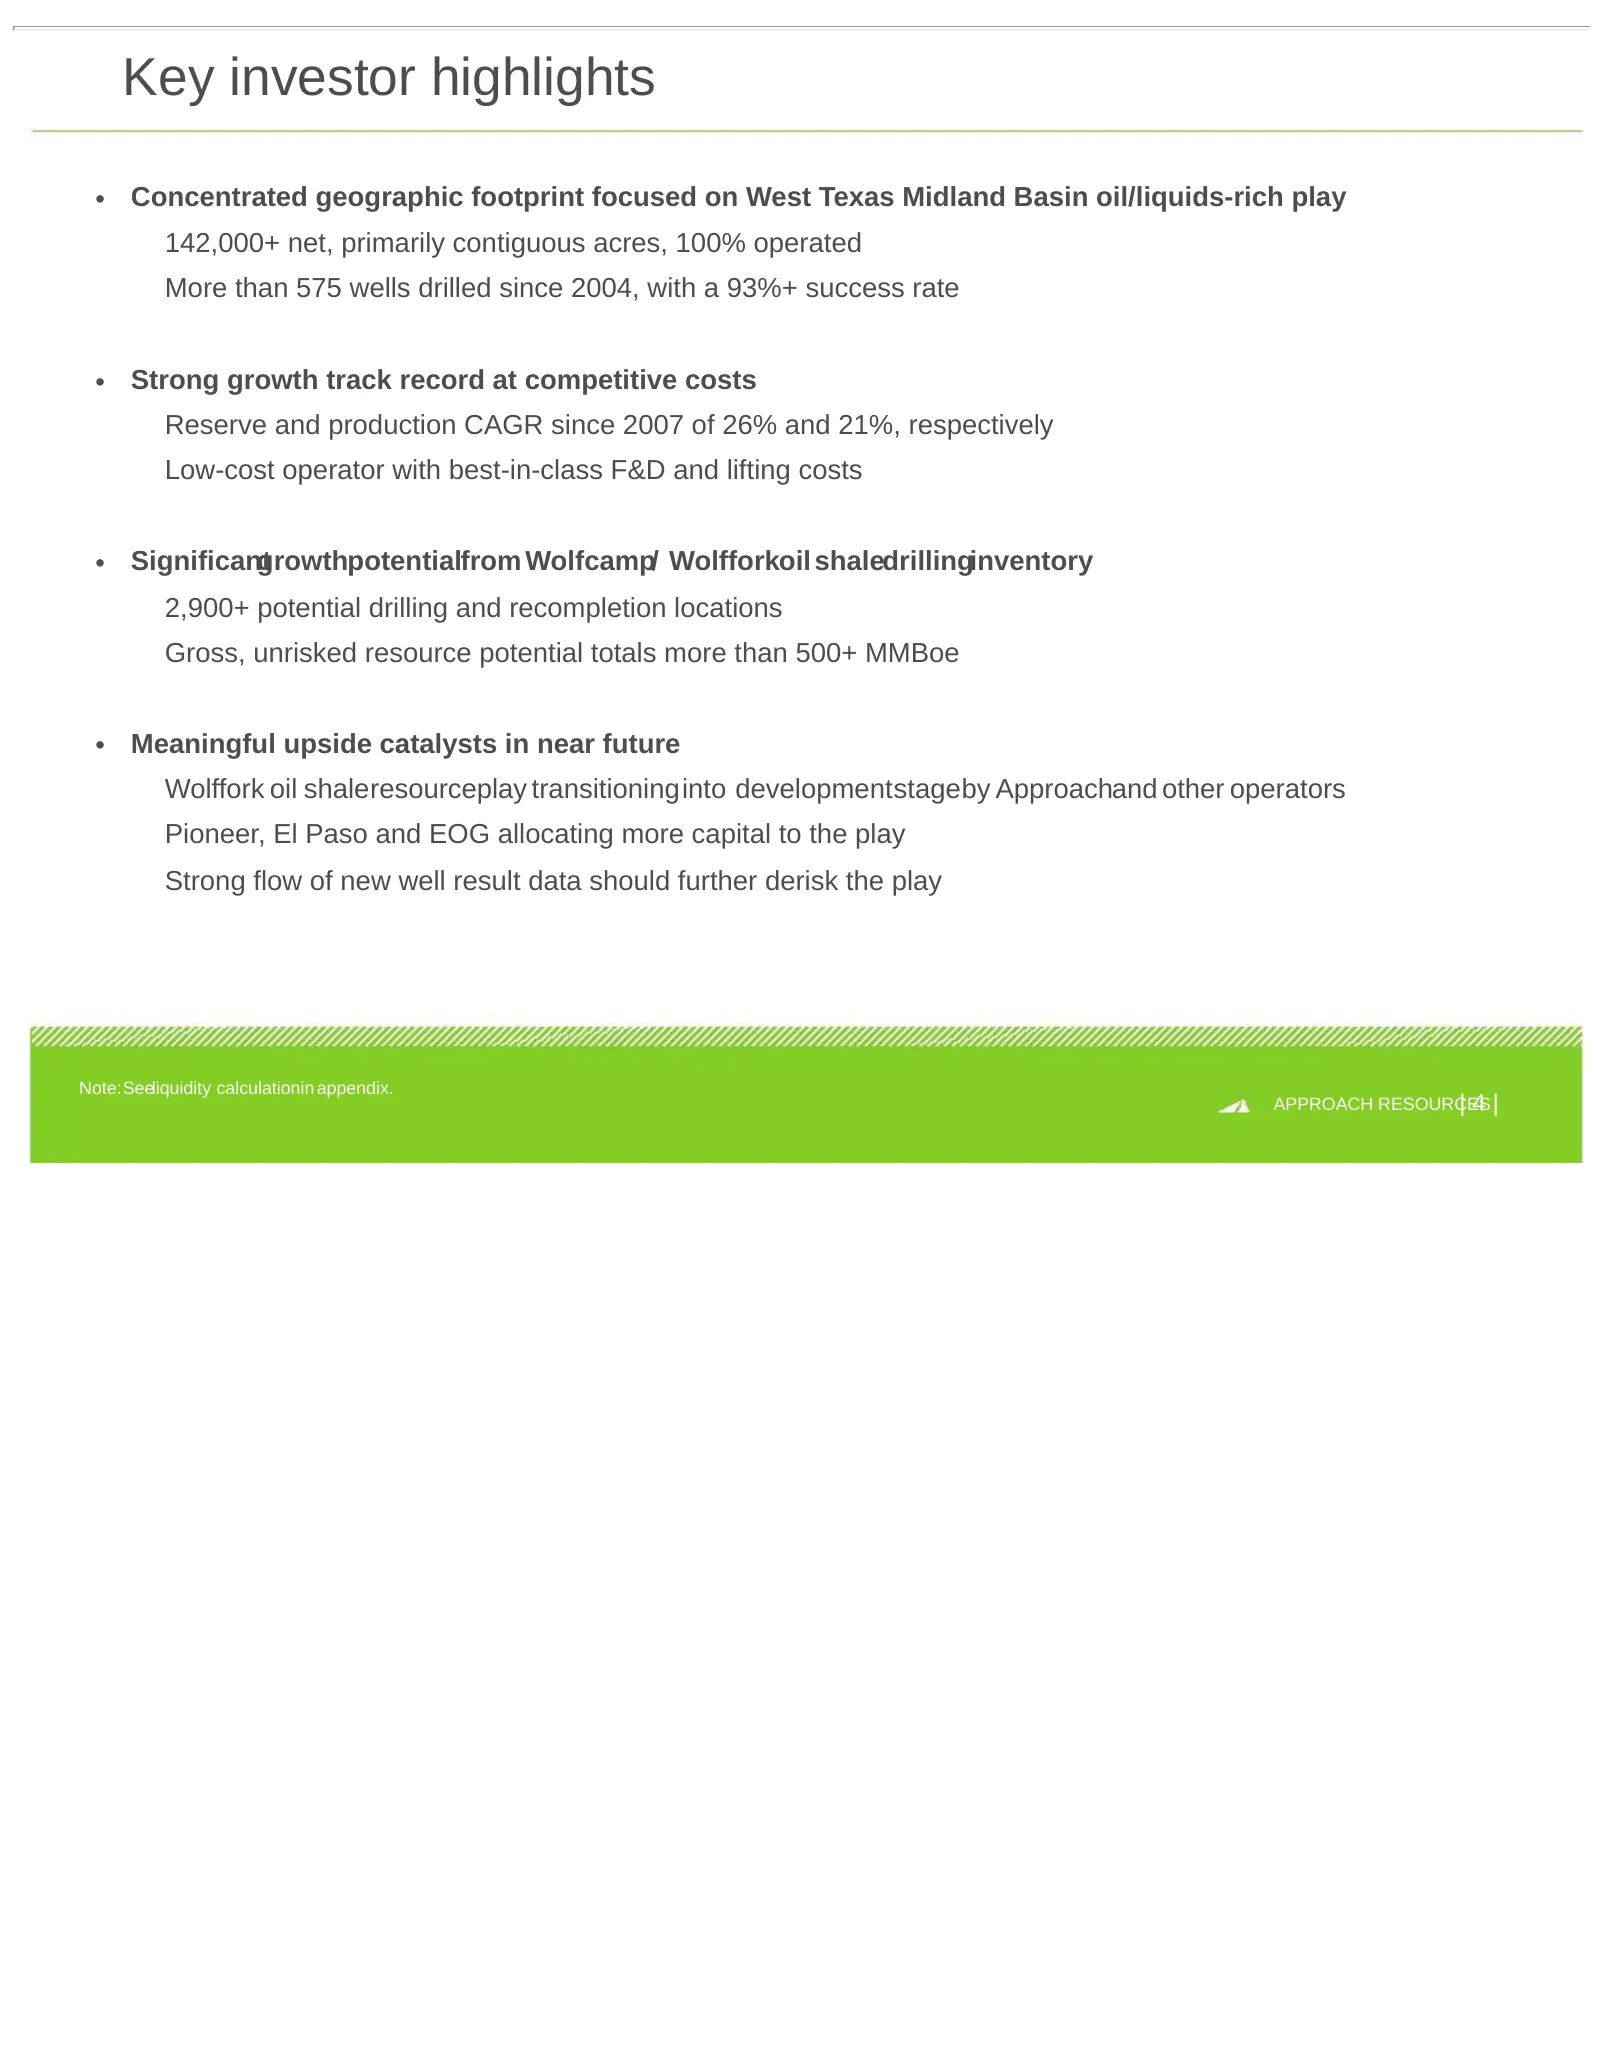
Slide 4: Key investor highlights
Key investor highlights • Concentrated geographic footprint focused on West Texas Midland Basin oil/liquids-rich play 142,000+ net, primarily contiguous acres, 100% operated More than 575 wells drilled since 2004, with a 93%+ success rate • Strong growth track record at competitive costs Reserve and
Slide 5: Strong Track Record of Reserve and Production Growth
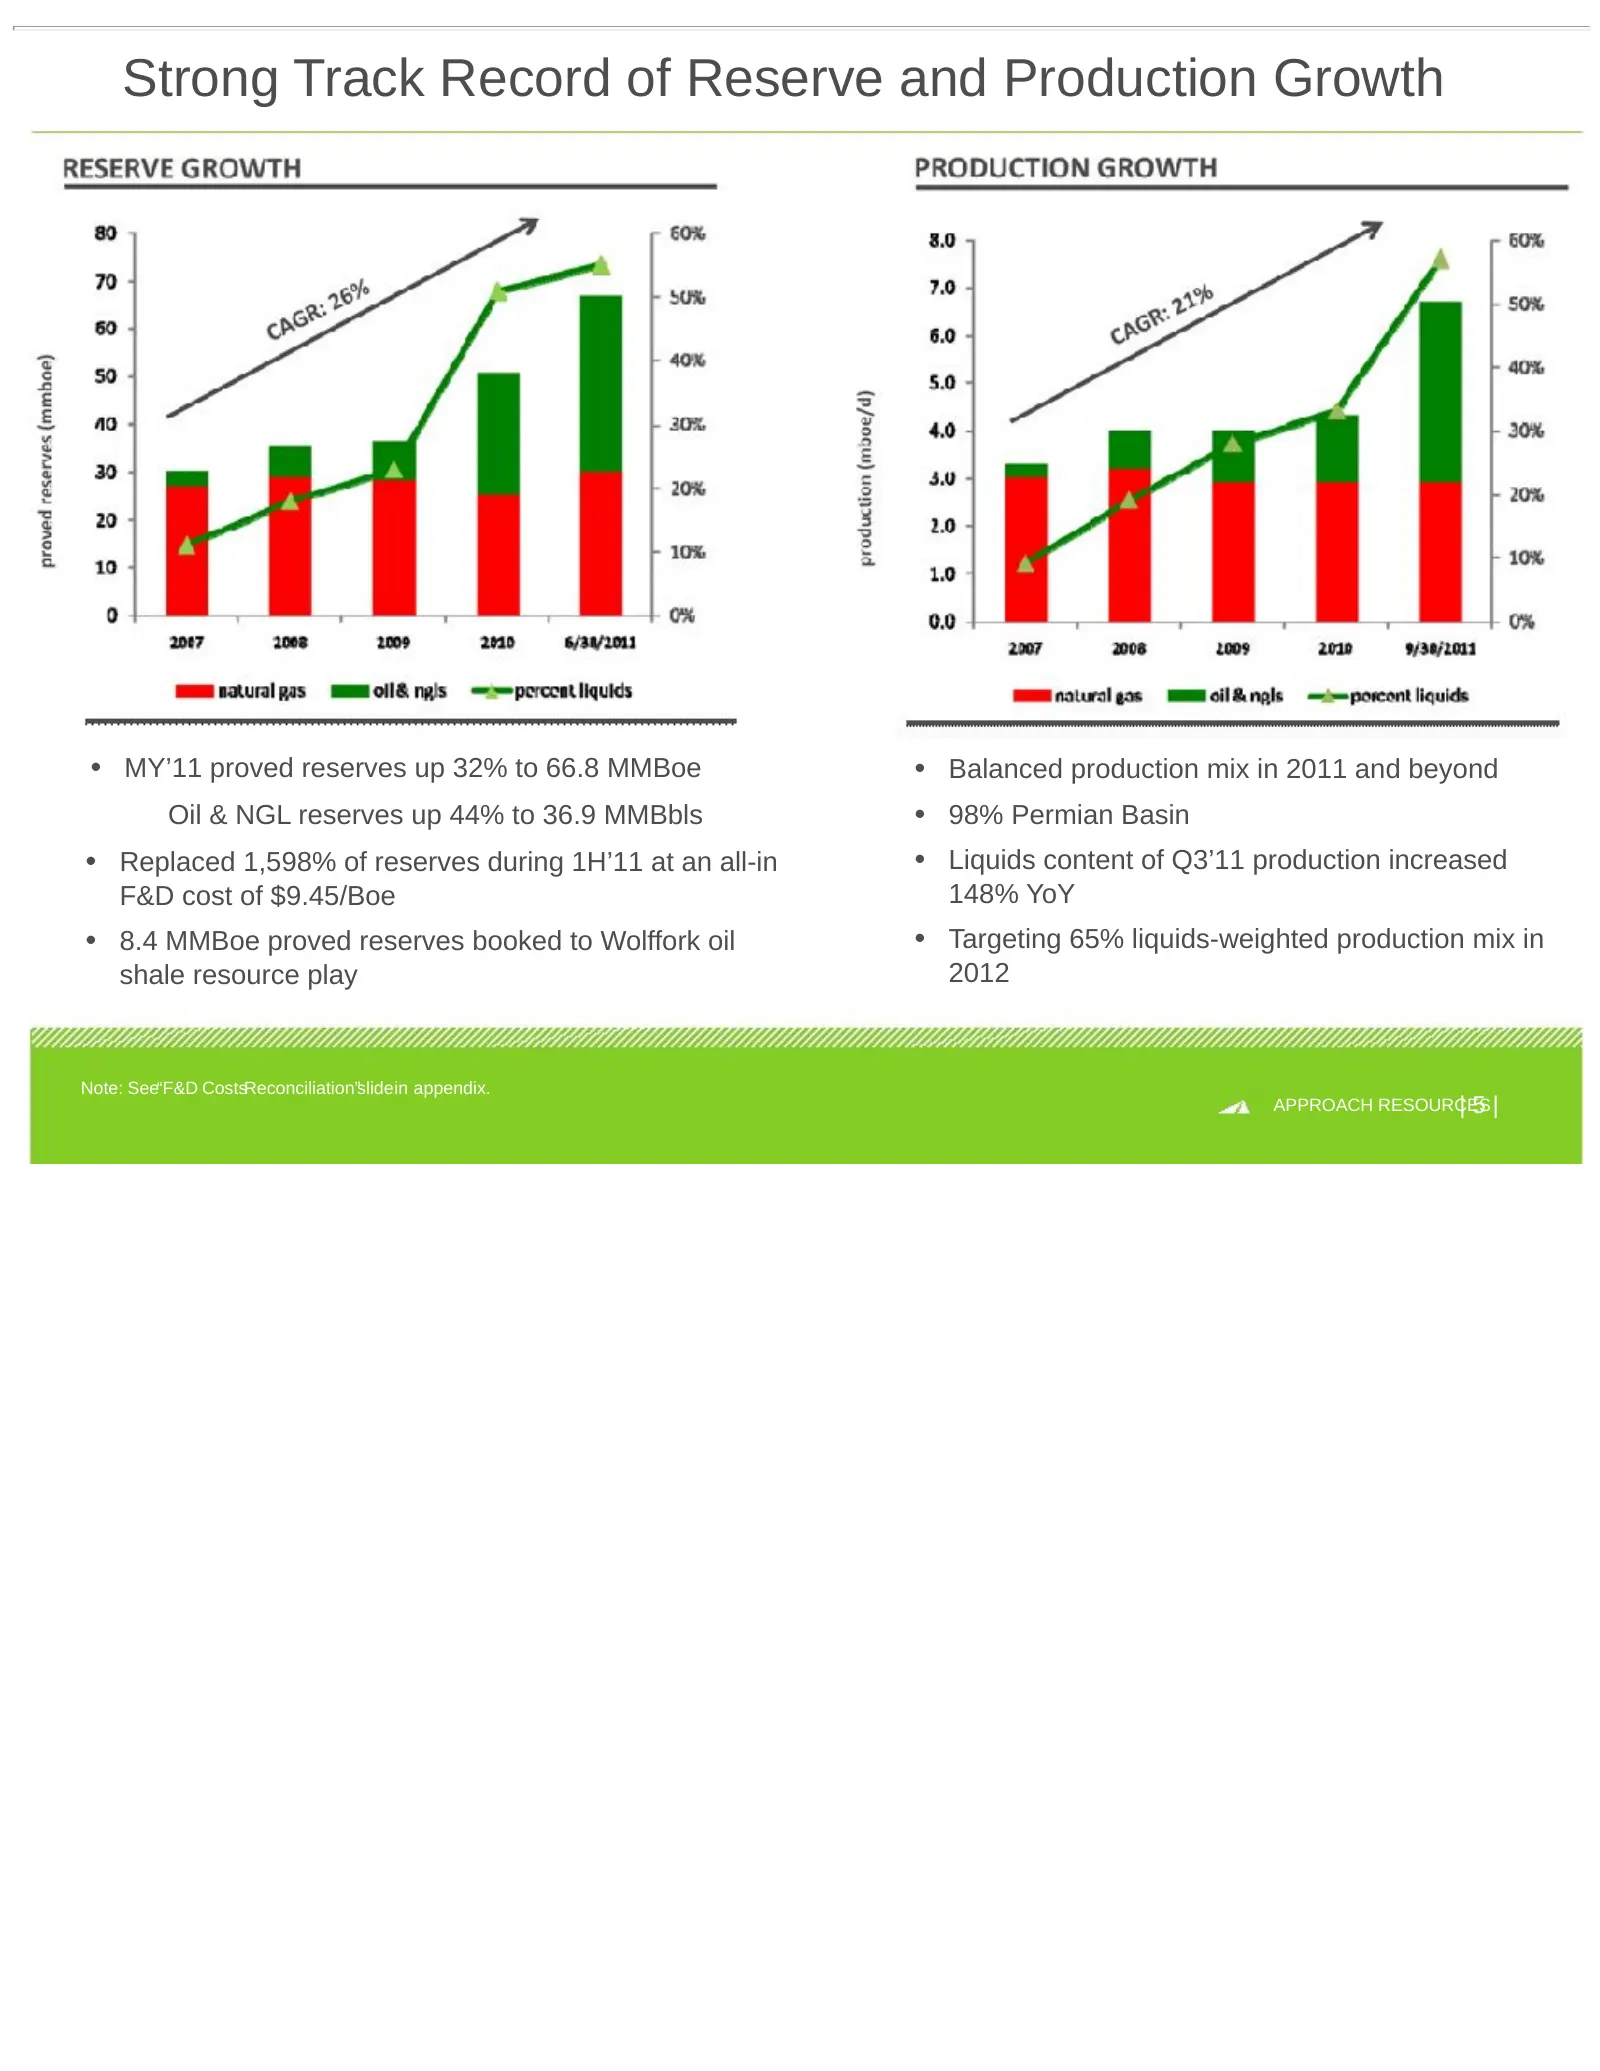
Strong Track Record of Reserve and Production Growth • MY’11 proved reserves up 32% to 66.8 MMBoe • Balanced production mix in 2011 and beyond Oil & NGL reserves up 44% to 36.9 MMBbls • 98% Permian Basin • Replaced 1,598% of reserves during 1H’11 at an all-in • Liquids content of Q3’11 production in
Slide 6: Low-Cost Operator Across Crude-Oil Weighted Peers
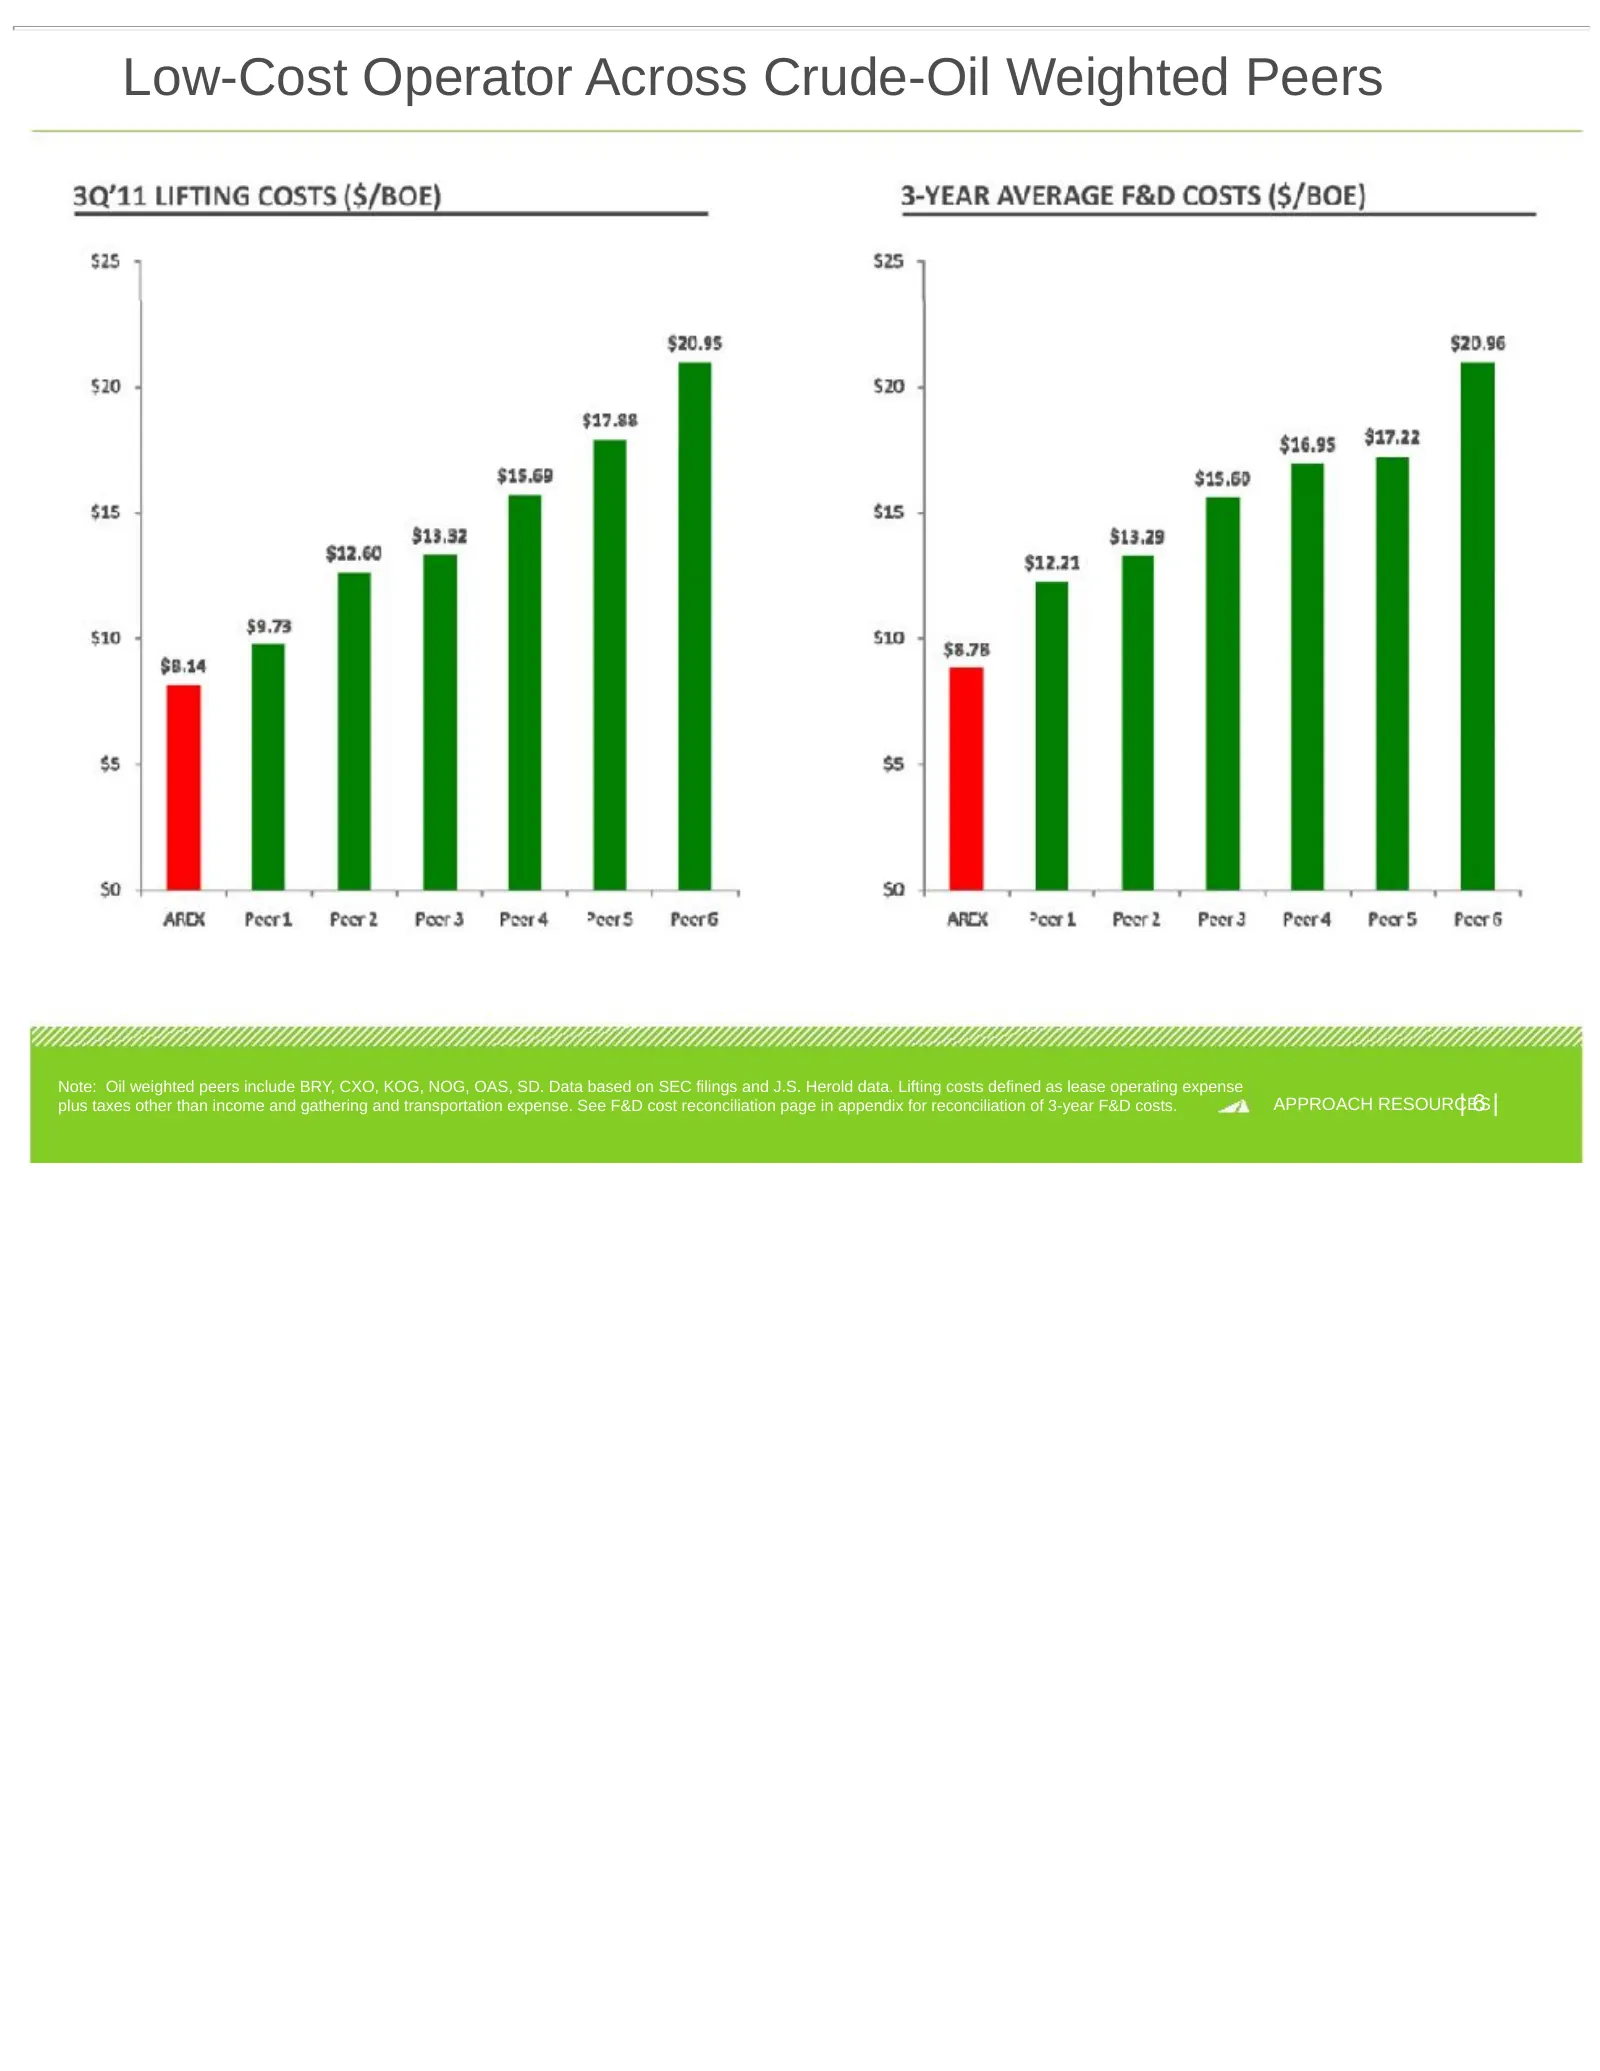
Low-Cost Operator Across Crude-Oil Weighted Peers Note: Oil weighted peers include BRY, CXO, KOG, NOG, OAS, SD. Data based on SEC filings and J.S. Herold data. Lifting costs defined as lease operating expense plus taxes other than income and gathering and transportation expense. See F&D cost reconci
Slide 7: AREX Has Delivered On Its Objectives Since Last Year
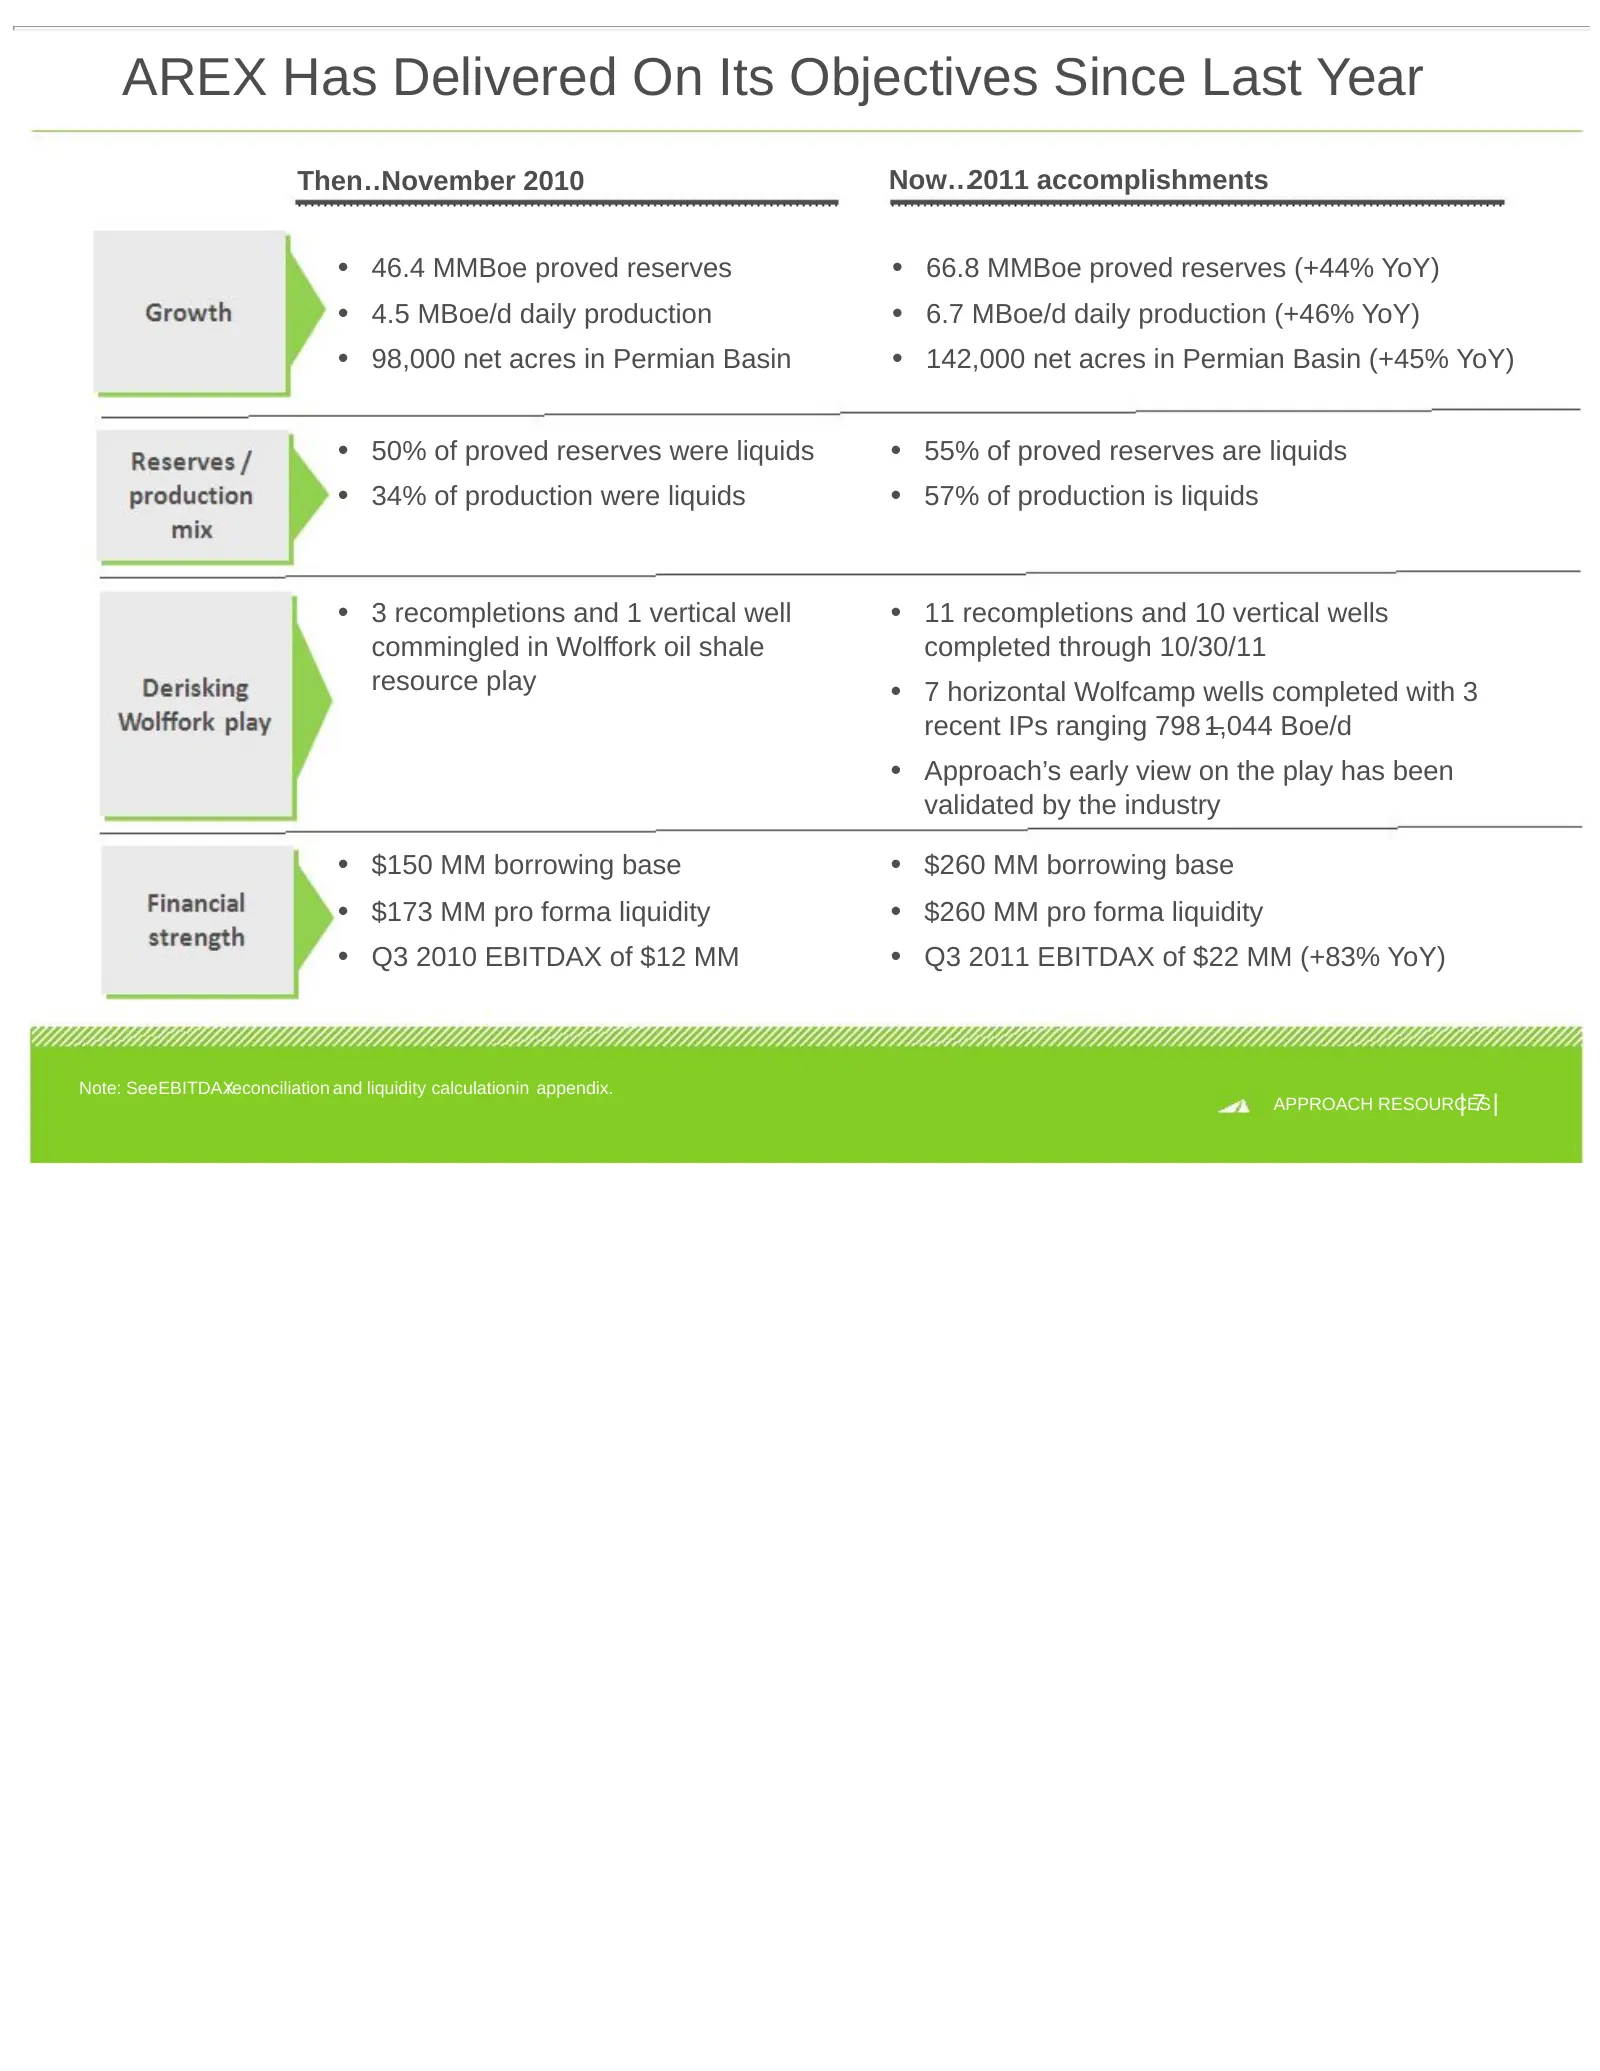
AREX Has Delivered On Its Objectives Since Last Year Then…November 2010 Now…2011 accomplishments • 46.4 MMBoe proved reserves • 66.8 MMBoe proved reserves (+44% YoY) • 4.5 MBoe/d daily production • 6.7 MBoe/d daily production (+46% YoY) • 98,000 net acres in Permian Basin • 142,000 net acres in Perm
Slide 8: AREX Acreage Position Favorably Located in the Permian Basin
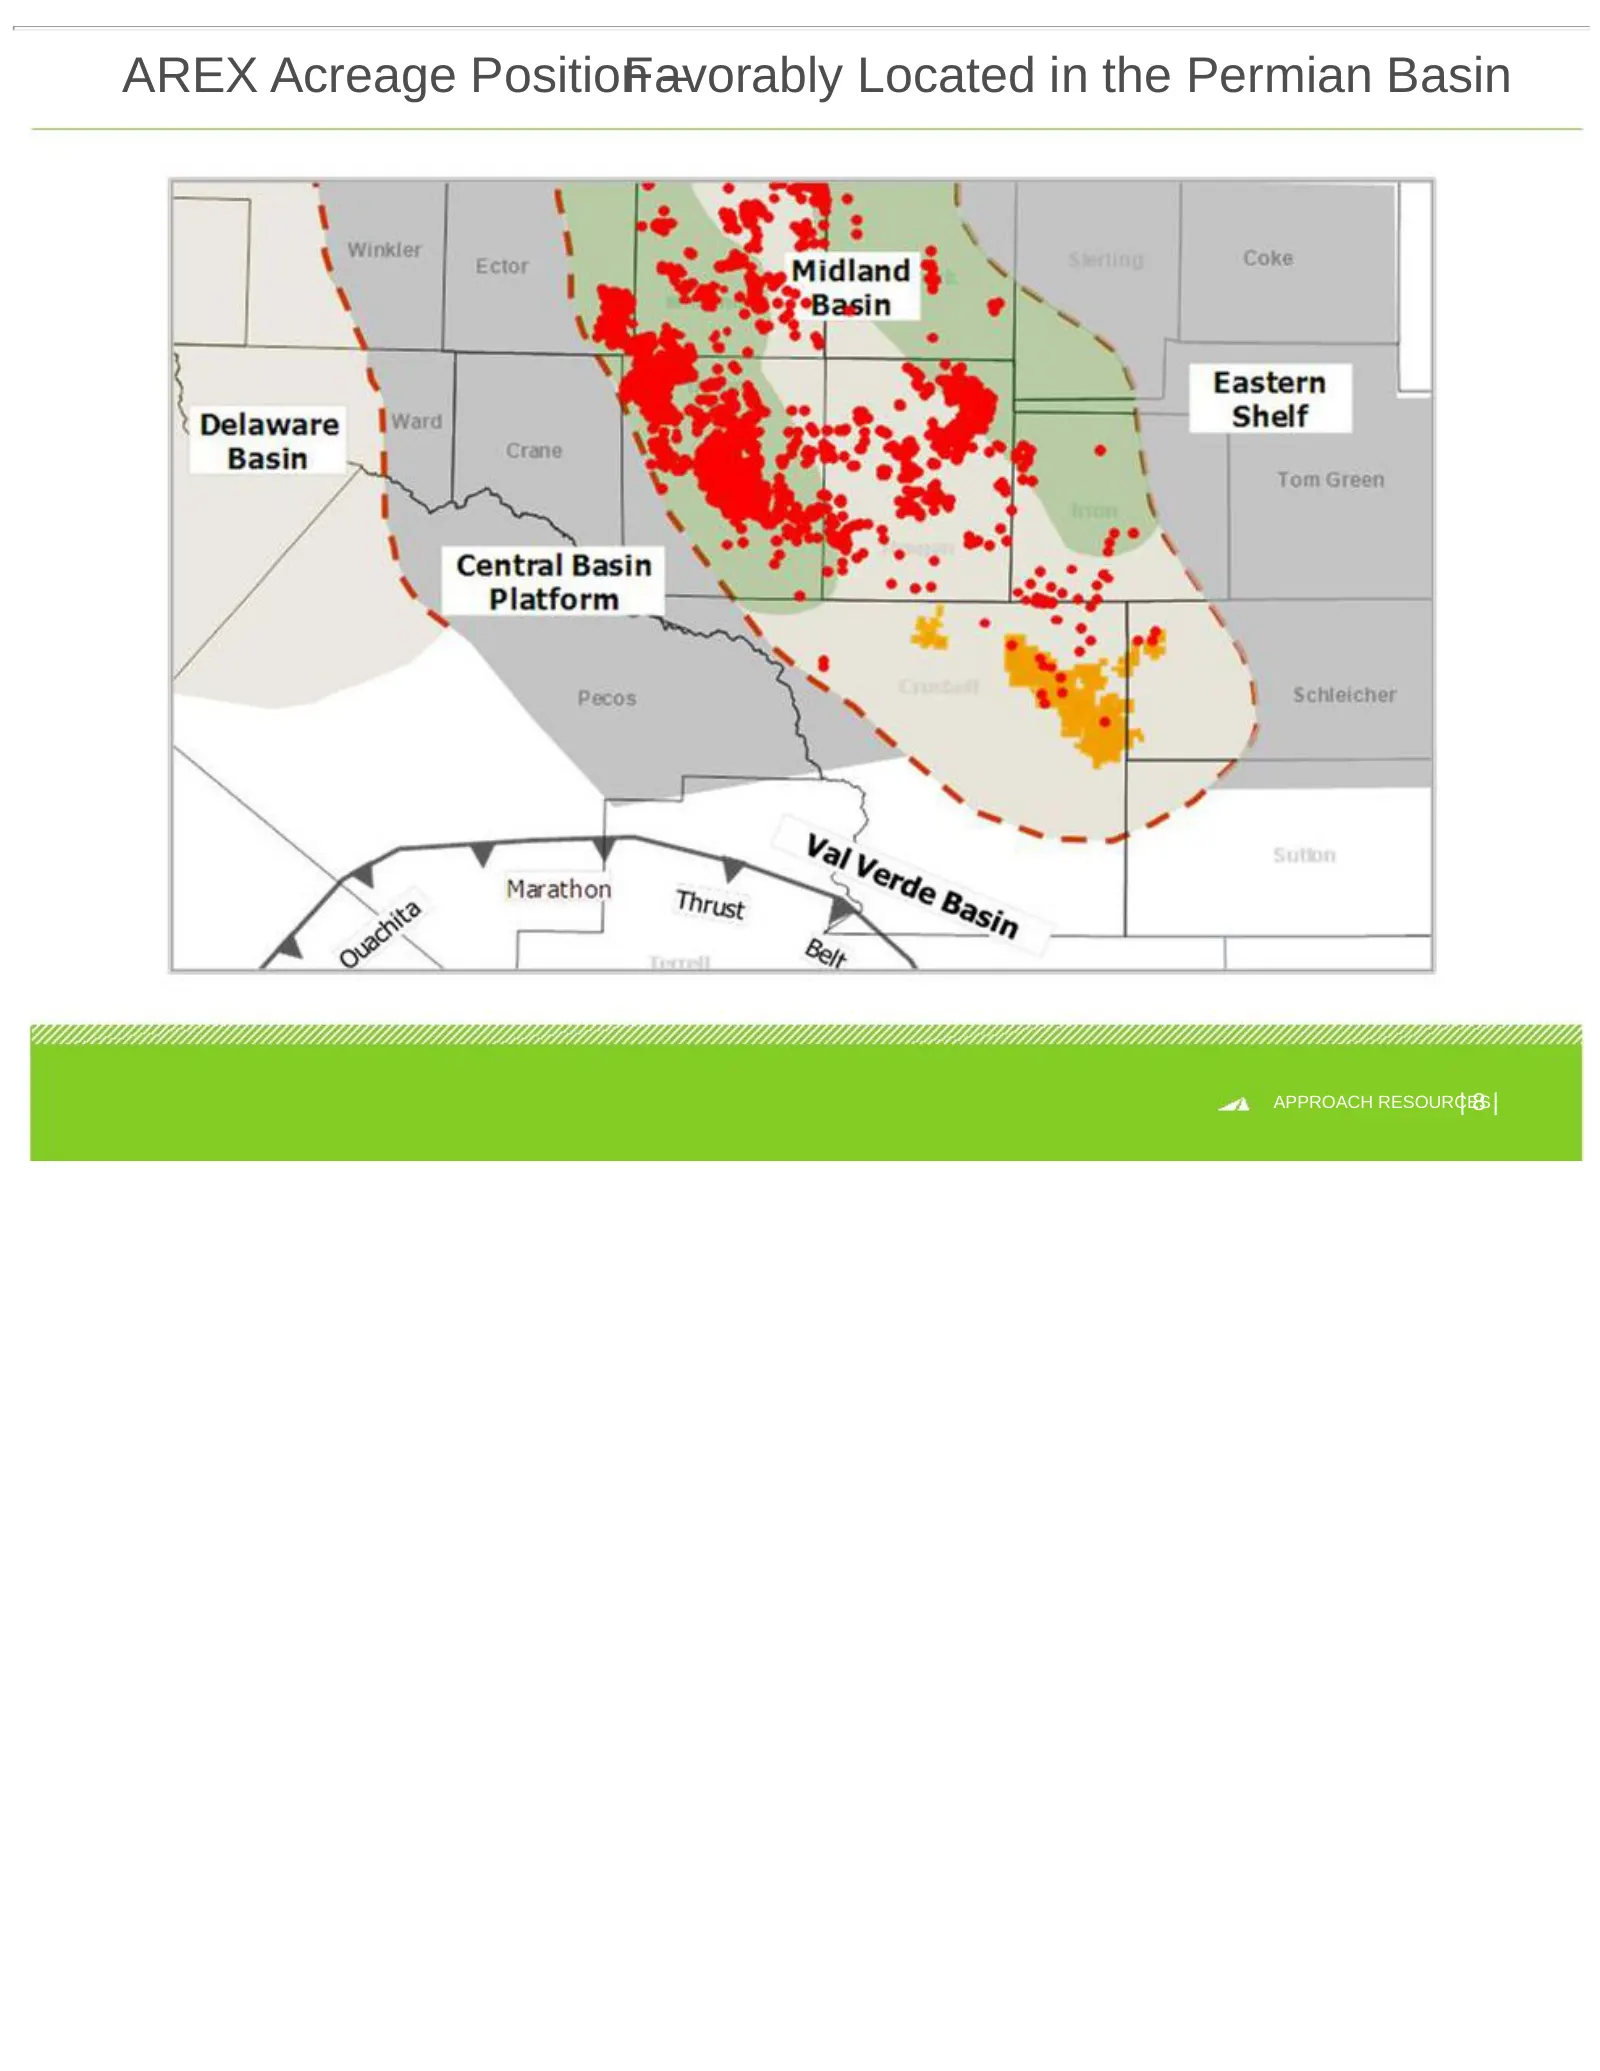
AREX Acreage Position Favorably – Located in the Permian Basin |8| APPROACH RESOURCES
Slide 9: AREX Wolffork Oil Shale Resource Play
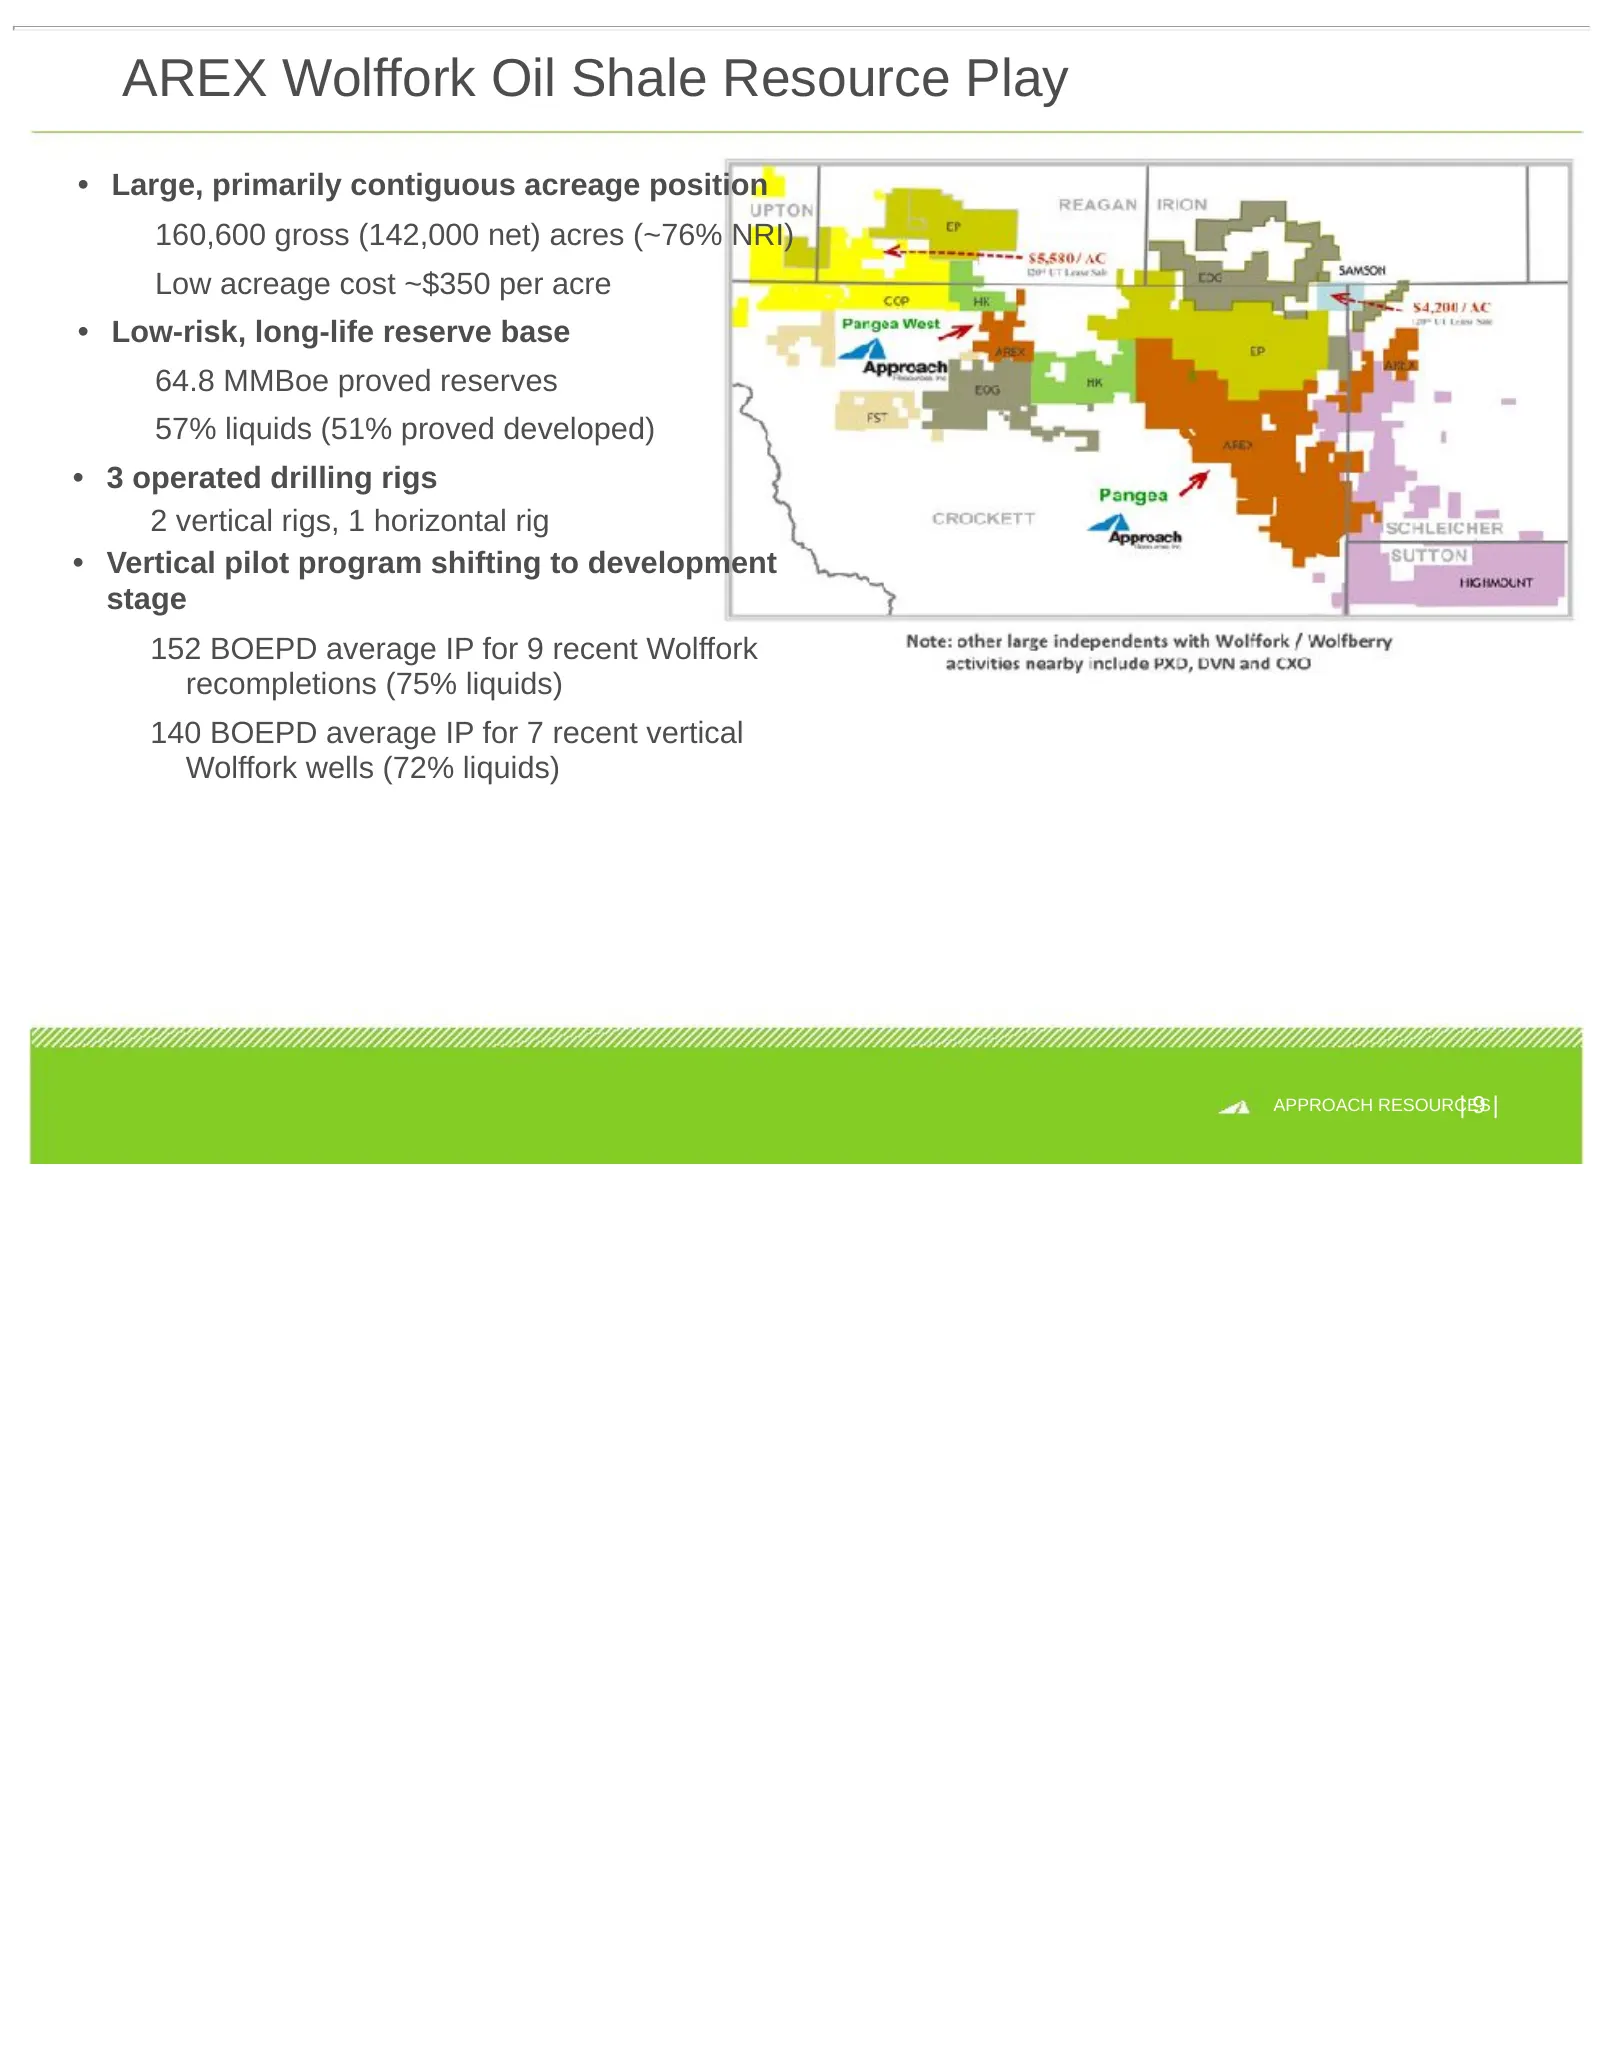
AREX Wolffork Oil Shale Resource Play • Large, primarily contiguous acreage position 160,600 gross (142,000 net) acres (~76% NRI) Low acreage cost ~$350 per acre • Low-risk, long-life reserve base 64.8 MMBoe proved reserves 57% liquids (51% proved developed) • 3 operated drilling rigs 2 vertical rig
Slide 10: AREX Wolffork Oil Shale Resource Play Activity Map
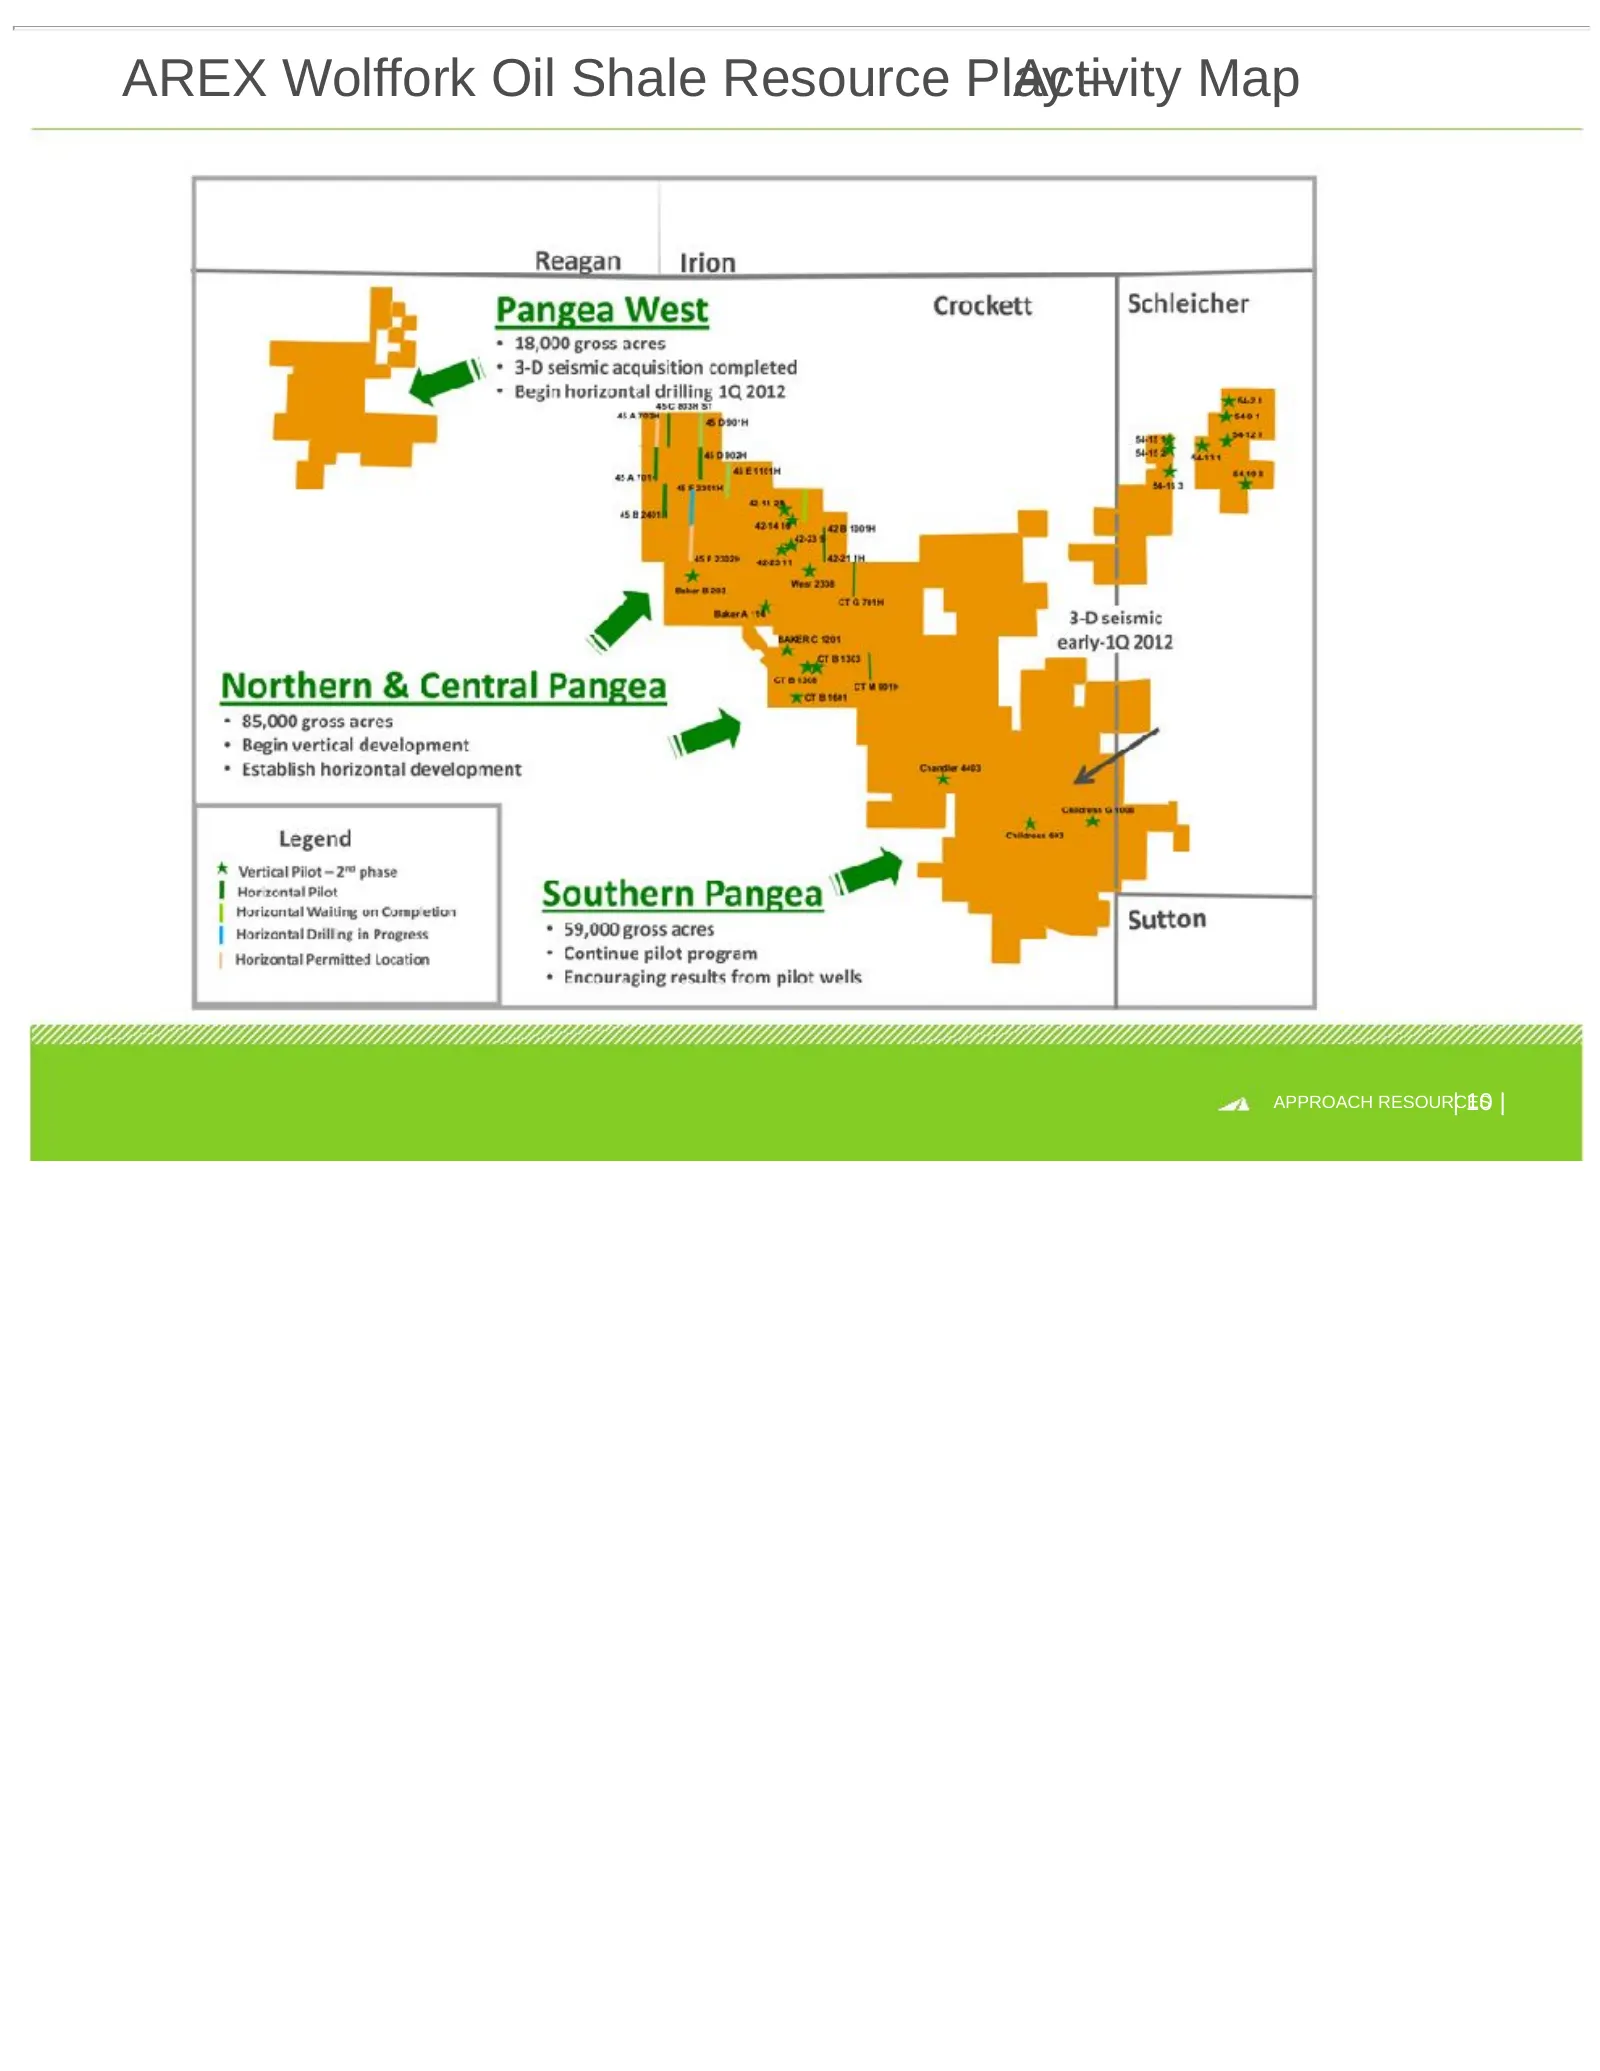
AREX Wolffork Oil Shale Resource Play Activity – Map | 10 | APPROACH RESOURCES
Slide 11: Wolfcamp Shale Name Convention Southern Midland Basin
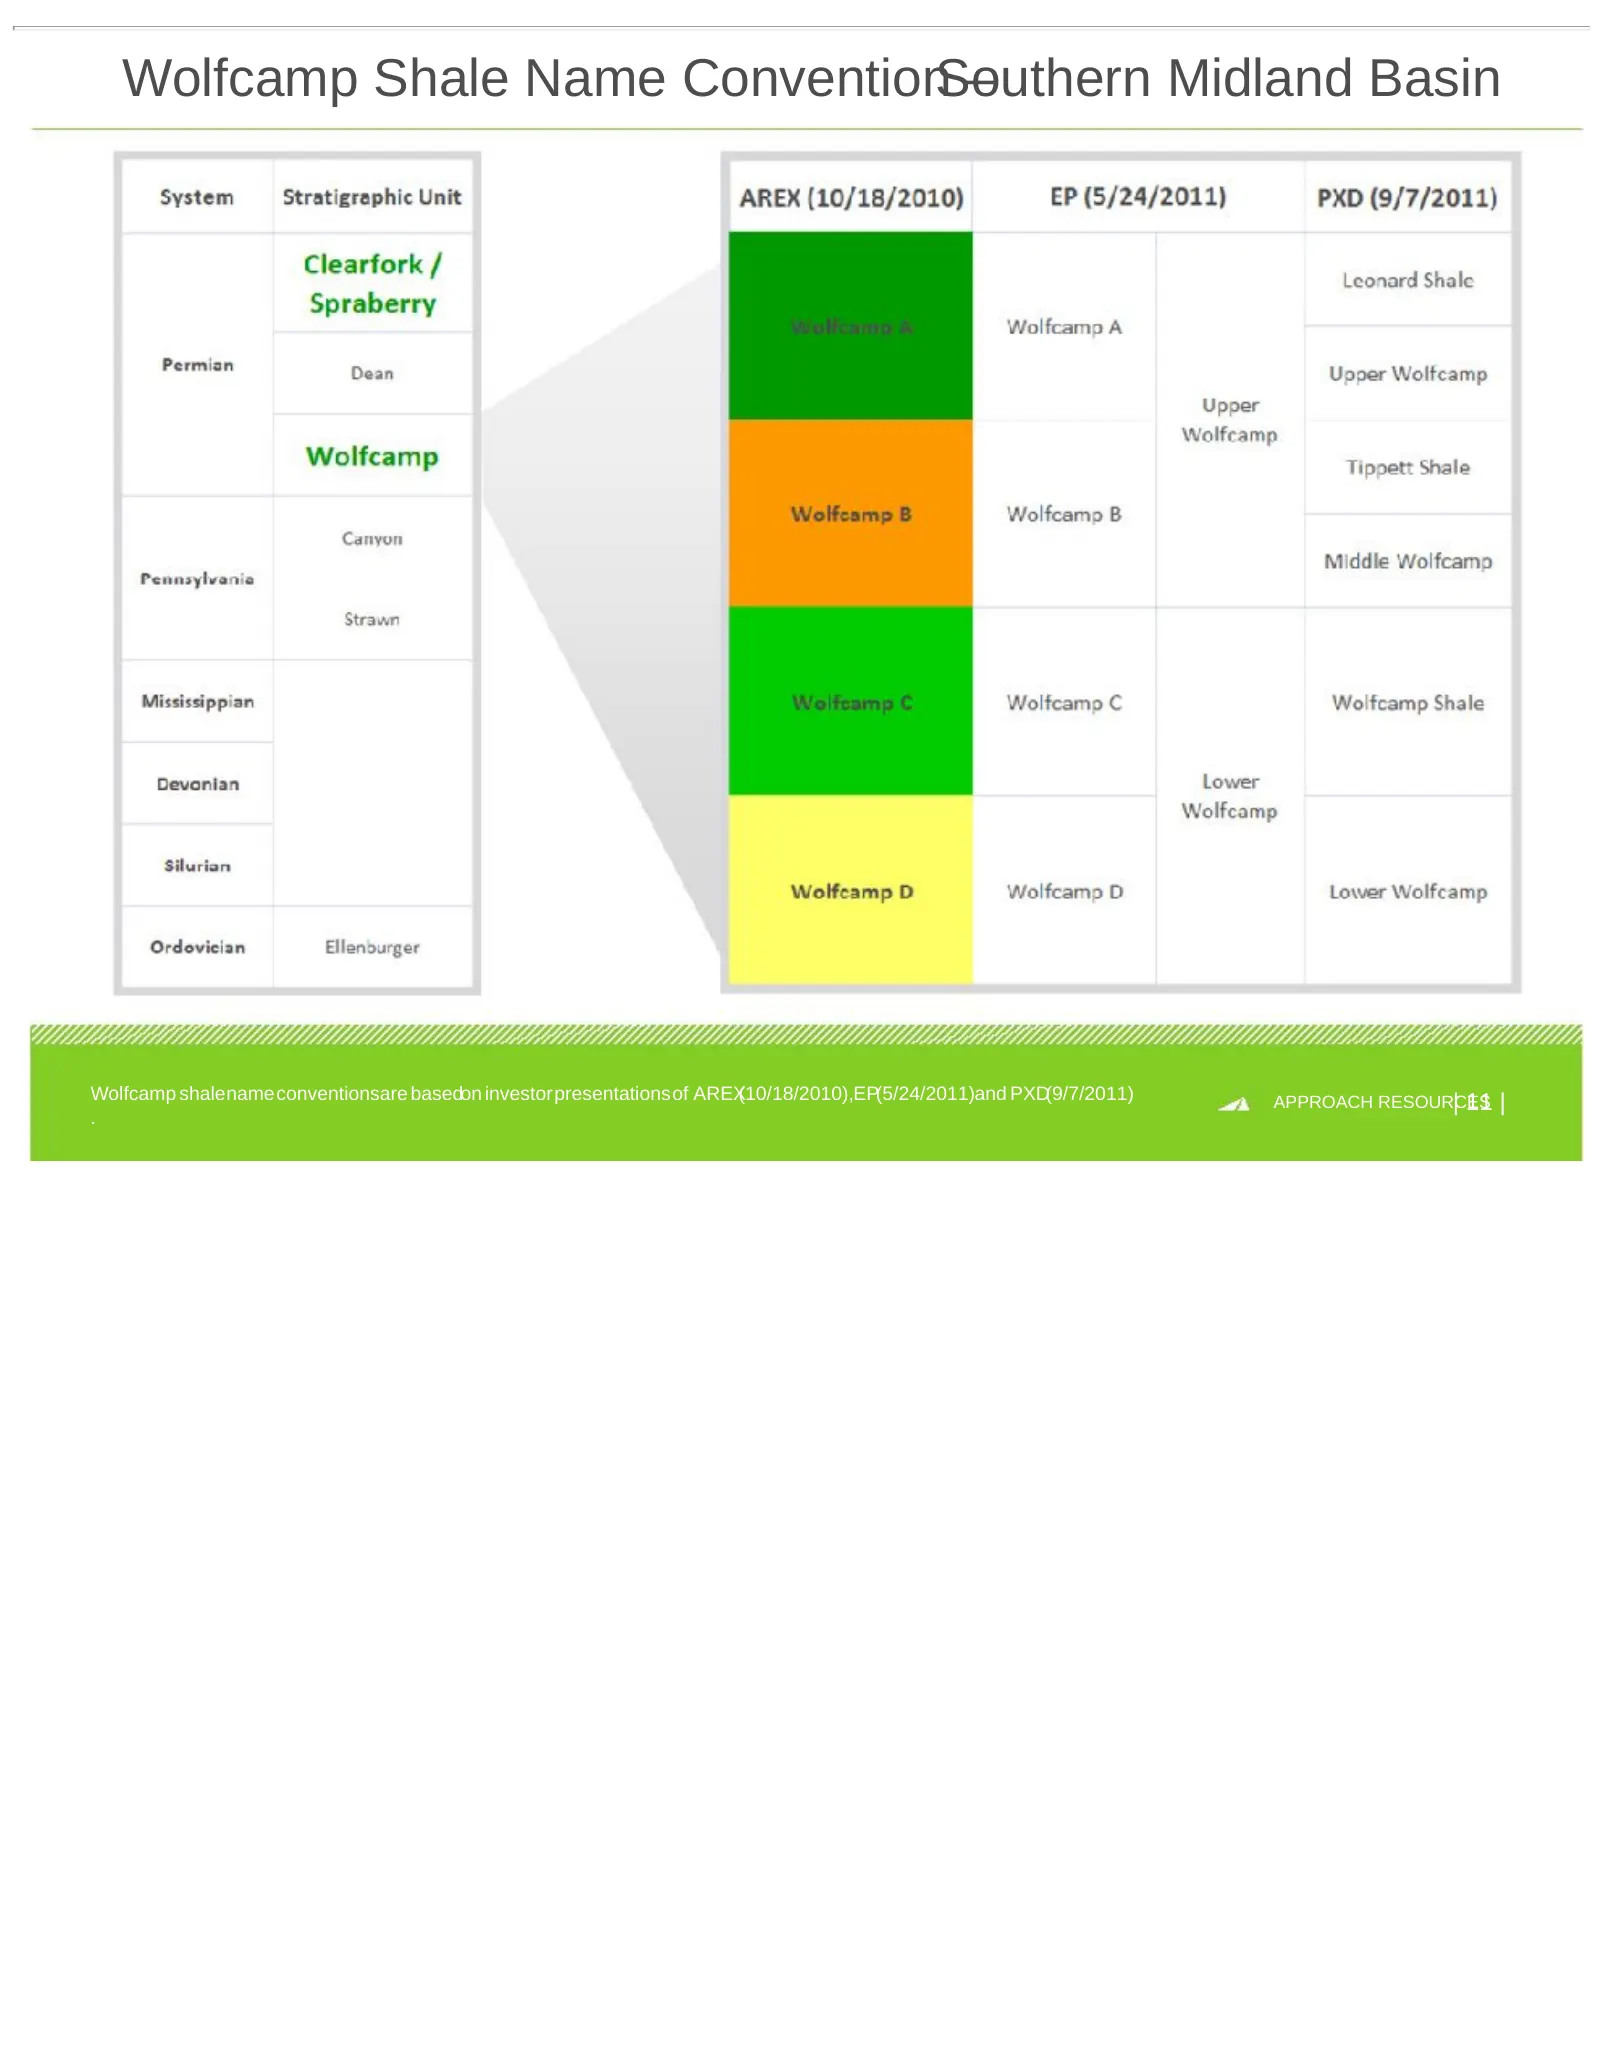
Wolfcamp Shale Name ConventionSouthern – Midland Basin Wolfcamp shalenameconventionsare basedon investorpresentationsof AREX(10/18/2010),EP(5/24/2011)and PXD(9/7/2011) | 11 | APPROACH RESOURCES .
Slide 12: Wolffork Hydrocarbon Column Over 2,500' Thick
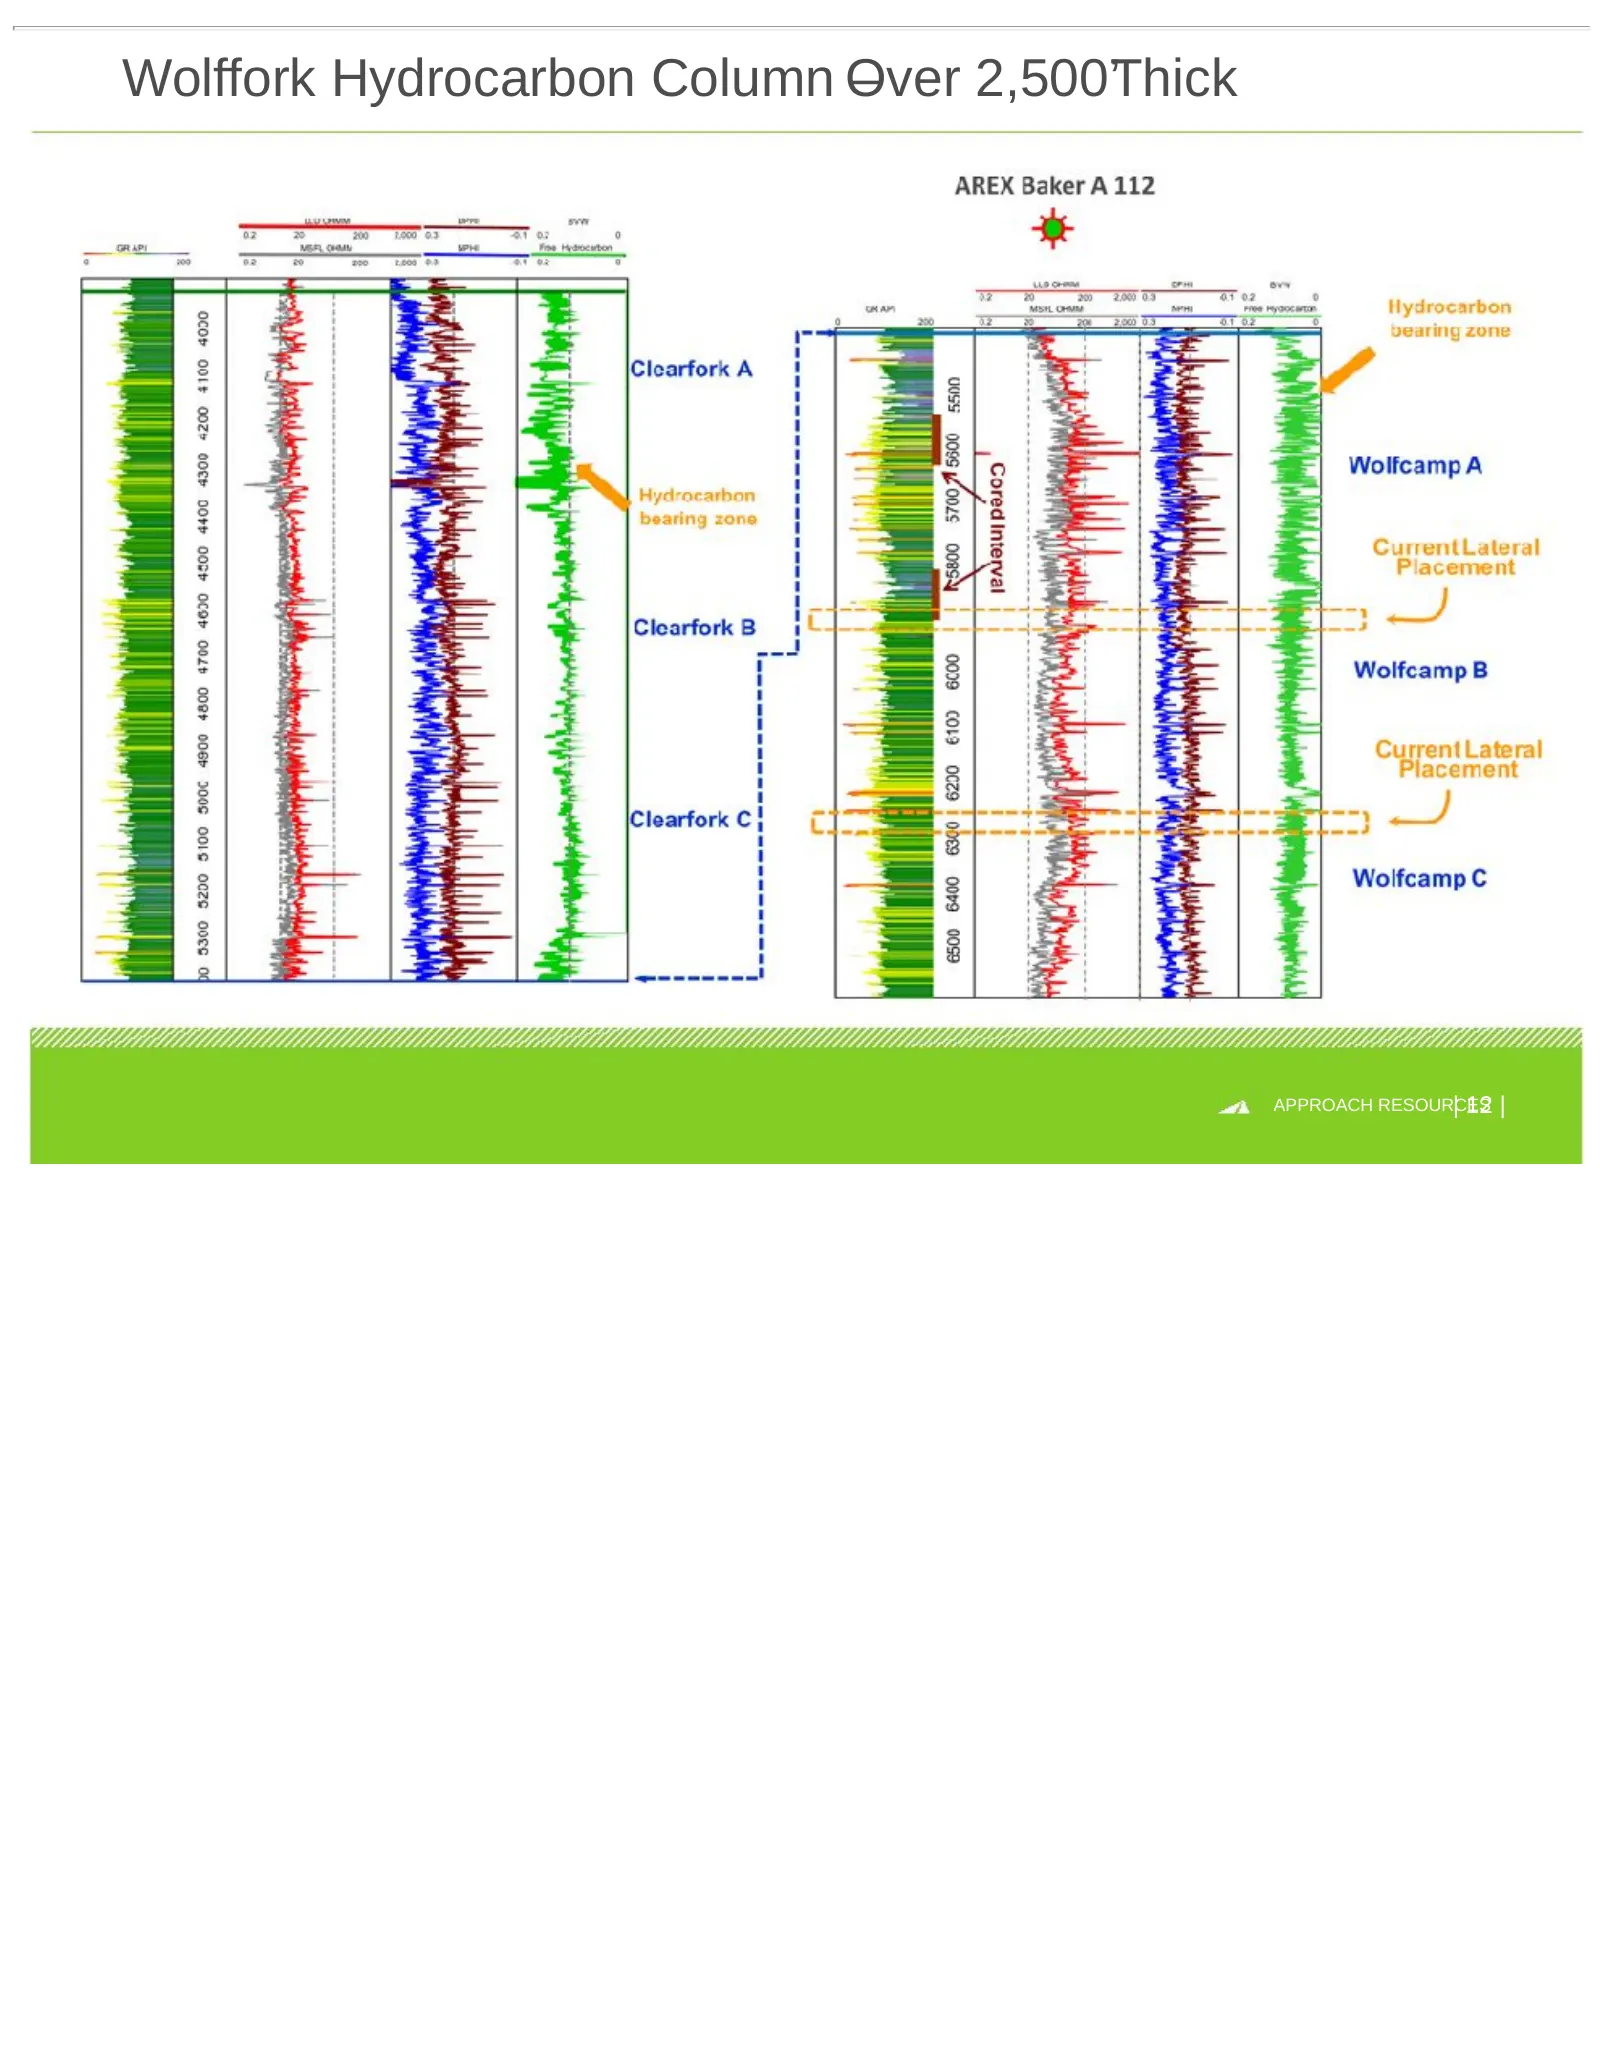
Wolffork Hydrocarbon Column O – ver 2,500’Thick | 12 | APPROACH RESOURCES
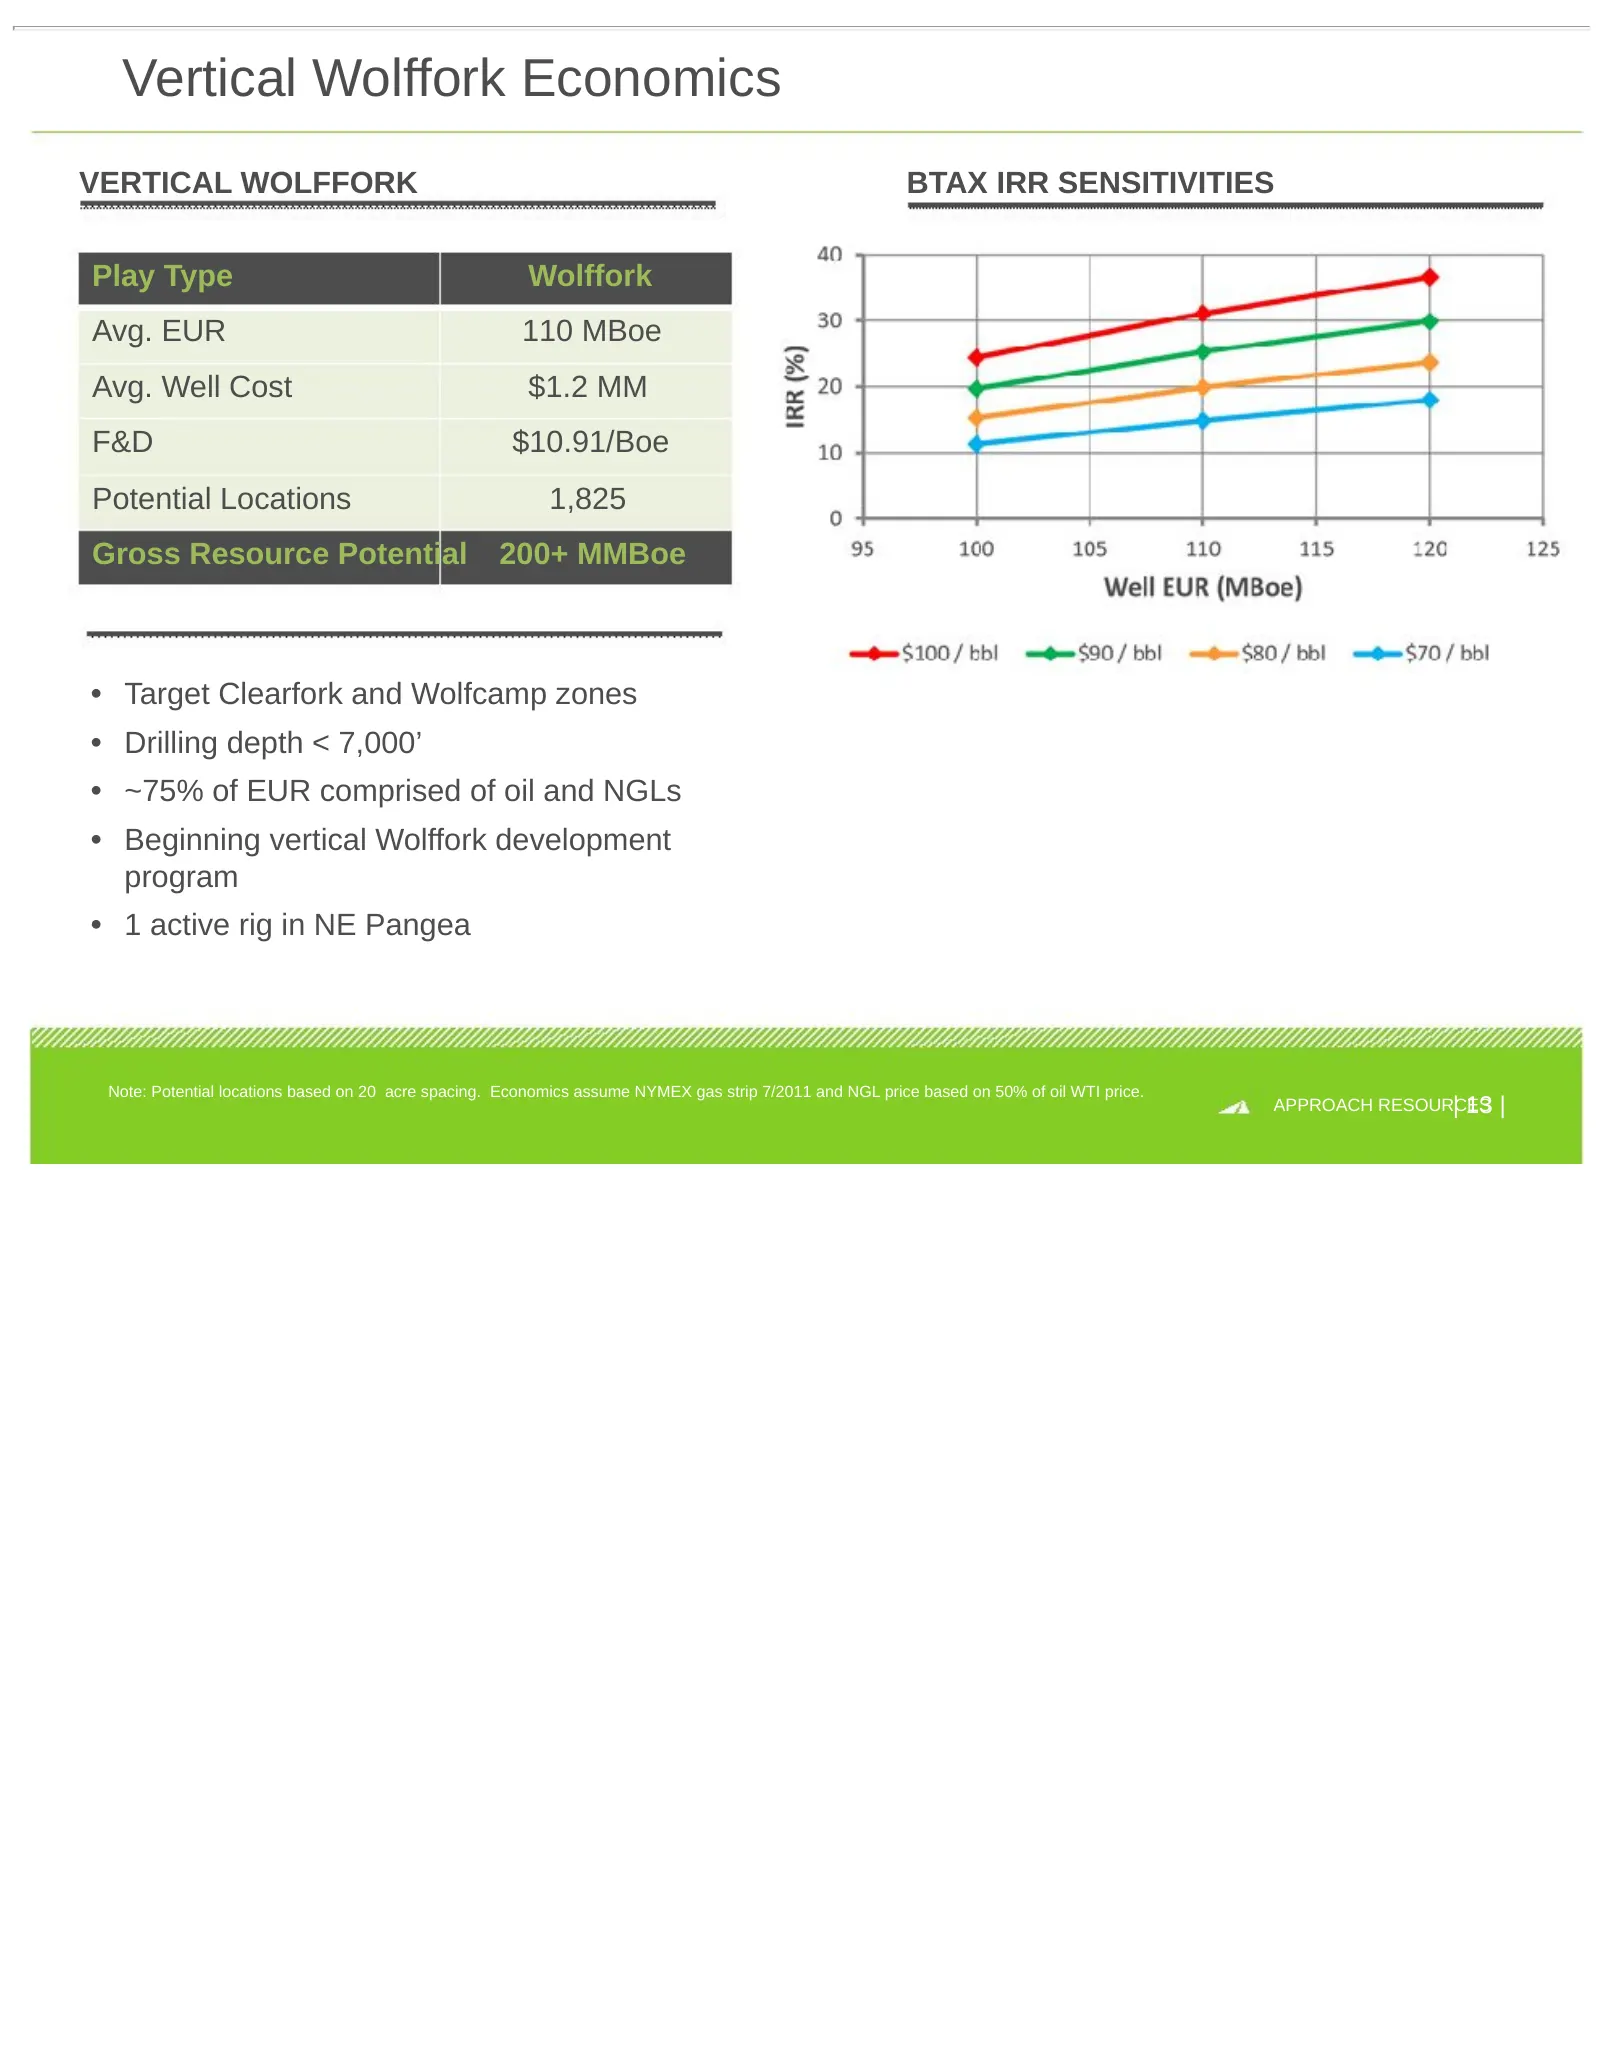
Slide 13: Vertical Wolffork Economics
Vertical Wolffork Economics VERTICAL WOLFFORK BTAX IRR SENSITIVITIES Play Type Wolffork Avg. EUR 110 MBoe Avg. Well Cost $1.2 MM F&D $10.91/Boe Potential Locations 1,825 Gross Resource Potential 200+ MMBoe • Target Clearfork and Wolfcamp zones • Drilling depth < 7,000’ • ~75% of EUR comprised of oil
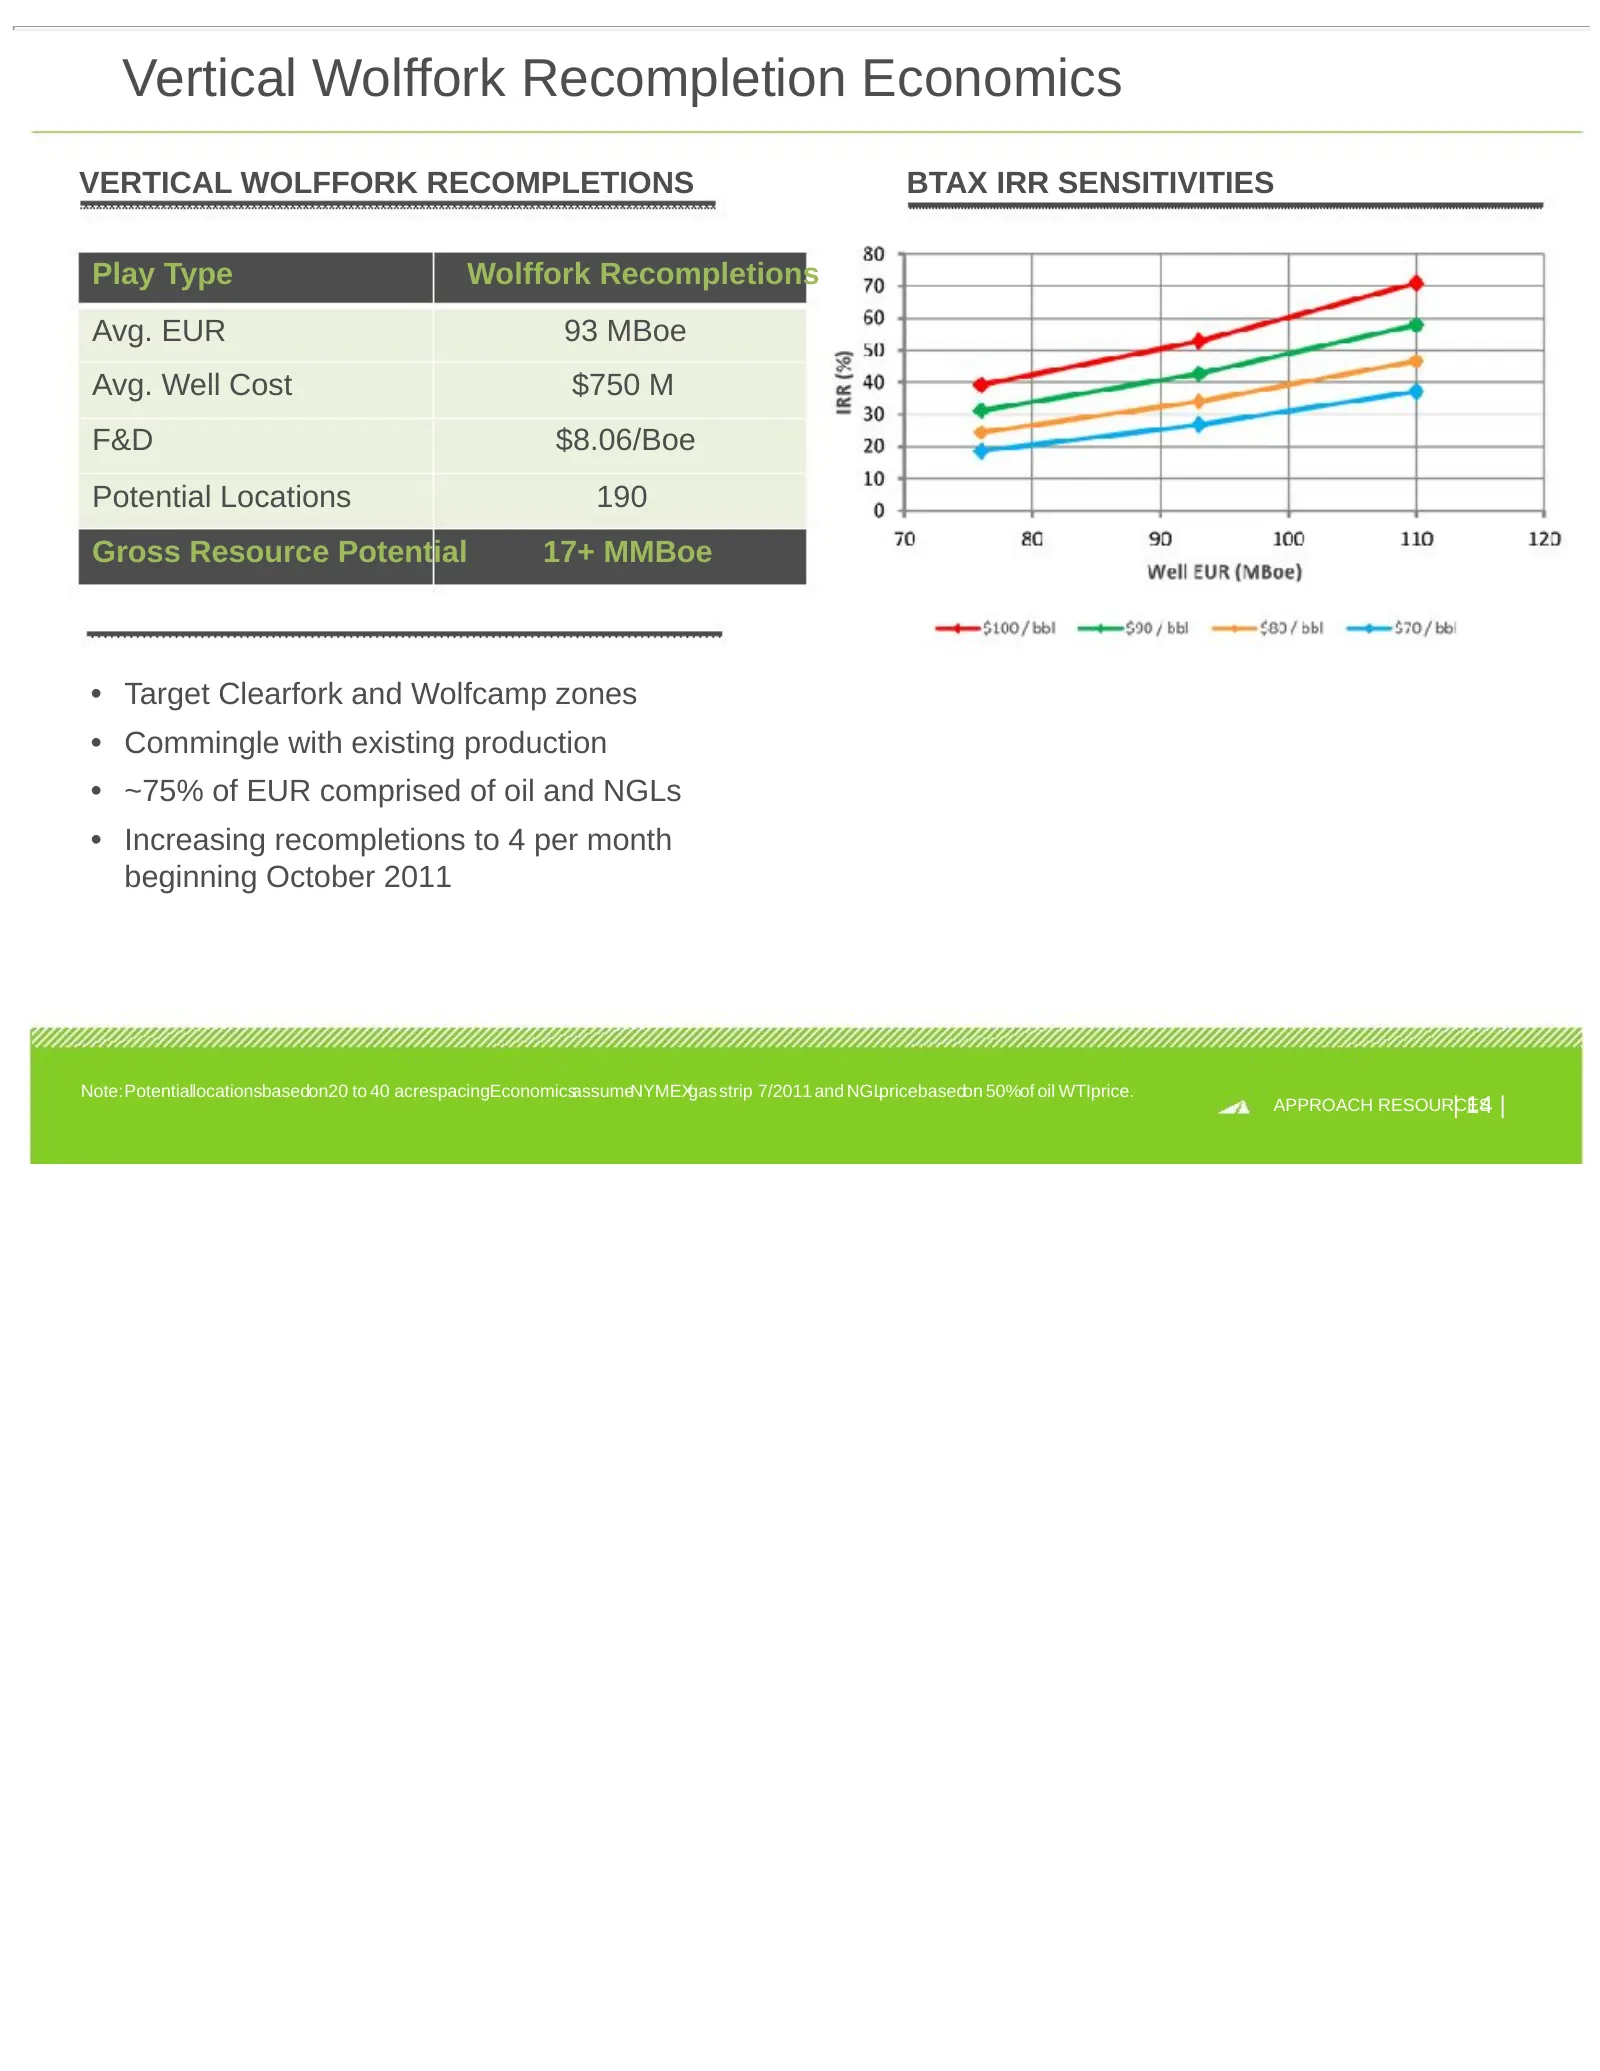
Slide 14: Vertical Wolffork Recompletion Economics
Vertical Wolffork Recompletion Economics VERTICAL WOLFFORK RECOMPLETIONS BTAX IRR SENSITIVITIES Play Type Wolffork Recompletions Avg. EUR 93 MBoe Avg. Well Cost $750 M F&D $8.06/Boe Potential Locations 190 Gross Resource Potential 17+ MMBoe • Target Clearfork and Wolfcamp zones • Commingle with exis
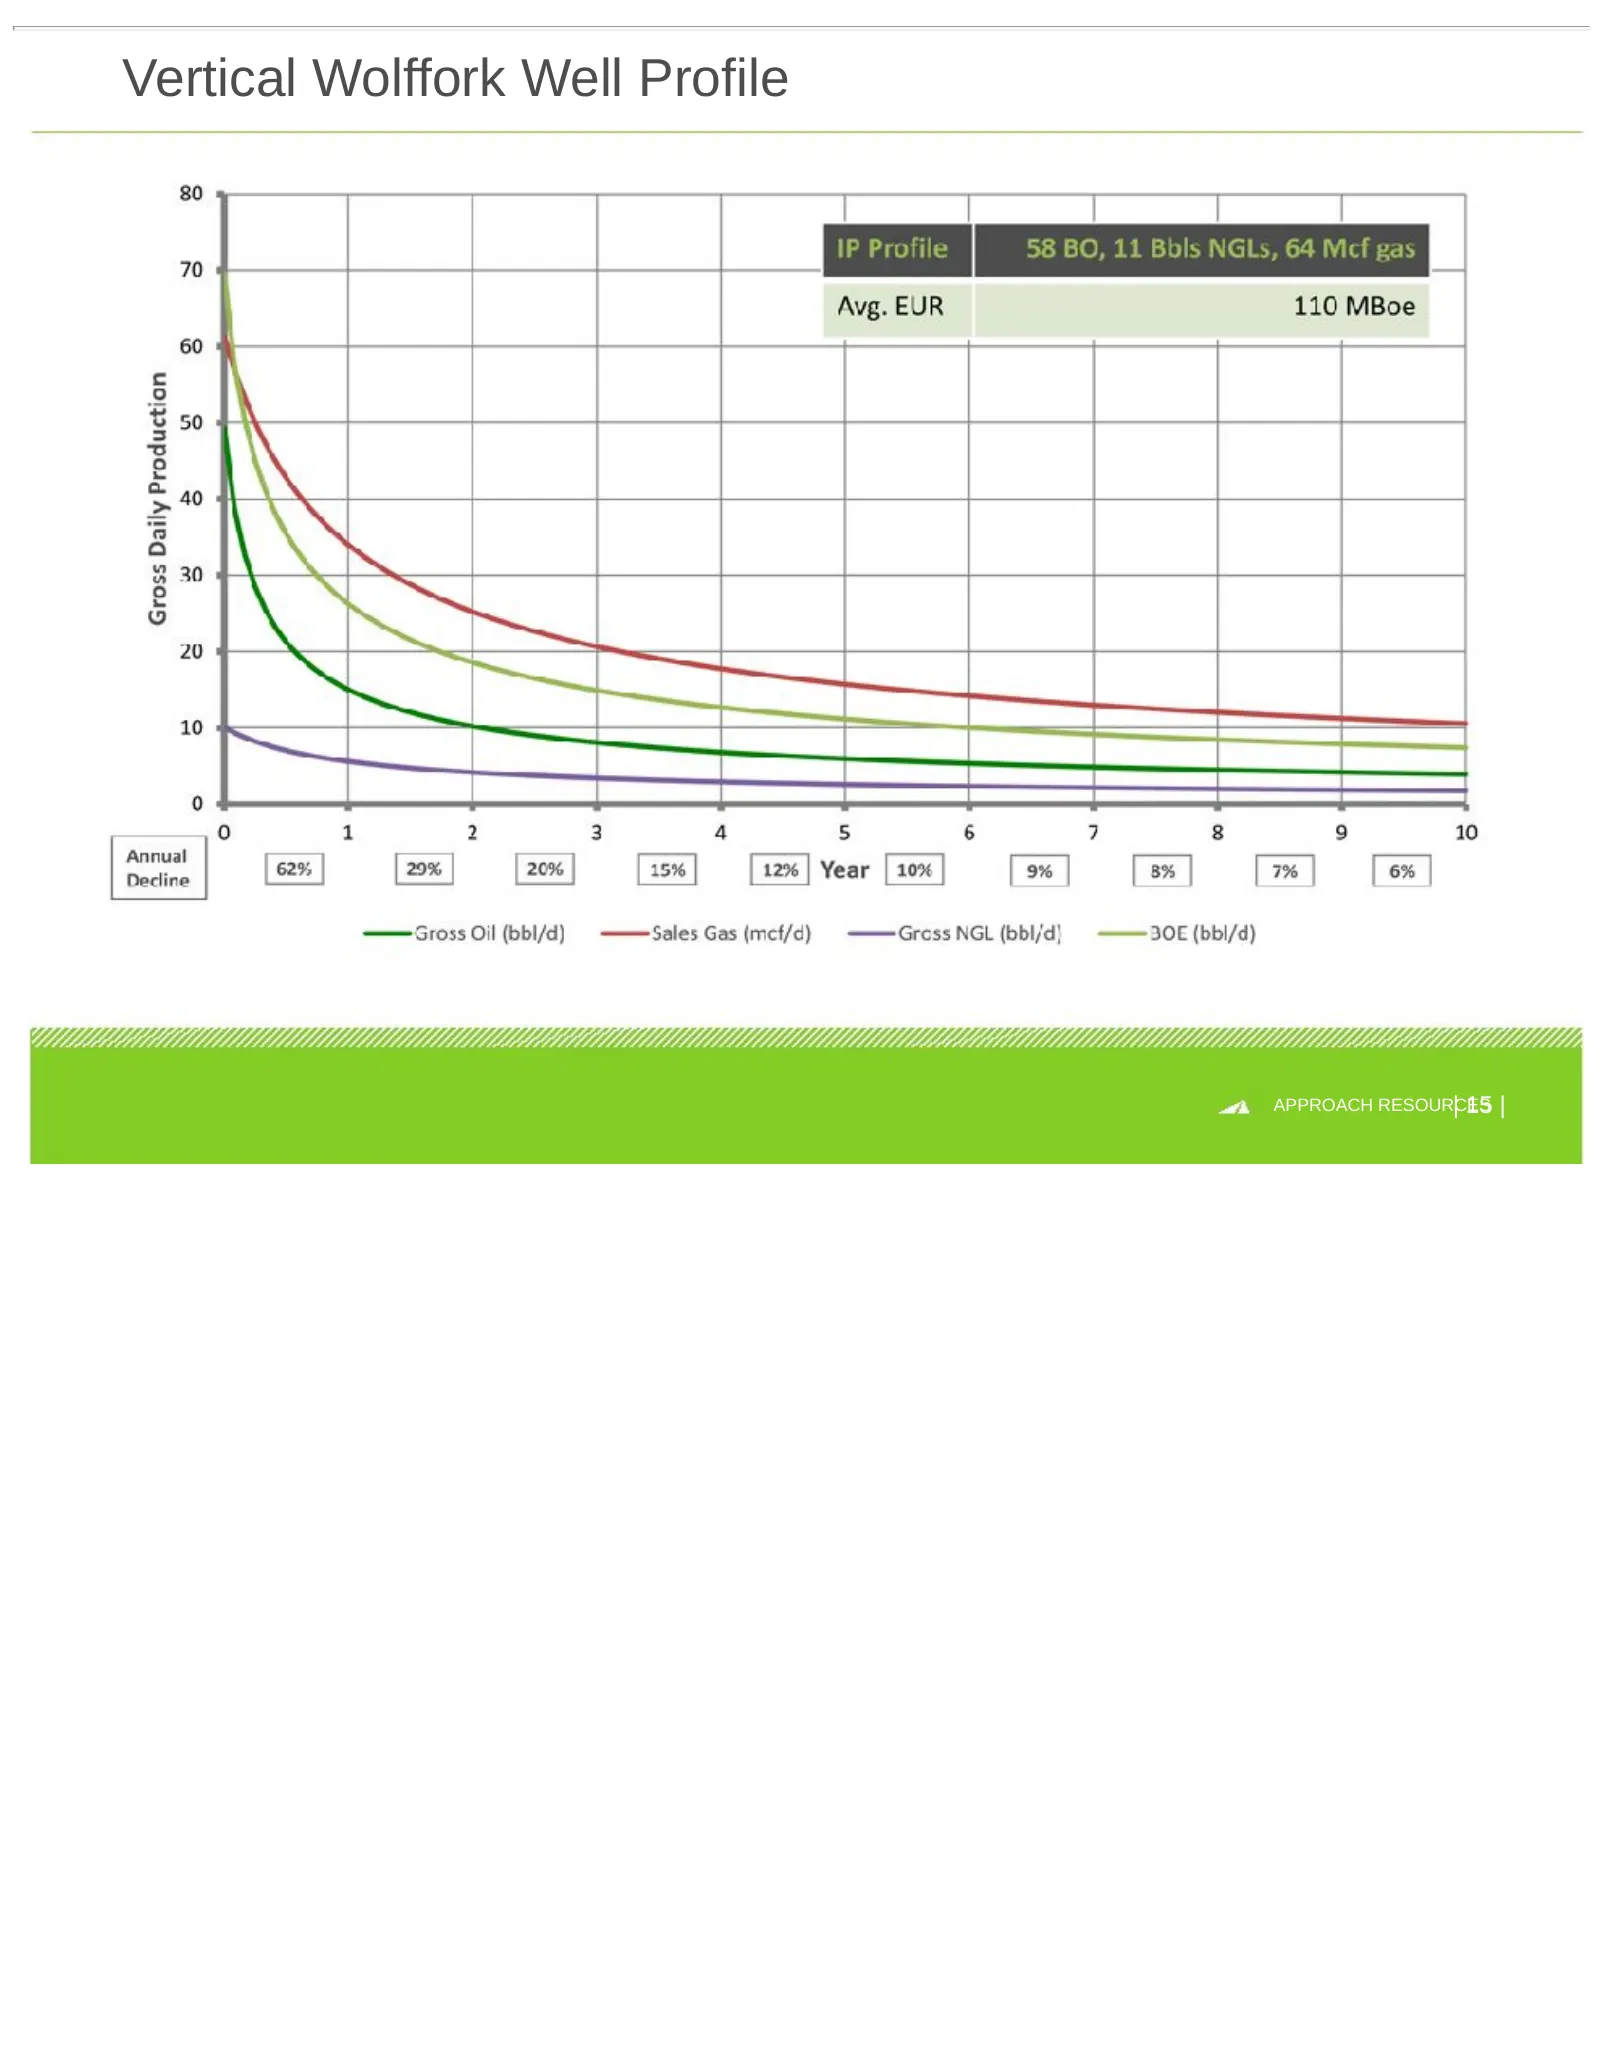
Slide 15: Vertical Wolffork Well Profile
Vertical Wolffork Well Profile | 15 | APPROACH RESOURCES
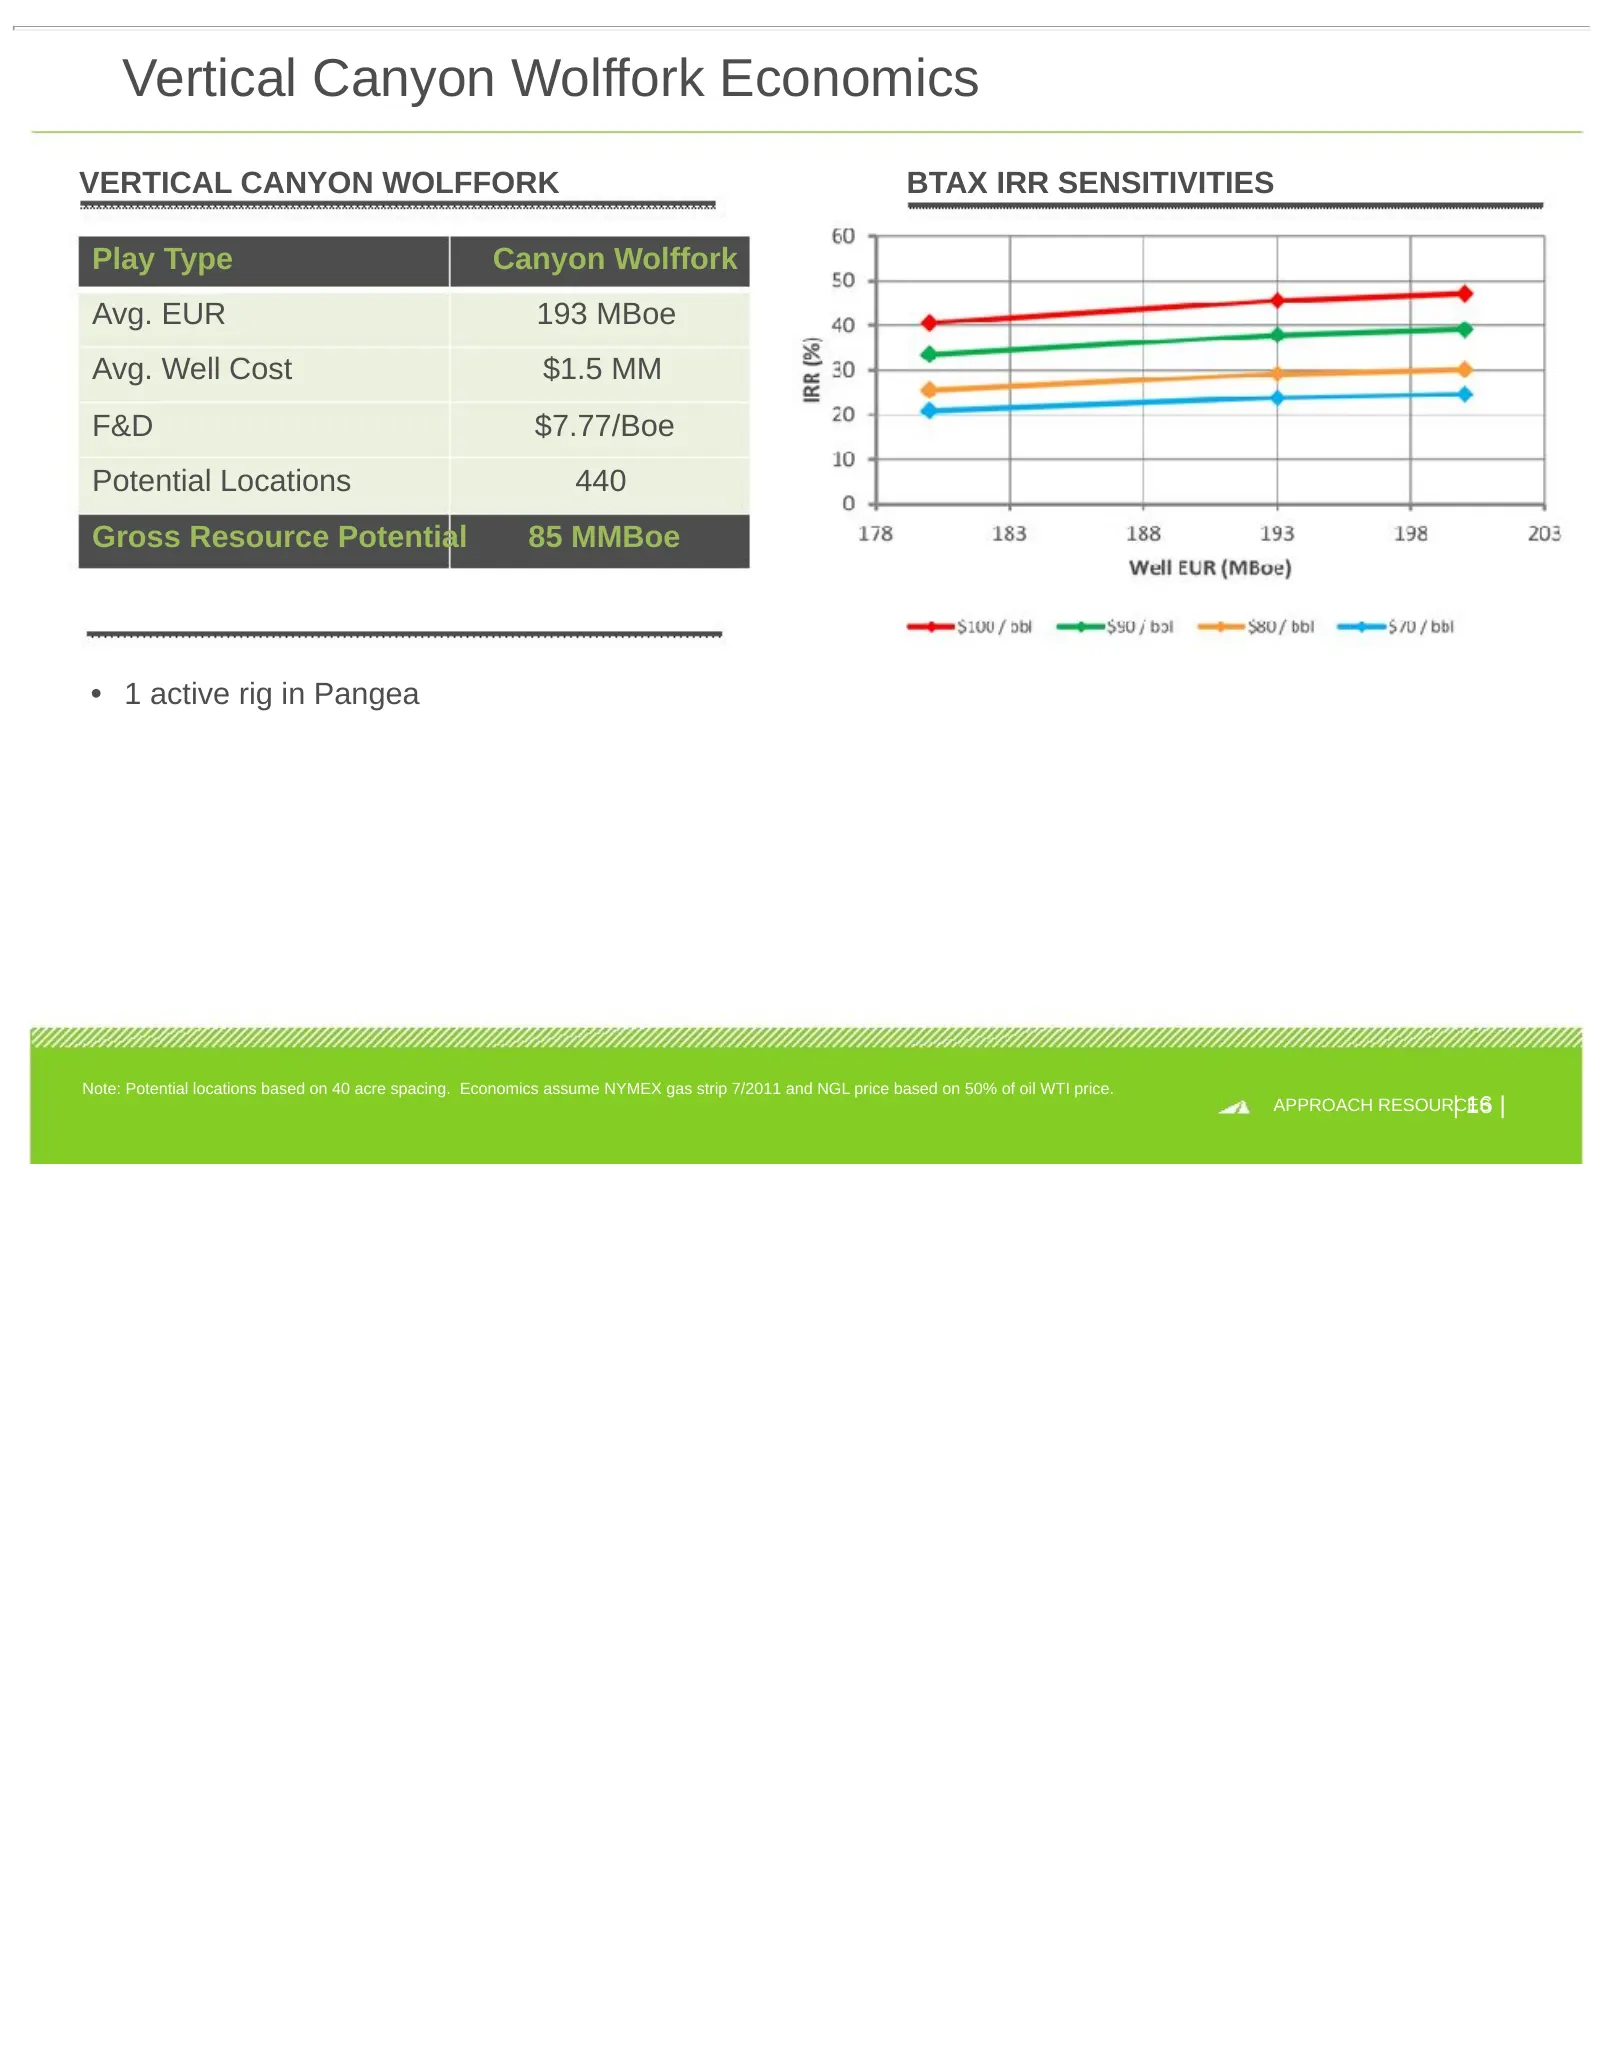
Slide 16: Vertical Canyon Wolffork Economics
Vertical Canyon Wolffork Economics VERTICAL CANYON WOLFFORK BTAX IRR SENSITIVITIES Play Type Canyon Wolffork Avg. EUR 193 MBoe Avg. Well Cost $1.5 MM F&D $7.77/Boe Potential Locations 440 Gross Resource Potential 85 MMBoe • 1 active rig in Pangea Note: Potential locations based on 40 acre spacing. E
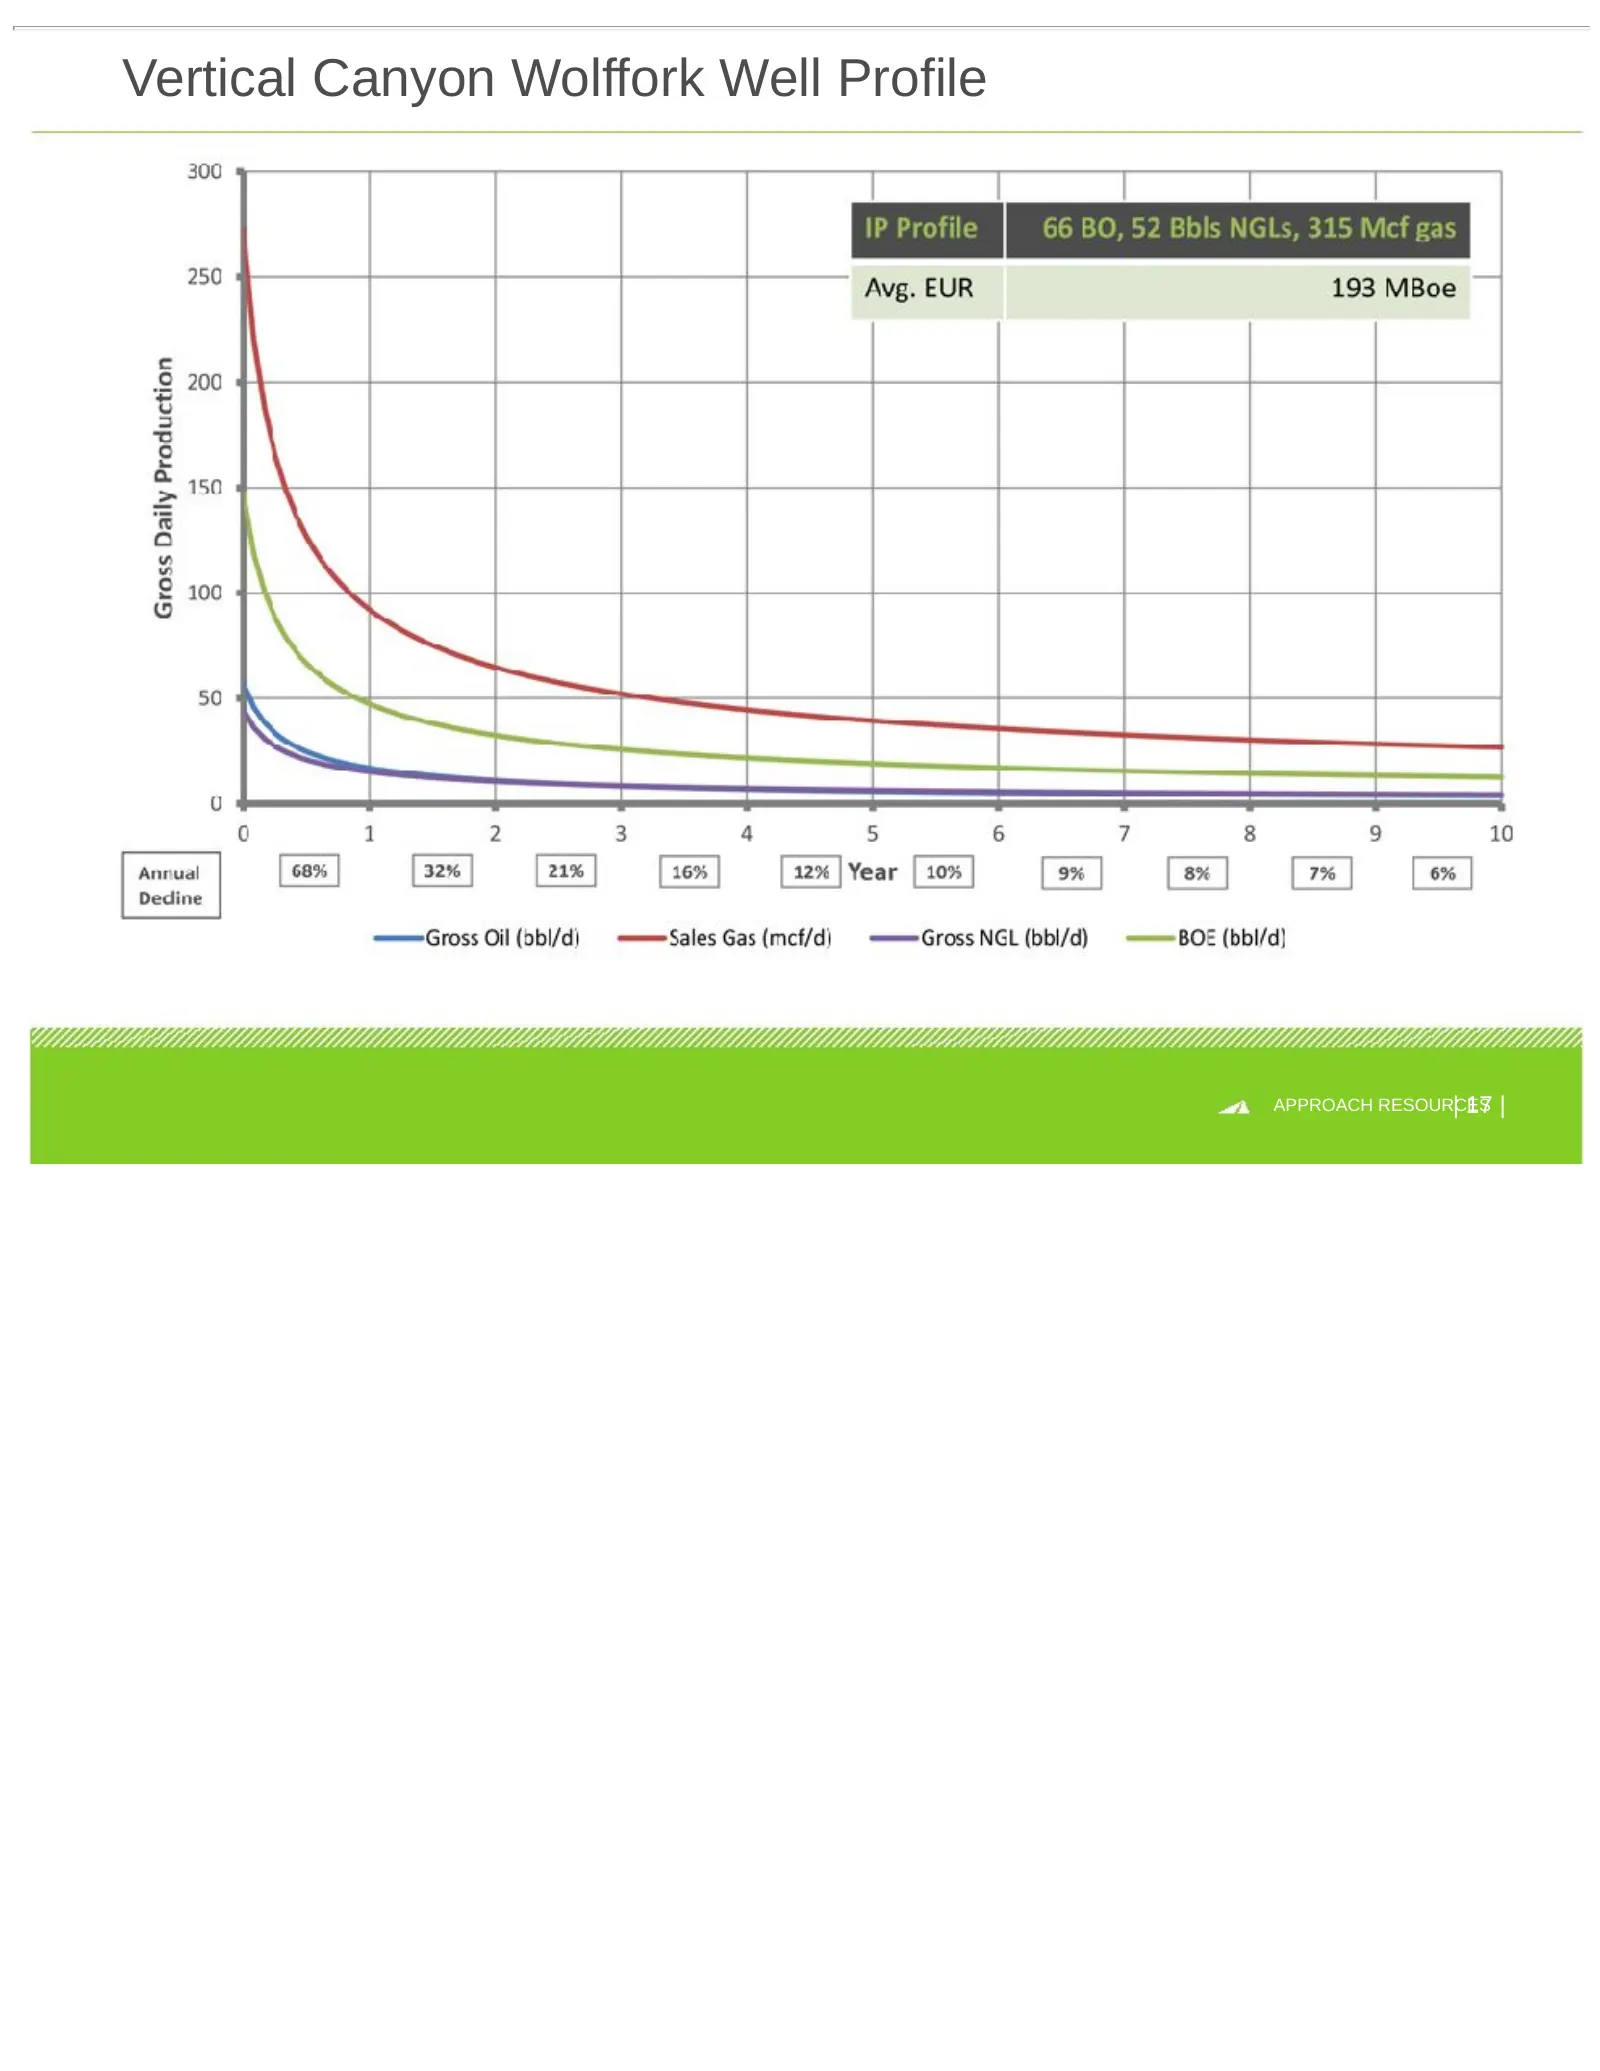
Slide 17: Vertical Canyon Wolffork Well Profile
Vertical Canyon Wolffork Well Profile | 17 | APPROACH RESOURCES
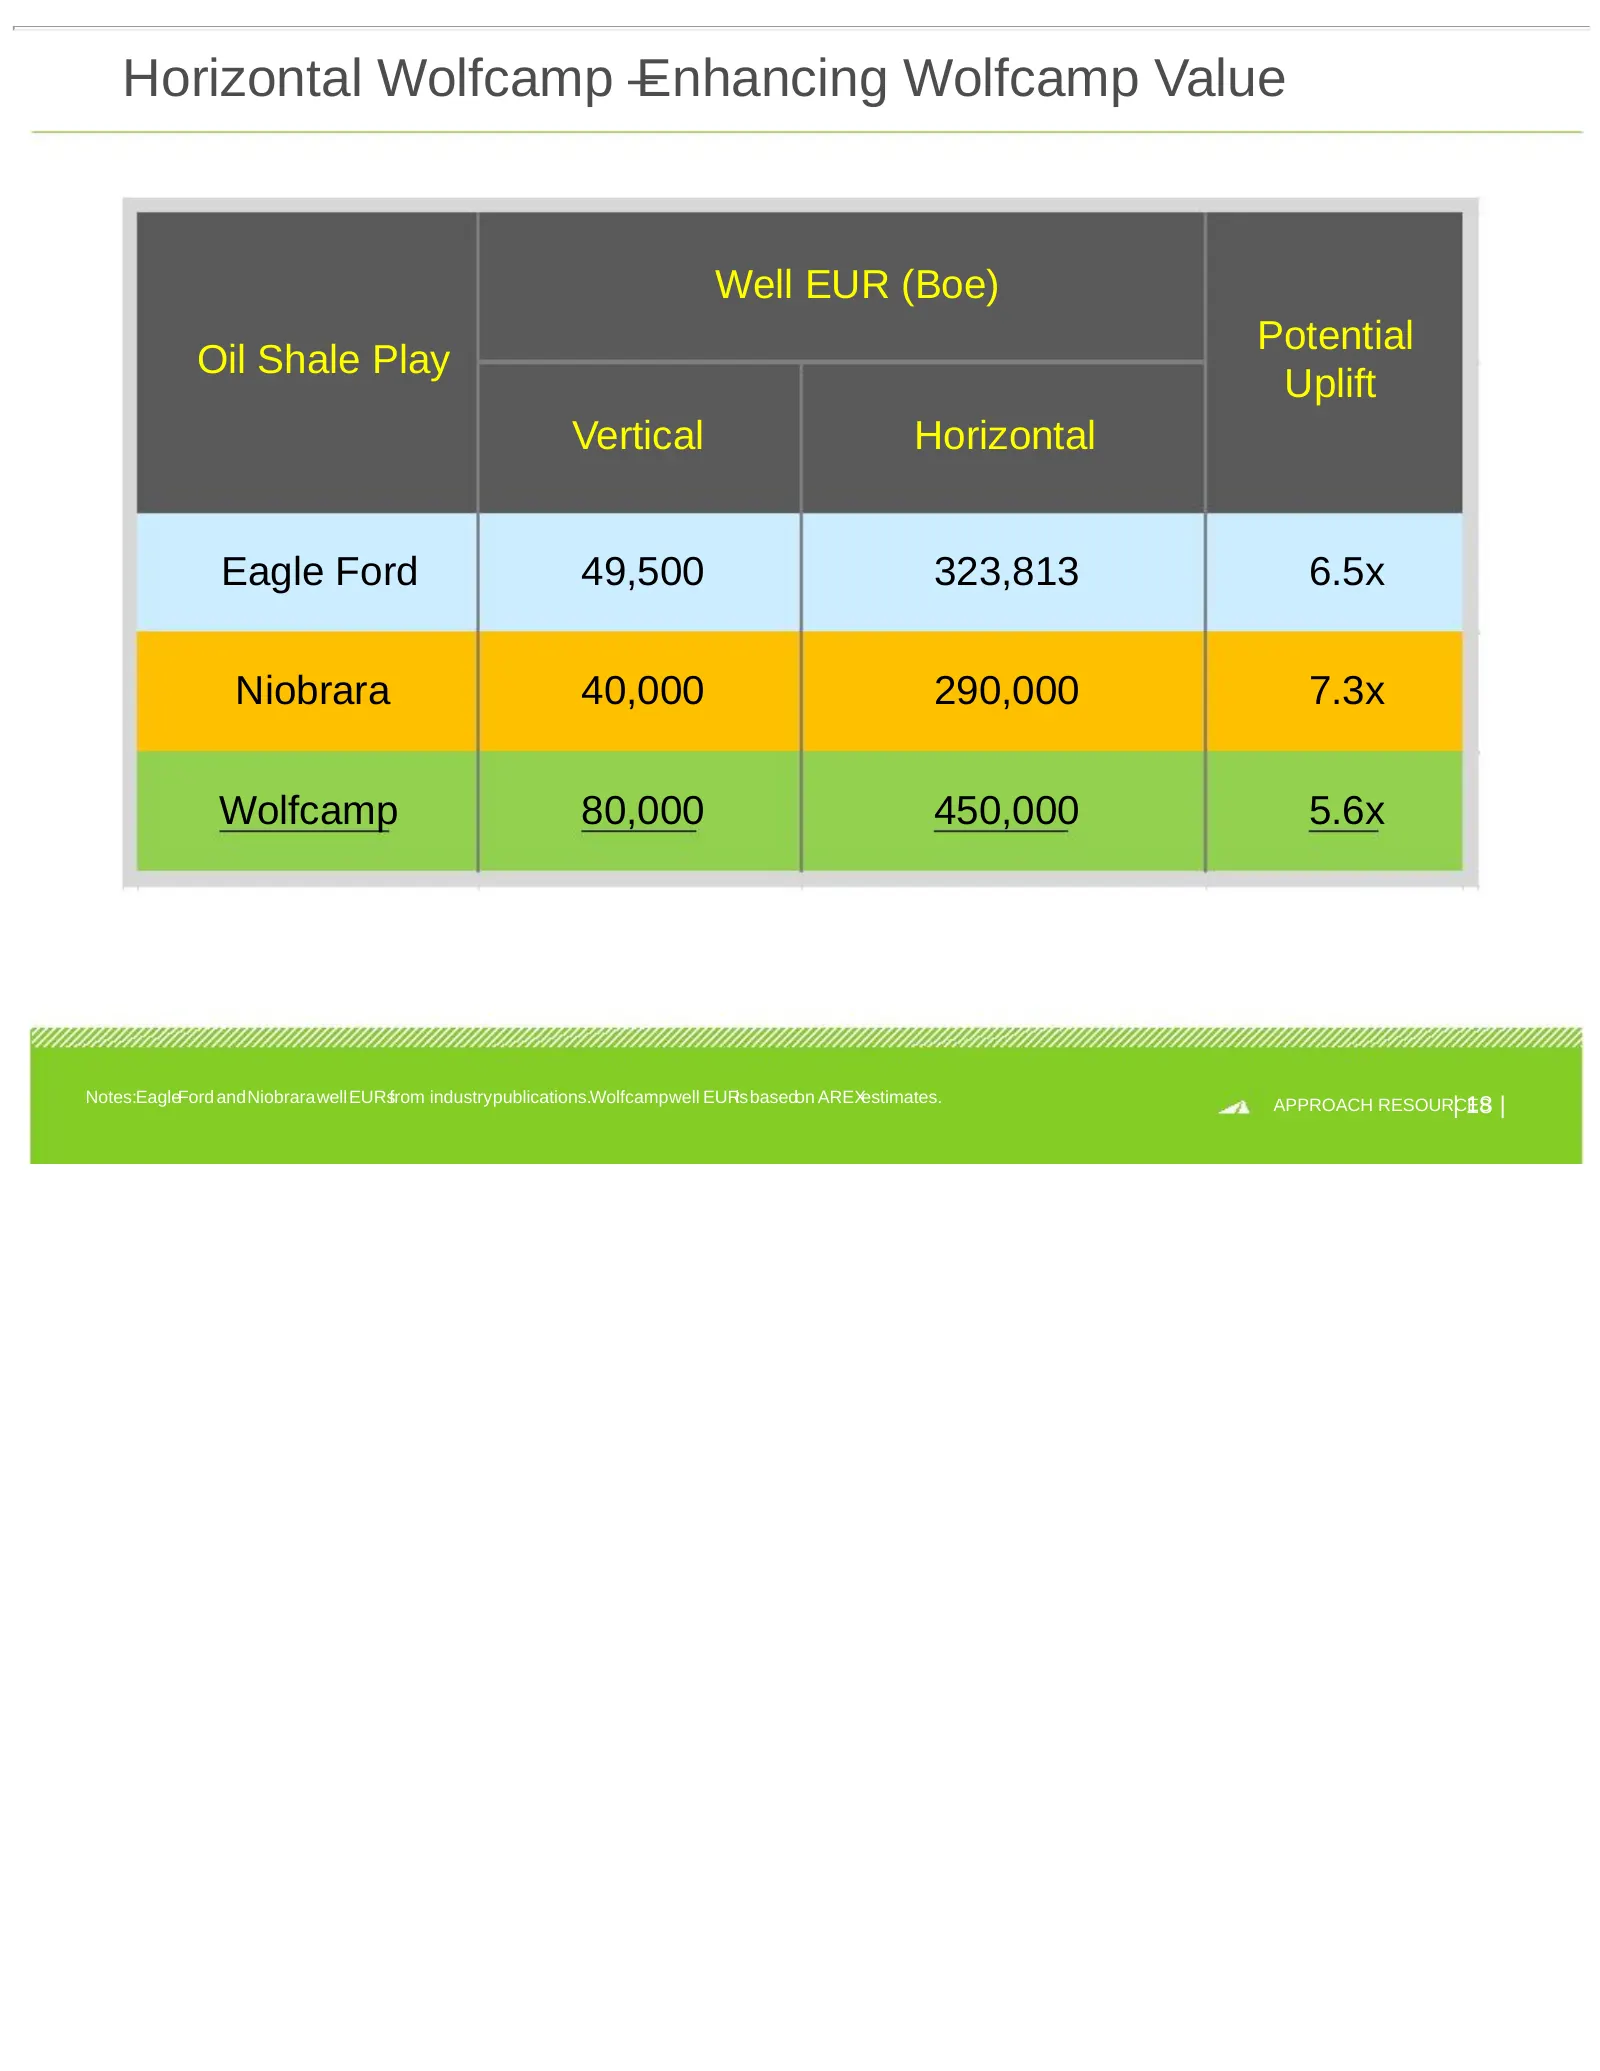
Slide 18: Horizontal Wolfcamp – Enhancing Wolfcamp Value
Horizontal Wolfcamp –Enhancing Wolfcamp Value Well EUR (Boe) Potential Oil Shale Play Uplift Vertical Horizontal Eagle Ford 49,500 323,813 6.5x Niobrara 40,000 290,000 7.3x Wolfcamp 80,000 450,000 5.6x Notes:EagleFord andNiobrarawellEURsfrom industrypublications.Wolfcampwell EURisbasedon AREXestimat
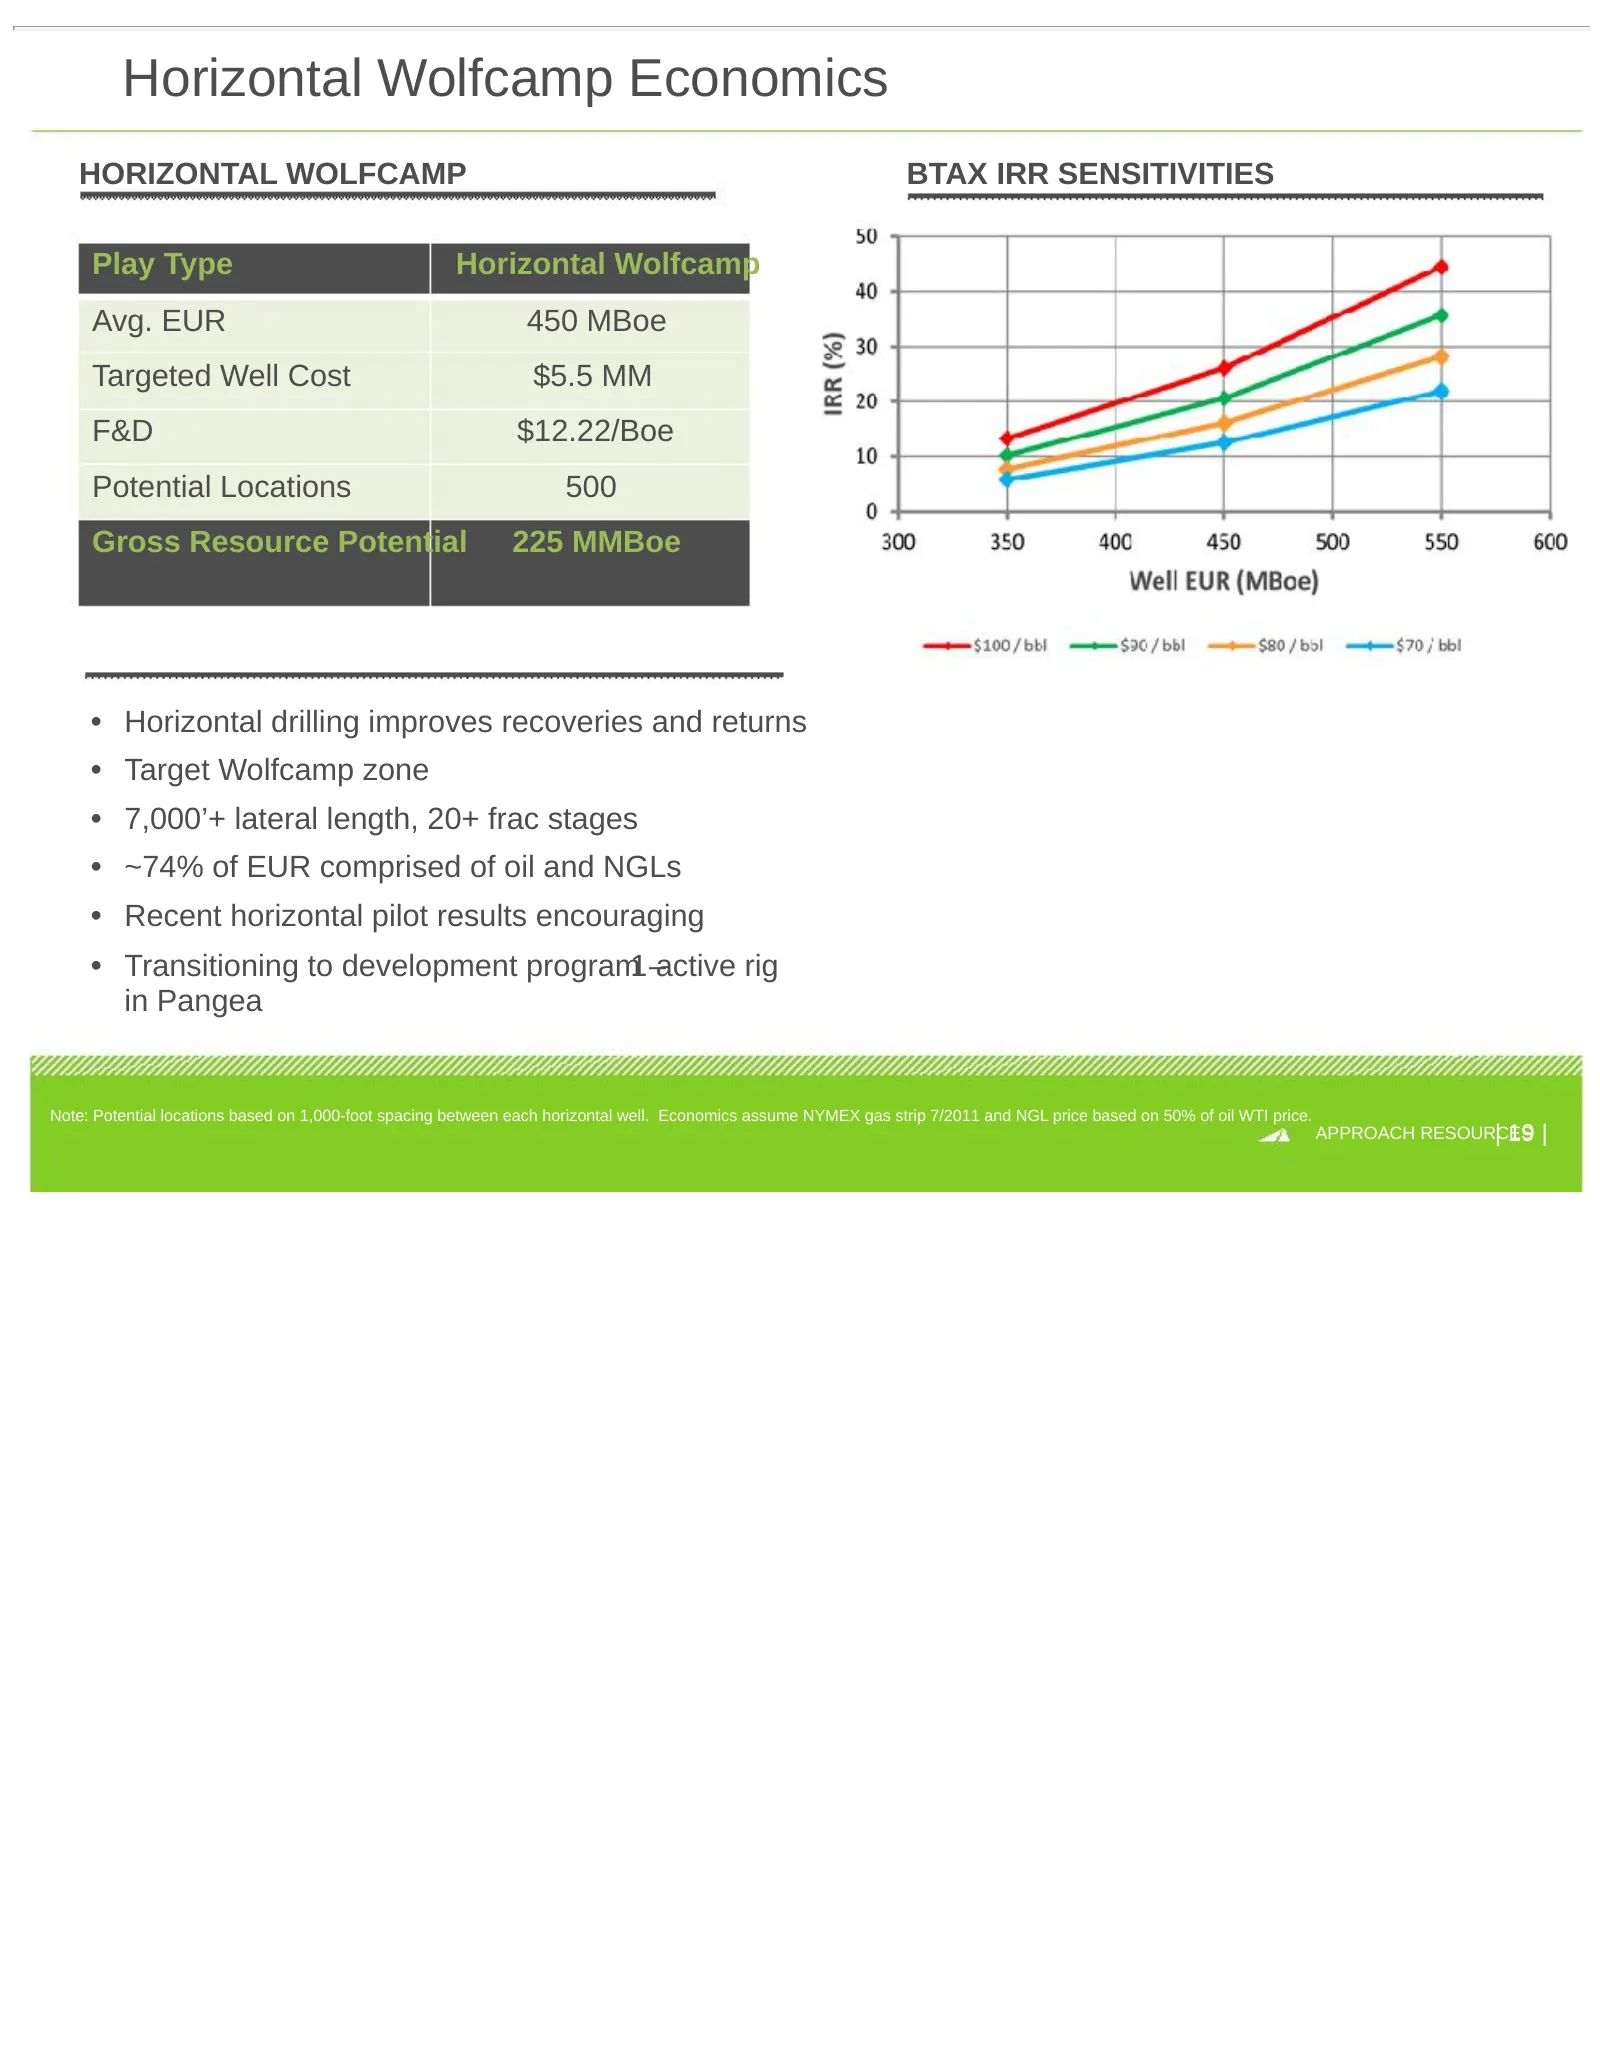
Slide 19: Horizontal Wolfcamp Economics
Horizontal Wolfcamp Economics HORIZONTAL WOLFCAMP BTAX IRR SENSITIVITIES Play Type Horizontal Wolfcamp Avg. EUR 450 MBoe Targeted Well Cost $5.5 MM F&D $12.22/Boe Potential Locations 500 Gross Resource Potential 225 MMBoe • Horizontal drilling improves recoveries and returns • Target Wolfcamp zone •
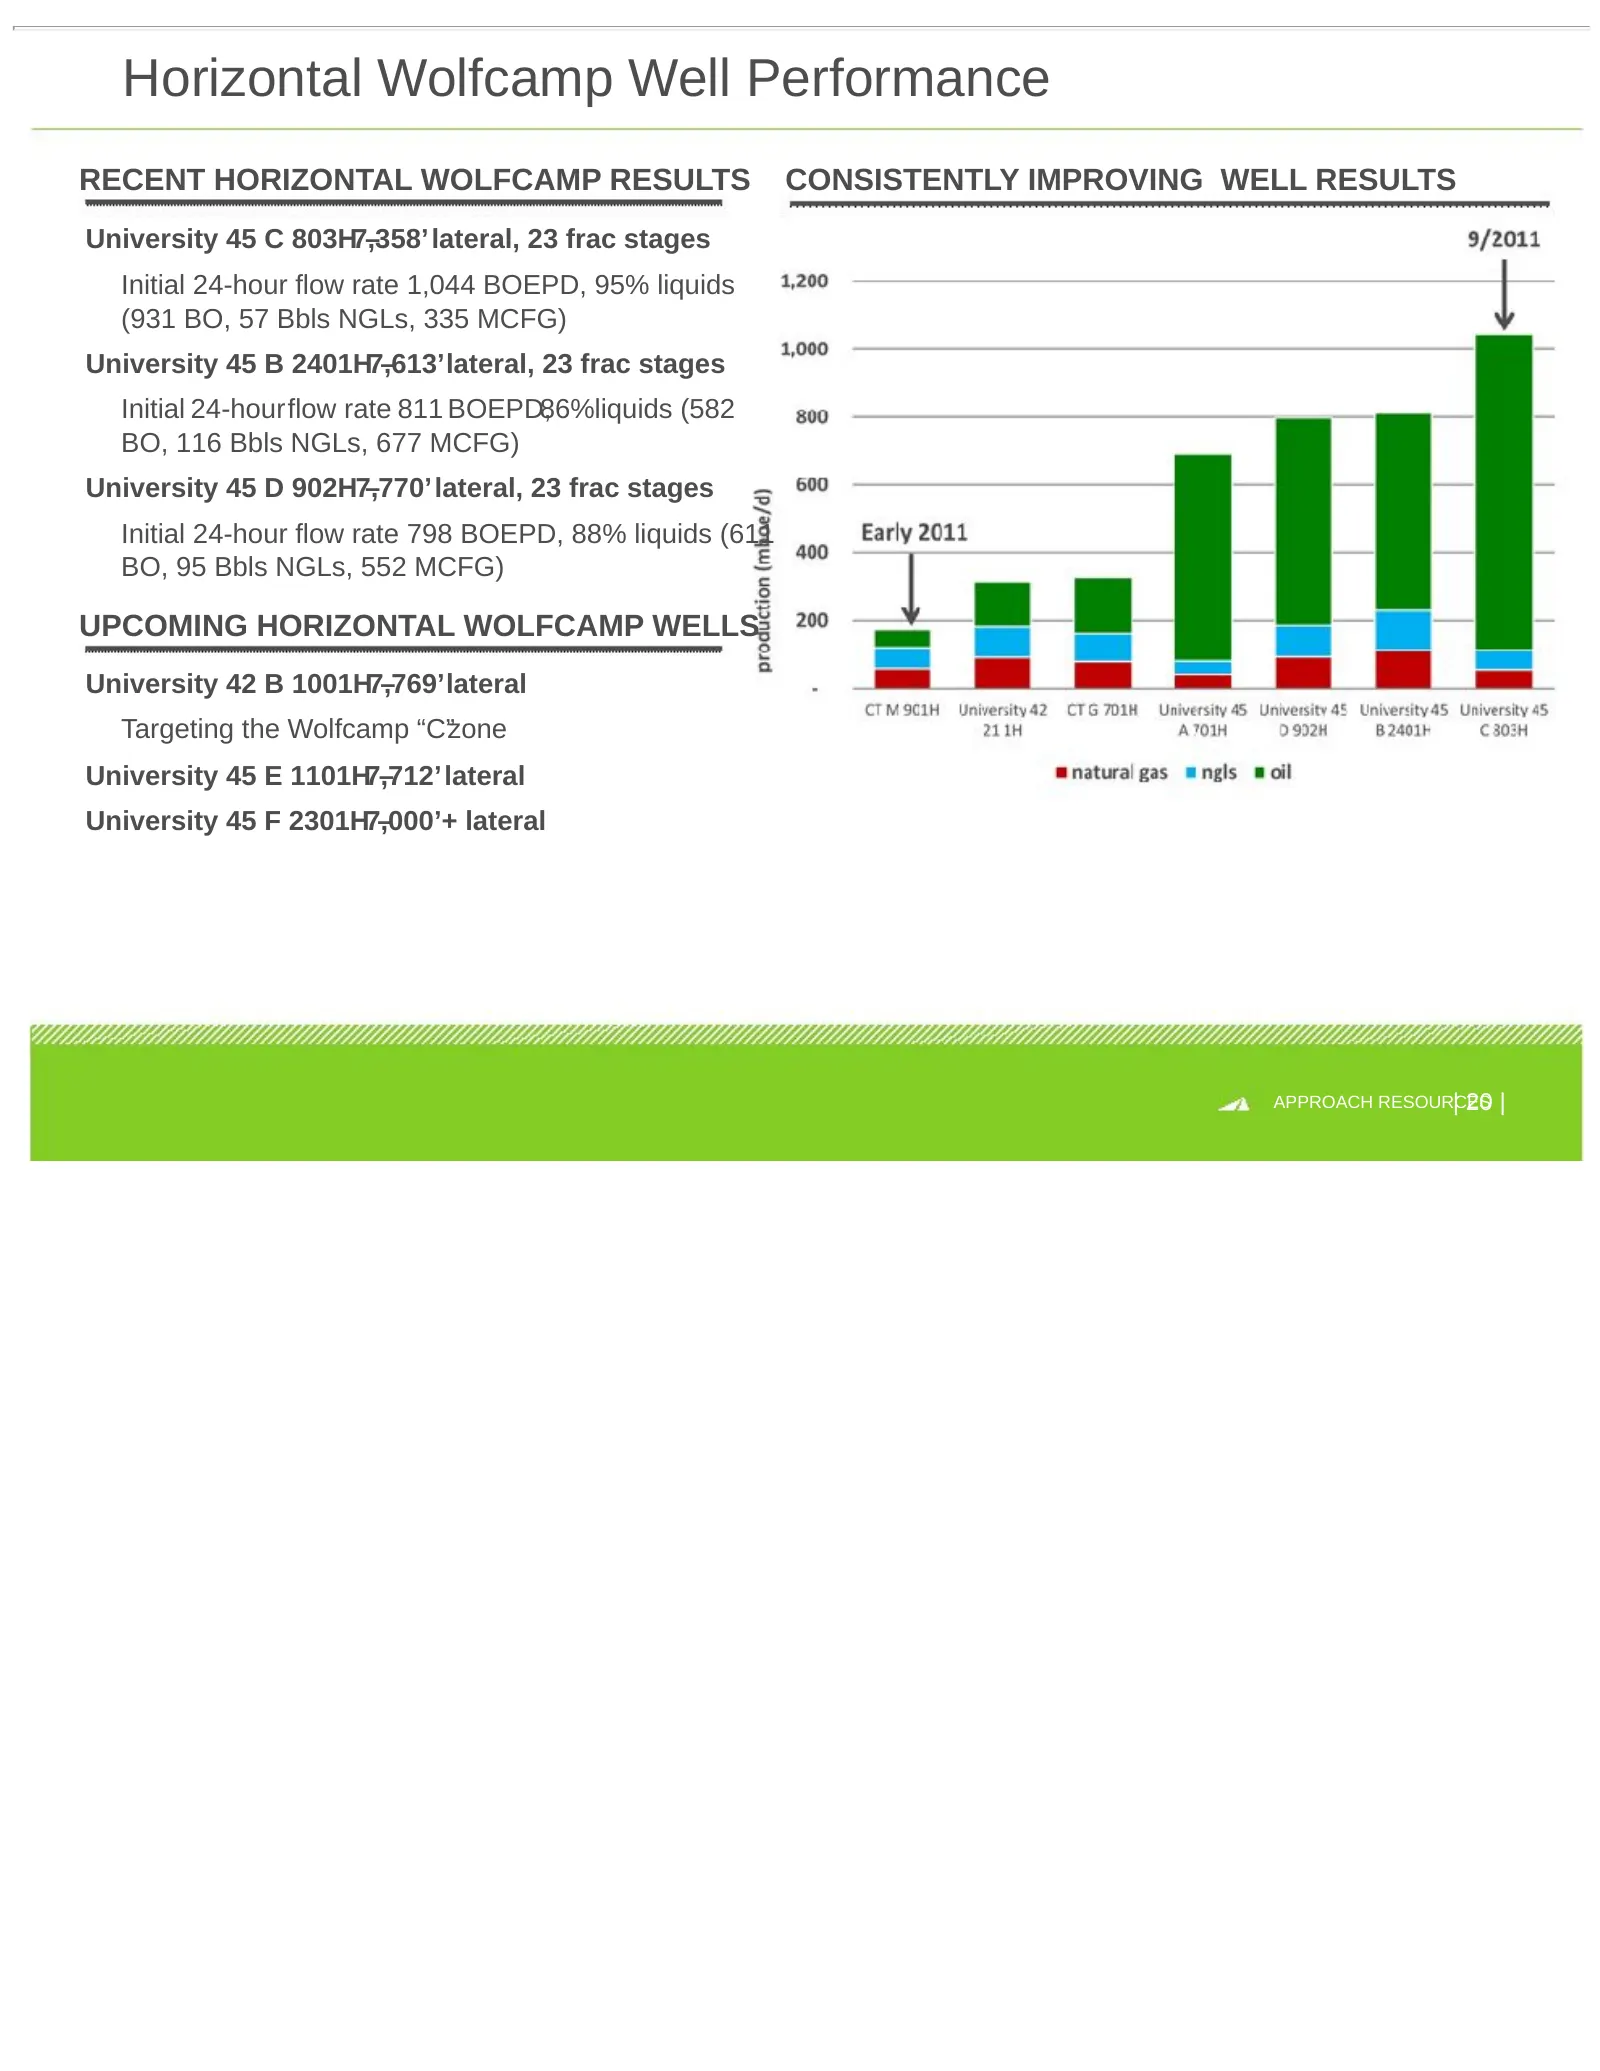
Slide 20: Horizontal Wolfcamp Well Performance
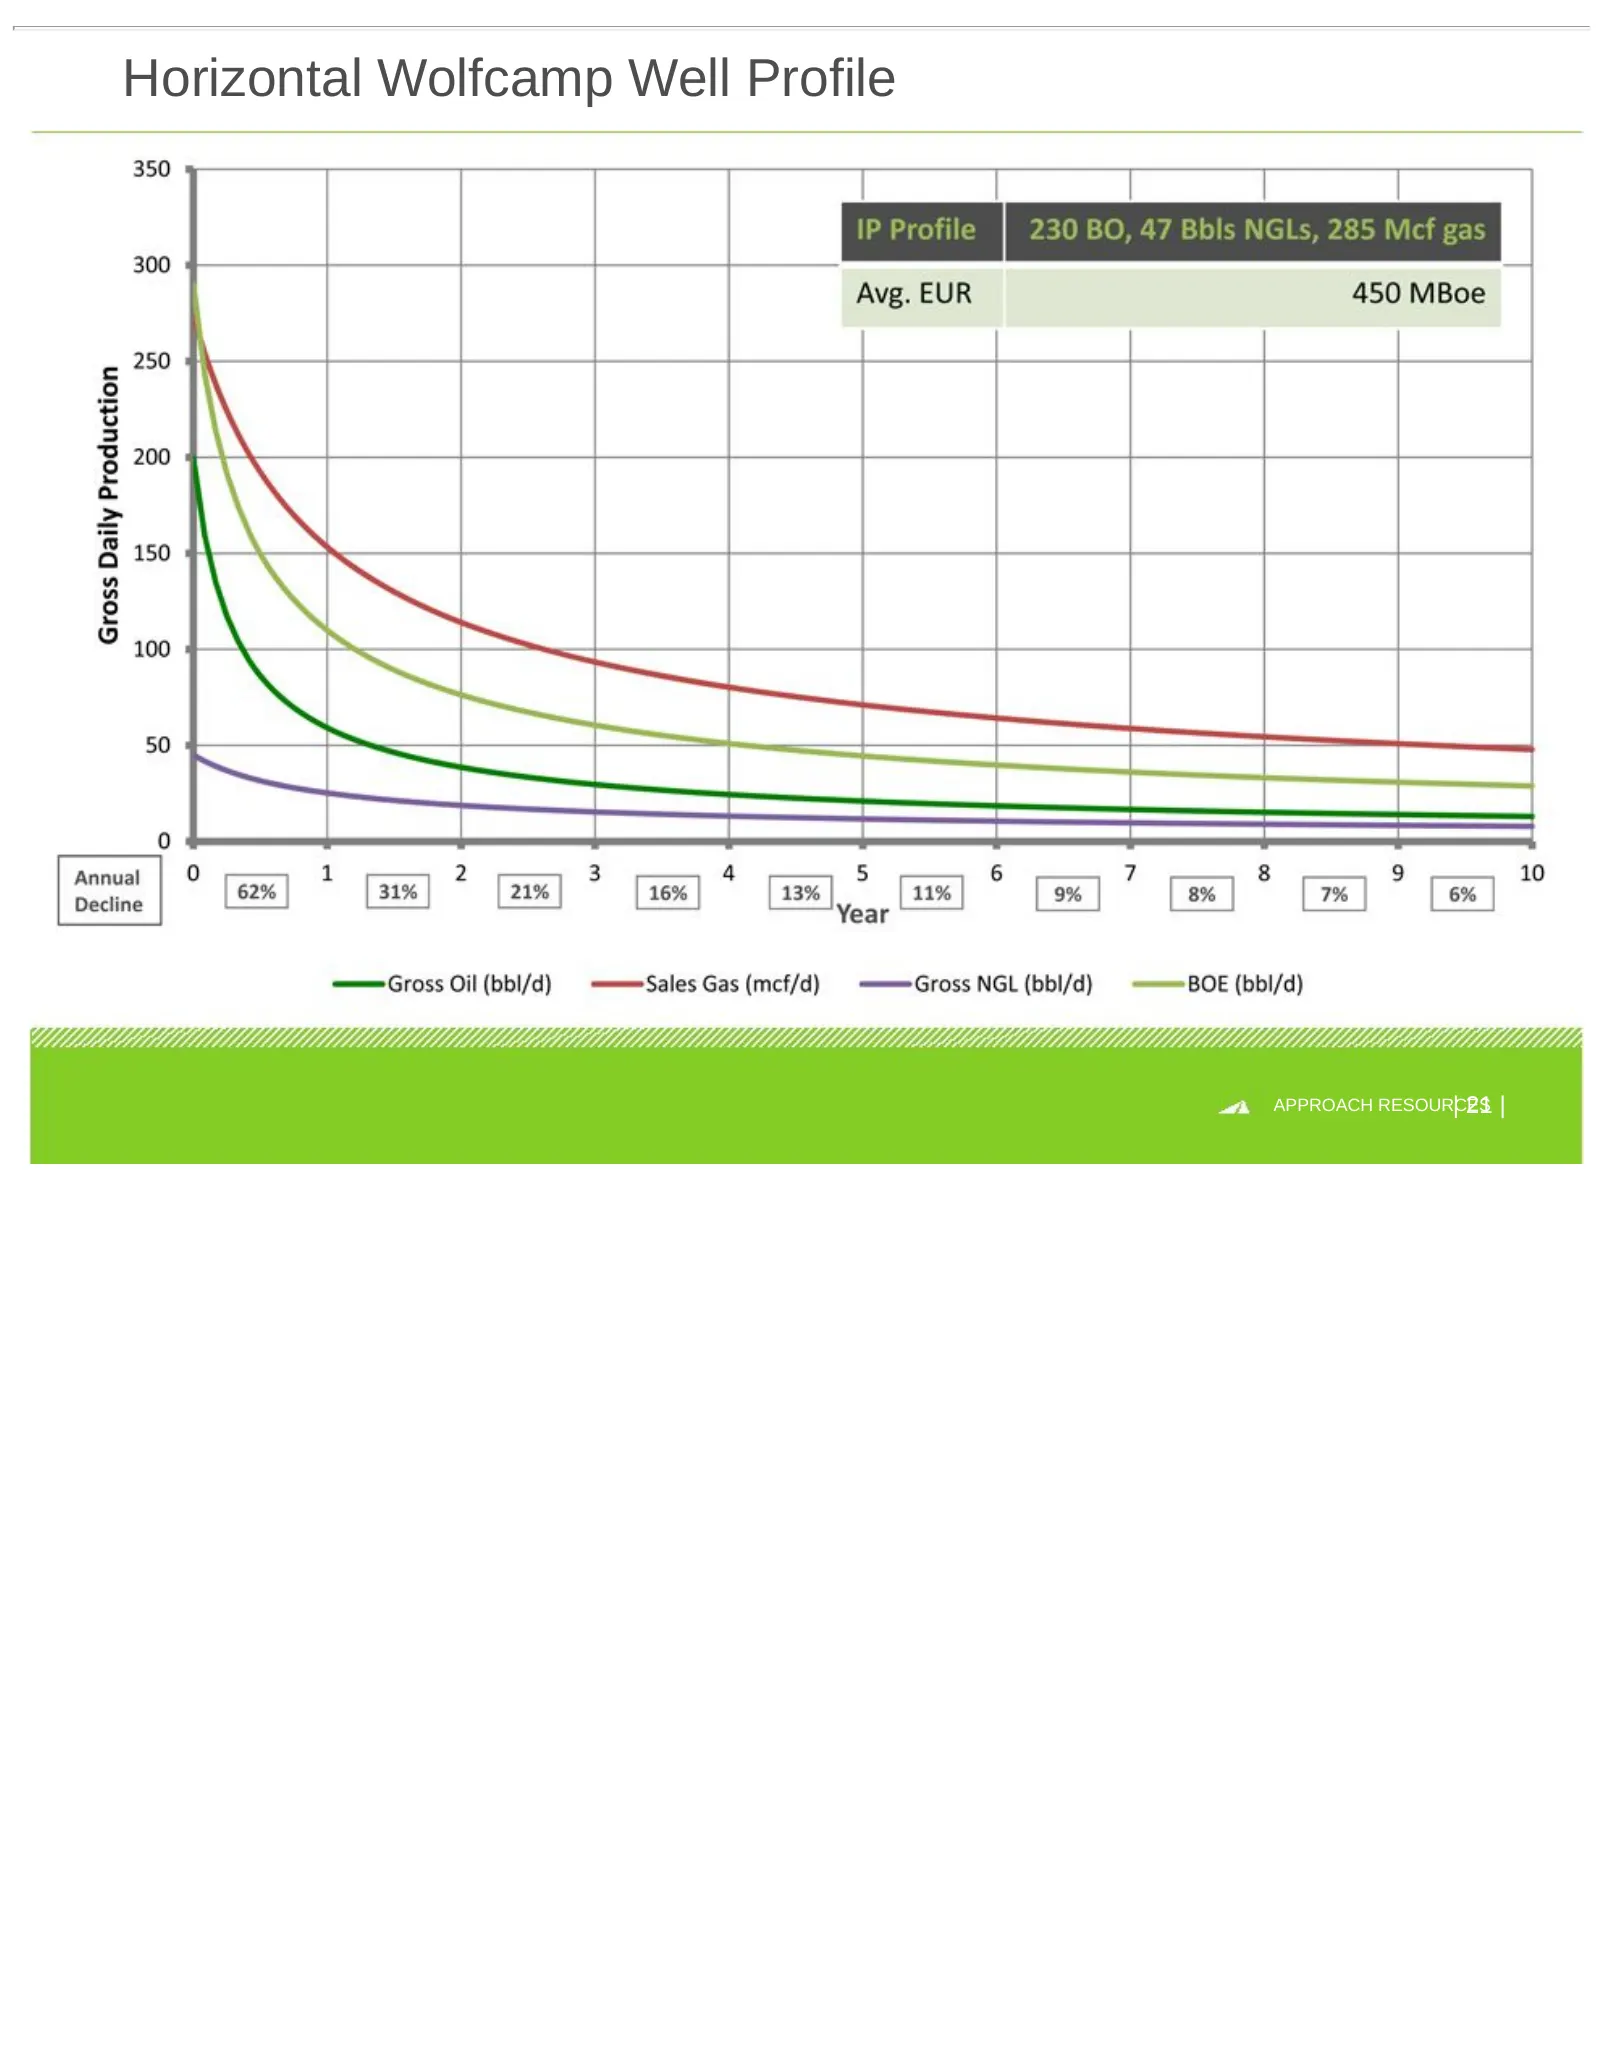
Horizontal Wolfcamp Well Performance RECENT HORIZONTAL WOLFCAMP RESULTS CONSISTENTLY IMPROVING WELL RESULTS University 45 C 803H7,358’ – lateral, 23 frac stages Initial 24-hour flow rate 1,044 BOEPD, 95% liquids (931 BO, 57 Bbls NGLs, 335 MCFG) University 45 B 2401H7,613’lateral, – 23 frac stages In
Slide 21: Horizontal Wolfcamp Well Profile
Horizontal Wolfcamp Well Profile | 21 | APPROACH RESOURCES
Slide 22: Summary – AREX Total Resource Potential
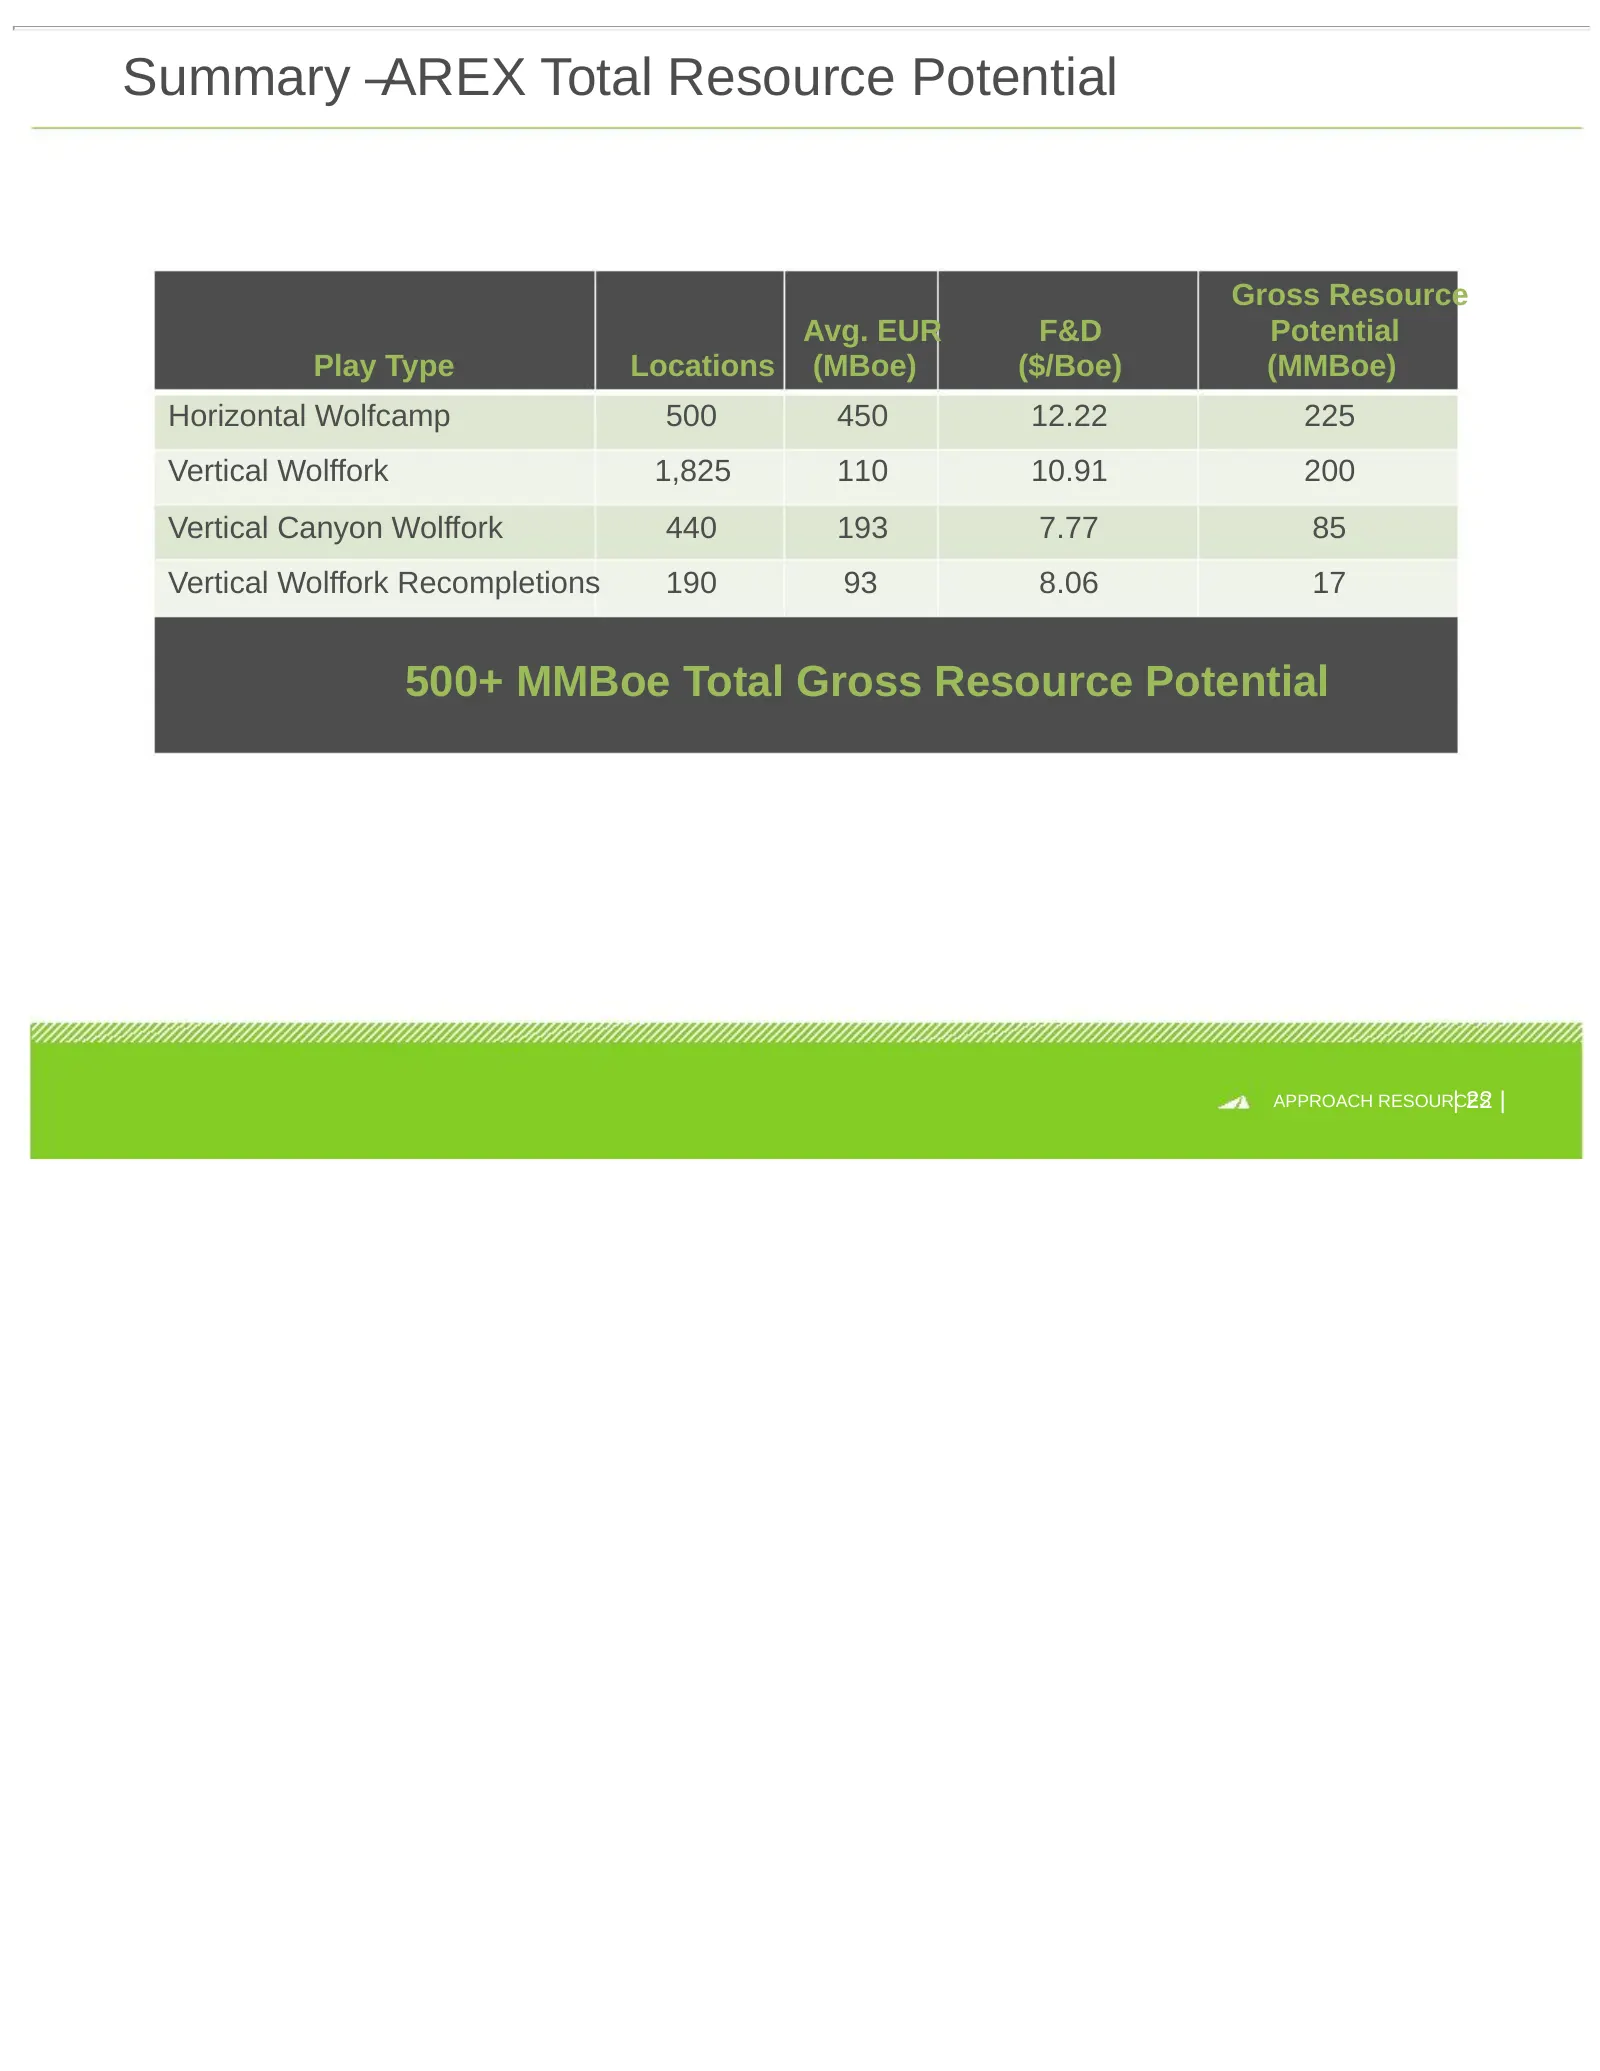
Summary –AREX Total Resource Potential Gross Resource Avg. EUR F&D Potential Play Type Locations (MBoe) ($/Boe) (MMBoe) Horizontal Wolfcamp 500 450 12.22 225 Vertical Wolffork 1,825 110 10.91 200 Vertical Canyon Wolffork 440 193 7.77 85 Vertical Wolffork Recompletions 190 93 8.06 17 500+ MMBoe Total
Slide 23: Key Investor Highlights
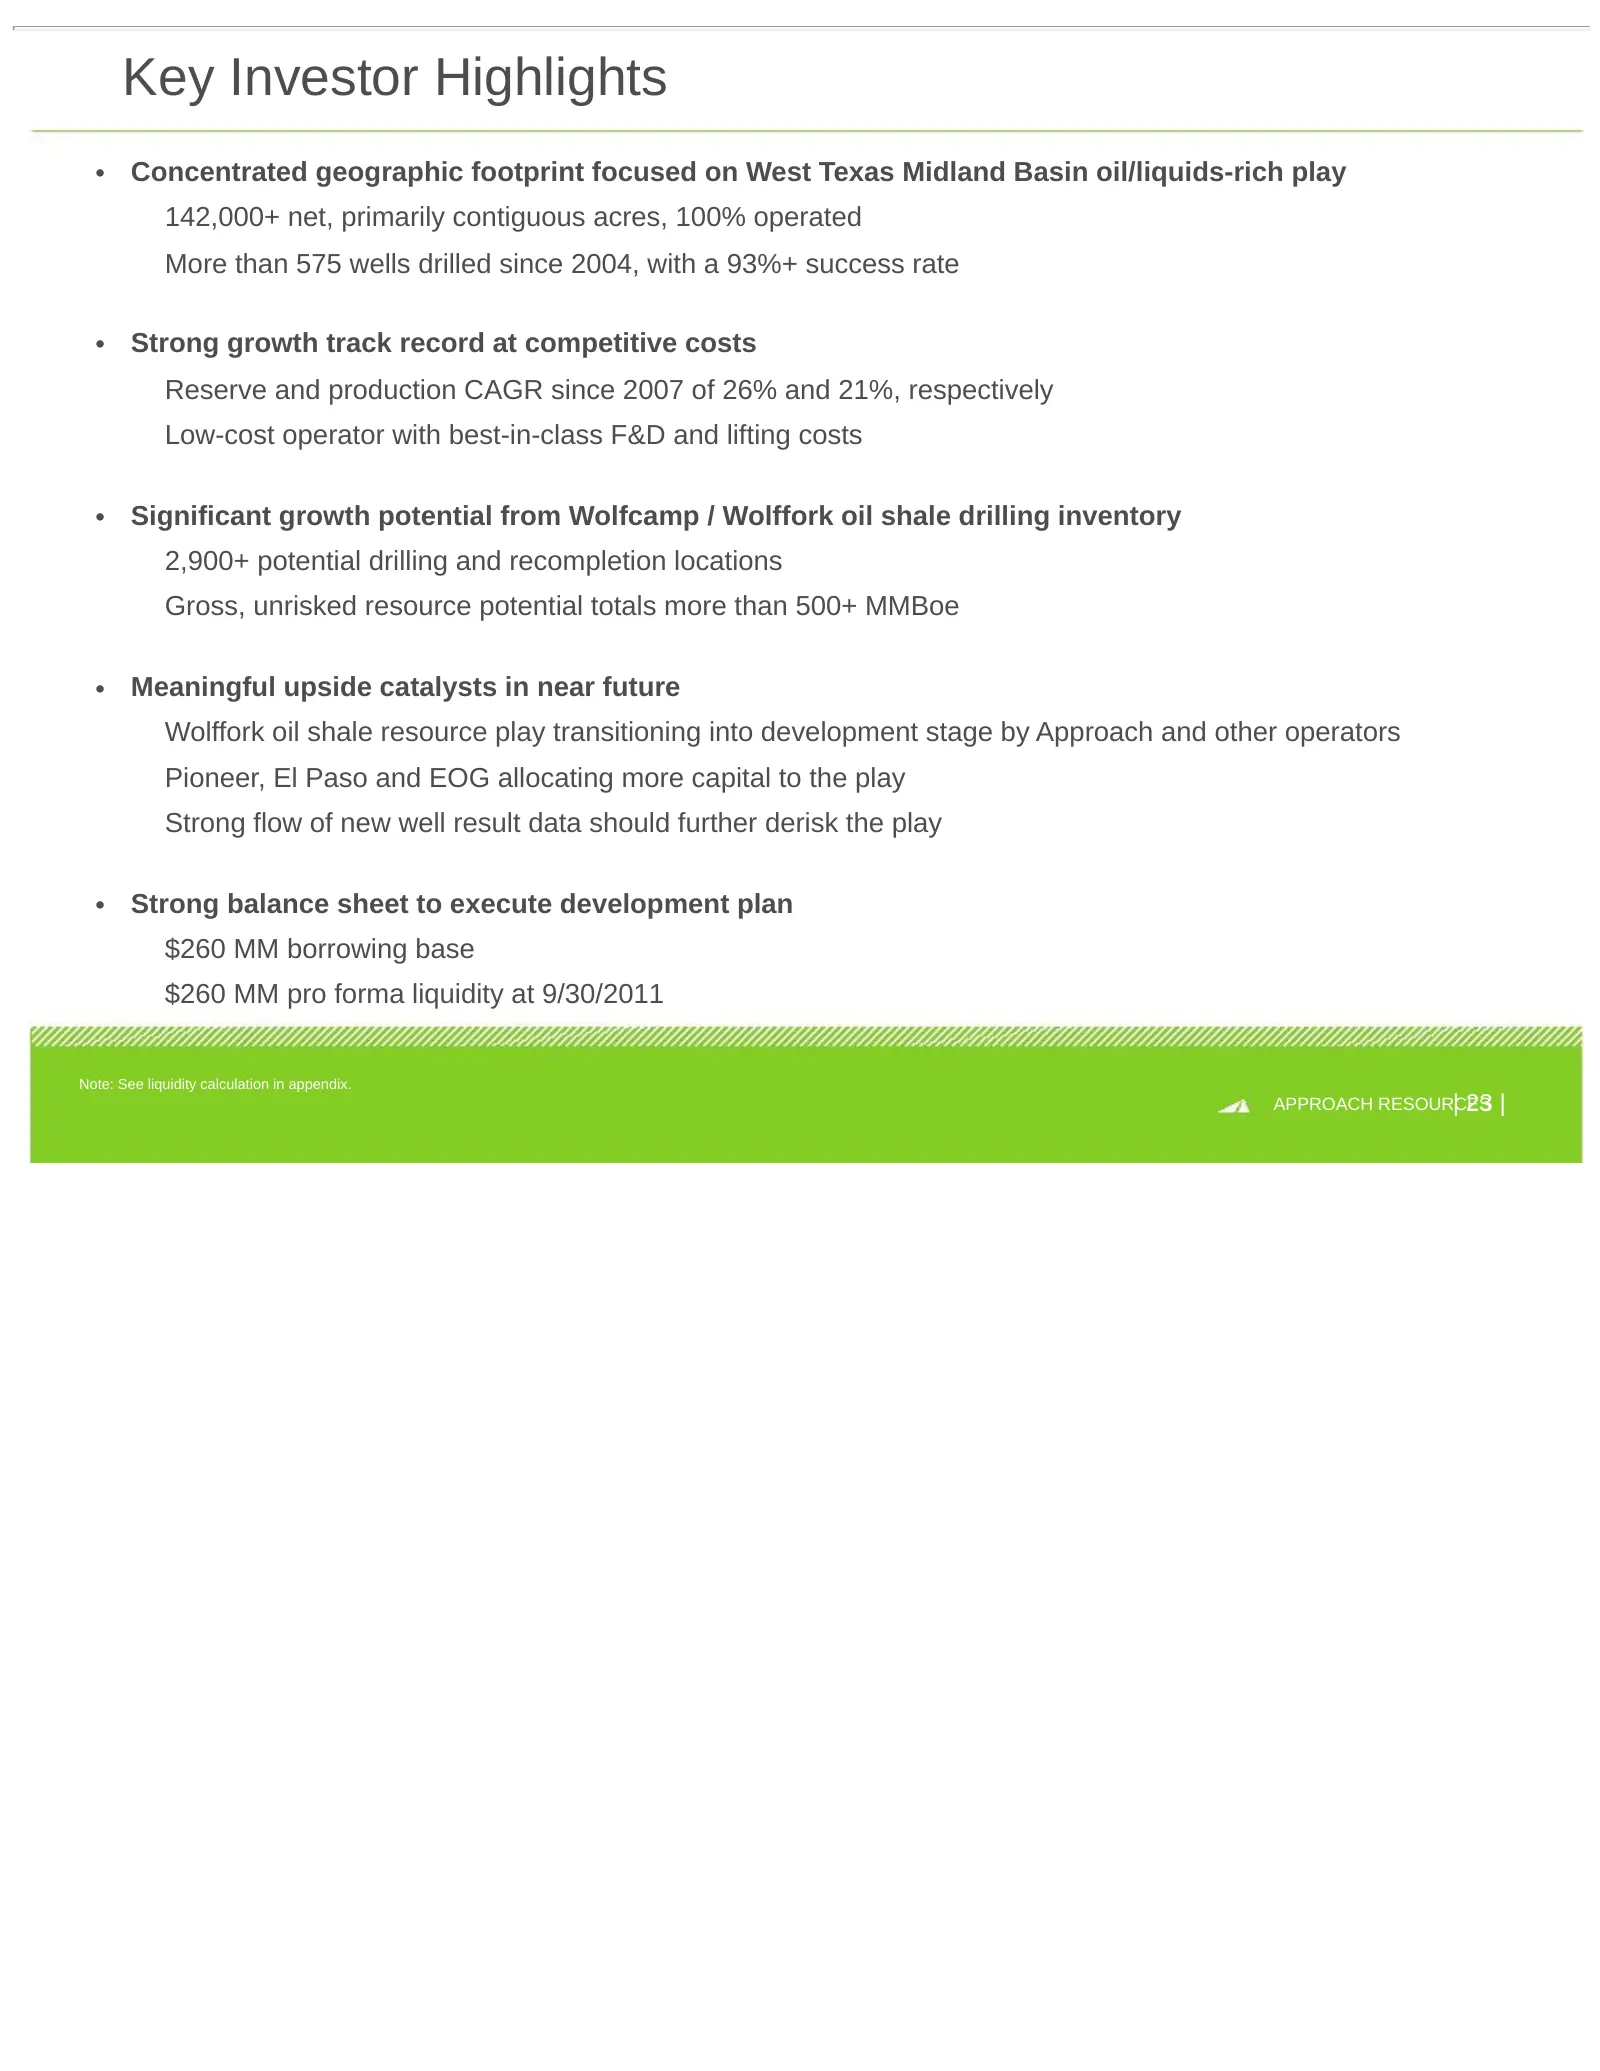
Key Investor Highlights • Concentrated geographic footprint focused on West Texas Midland Basin oil/liquids-rich play 142,000+ net, primarily contiguous acres, 100% operated More than 575 wells drilled since 2004, with a 93%+ success rate • Strong growth track record at competitive costs Reserve and
Slide 24: Financial Framework
Financial Framework APPROACH RESOURCES
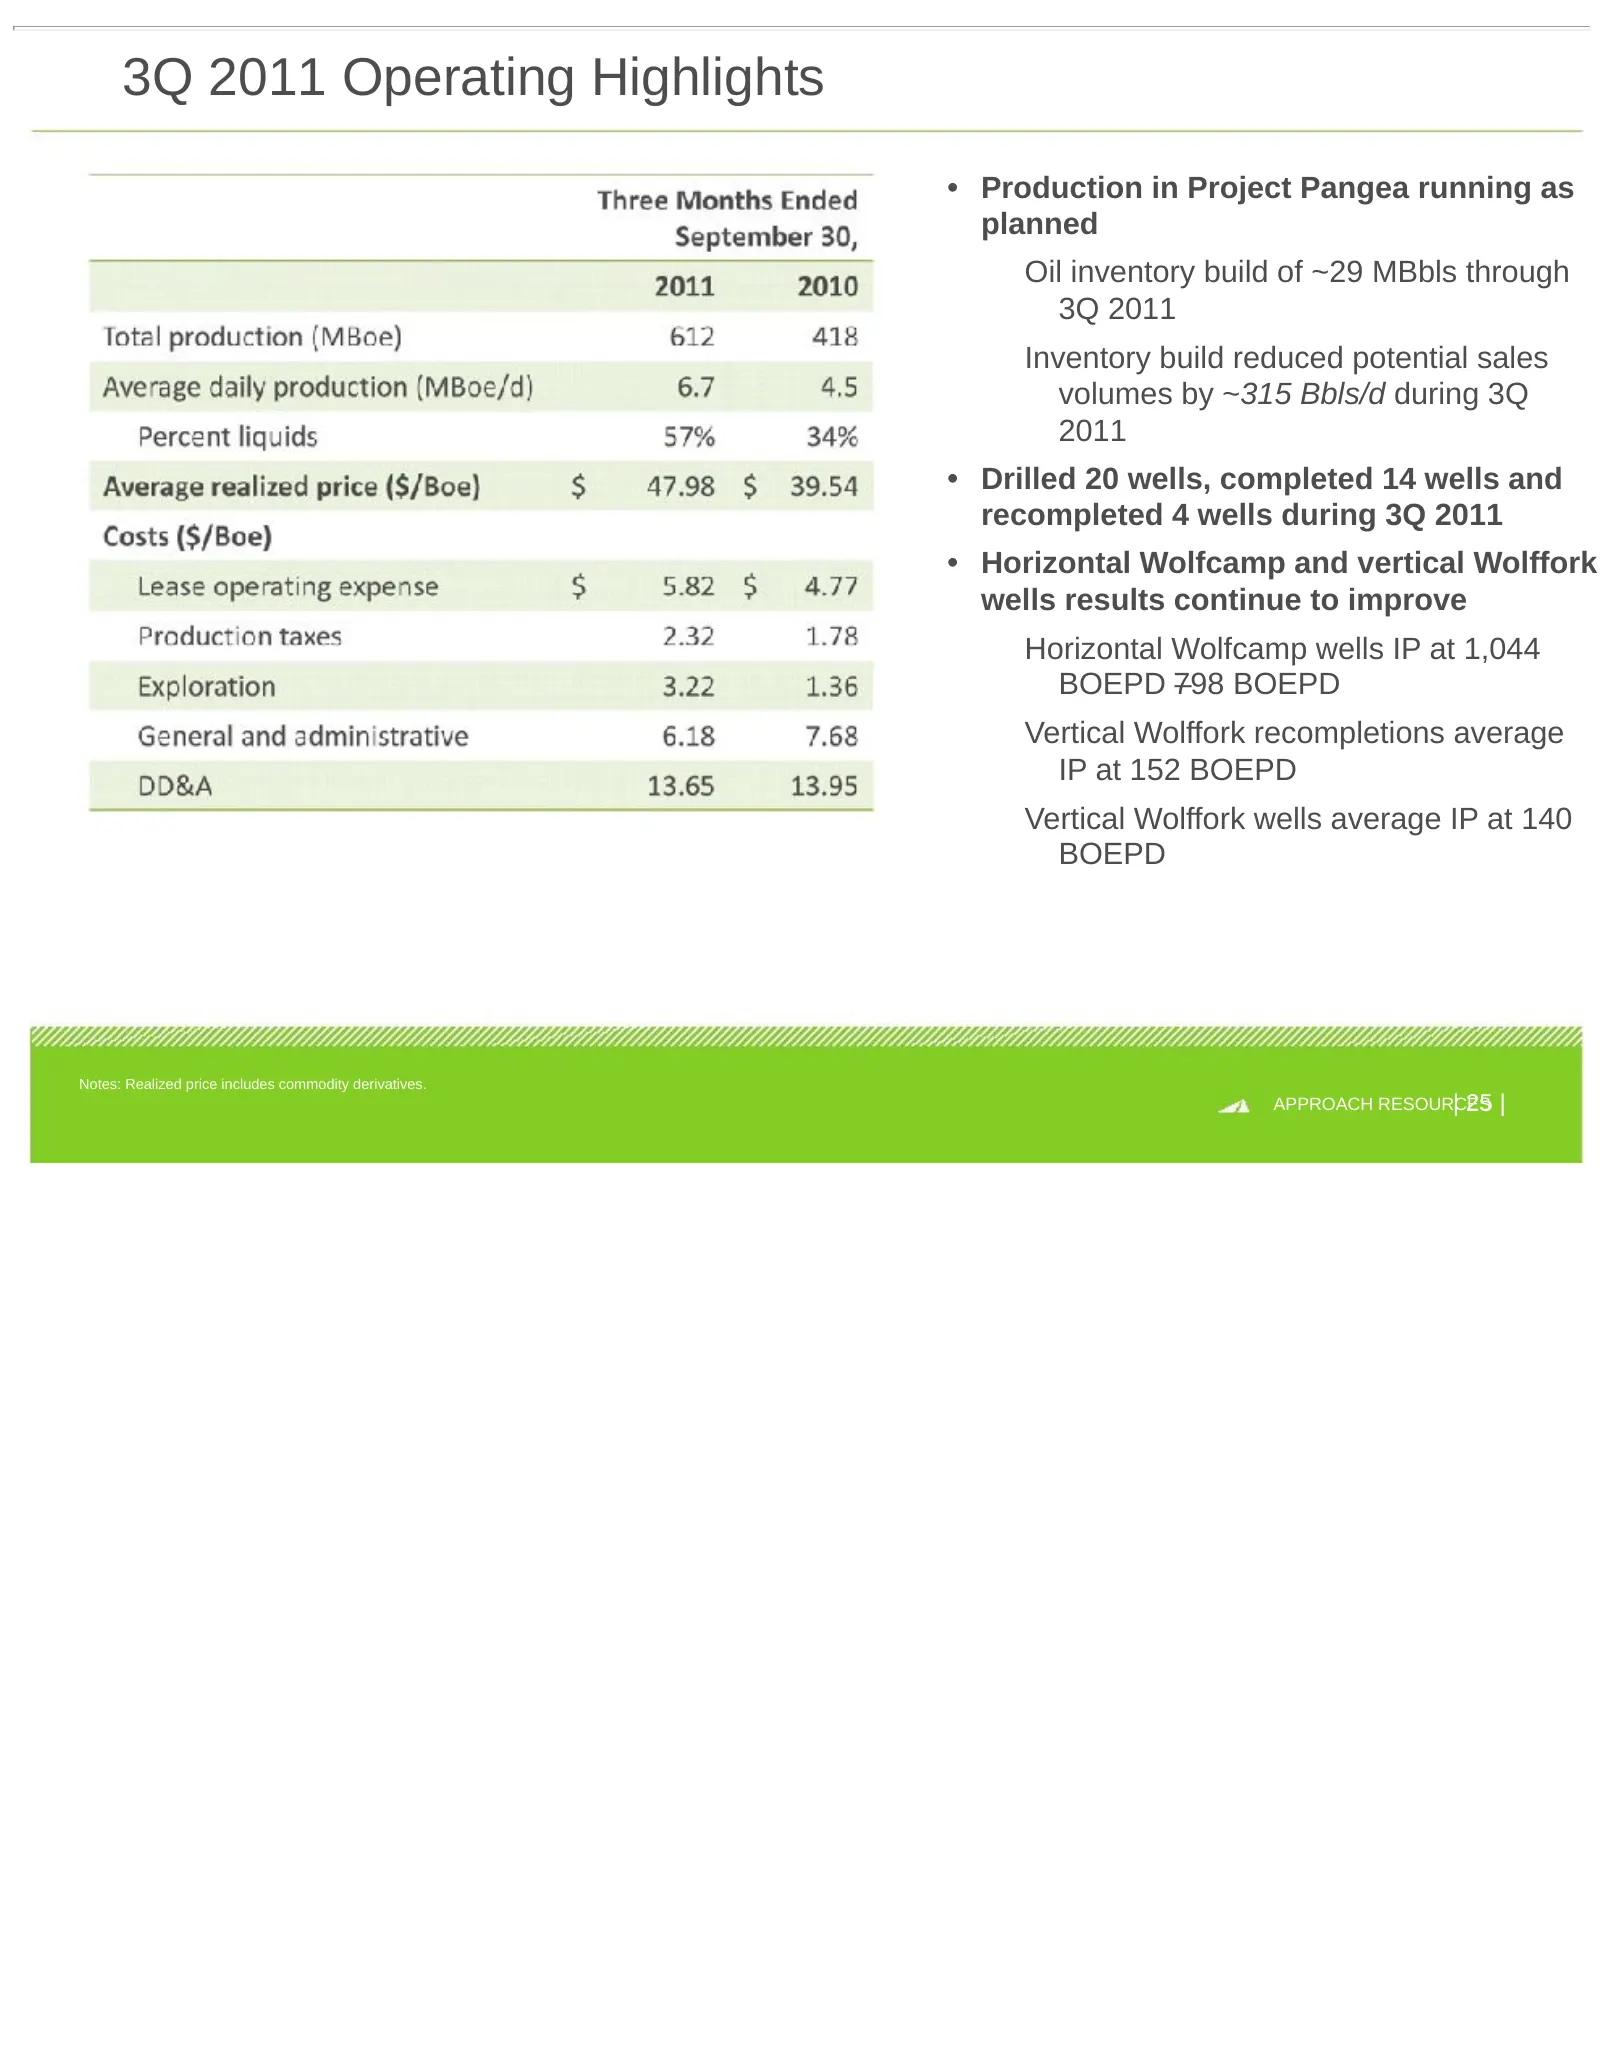
Slide 25: 3Q 2011 Operating Highlights
3Q 2011 Operating Highlights • Production in Project Pangea running as planned Oil inventory build of ~29 MBbls through 3Q 2011 Inventory build reduced potential sales volumes by ~315 Bbls/d during 3Q 2011 • Drilled 20 wells, completed 14 wells and recompleted 4 wells during 3Q 2011 • Horizontal Wol
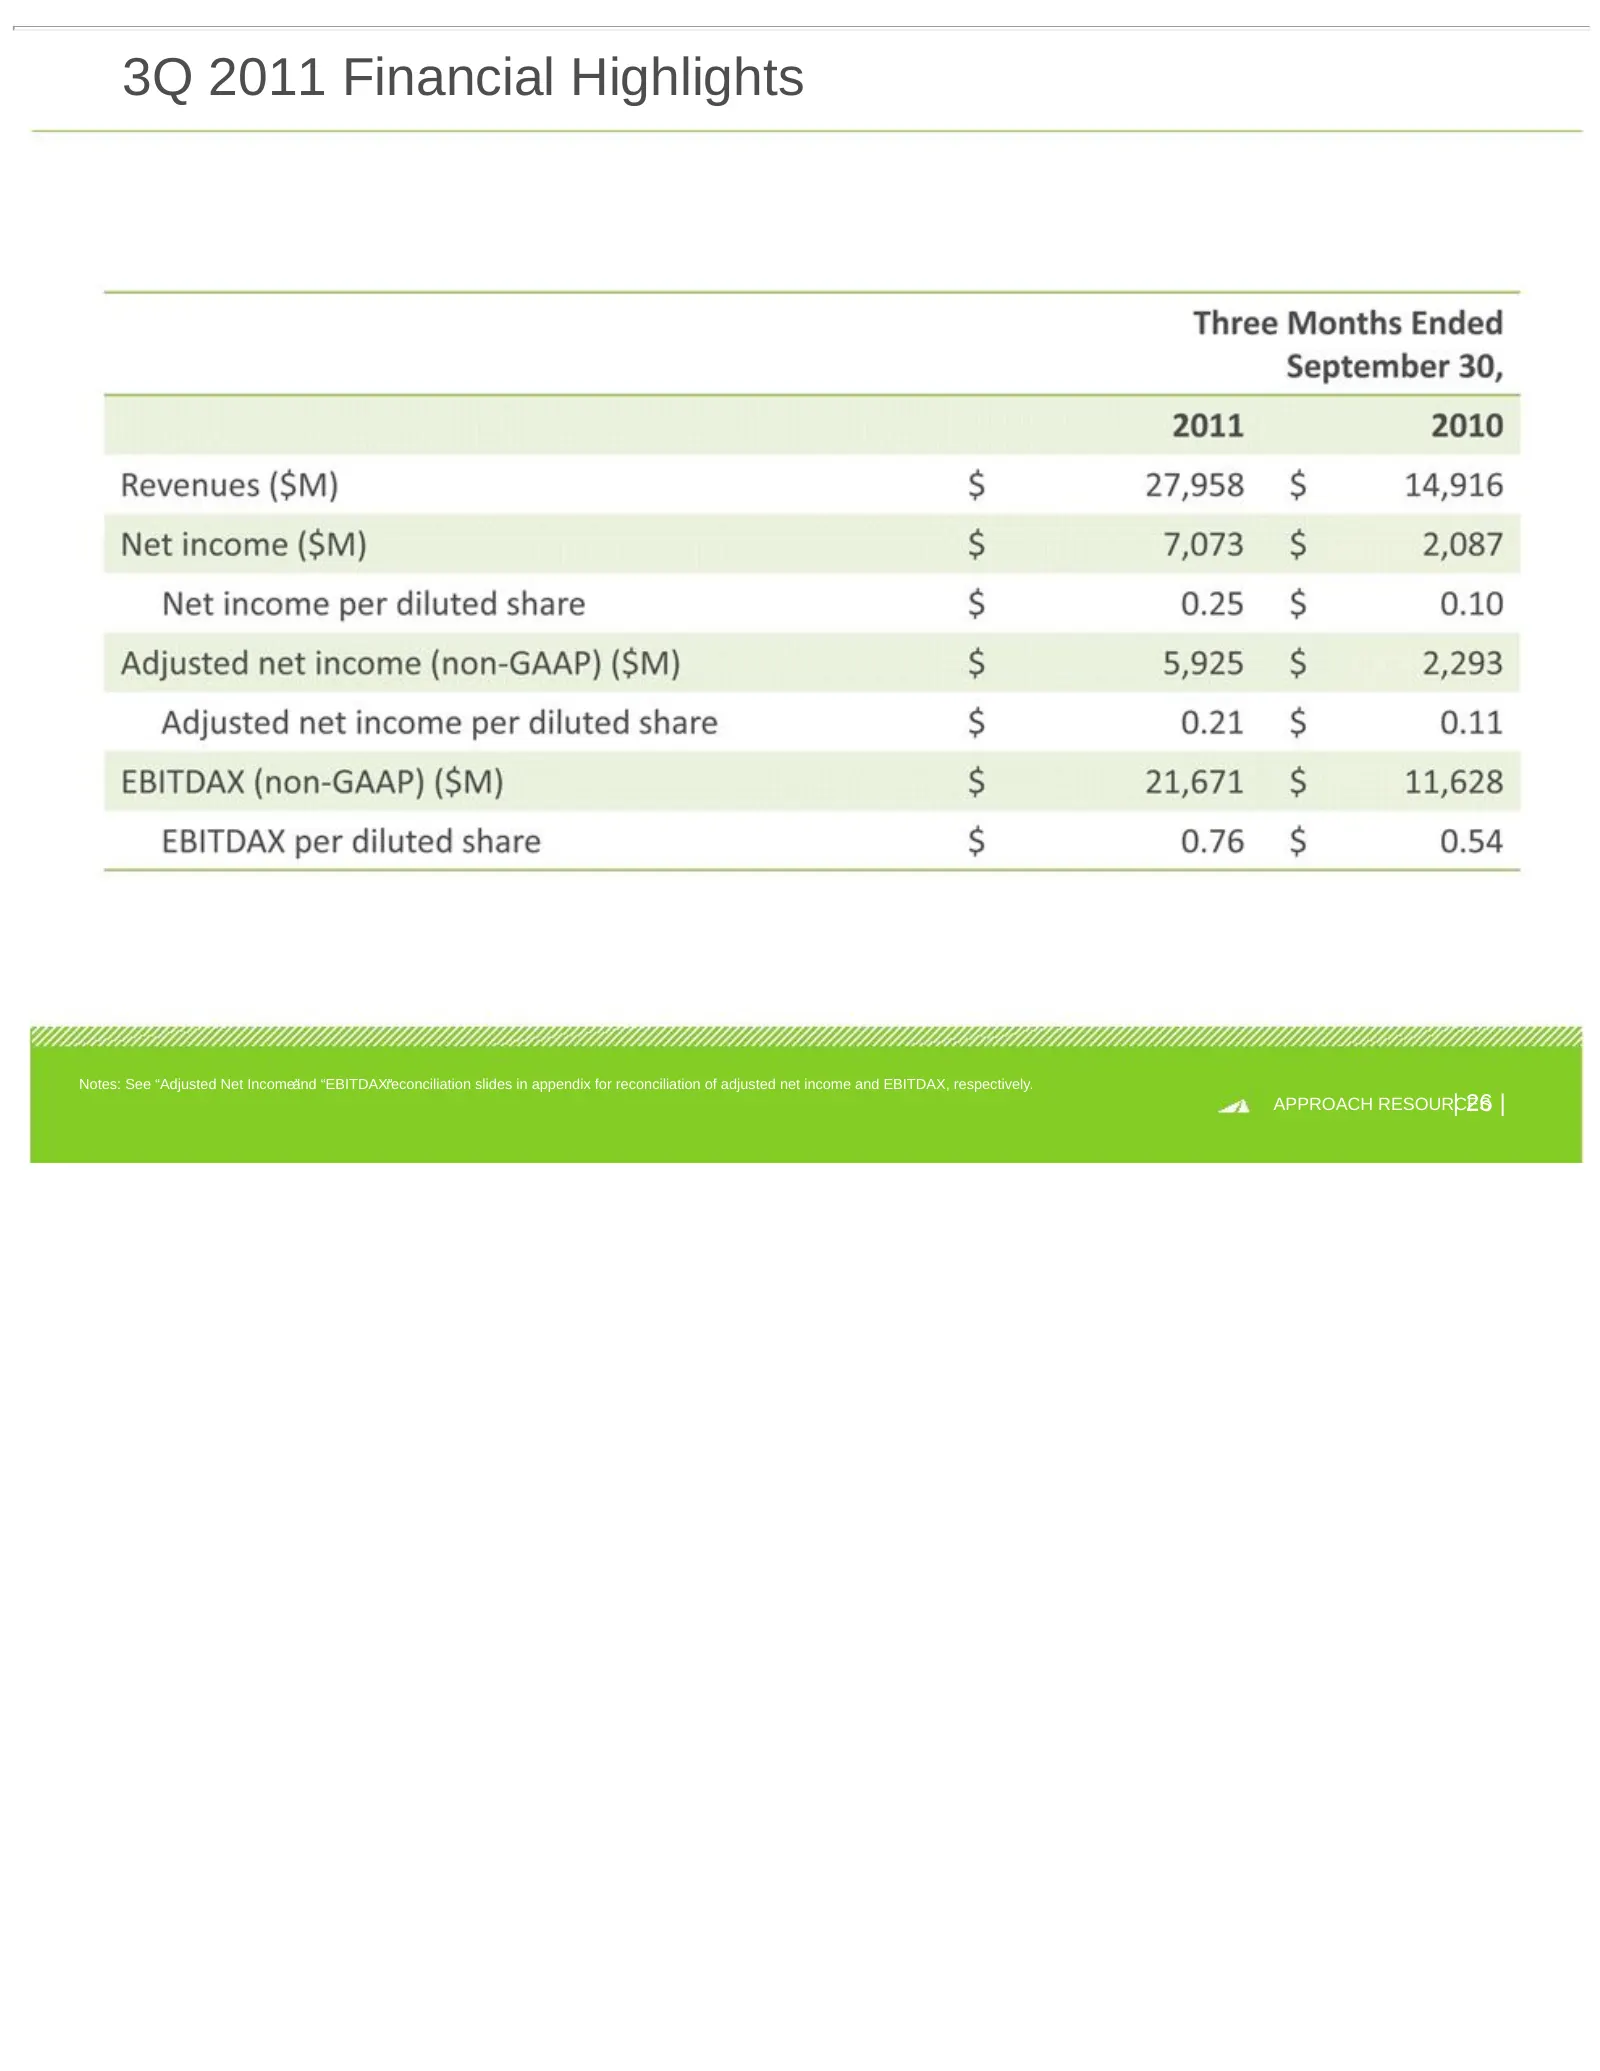
Slide 26: 3Q 2011 Financial Highlights
3Q 2011 Financial Highlights Notes: See “Adjusted Net Income” and “EBITDAX”reconciliation slides in appendix for reconciliation of adjusted net income and EBITDAX, respectively. | 26 | APPROACH RESOURCES
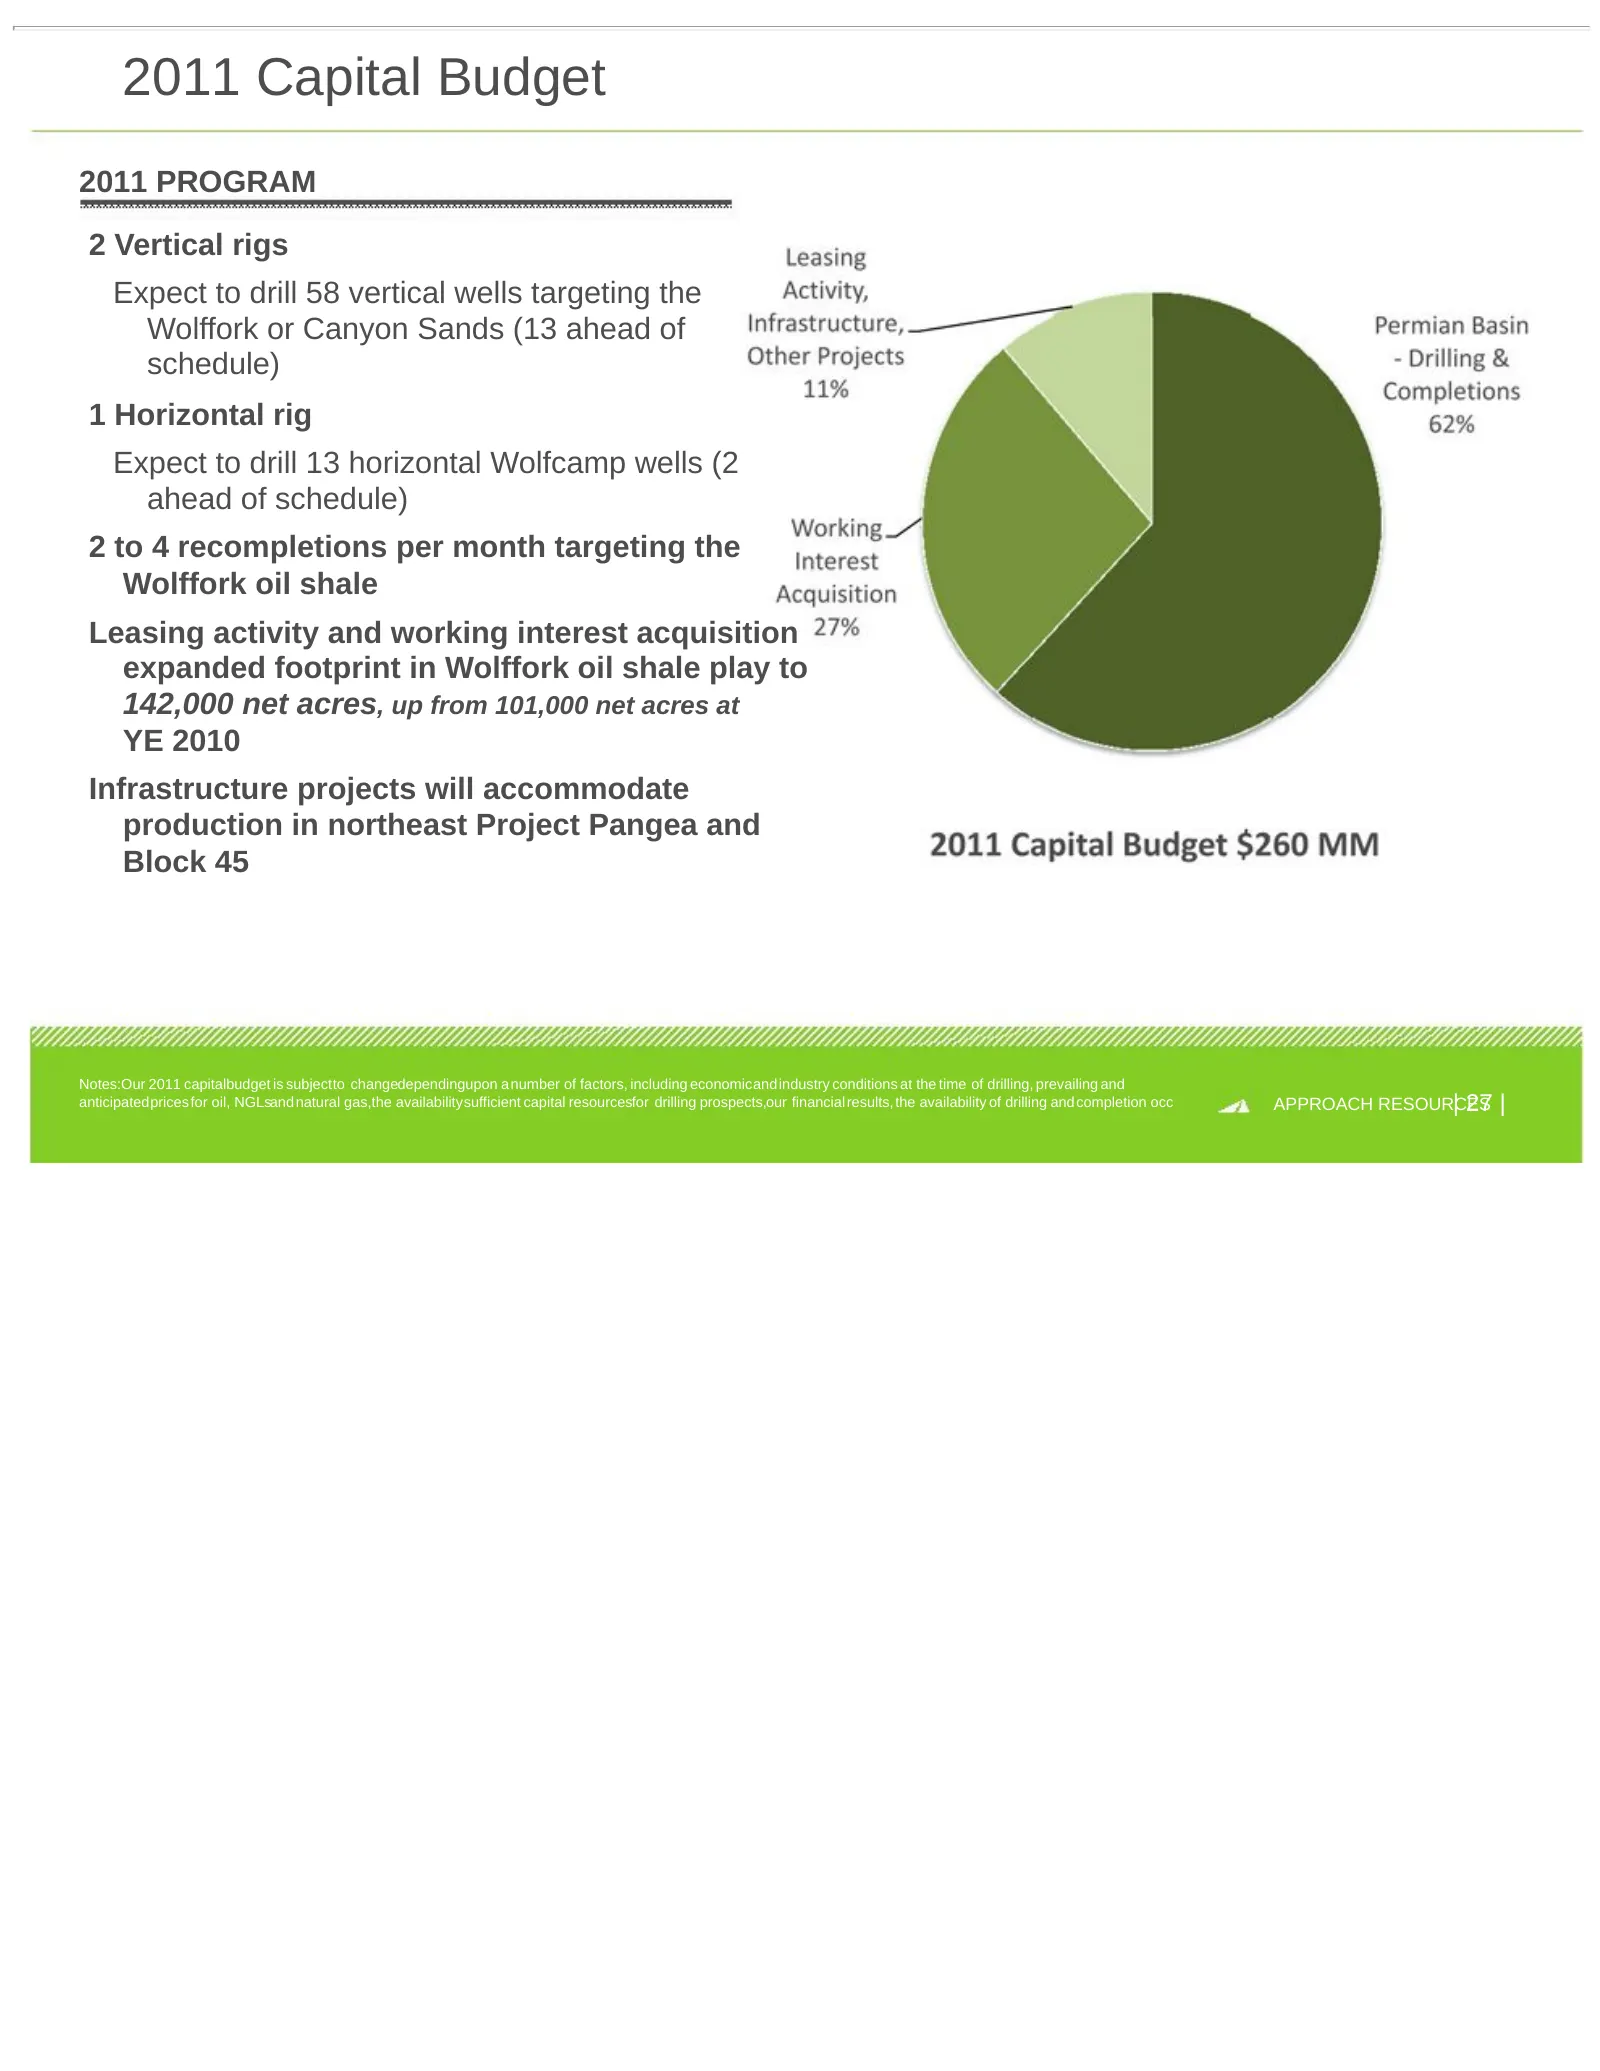
Slide 27: 2011 Capital Budget
2011 Capital Budget 2011 PROGRAM 2 Vertical rigs Expect to drill 58 vertical wells targeting the Wolffork or Canyon Sands (13 ahead of schedule) 1 Horizontal rig Expect to drill 13 horizontal Wolfcamp wells (2 ahead of schedule) 2 to 4 recompletions per month targeting the Wolffork oil shale Leasing
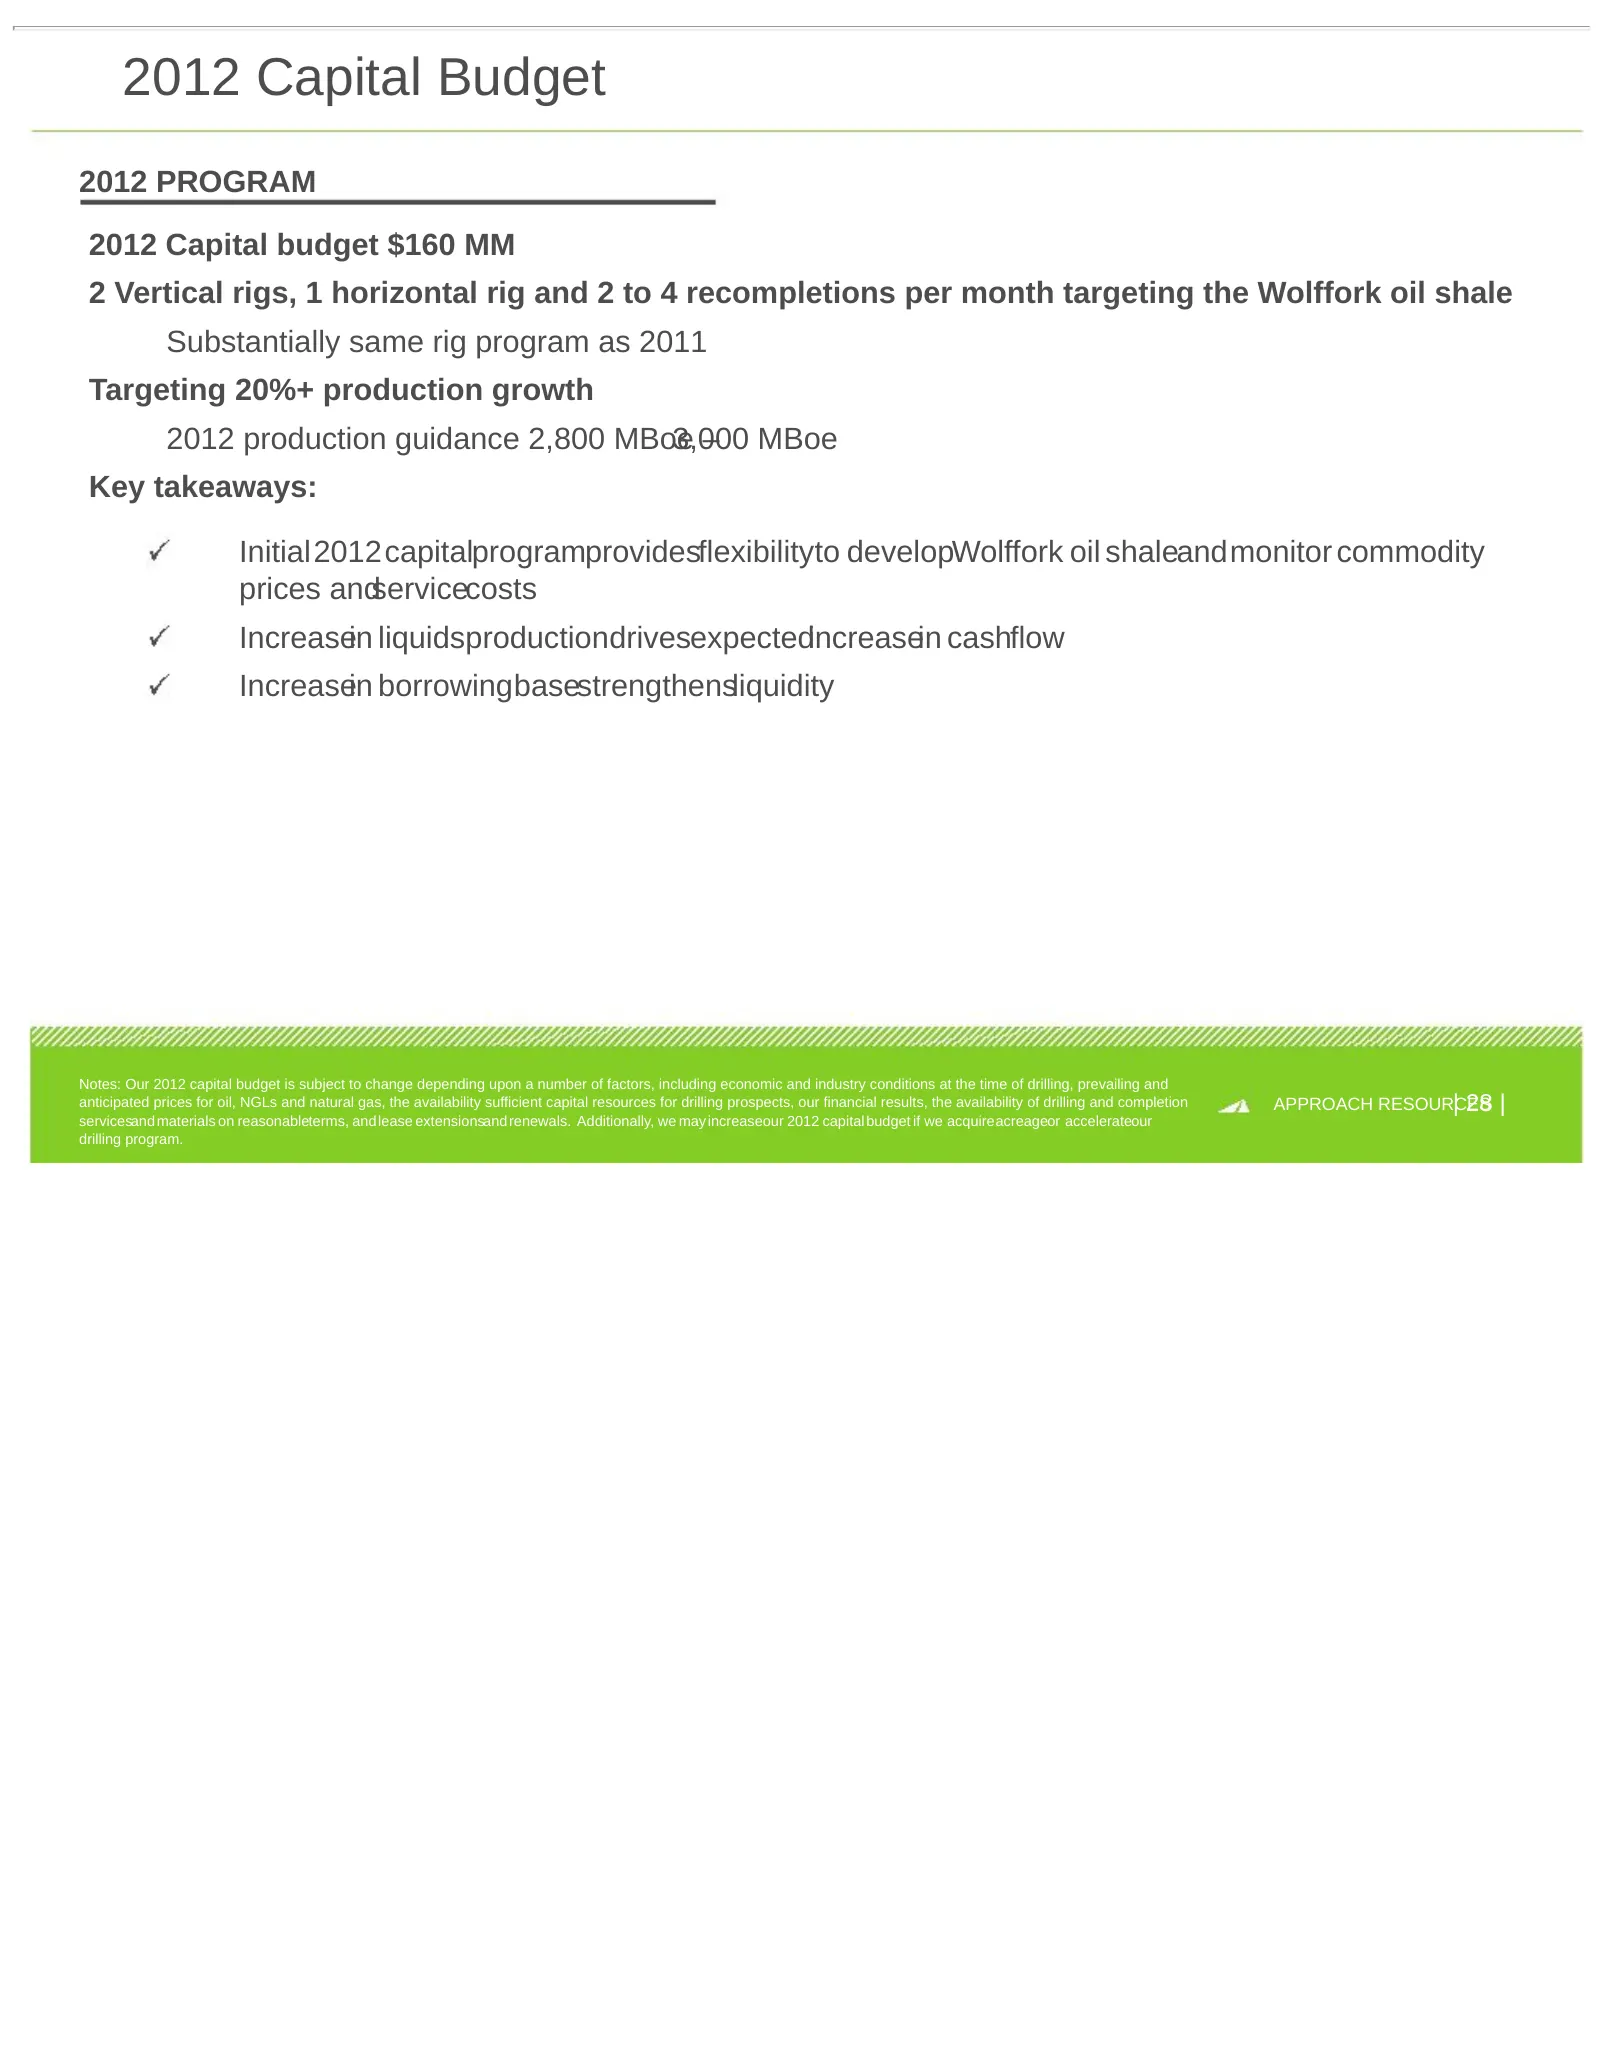
Slide 28: 2012 Capital Budget
2012 Capital Budget 2012 PROGRAM 2012 Capital budget $160 MM 2 Vertical rigs, 1 horizontal rig and 2 to 4 recompletions per month targeting the Wolffork oil shale Substantially same rig program as 2011 Targeting 20%+ production growth 2012 production guidance 2,800 MBoe 3,000 – MBoe Key takeaways: I
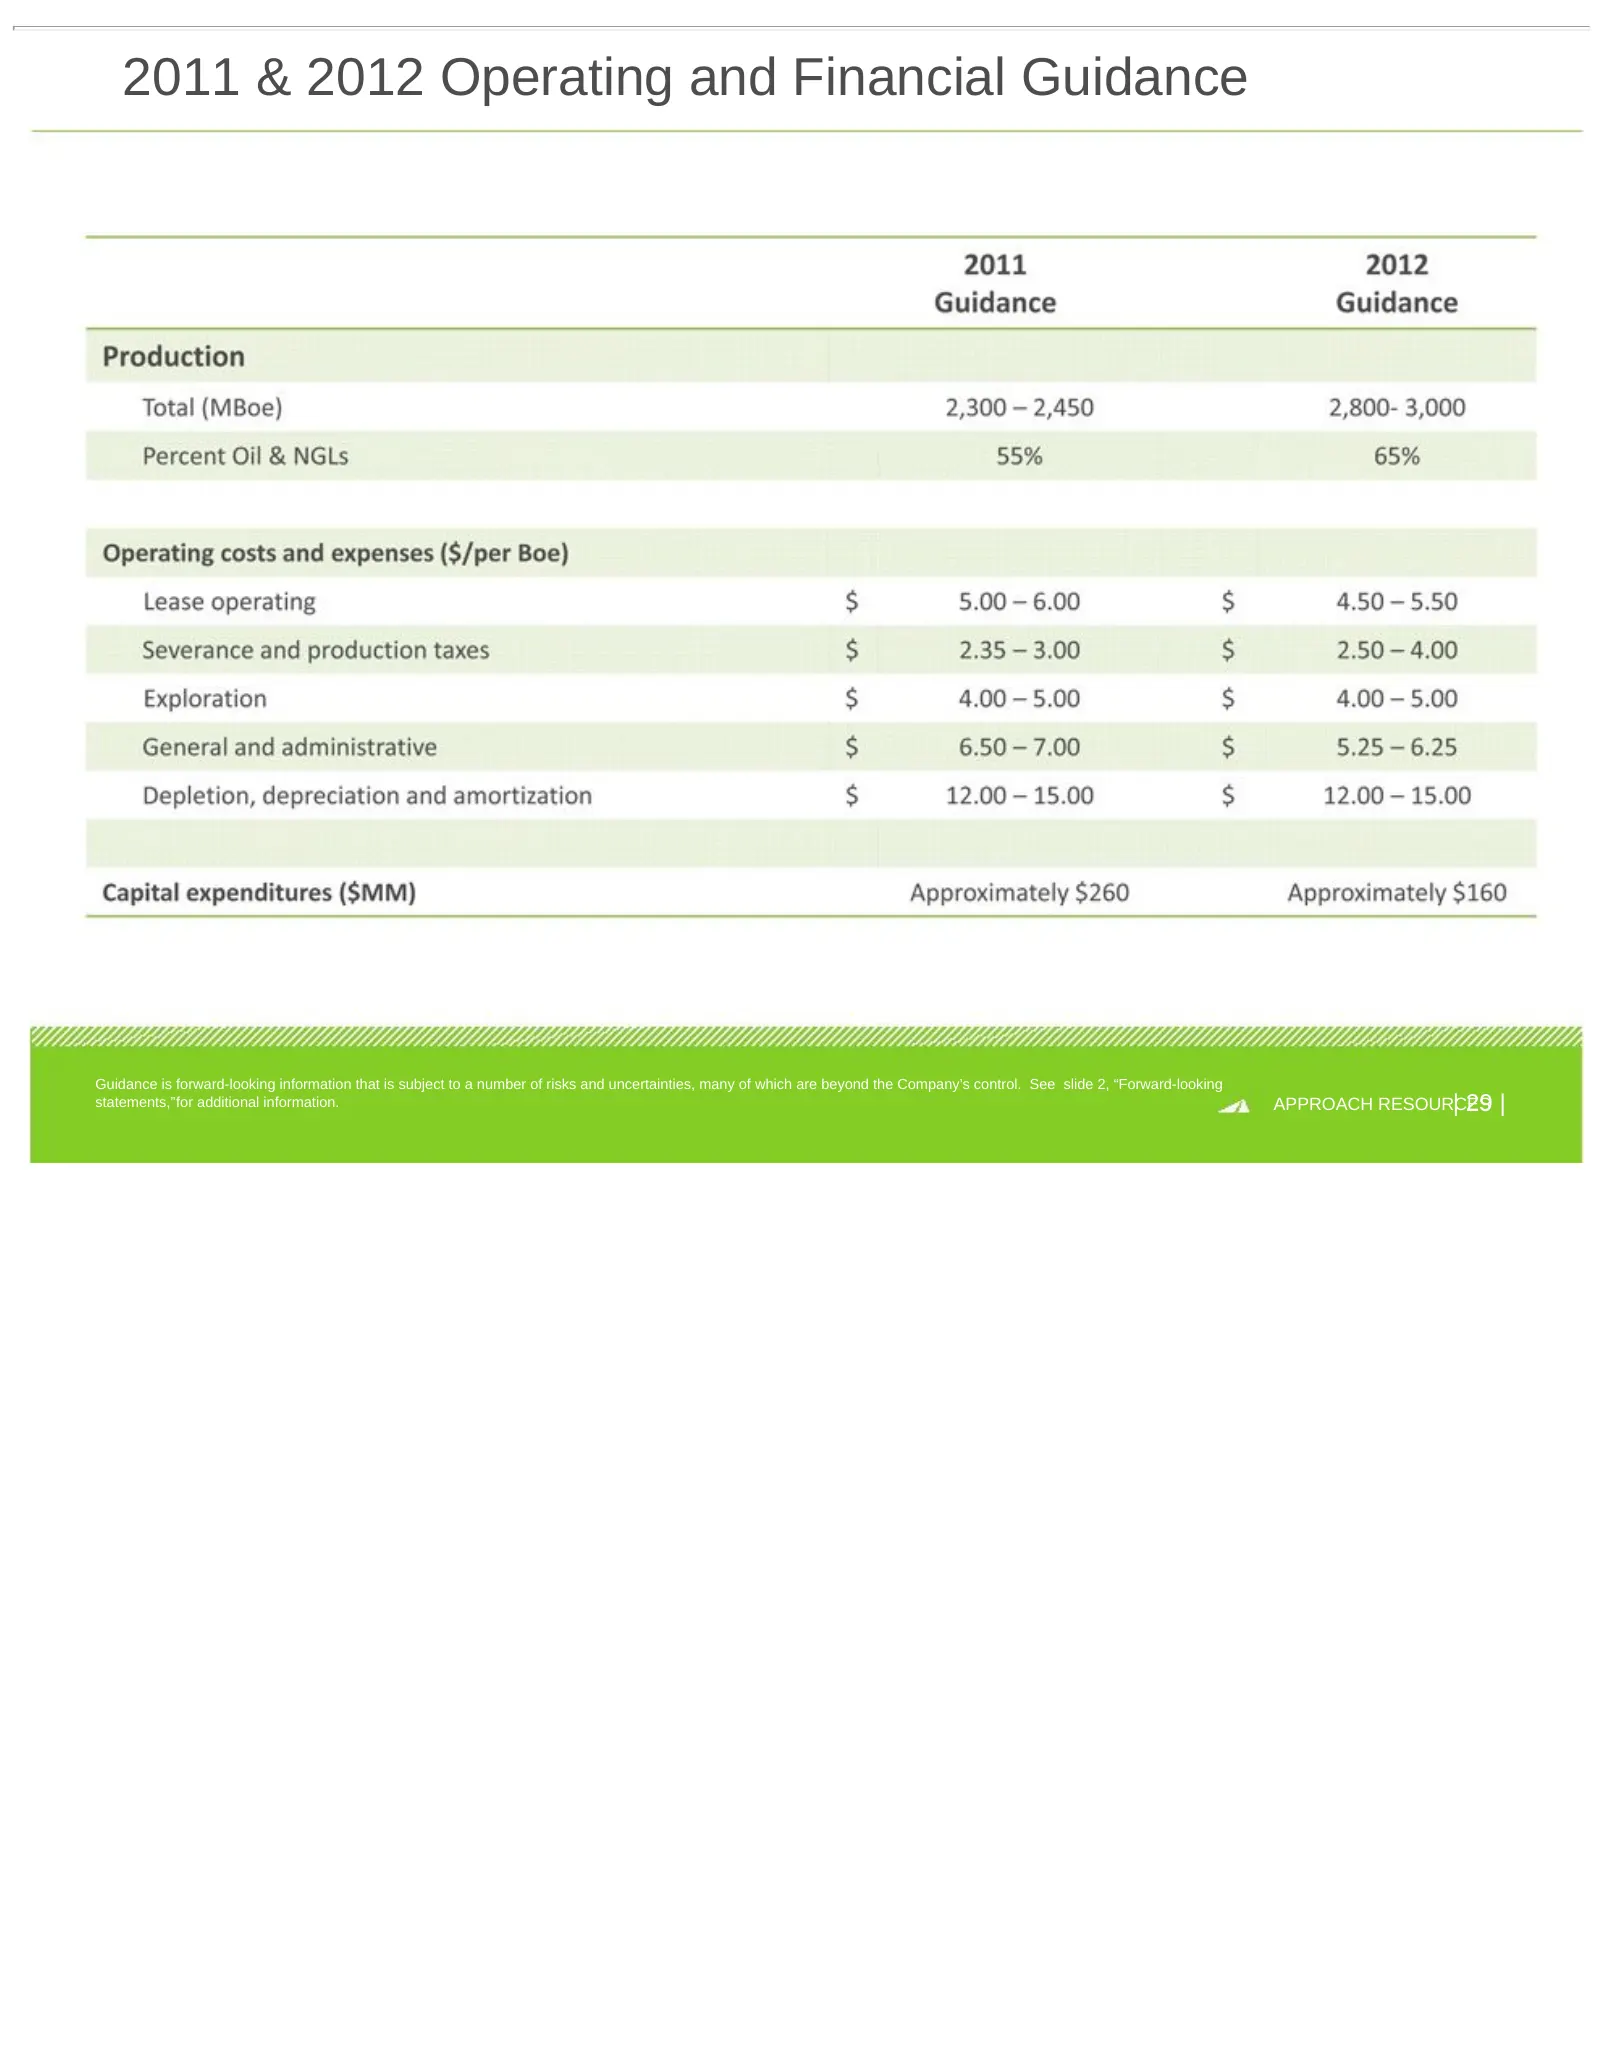
Slide 29: 2011 & 2012 Operating and Financial Guidance
2011 & 2012 Operating and Financial Guidance Guidance is forward-looking information that is subject to a number of risks and uncertainties, many of which are beyond the Company’s control. See slide 2, “Forward-looking statements,”for additional information. | 29 | APPROACH RESOURCES
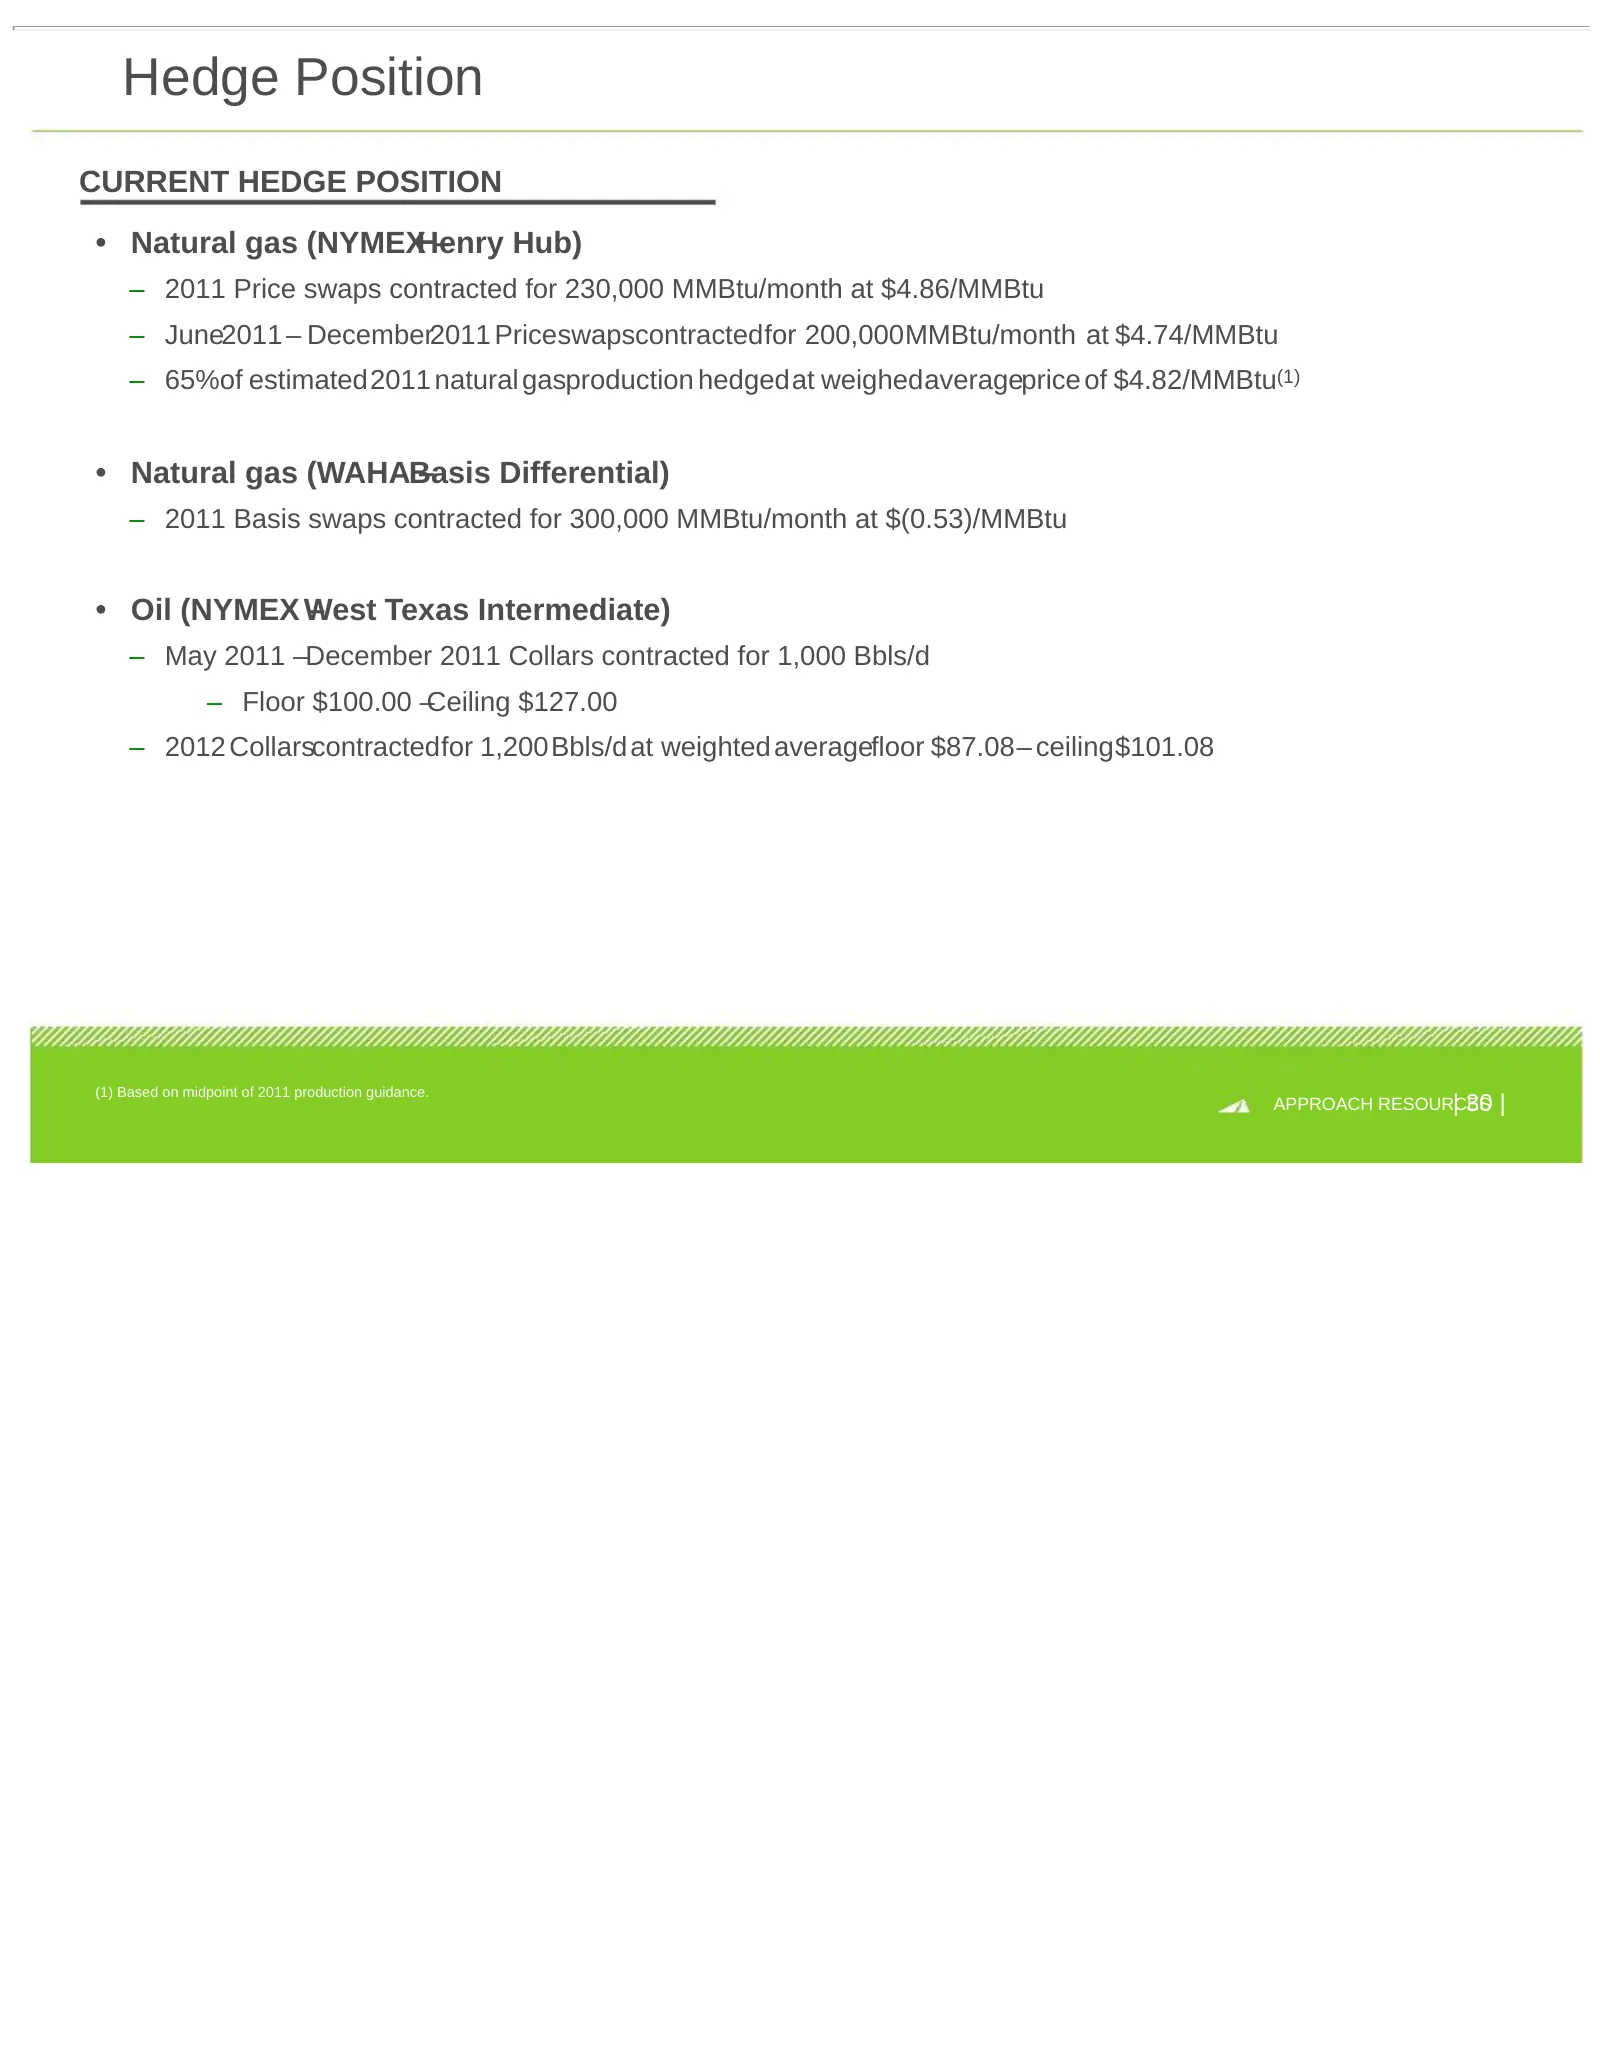
Slide 30: Hedge Position
Hedge Position CURRENT HEDGE POSITION • Natural gas (NYMEXHenry – Hub) – 2011 Price swaps contracted for 230,000 MMBtu/month at $4.86/MMBtu – June2011 – December2011 Priceswapscontractedfor 200,000MMBtu/month at $4.74/MMBtu – 65%of estimated2011 natural gasproduction hedgedat weighedaverageprice of
Slide 31: Appendix
Appendix NON-GAAP RECONCILIATIONS APPROACH RESOURCES
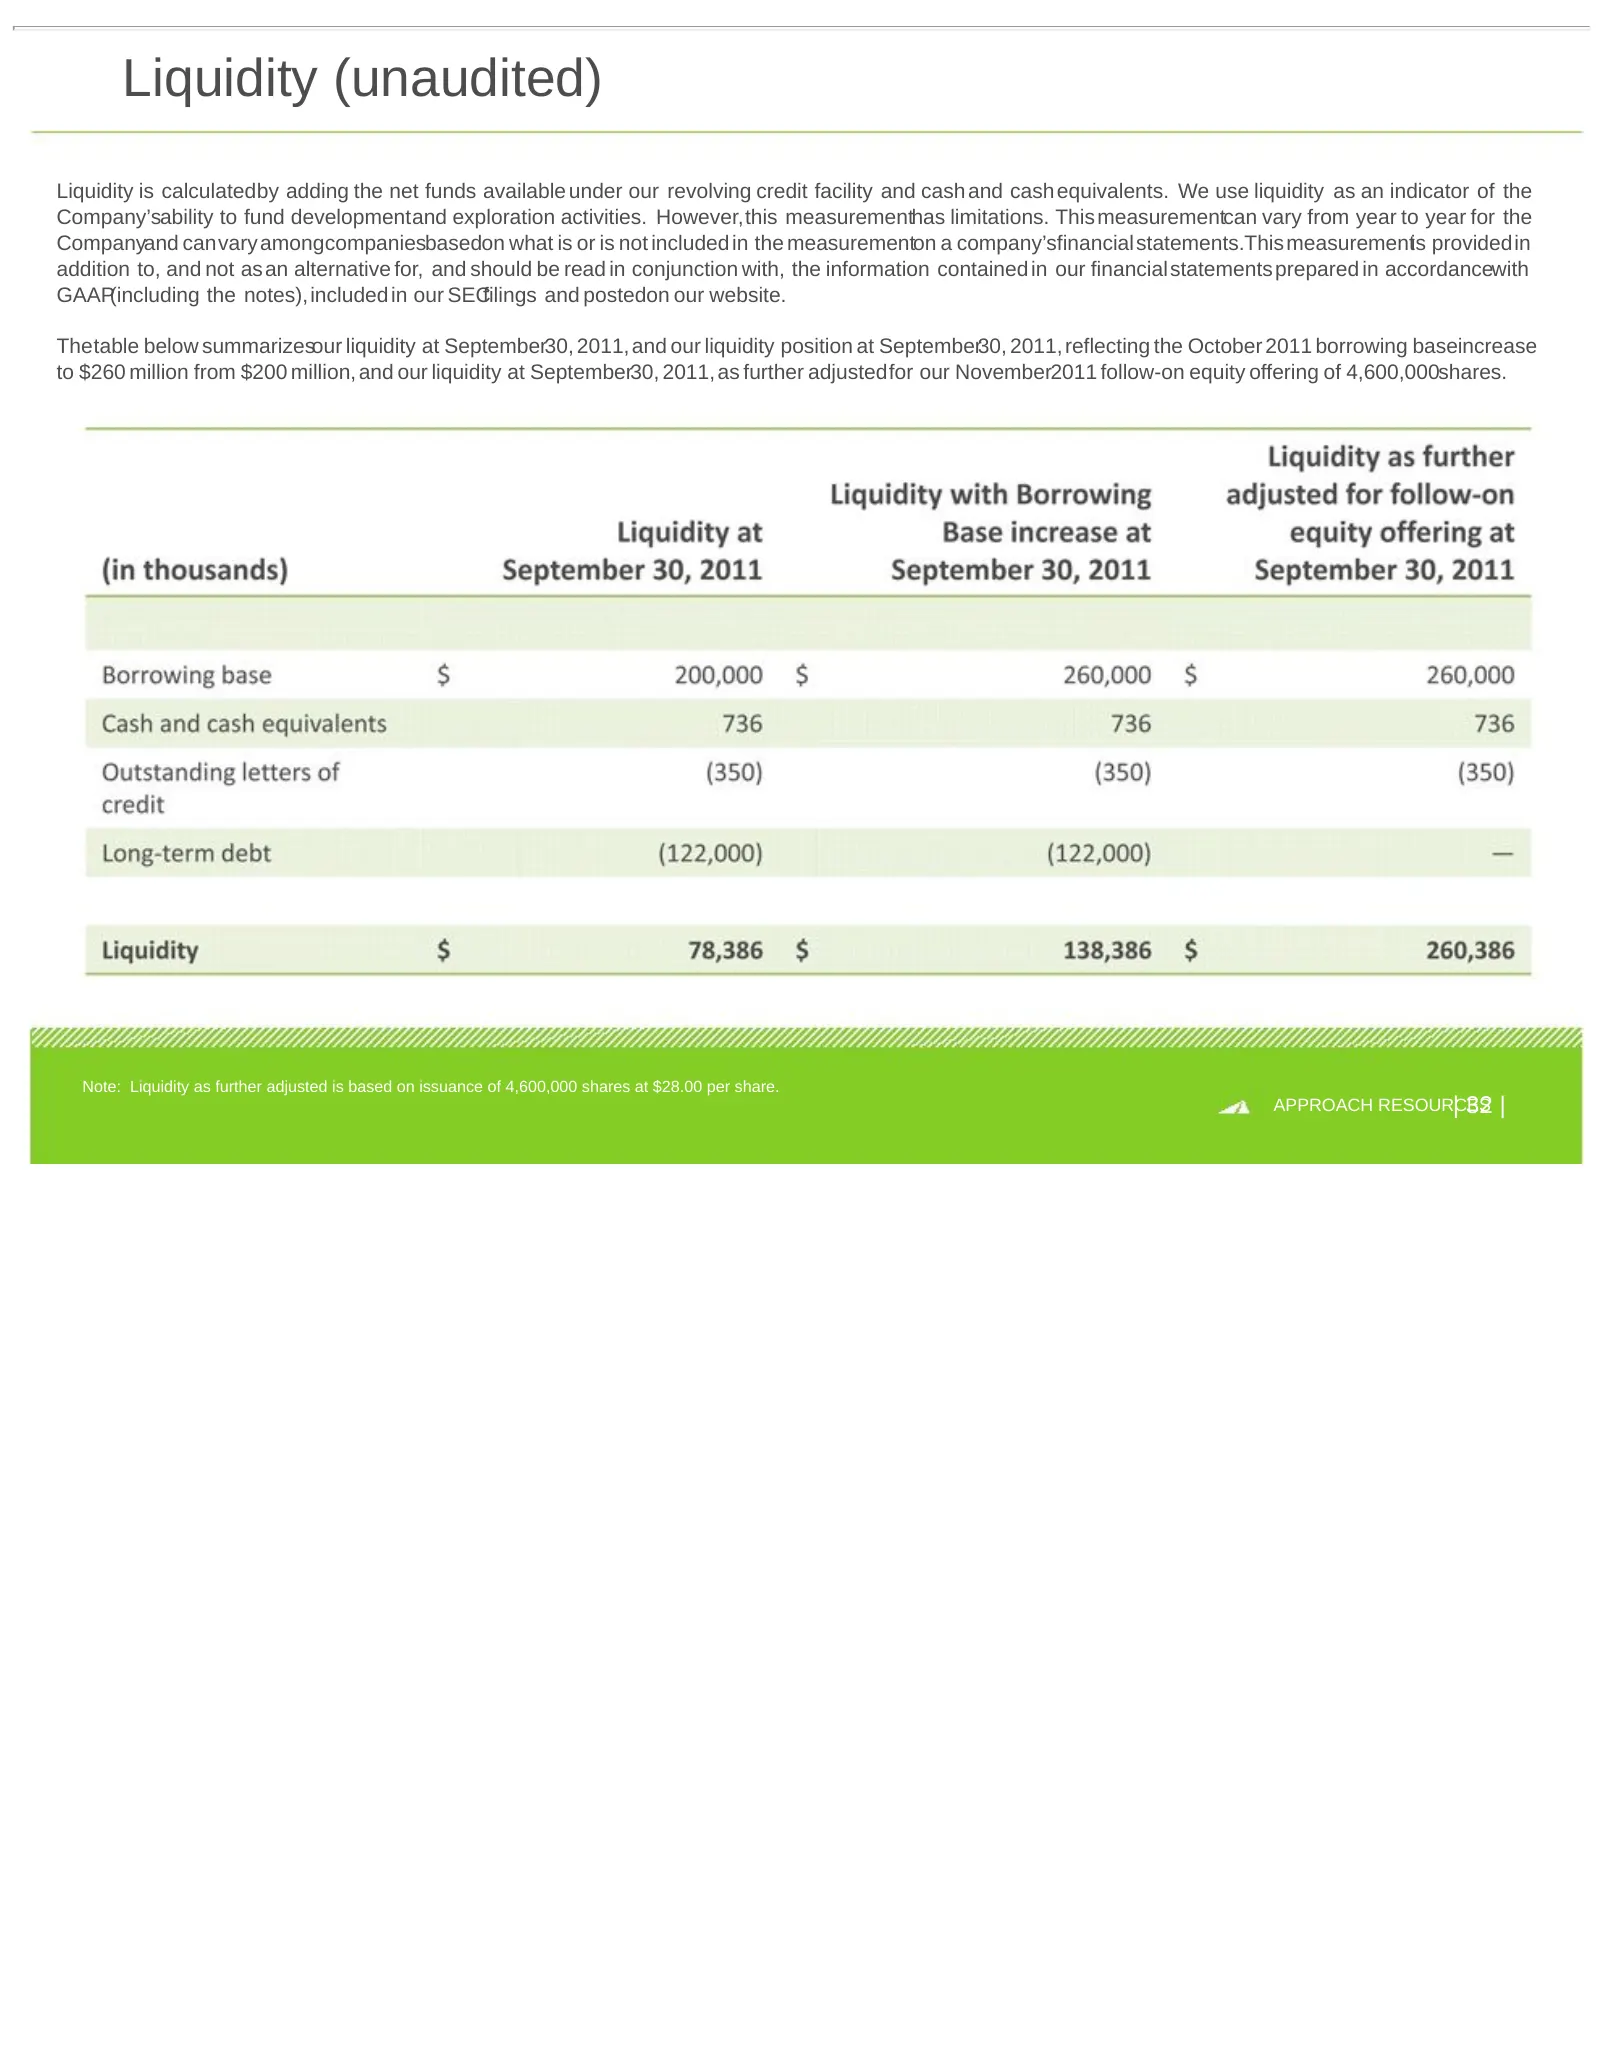
Slide 32: Liquidity (unaudited)
Liquidity (unaudited) Liquidity is calculatedby adding the net funds available under our revolving credit facility and cash and cash equivalents. We use liquidity as an indicator of the Company’sability to fund developmentand exploration activities. However,this measurementhas limitations. This meas
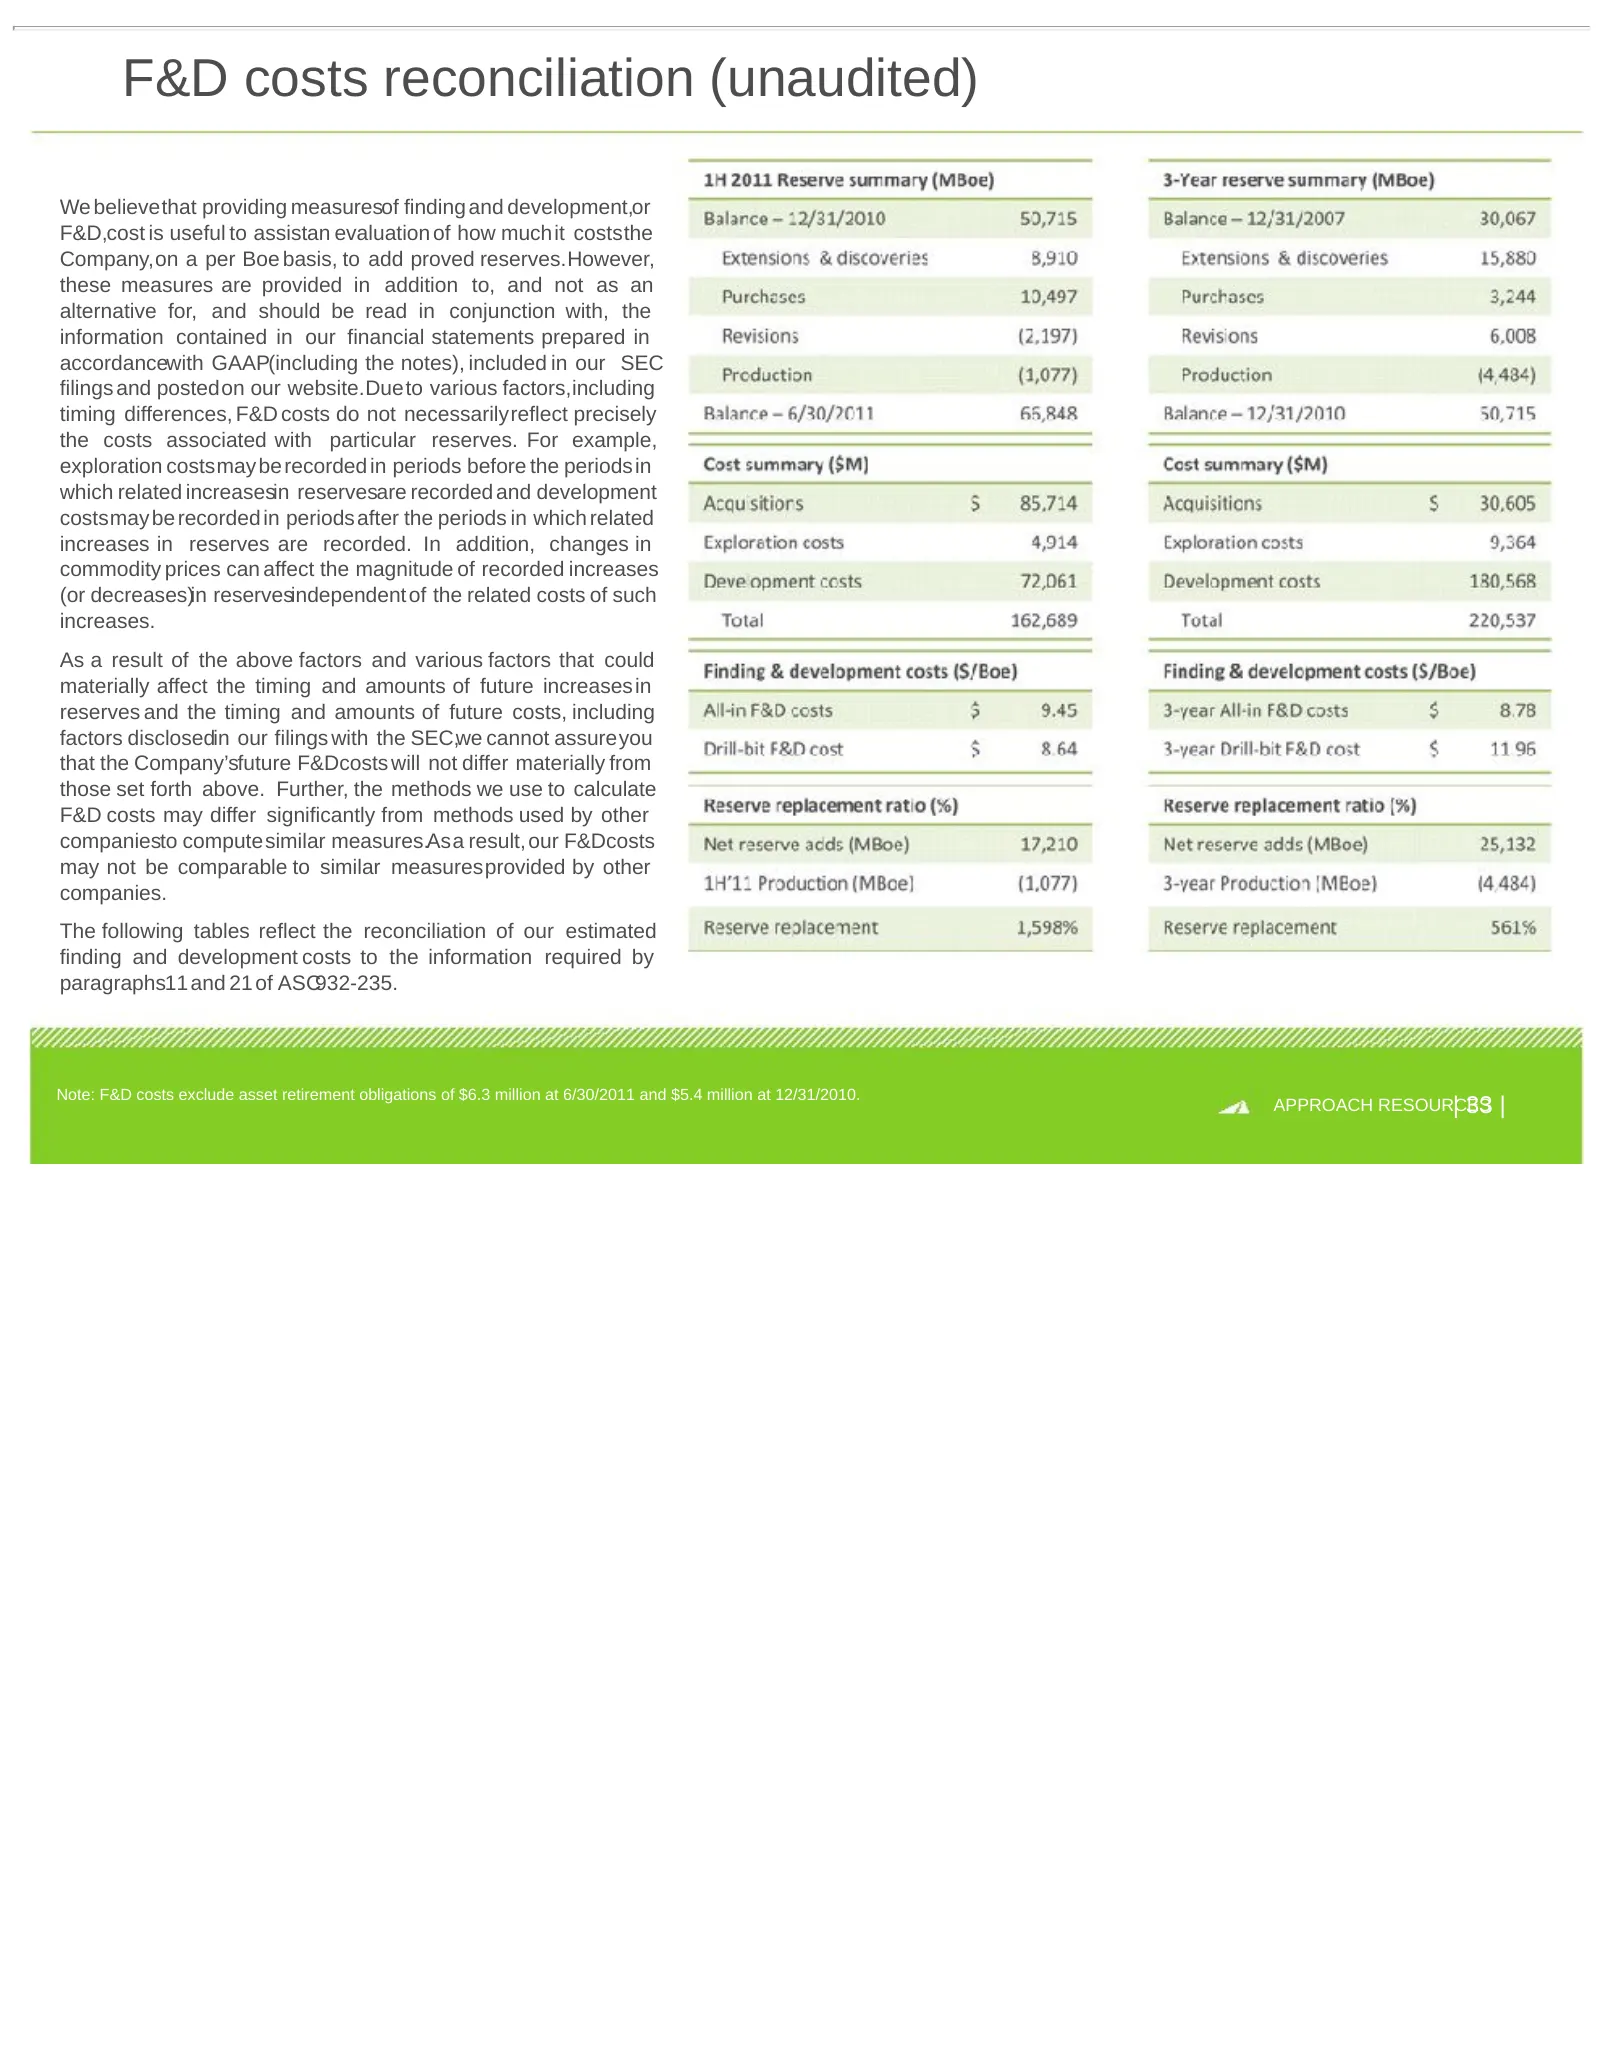
Slide 33: F&D costs reconciliation (unaudited)
F&D costs reconciliation (unaudited) We believethat providing measuresof finding and development,or F&D,cost is useful to assistan evaluation of how muchit coststhe Company,on a per Boe basis, to add proved reserves.However, these measures are provided in addition to, and not as an alternative for,
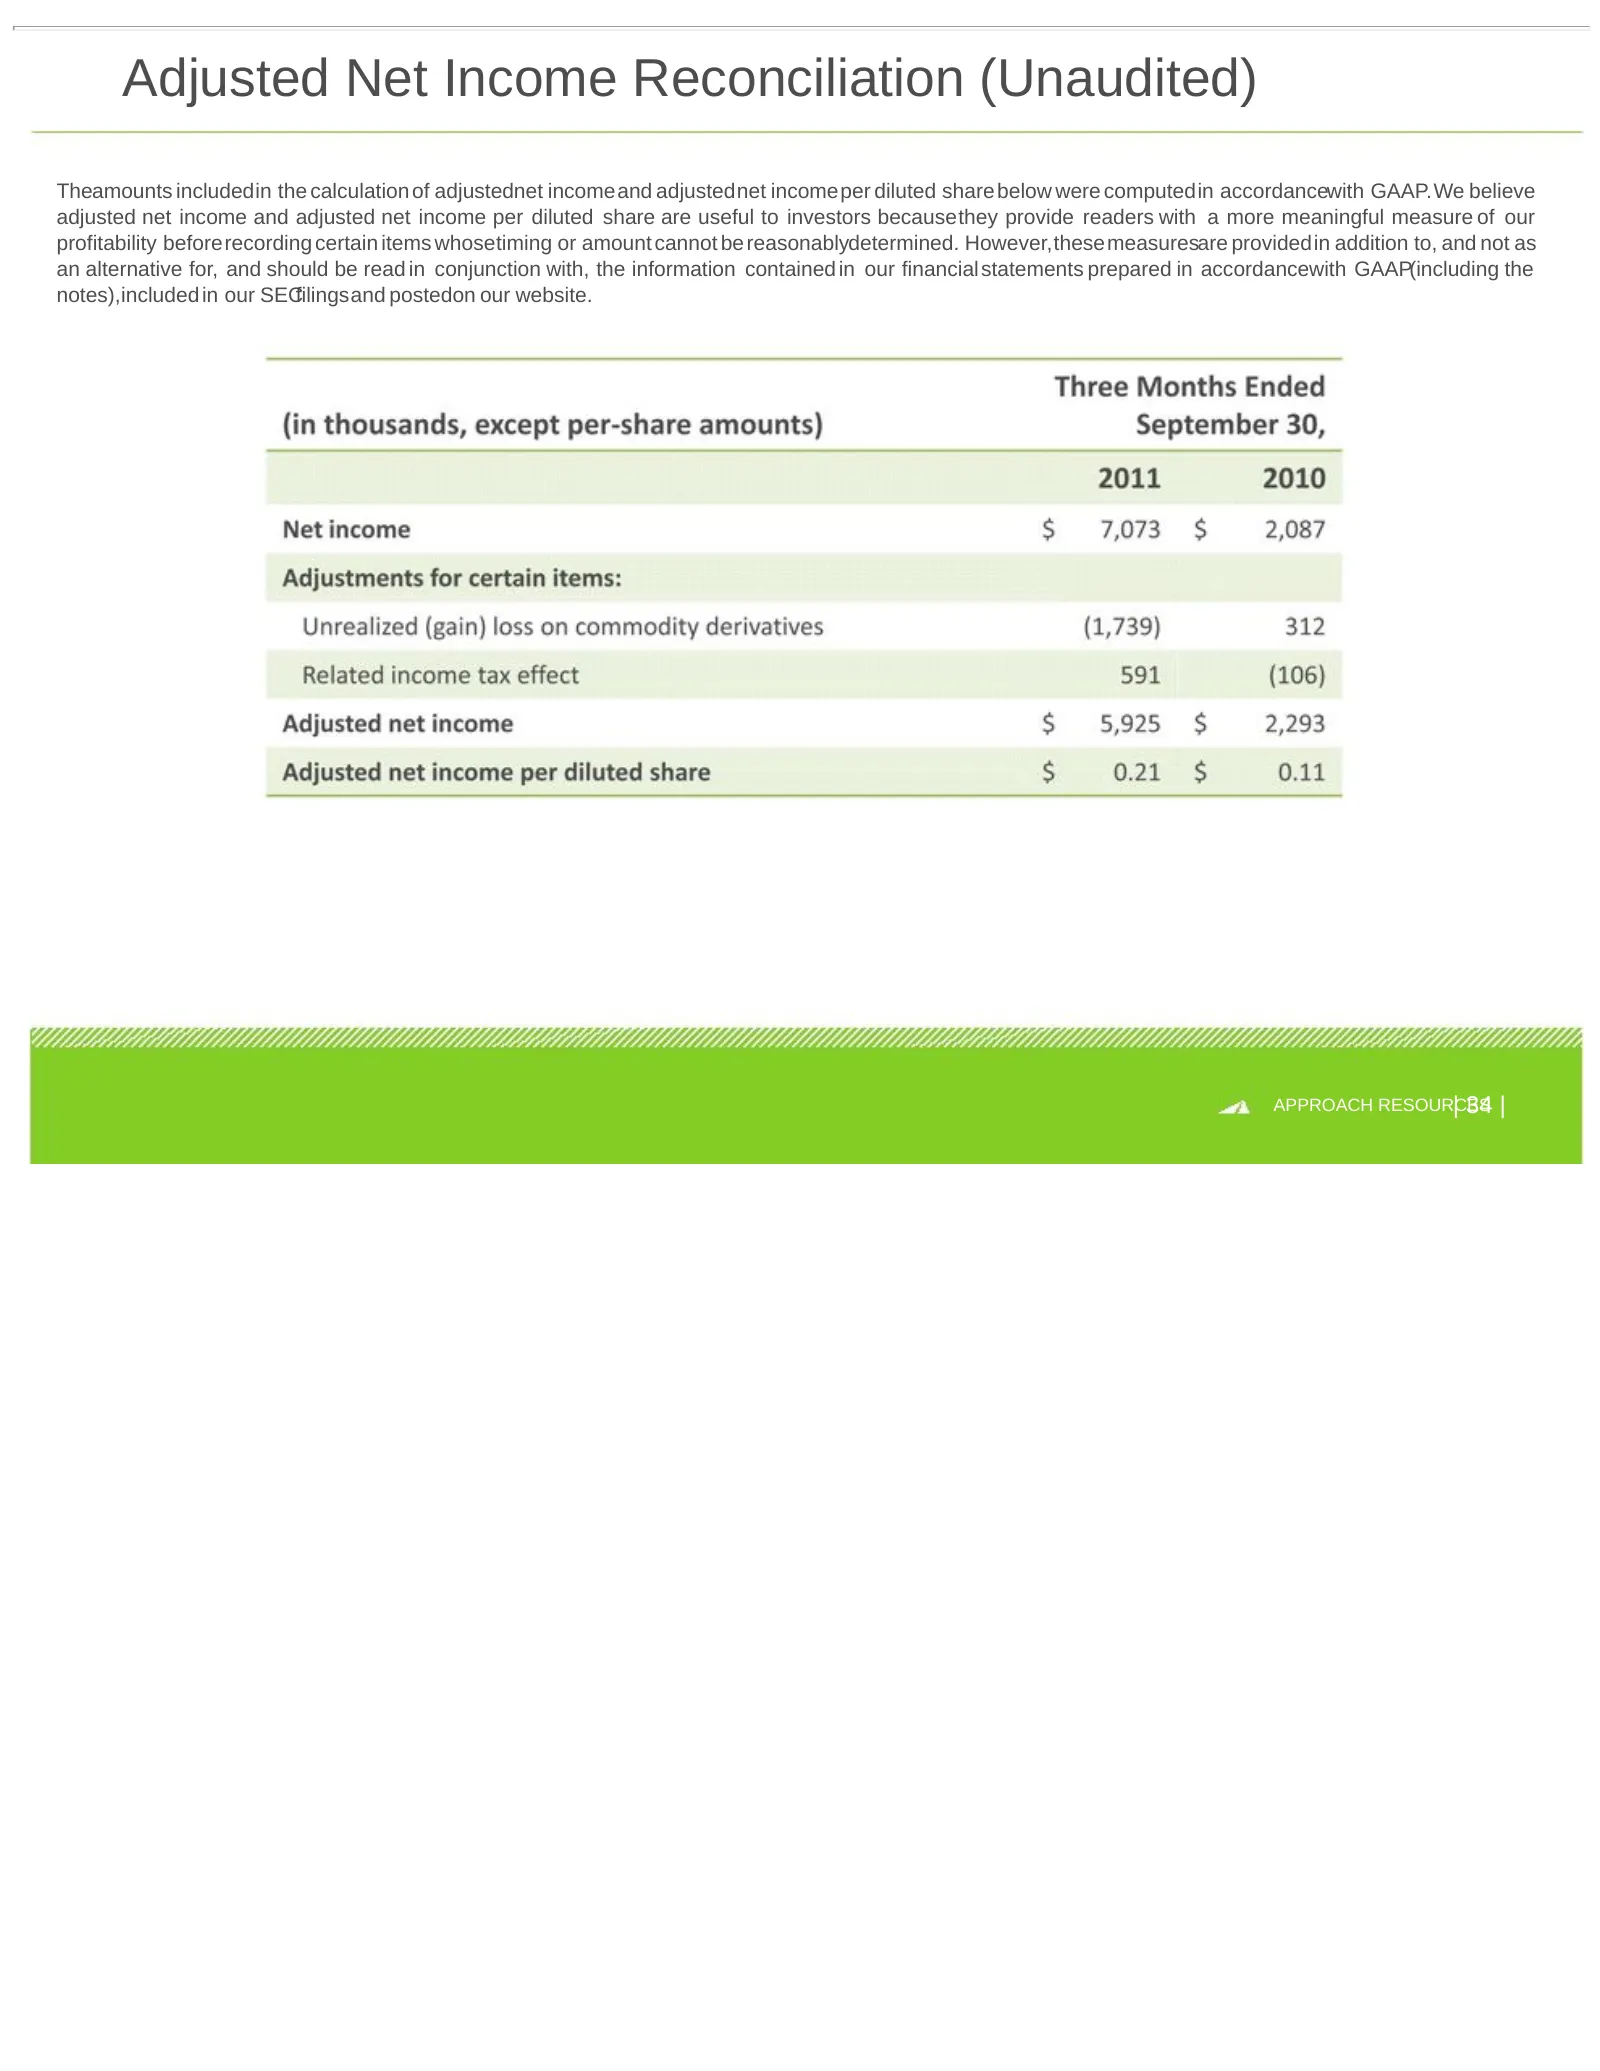
Slide 34: Adjusted Net Income Reconciliation (Unaudited)
Adjusted Net Income Reconciliation (Unaudited) Theamounts includedin the calculation of adjustednet incomeand adjustednet incomeper diluted share below were computedin accordancewith GAAP.We believe adjusted net income and adjusted net income per diluted share are useful to investors becausethey pro
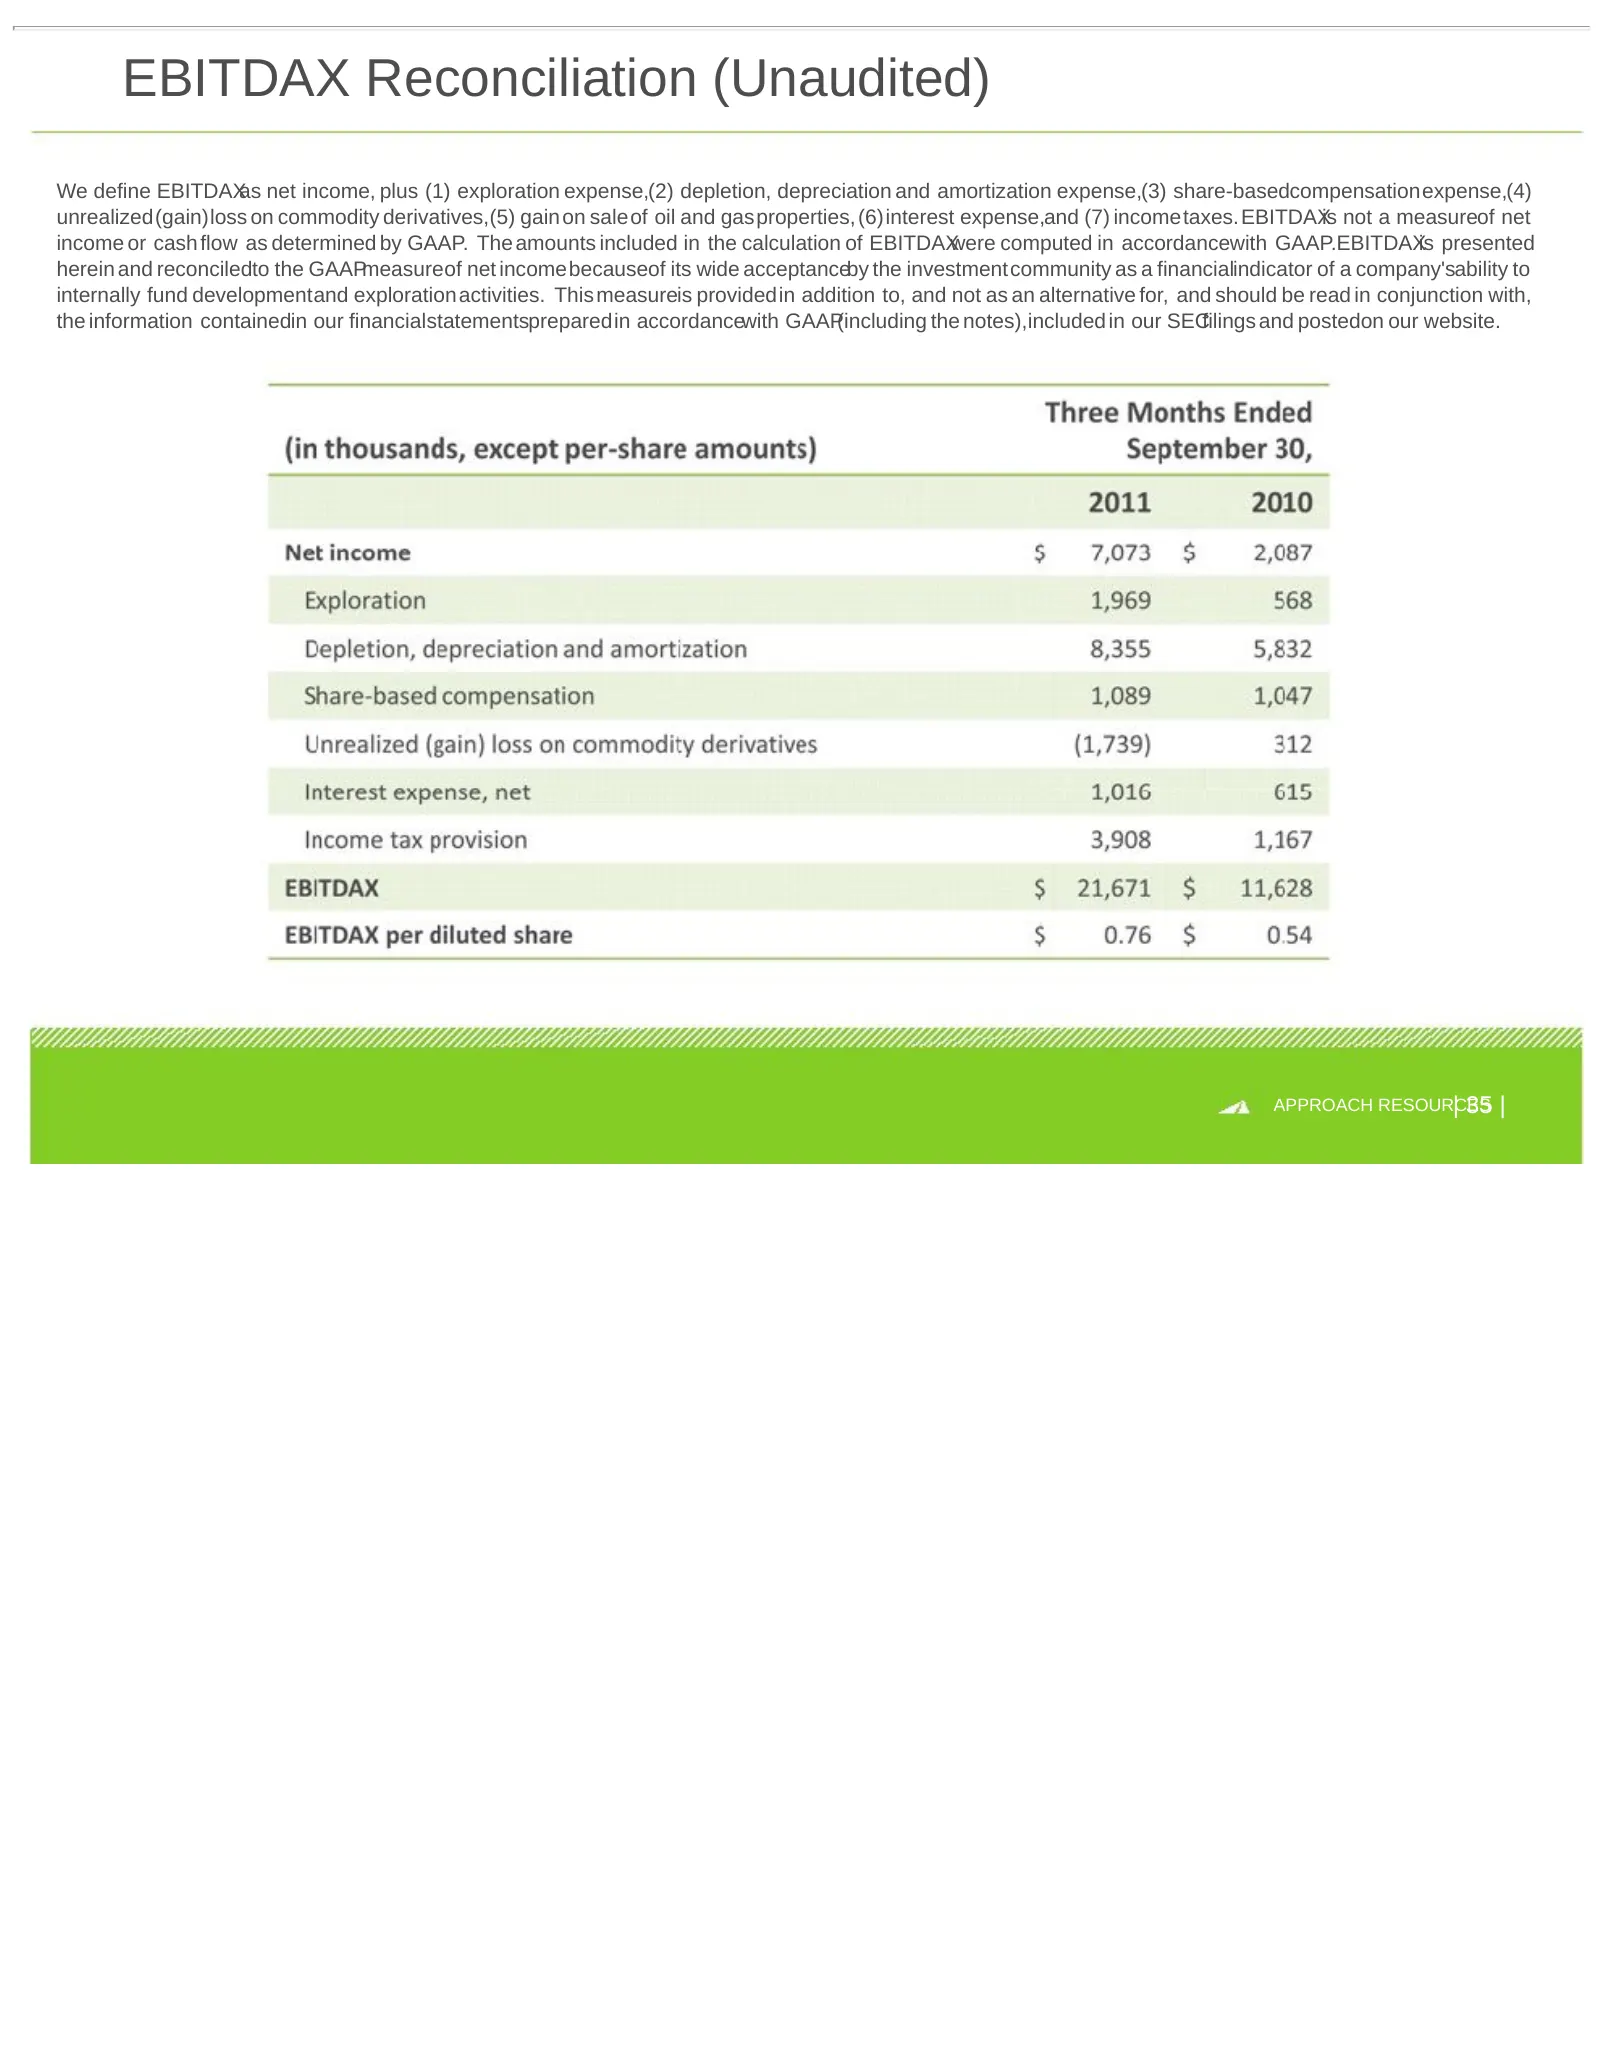
Slide 35: EBITDAX Reconciliation (Unaudited)
EBITDAX Reconciliation (Unaudited) We define EBITDAXas net income, plus (1) exploration expense,(2) depletion, depreciation and amortization expense,(3) share-basedcompensationexpense,(4) unrealized(gain)loss on commodity derivatives,(5) gain on saleof oil and gasproperties, (6)interest expense,and
Source: SEC EDGAR · 8-K filed Nov 30, 2011
More decks from Approach Resources Inc
 Investor Presentation (January 2017)46 slides · Jan 9, 2017
 Proxy Contest (January 2017)47 slides · Jan 5, 2017
 Investor Presentation (December 2016)45 slides · Dec 20, 2016
 Q3 2016 Earnings Presentation33 slides · Nov 3, 2016
 Q3 2015 Earnings Presentation19 slides · Nov 5, 2015
 Q2 2015 Earnings Presentation21 slides · Aug 6, 2015