QR Energy LP — IPAA OGIS New York April 2011
16 slides from QR Energy LP's conference presentation, Apr 12, 2011
Slide 1: IPAA OGIS New York • April 2011
IPAA OGIS New York • April 2011
Slide 2: Forward-Looking Statements
Forward-Looking Statements This presentation contains forward-looking statements relating to QR Energy's operations that are based on management's current expectations, estimates and projections about its operations. Words and phrases such as "expect," "estimates," "guidance," "opportunities," "pote
Slide 3: QR Energy: A Premier Upstream MLP
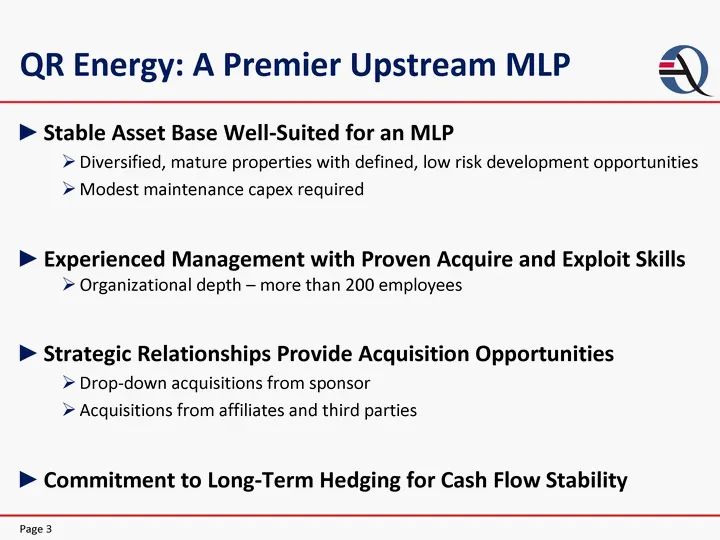
QR Energy: A Premier Upstream MLP Stable Asset Base Well-Suited for an MLP Diversified, mature properties with defined, low risk development opportunities Modest maintenance capex required Experienced Management with Proven Acquire and Exploit Skills Organizational depth - more than 200 employees St
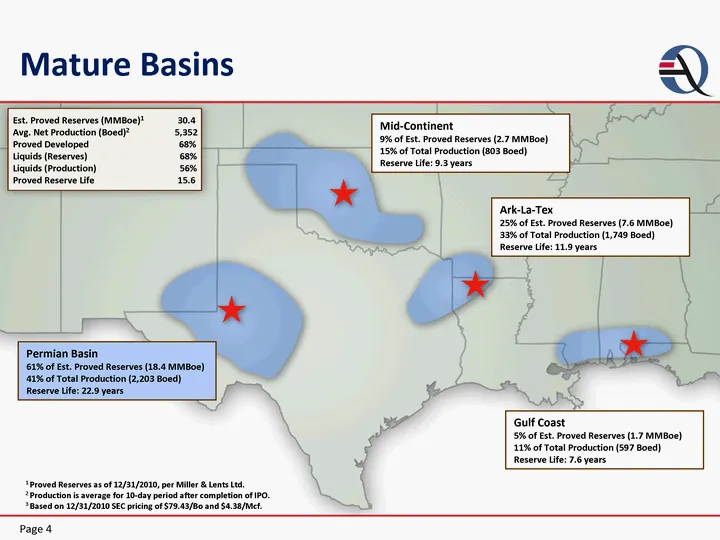
Slide 4: Mature Basins: Reserves and Production by Region
Page 4 Est. Proved Reserves (MMBoe)1 30.4 Avg. Net Production (Boed)2 5,352 Proved Developed 68% Liquids (Reserves) 68% Liquids (Production) 56% Proved Reserve Life 15.6 Permian Basin 61% of Est. Proved Reserves (18.4 MMBoe) 41% of Total Production (2,203 Boed) Reserve Life: 22.9 years Mid-Continent
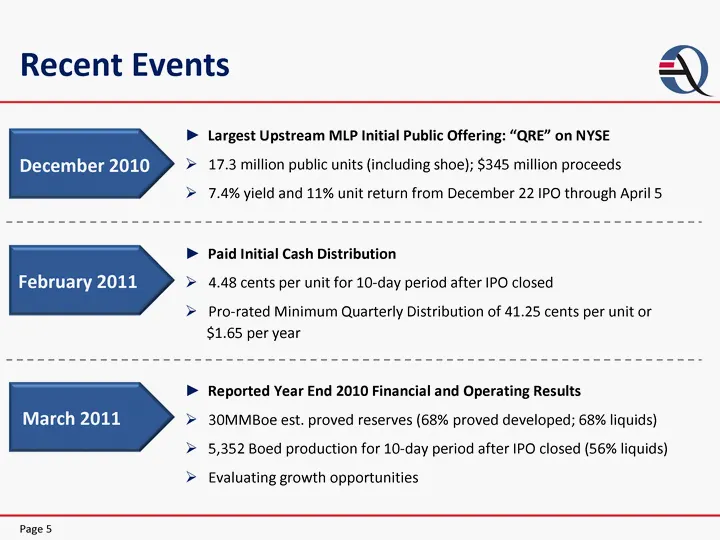
Slide 5: Recent Events
Largest Upstream MLP Initial Public Offering: "QRE" on NYSE 17.3 million public units (including shoe); $345 million proceeds 7.4% yield and 11% unit return from December 22 IPO through April 5 December 2010 Page 5 February 2011 March 2011 Paid Initial Cash Distribution 4.48 cents per unit for 10-da
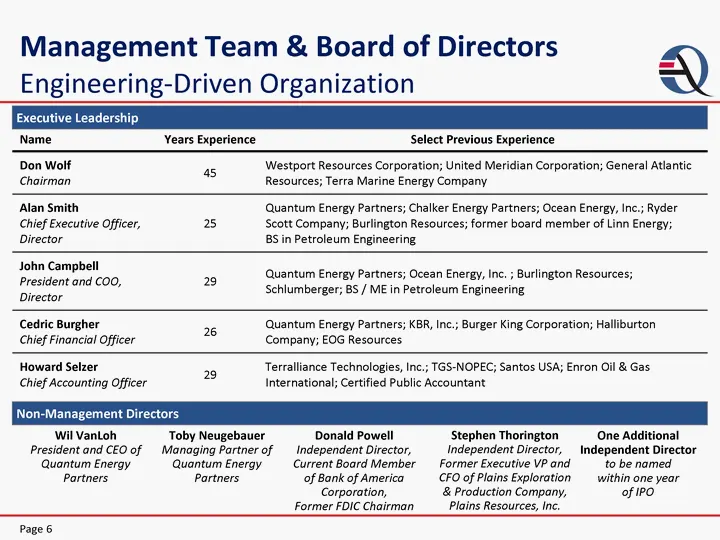
Slide 6: Executive Leadership
Executive Leadership Name Years Experience Select Previous Experience Don Wolf Chairman 45 Westport Resources Corporation; United Meridian Corporation; General Atlantic Resources; Terra Marine Energy Company Alan Smith Chief Executive Officer, Director 25 Quantum Energy Partners; Chalker Energy Part
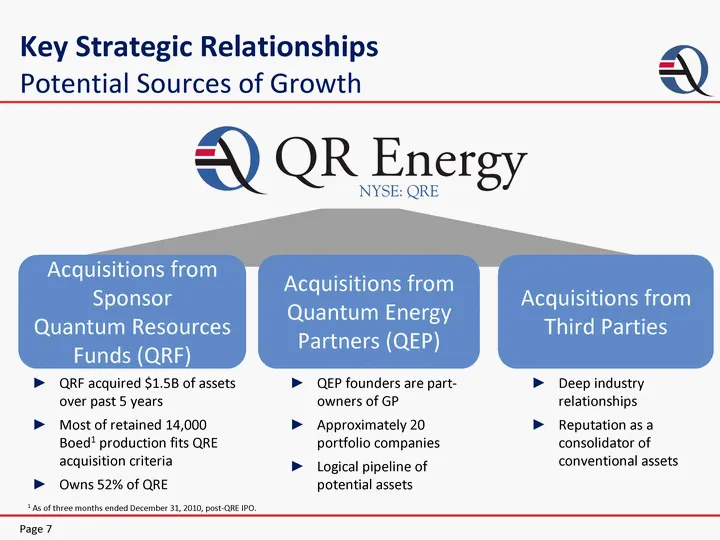
Slide 7: Key Strategic Relationships
Key Strategic Relationships Potential Sources of Growth Acquisitions from Sponsor Quantum Resources Funds (QRF) QRF acquired $1.5B of assets over past 5 years Most of retained 14,000 Boed1 production fits QRE acquisition criteria Owns 52% of QRE Acquisitions from Quantum Energy Partners (QEP) QEP fo
Slide 8: Strategy and Execution
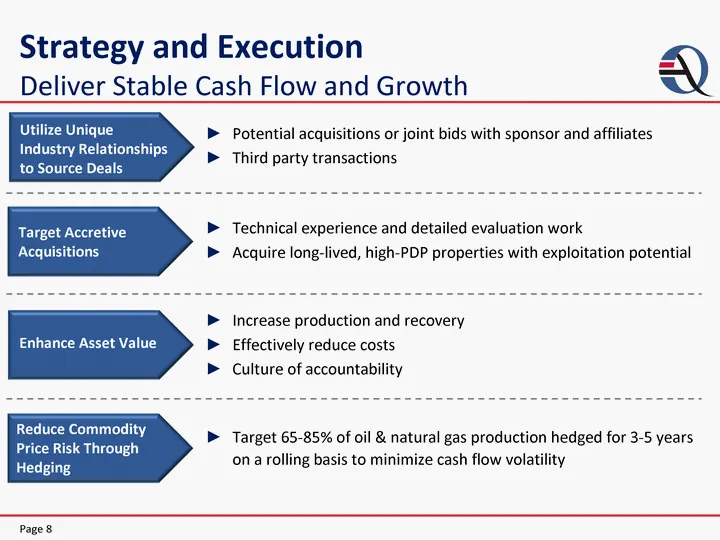
Strategy and Execution Deliver Stable Cash Flow and Growth Technical experience and detailed evaluation work Acquire long-lived, high-PDP properties with exploitation potential Potential acquisitions or joint bids with sponsor and affiliates Third party transactions Target 65-85% of oil & natural ga
Slide 9: Identified Production Replacement
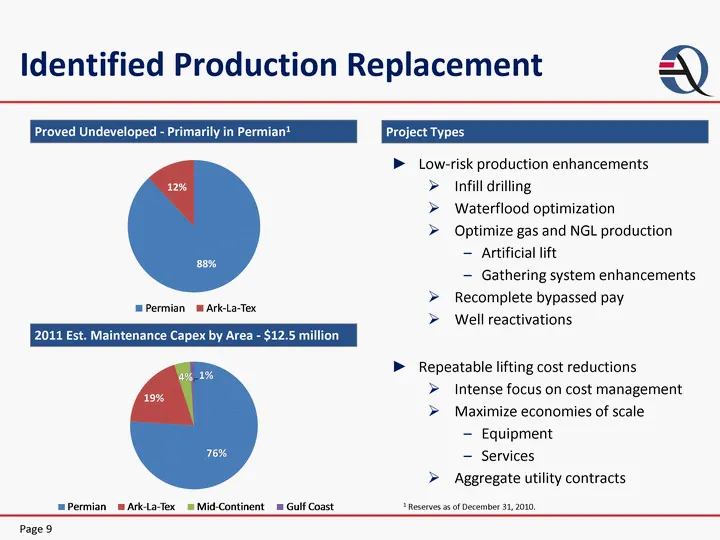
Identified Production Replacement Proved Undeveloped - Primarily in Permian1 Project Types Low-risk production enhancements Infill drilling Waterflood optimization Optimize gas and NGL production Artificial lift Gathering system enhancements Recomplete bypassed pay Well reactivations Repeatable lift
Slide 10: Low-Risk Development Example
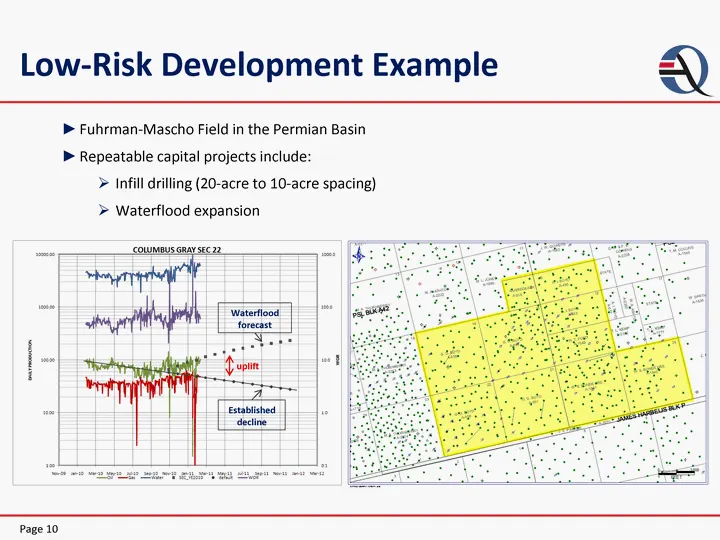
Low-Risk Development Example Page 10 uplift Waterflood forecast Established decline Fuhrman-Mascho Field in the Permian Basin Repeatable capital projects include: Infill drilling (20-acre to 10-acre spacing) Waterflood expansion
Slide 11: Acquisition Market
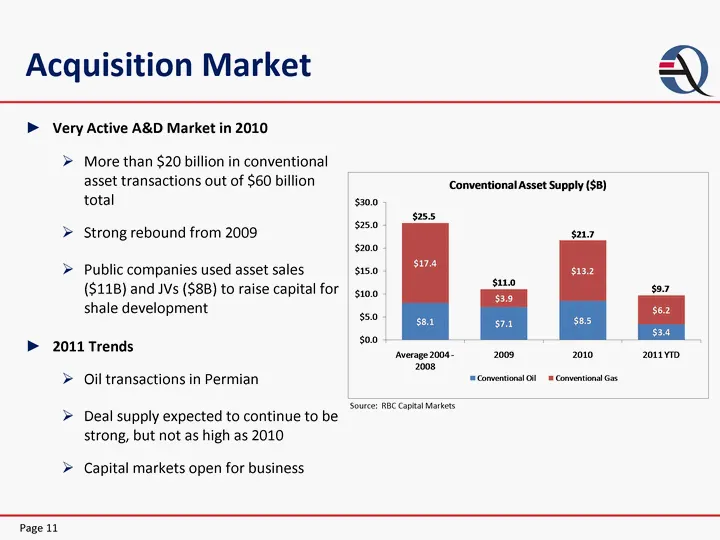
Acquisition Market Very Active A&D Market in 2010 More than $20 billion in conventional asset transactions out of $60 billion total Strong rebound from 2009 Public companies used asset sales ($11B) and JVs ($8B) to raise capital for shale development 2011 Trends Oil transactions in Permian Deal supp
Slide 12: Ownership Interests Aligned
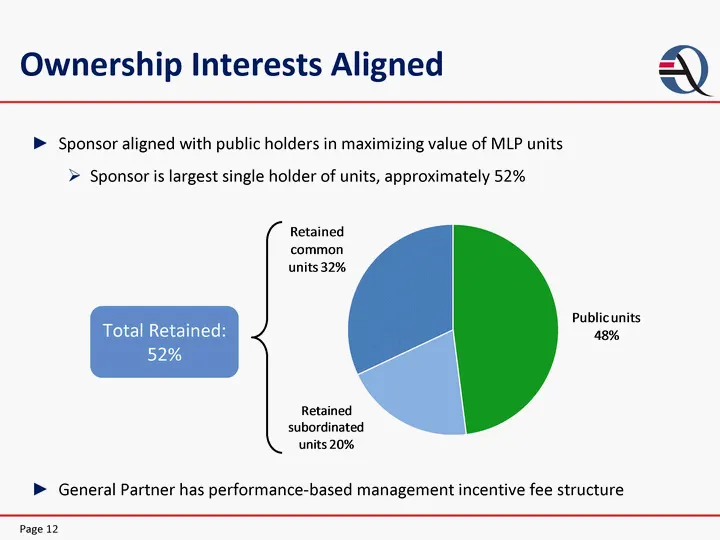
Sponsor aligned with public holders in maximizing value of MLP units Sponsor is largest single holder of units, approximately 52% General Partner has performance-based management incentive fee structure Ownership Interests Aligned Page 12 Total Retained: 52%
Slide 13: Strong Balance Sheet
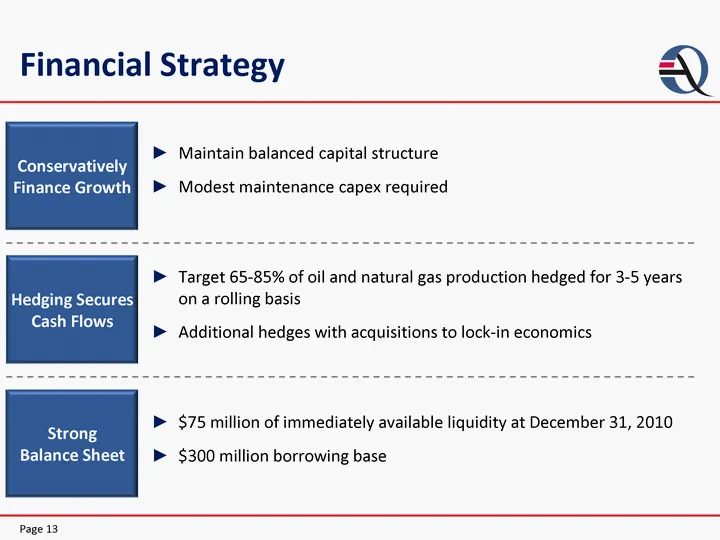
Strong Balance Sheet $75 million of immediately available liquidity at December 31, 2010 $300 million borrowing base Conservatively Finance Growth Maintain balanced capital structure Modest maintenance capex required Hedging Secures Cash Flows Target 65-85% of oil and natural gas production hedged f
Slide 14: Five Year Hedge Portfolio
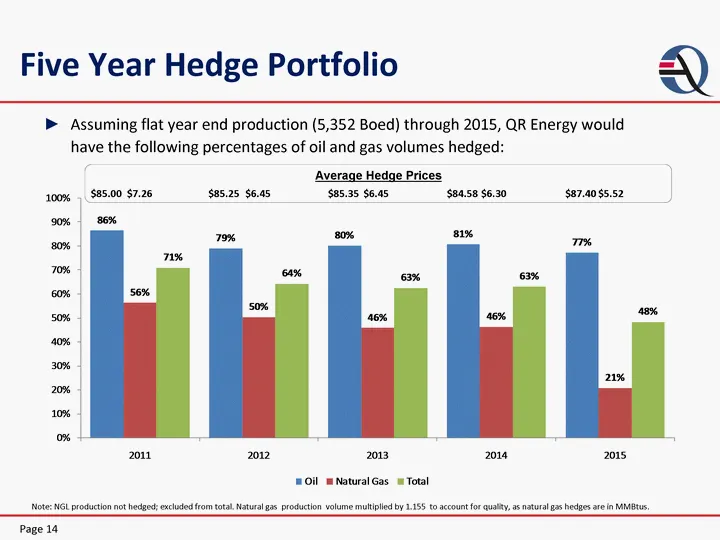
Average Hedge Prices $7.26 $6.45 $6.45 $5.52 $85.00 $85.25 $85.35 $87.40 $6.30 $84.58 Five Year Hedge Portfolio Note: NGL production not hedged; excluded from total. Natural gas production volume multiplied by 1.155 to account for quality, as natural gas hedges are in MMBtus. Page 14 Assuming flat y
Slide 15: Attractive Distribution Yield
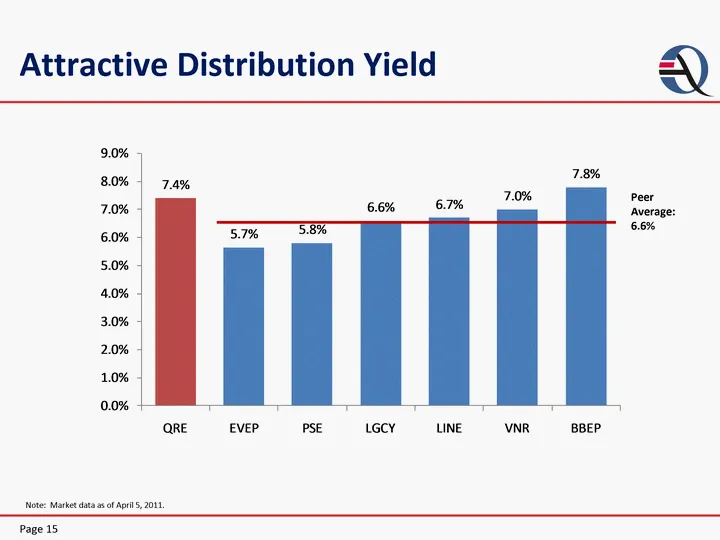
Attractive Distribution Yield Note: Market data as of April 5, 2011. Page 15 Peer Average: 6.6%
Slide 16: QR Energy: A Premier Upstream MLP
QR Energy: A Premier Upstream MLP Stable Asset Base Well-Suited for an MLP Experienced Management with Proven Acquire and Exploit Skills Strategic Relationships Provide Acquisition Opportunities Commitment to Long-Term Hedging for Cash Flow Stability Page 16
Source: SEC EDGAR · 8-K filed Apr 12, 2011