Vantagesouth Bancshares — Crescent Financial Bancshares — Investor Presentation (May 2013)
26 slides from Vantagesouth Bancshares's investor presentation, May 15, 2013
Slide 1: Crescent Financial Bancshares, Inc. Investor Presentation
Crescent Financial Bancshares, Inc. Holding Company for VantageSouth Bank Investor Presentation VA CRESCENT Wf VantageSouth FinANcIAL BANCSHARES, INC.
Slide 2: Forward-looking statements
Forward-looking statements Statements in this presentation relating to plans, strategies, economic performance and trends, projections of results of specific, acquisitions, activities or investments, expectations or beliefs about future events or results, and other statements that are not descriptio
Slide 3: Creating an enduring community banking franchise
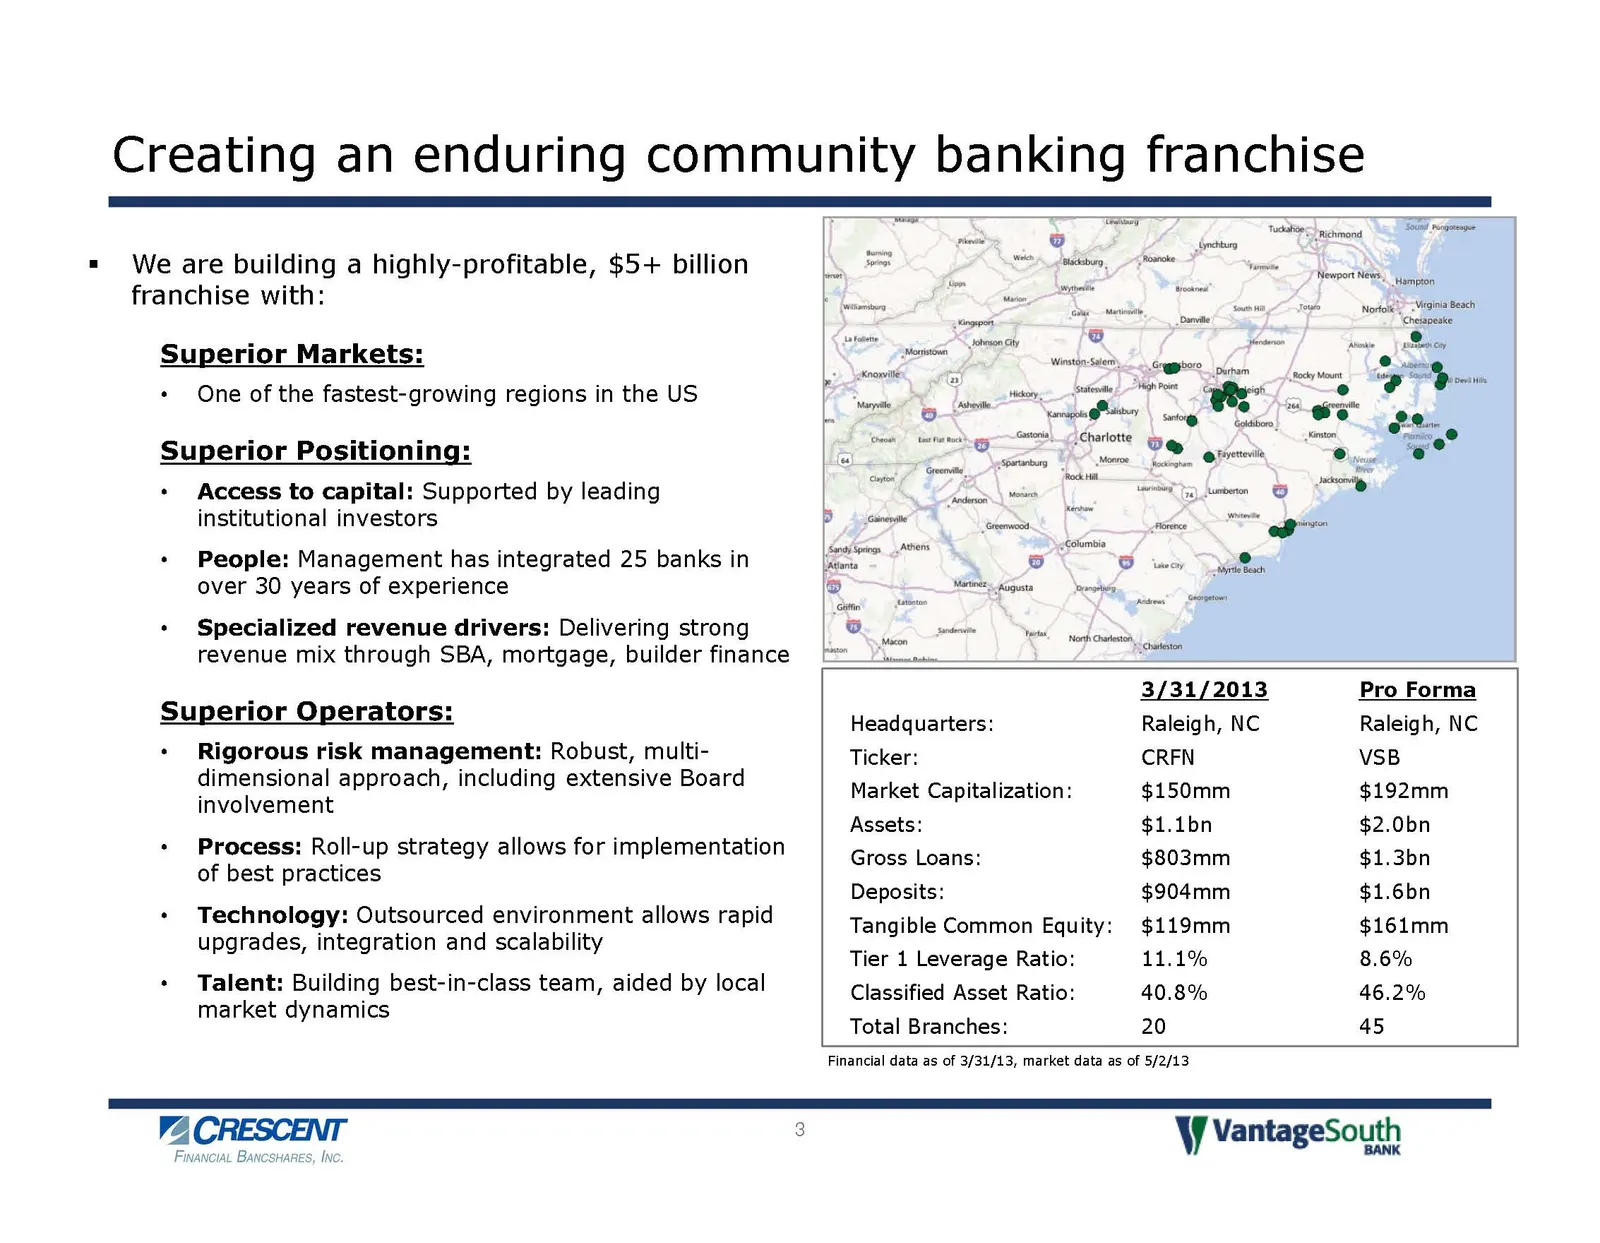
Creating an enduring community banking franchise "We are building a highly-profitable, $5+ billion IS a mat tO Tom Heep Nea franchise with: oy ee oie) TL) ; Cale % bone ceapak Superior Markets: a Westin + One of the fastest-growing regions in the US fae 43 nen = «a sets Pacey Superior Positioning: S
Slide 4: Investment highlights
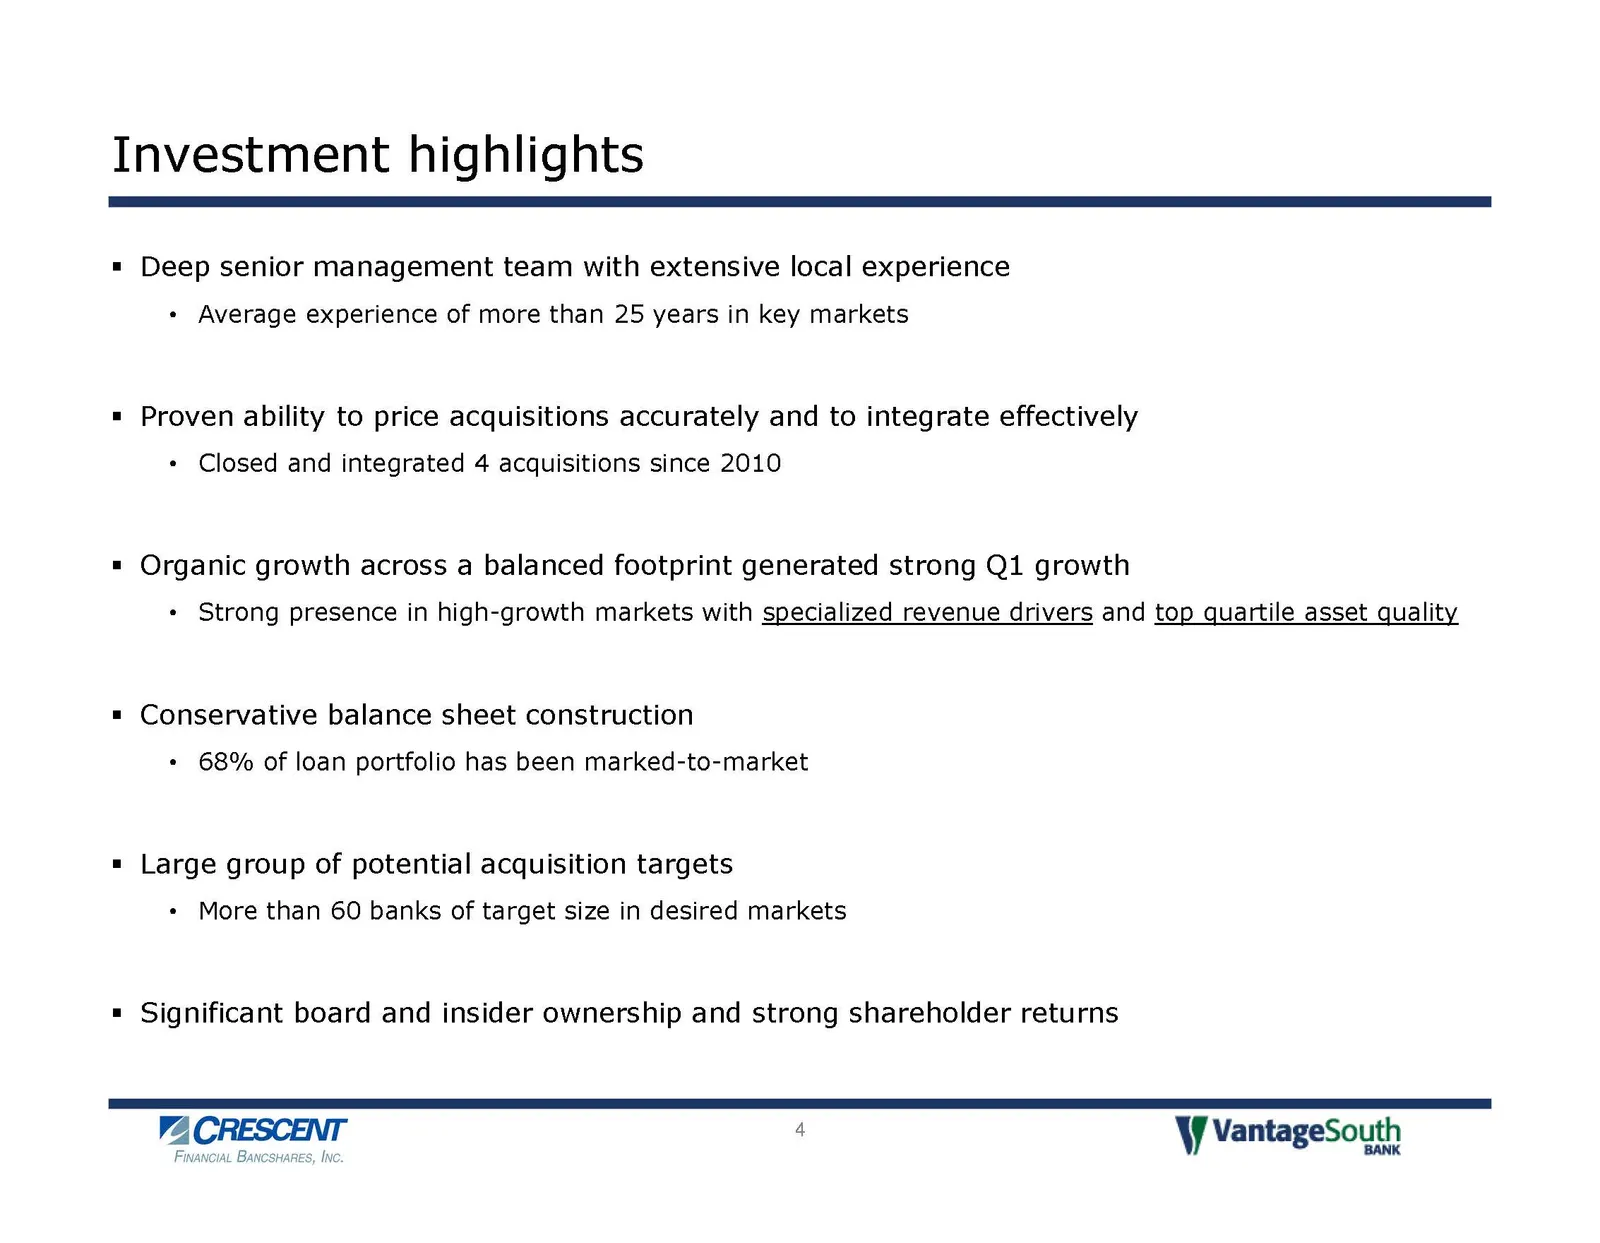
Investment highlights = Deep senior management team with extensive local experience + Average experience of more than 25 years in key markets « Proven ability to price acquisitions accurately and to integrate effectively * Closed and integrated 4 acquisitions since 2010 " Organic growth across a bal
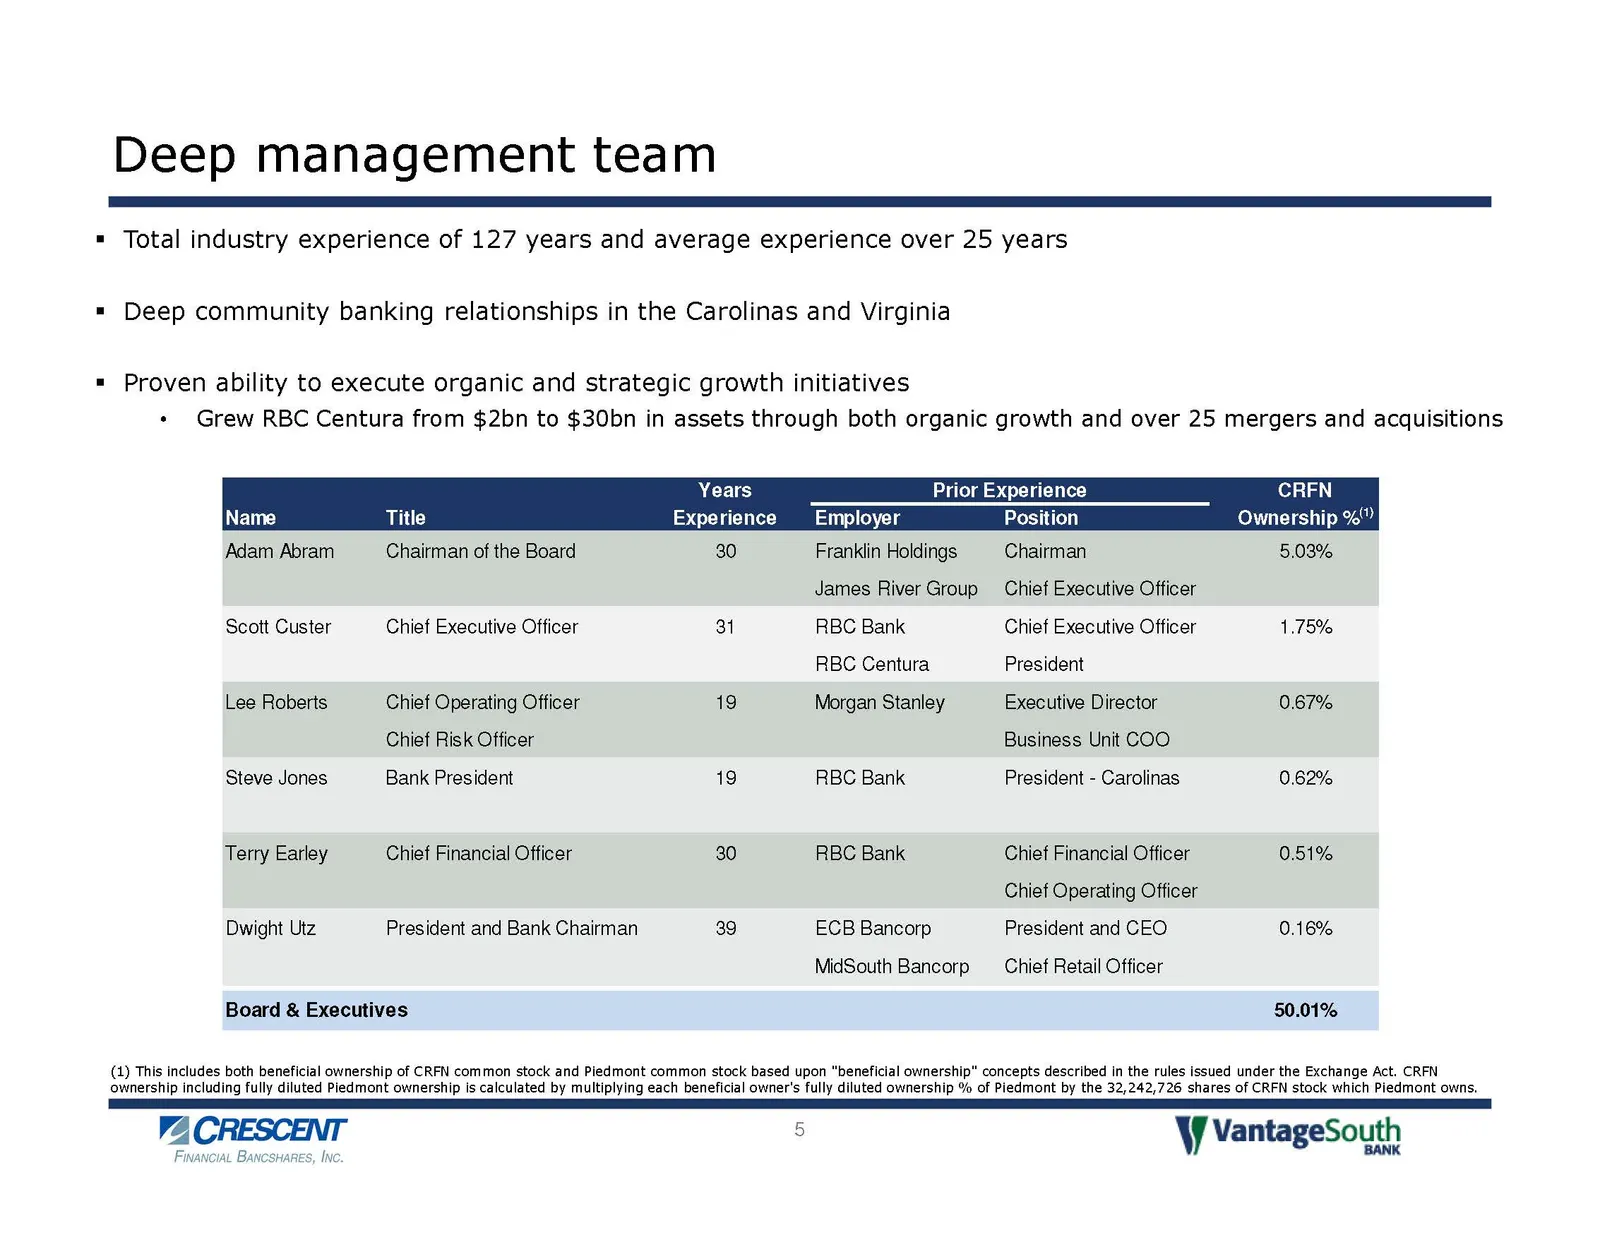
Slide 5: Deep management team
Deep management team = Total industry experience of 127 years and average experience over 25 years = Deep community banking relationships in the Carolinas and Virginia = Proven ability to execute organic and strategic growth initiatives + Grew RBC Centura from $2bn to $30bn in assets through both or
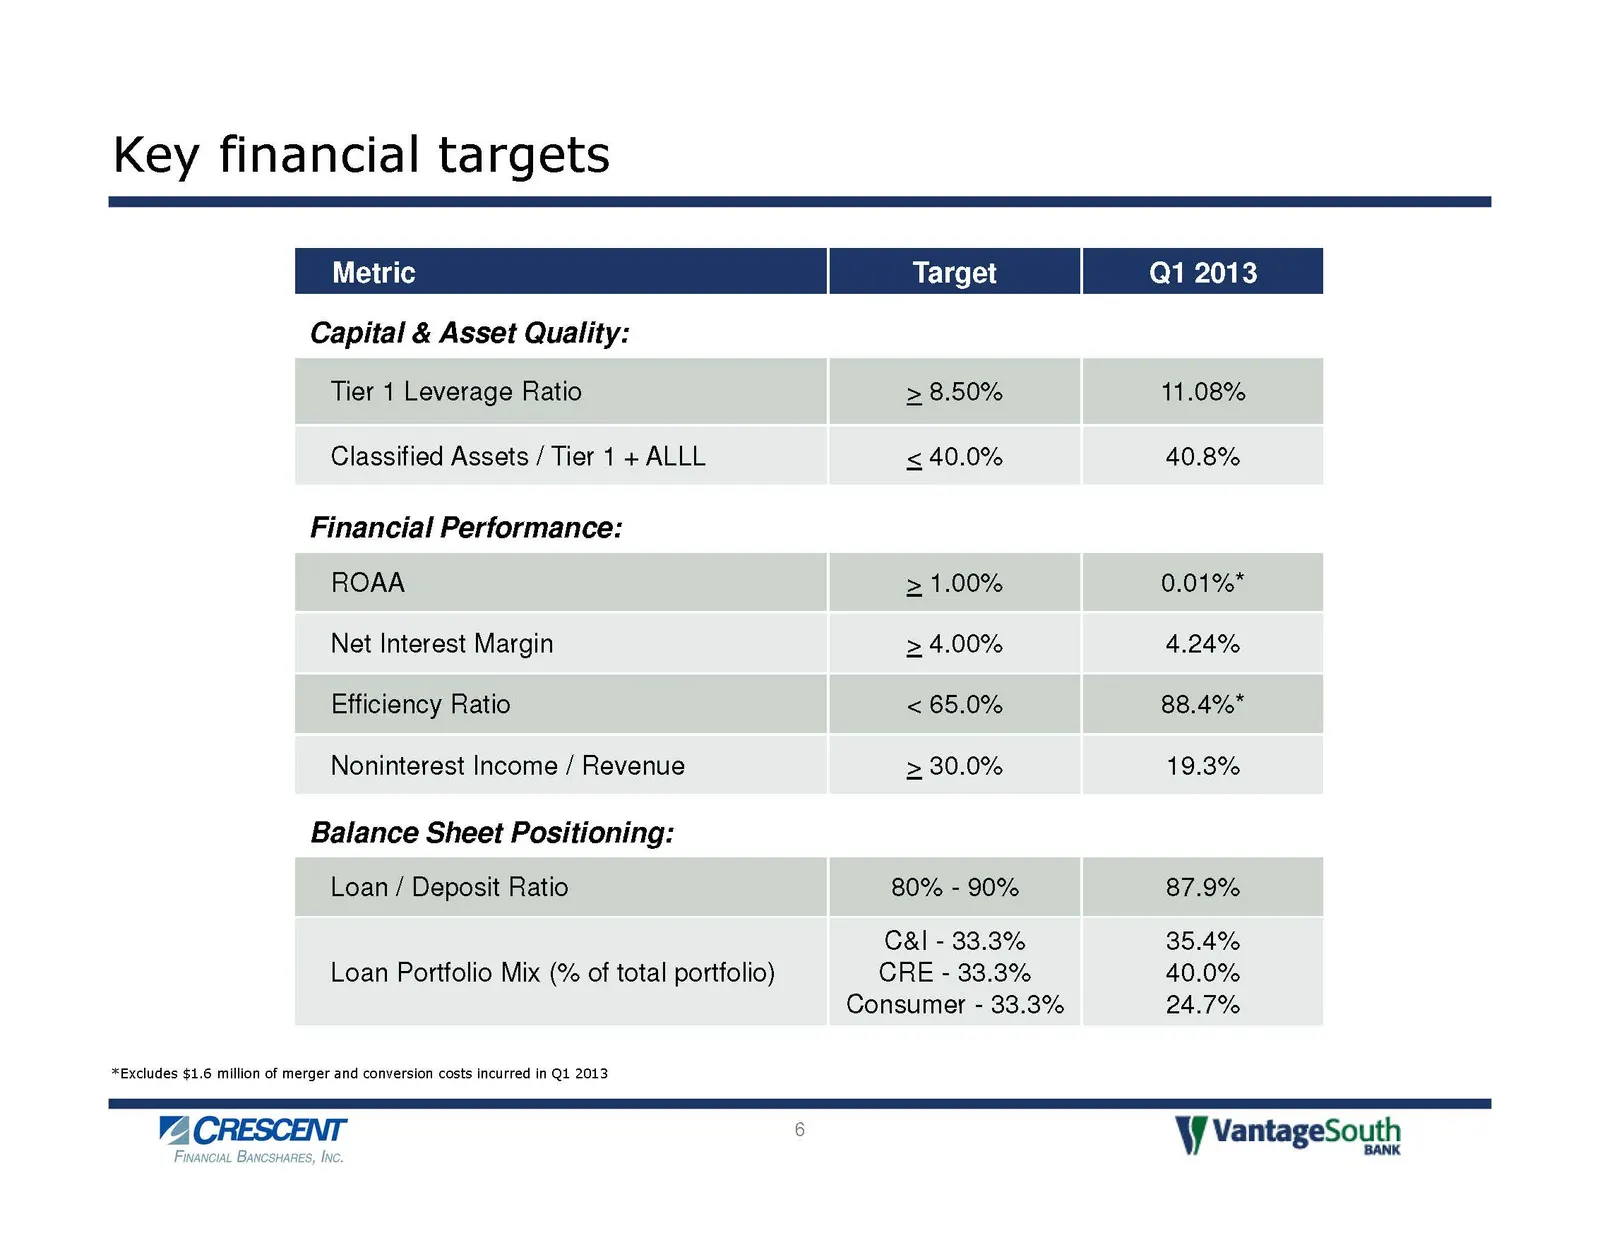
Slide 6: Key financial targets
Key financial targets Qi 2013 Capital & Asset Quality: Tier 1 Leverage Ratio > 8.50% 11.08% Classified Assets / Tier 1 + ALLL < 40.0% 40.8% Financial Performance: ROAA > 1.00% 0.01%* Net Interest Margin > 4.00% 4.24% Efficiency Ratio < 65.0% 88.4%" Noninterest Income / Revenue > 30.0% 19.3% Balance
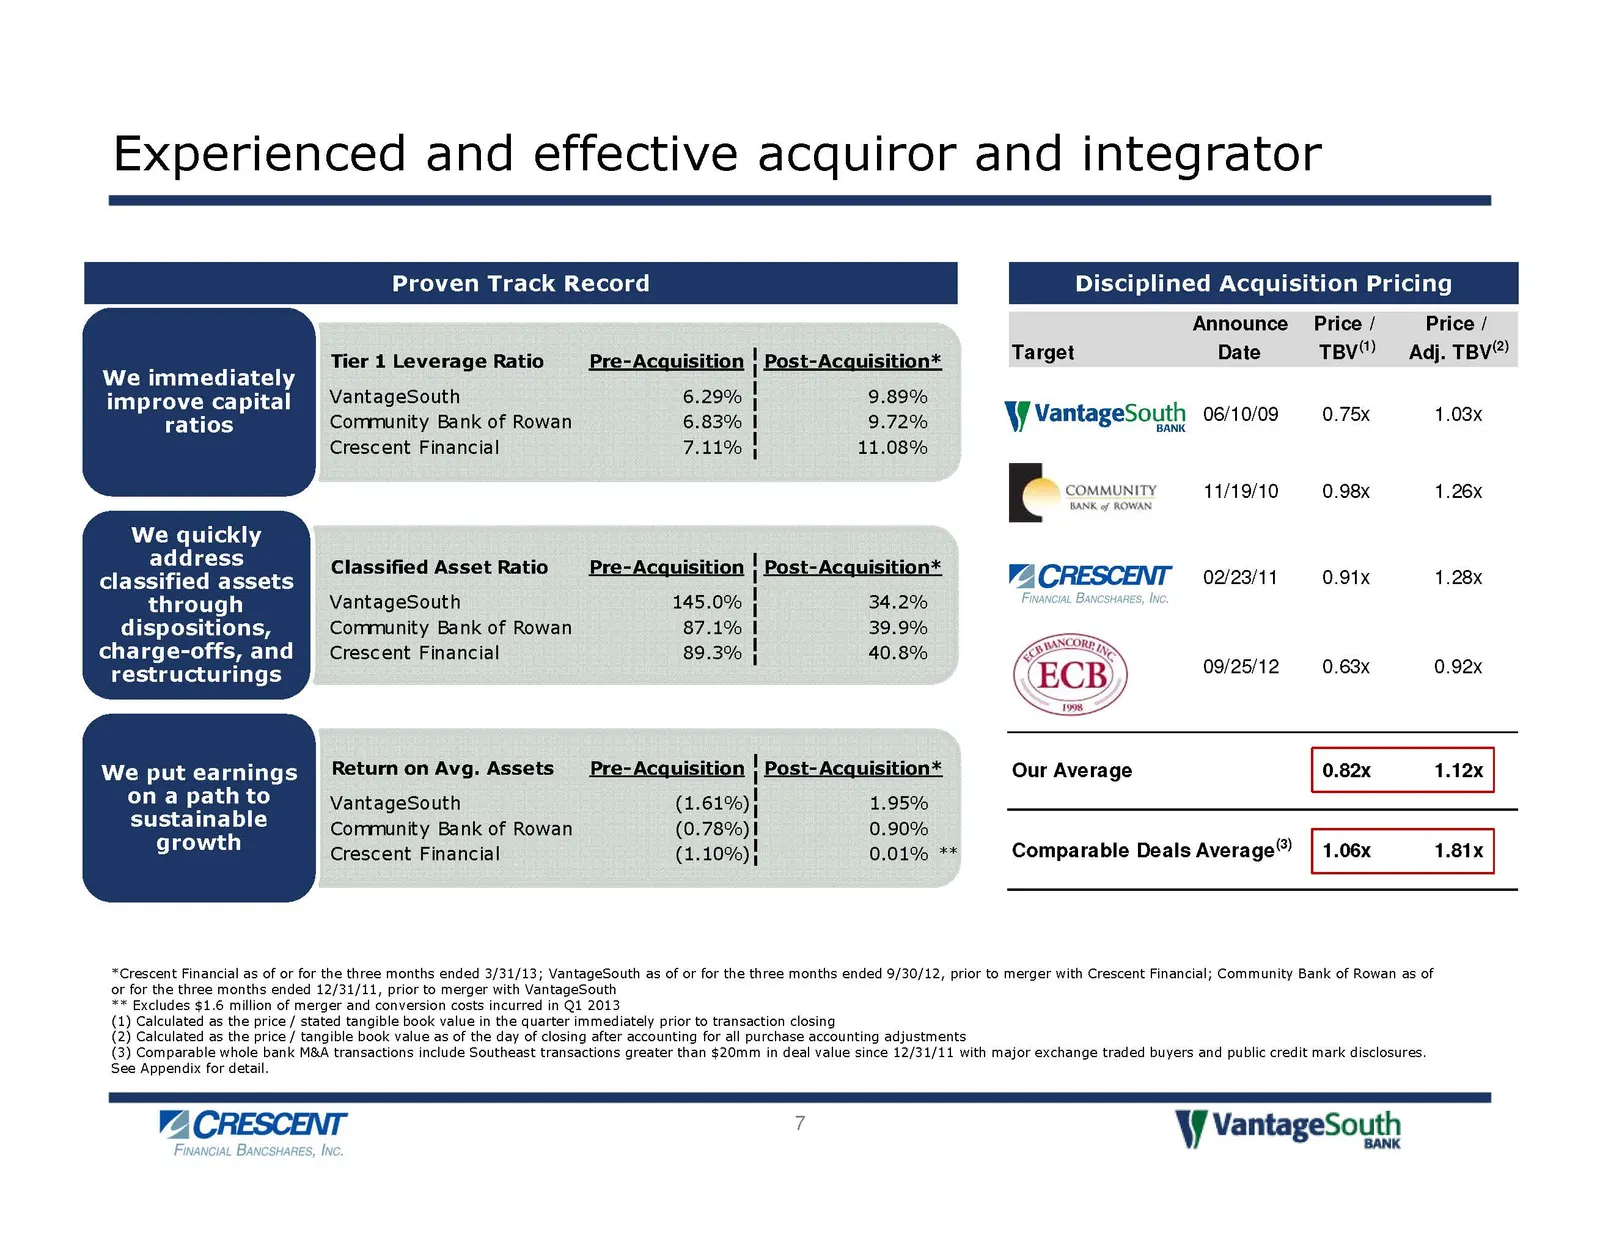
Slide 7: Experienced and effective acquiror and integrator
Experienced and effective acquiror and integrator Proven Track Record ciplined Acquisi Announce Price / Price / ¢ . TBV" ; : Tier 1 Leverage Ratio Pre-Acquisition | Post-Acauisition* iEarget Date BV") Adj. TBV We immediately 6.29% ; 4 1 7 improve capital [RGWEoSany I 9.89% ratios Community Bank of R
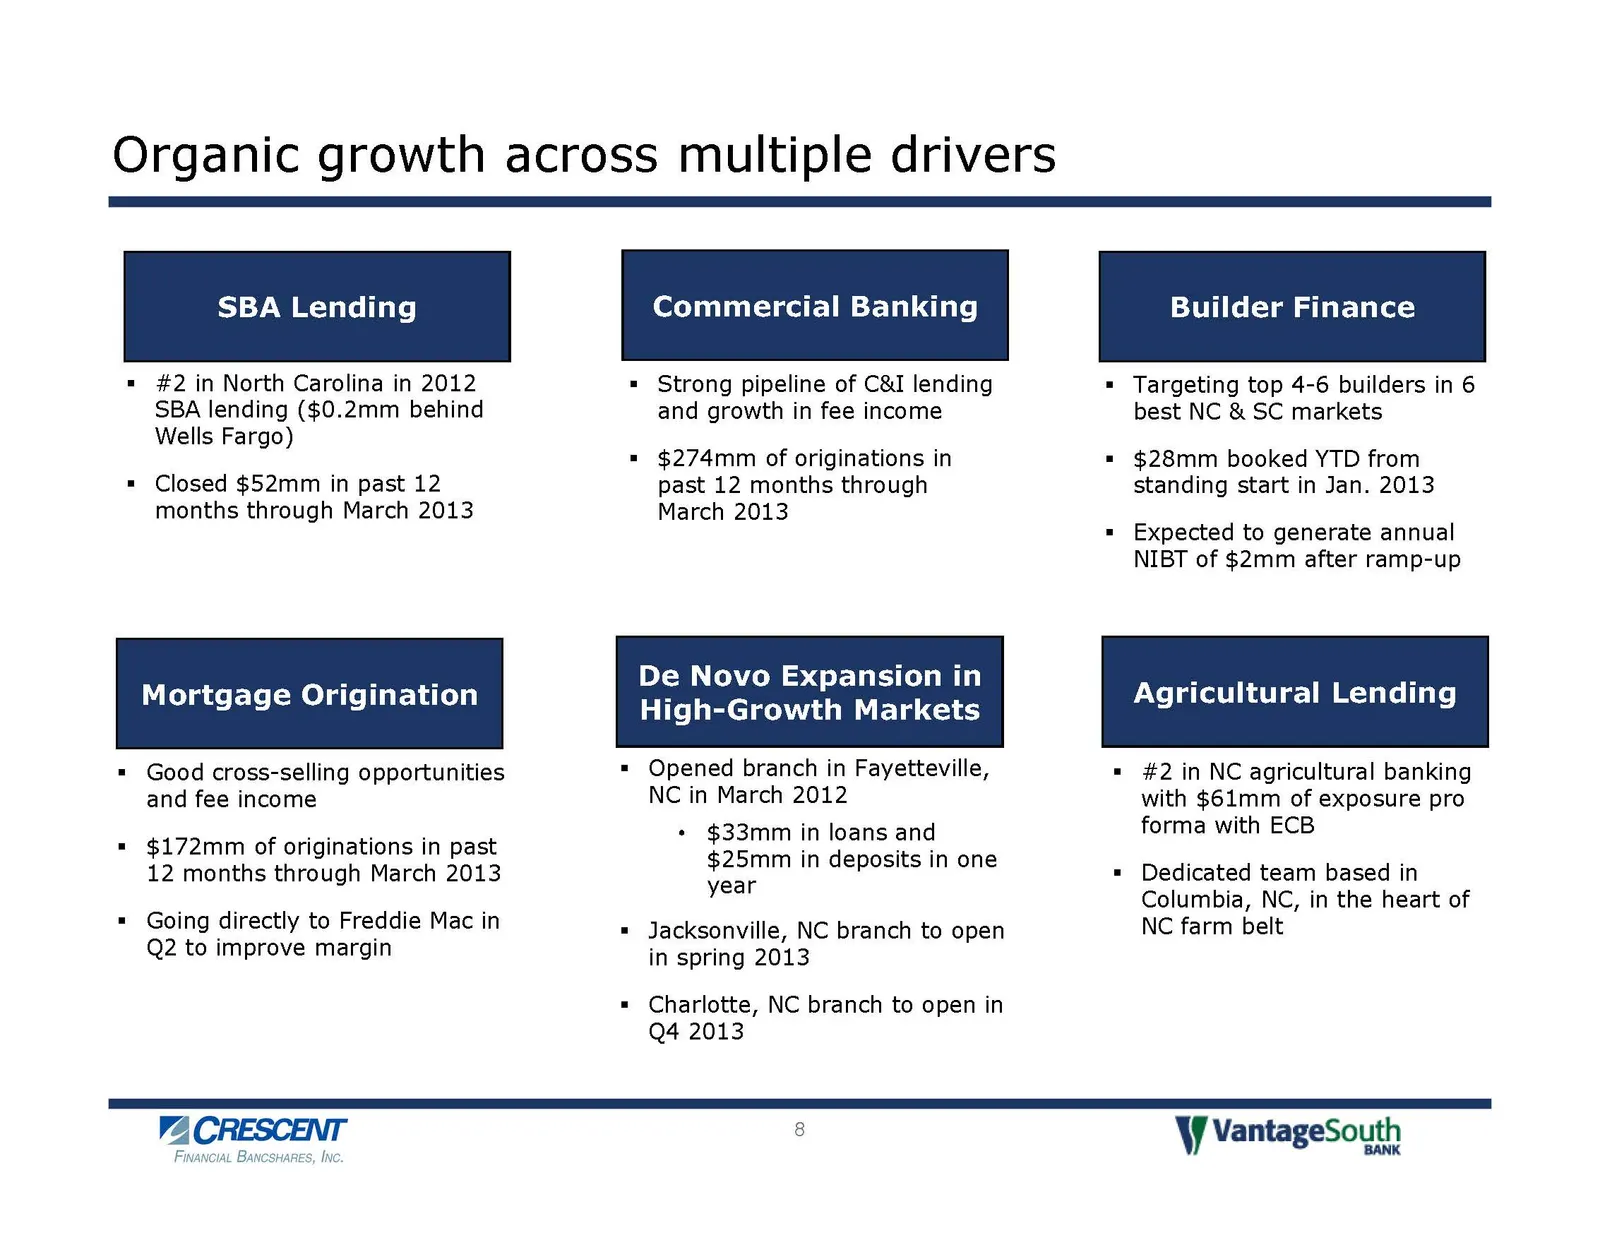
Slide 8: Organic growth across multiple drivers
Organic growth across multiple drivers SBA Lending Commercial Banking Builder Finance = #2 in North Carolina in 2012 = Strong pipeline of C&I lending = Targeting top 4-6 builders in 6 SBA lending ($0.2mm behind and growth in fee income best NC & SC markets Wells Fargo) = $274mm of originations in =
Slide 9: Supported by superior markets
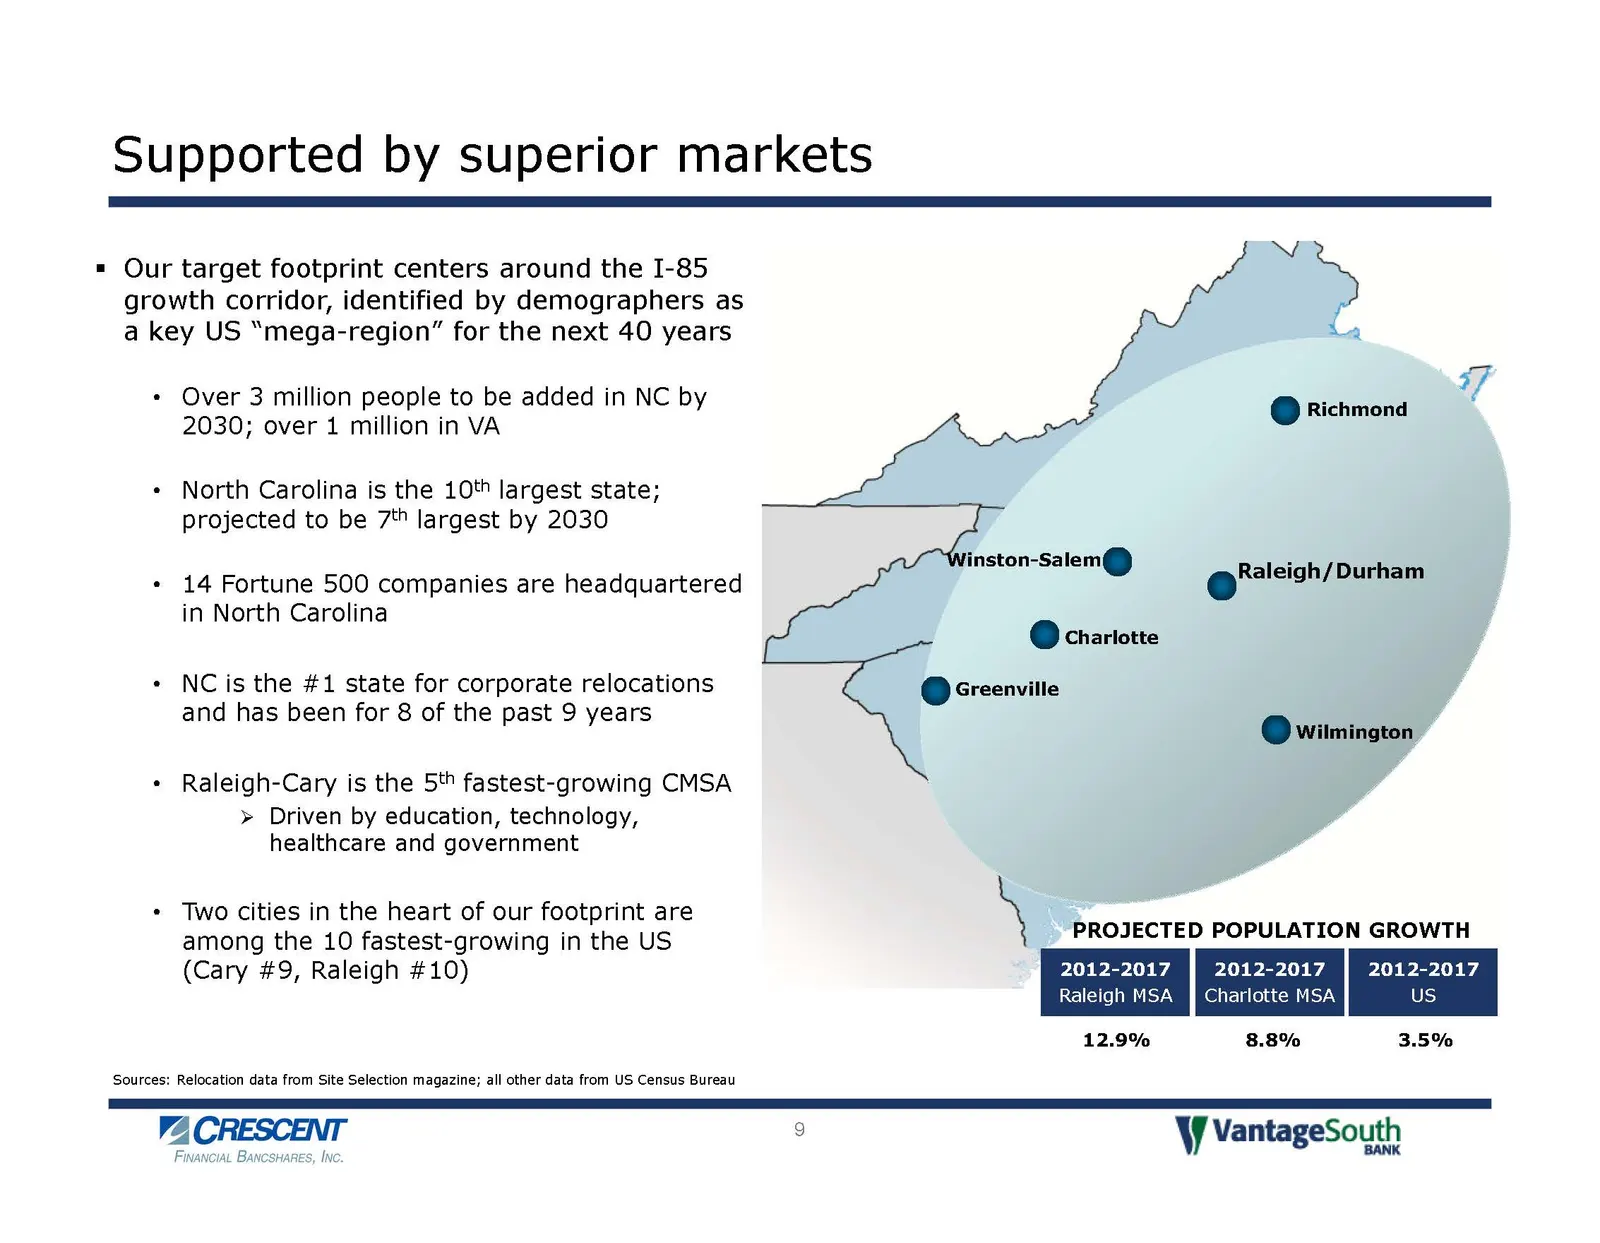
Supported by superior markets ~ = Our target footprint centers around the I-85 growth corridor, identified by demographers as a key US “mega-region” for the next 40 years rl * Over 3 million people to be added in NC by @ Richmona 47 2030; over 1 million in VA + North Carolina is the 10t largest stat
Slide 10: Franchise concentrated in attractive markets
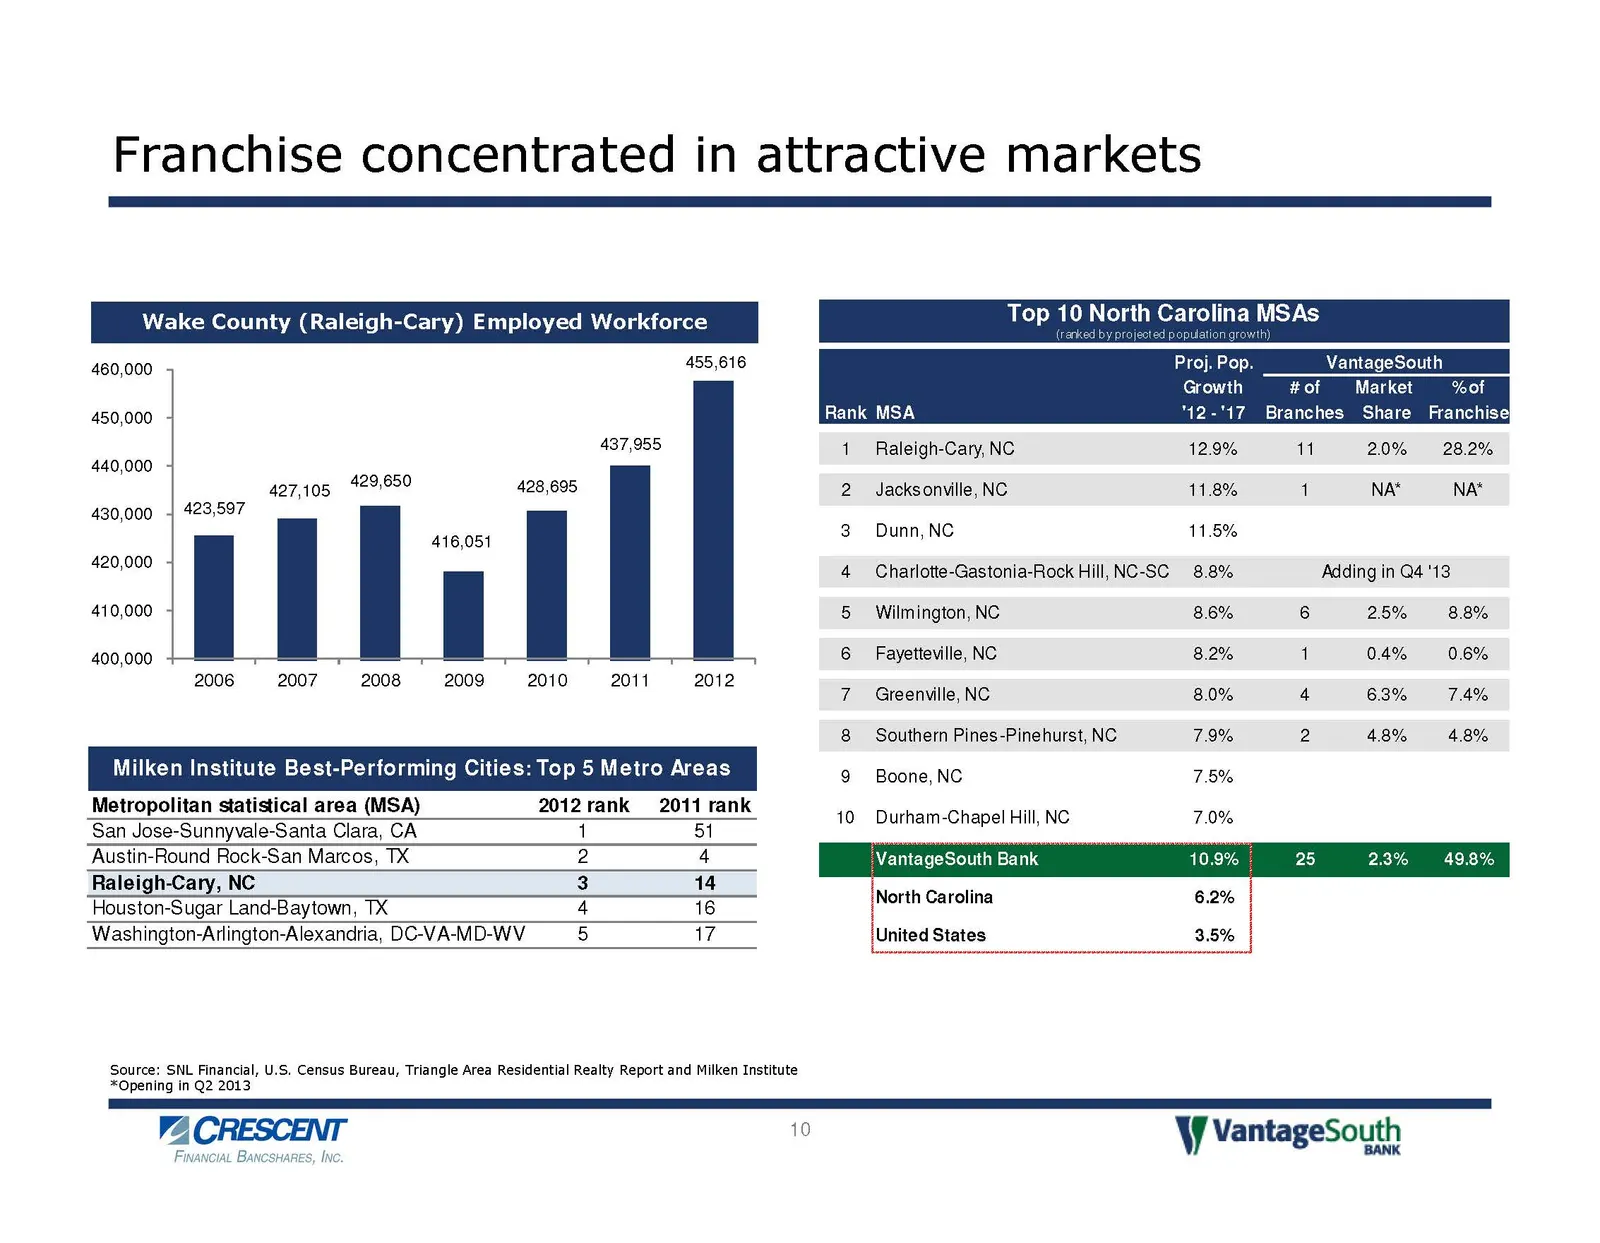
Franchise concentrated in attractive markets Wake County (Raleigh-Cary) Employed Workforce 460,000 455,616 450,000 437,955 440,000 427,105 429,850 428,695 430,000 + 423,597 416,051 420,000 410,000 400,000 2006 2007 2008 2009 2010 2011 2012 Milken Institute Best-Performing Cities: Top 5 Metro Areas M
Slide 11: Q1 2013 results: Closing and integrating ECB
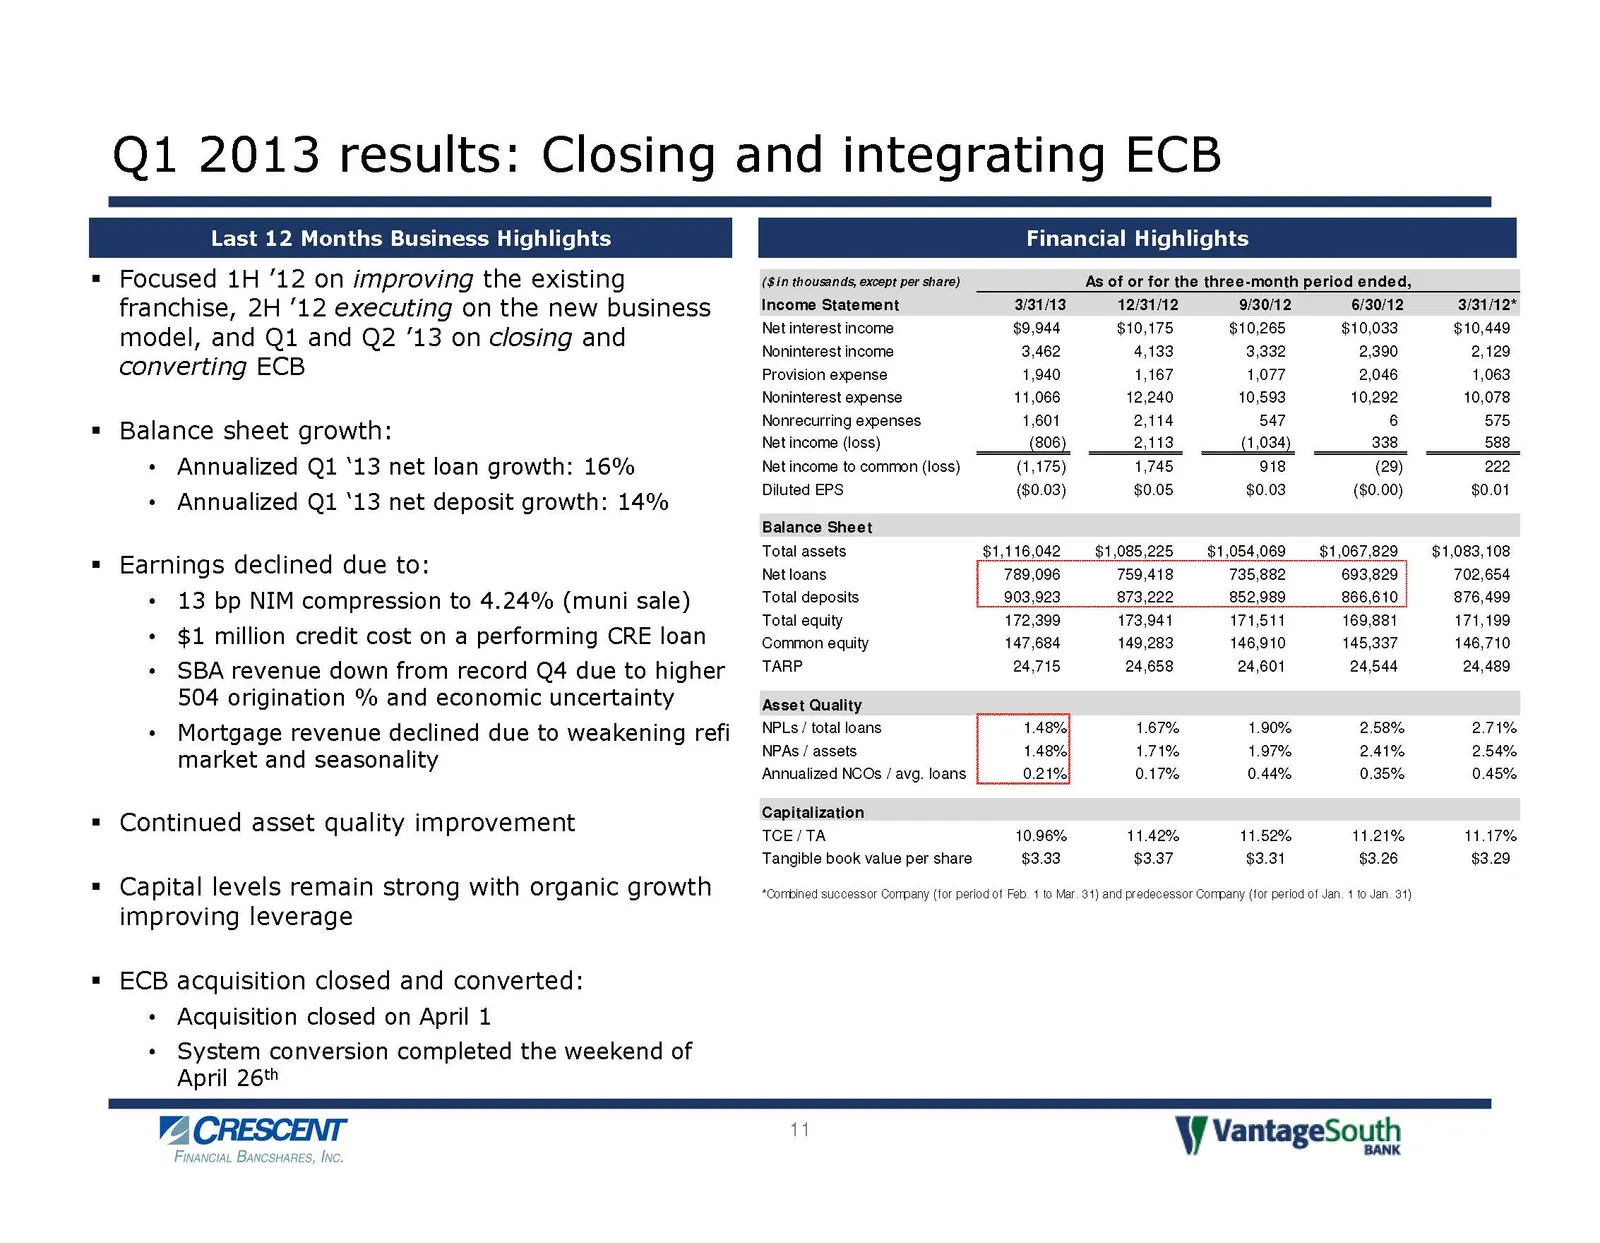
Qi 2013 results: Closing and integrating ECB Last 12 Months Business Hig! hts = Focused 1H ‘12 on improving the existing franchise, 2H ‘12 executing on the new business model, and Q1 and Q2 ‘13 on closing and converting ECB = Balance sheet growth: + Annualized Qi ‘13 net loan growth: 16% + Annualize
Slide 12: Favorable peer comparison
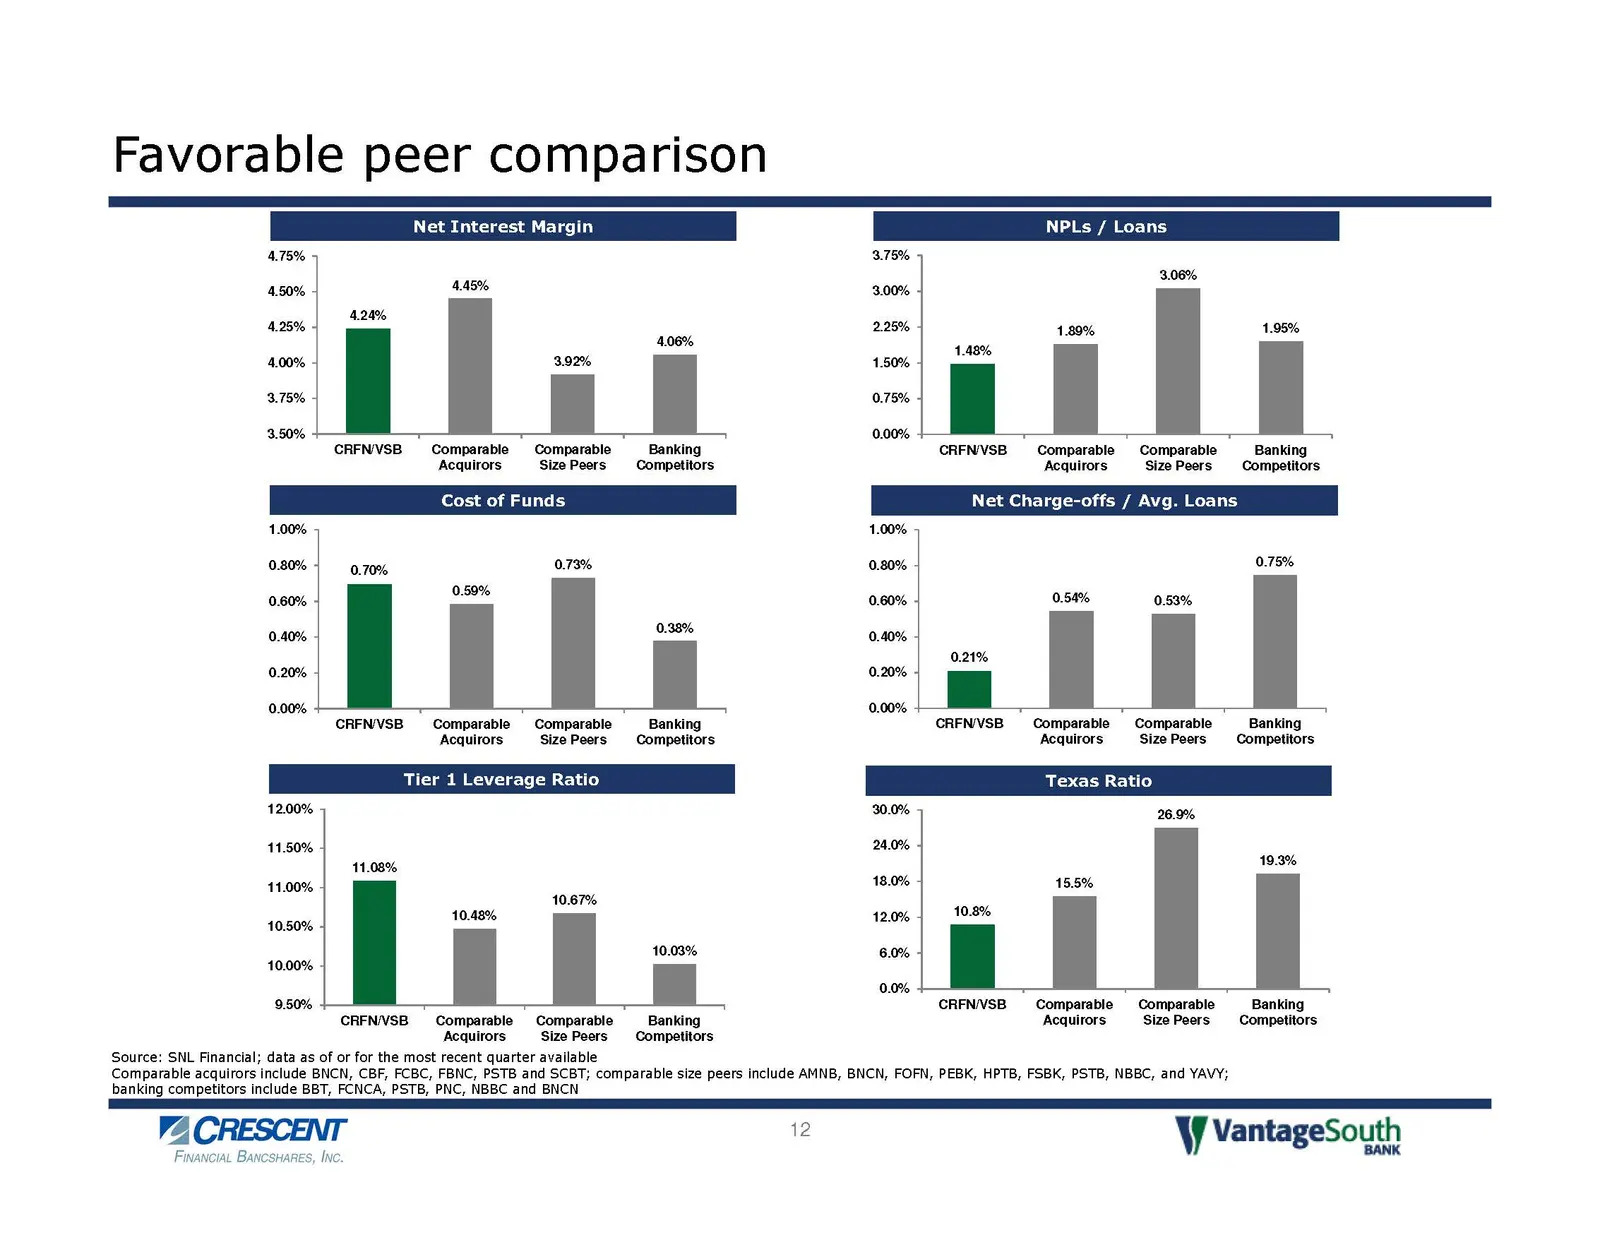
Favorable peer comparison Net Interest Margin 4.75% 4.50% 4.20% 4.25% CRFN/VSB Comparable Comparable Acquirors Size Peers Cost of Funds 1.00% 0.59% CRFNVSB Comparable Comparable Acquirors Size Peers ler 1 Leverage Ratio 12.00% 11.50% 11.00% 10.50% 10.00% 9.50% CRFNVSB = Comparable Comparable Acquito
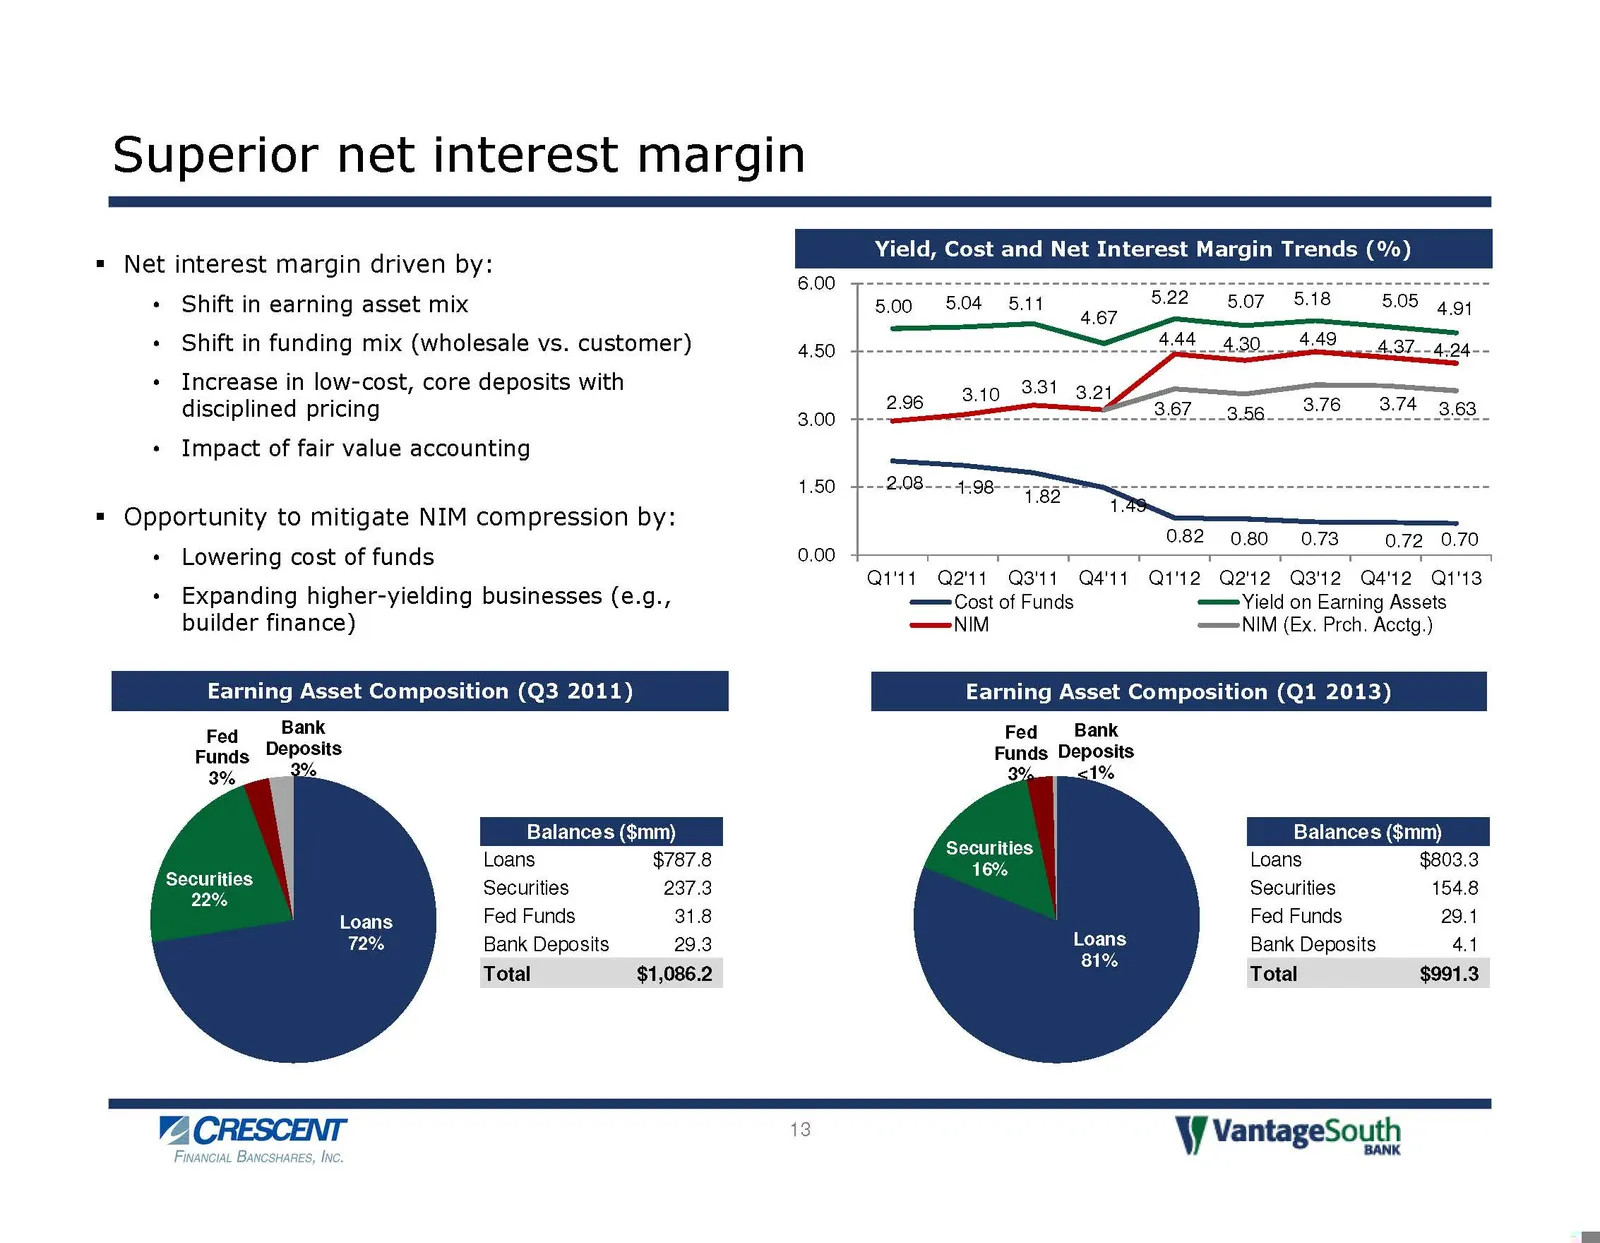
Slide 13: Superior net interest margin
Superior net interest margin . . . Yield, Cost and Net Interest Margin Trends (% = Net interest margin driven by: 6.00 p-----=- == 222 nen nn nen green nnn ee nner + Shift in earning asset mix 5.00 5.04 5.11 _ 5.22 5.07 518 5.05 494 + Shift in funding mix (wholesale vs. customer) 4.50 nt 4 30 4.49 A
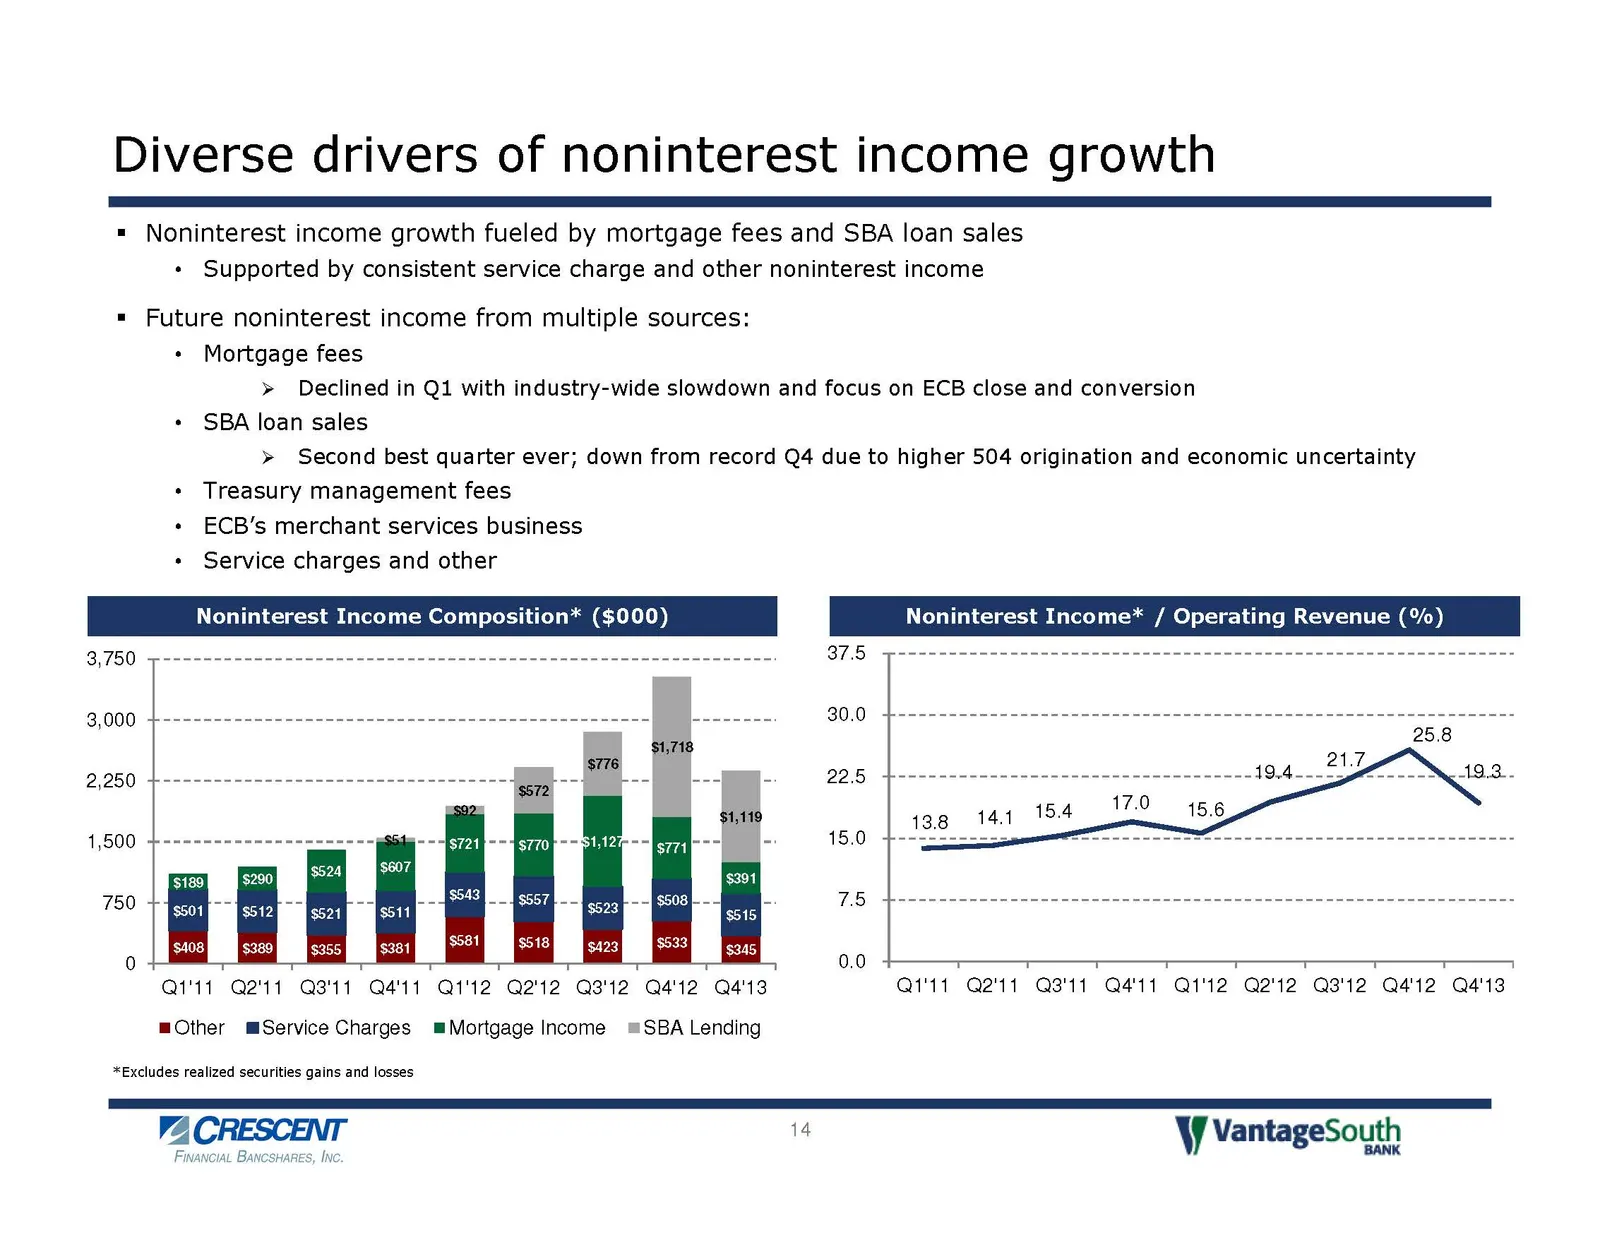
Slide 14: Diverse drivers of noninterest income growth
Diverse drivers of noninterest income growth = Noninterest income growth fueled by mortgage fees and SBA loan sales + Supported by consistent service charge and other noninterest income = Future noninterest income from multiple sources: + Mortgage fees >» Declined in Q1 with industry-wide slowdown a
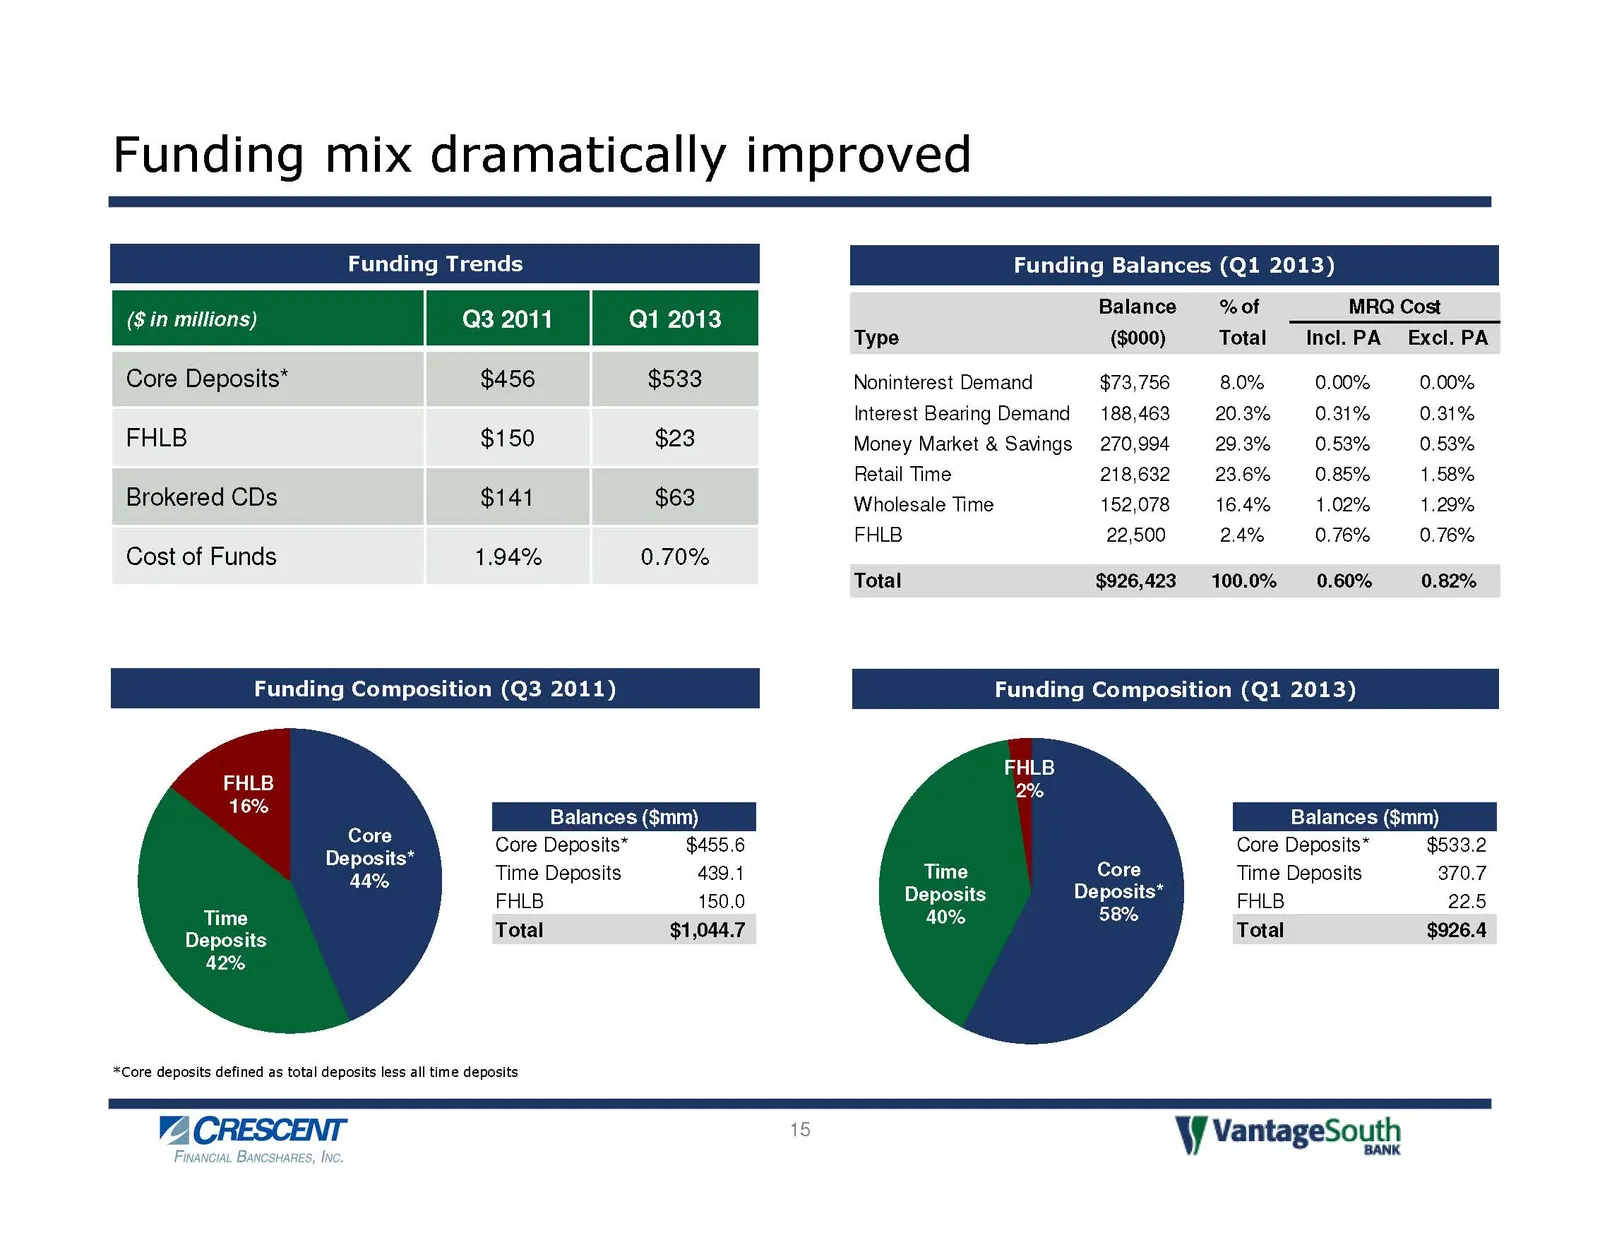
Slide 15: Funding mix dramatically improved
Funding mix dramatically improved Funding Balances (Q1 2013) Q3 2011 2013 Balance % of MRQ Cost Type ($000) Total Incl. PA Excl. PA Core Deposits* $456 $533 Noninterest Demand $73,756 8.0% 0.00% 0.00% Interest Bearing Demand 188,463 20.3% += 0.31% += 0.31% FHLB $150 $23 Money Market & Savings 270,99
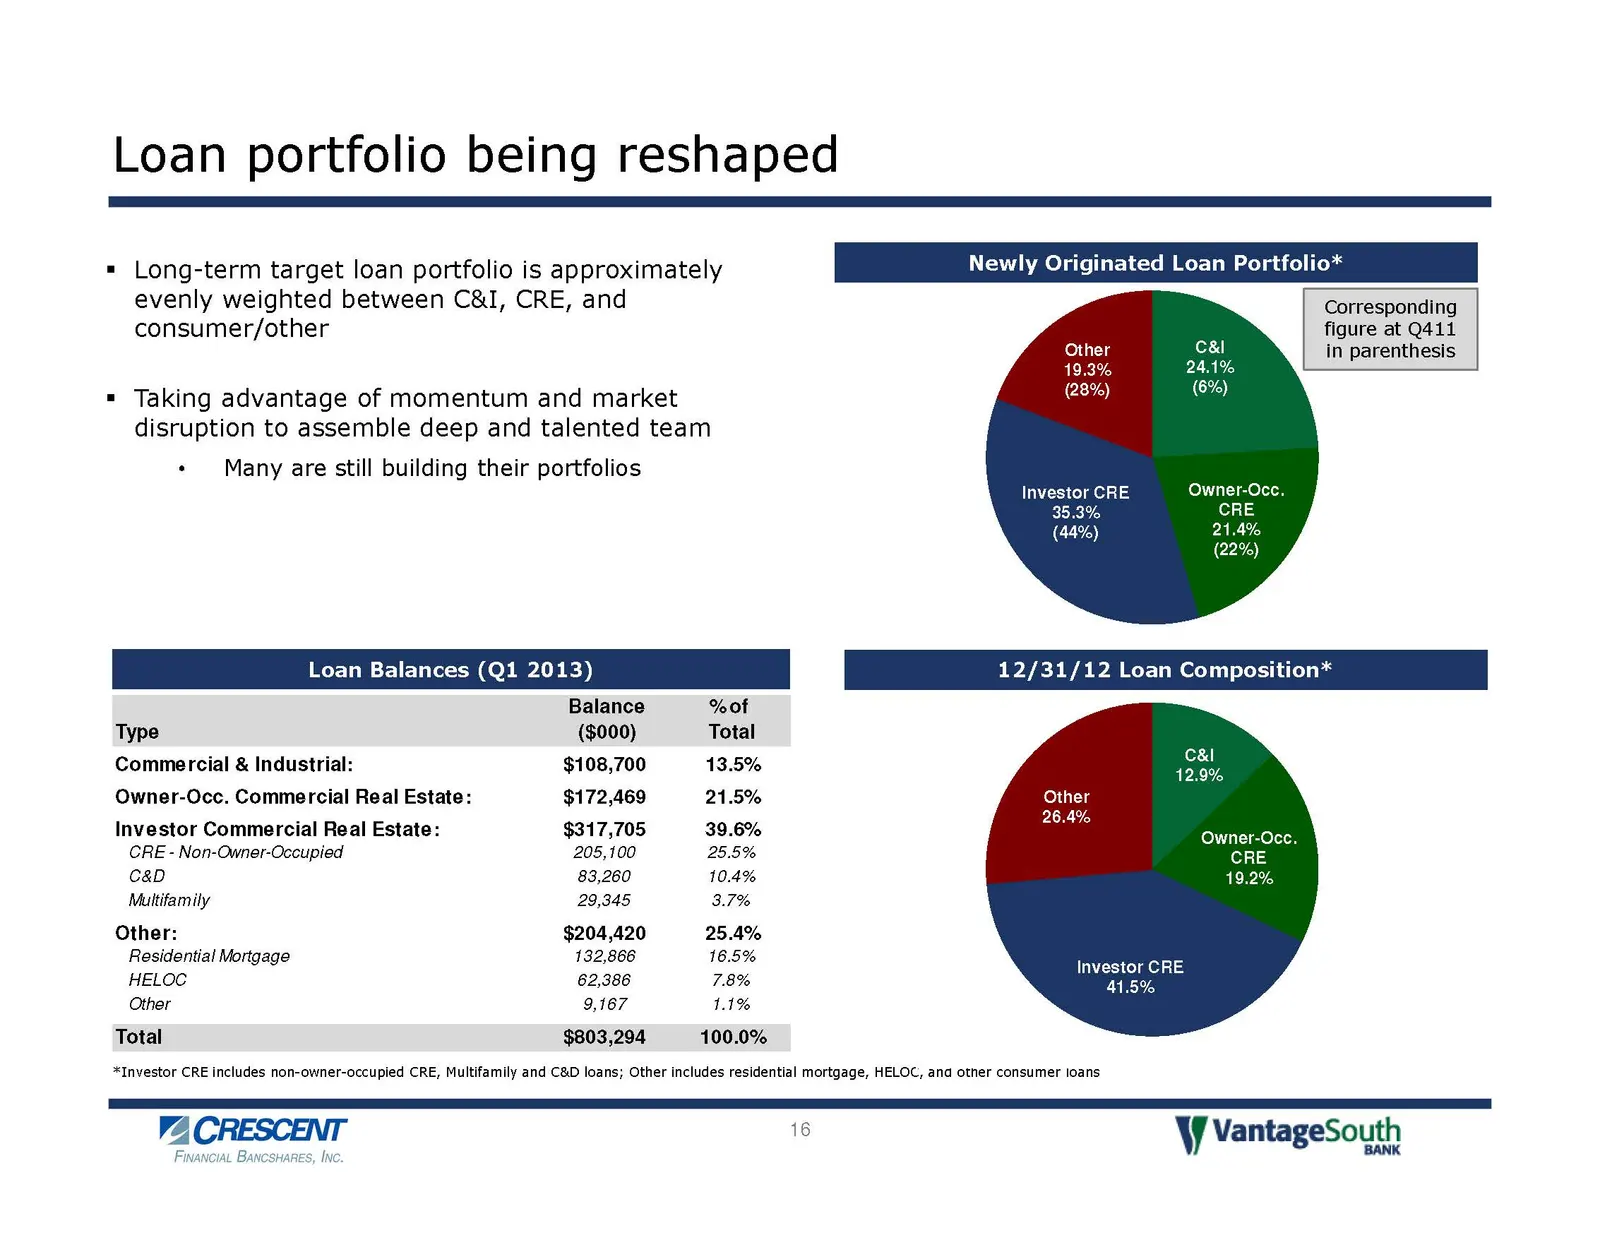
Slide 16: Loan portfolio being reshaped
Loan portfolio being reshaped Long-term target loan portfolio is approximately Newly Originated Loan Portfolio* evenly weighted between C&I, CRE, and Corresponding consumer/other figure at Q411 in parenthesis = Taking advantage of momentum and market disruption to assemble deep and talented team «+
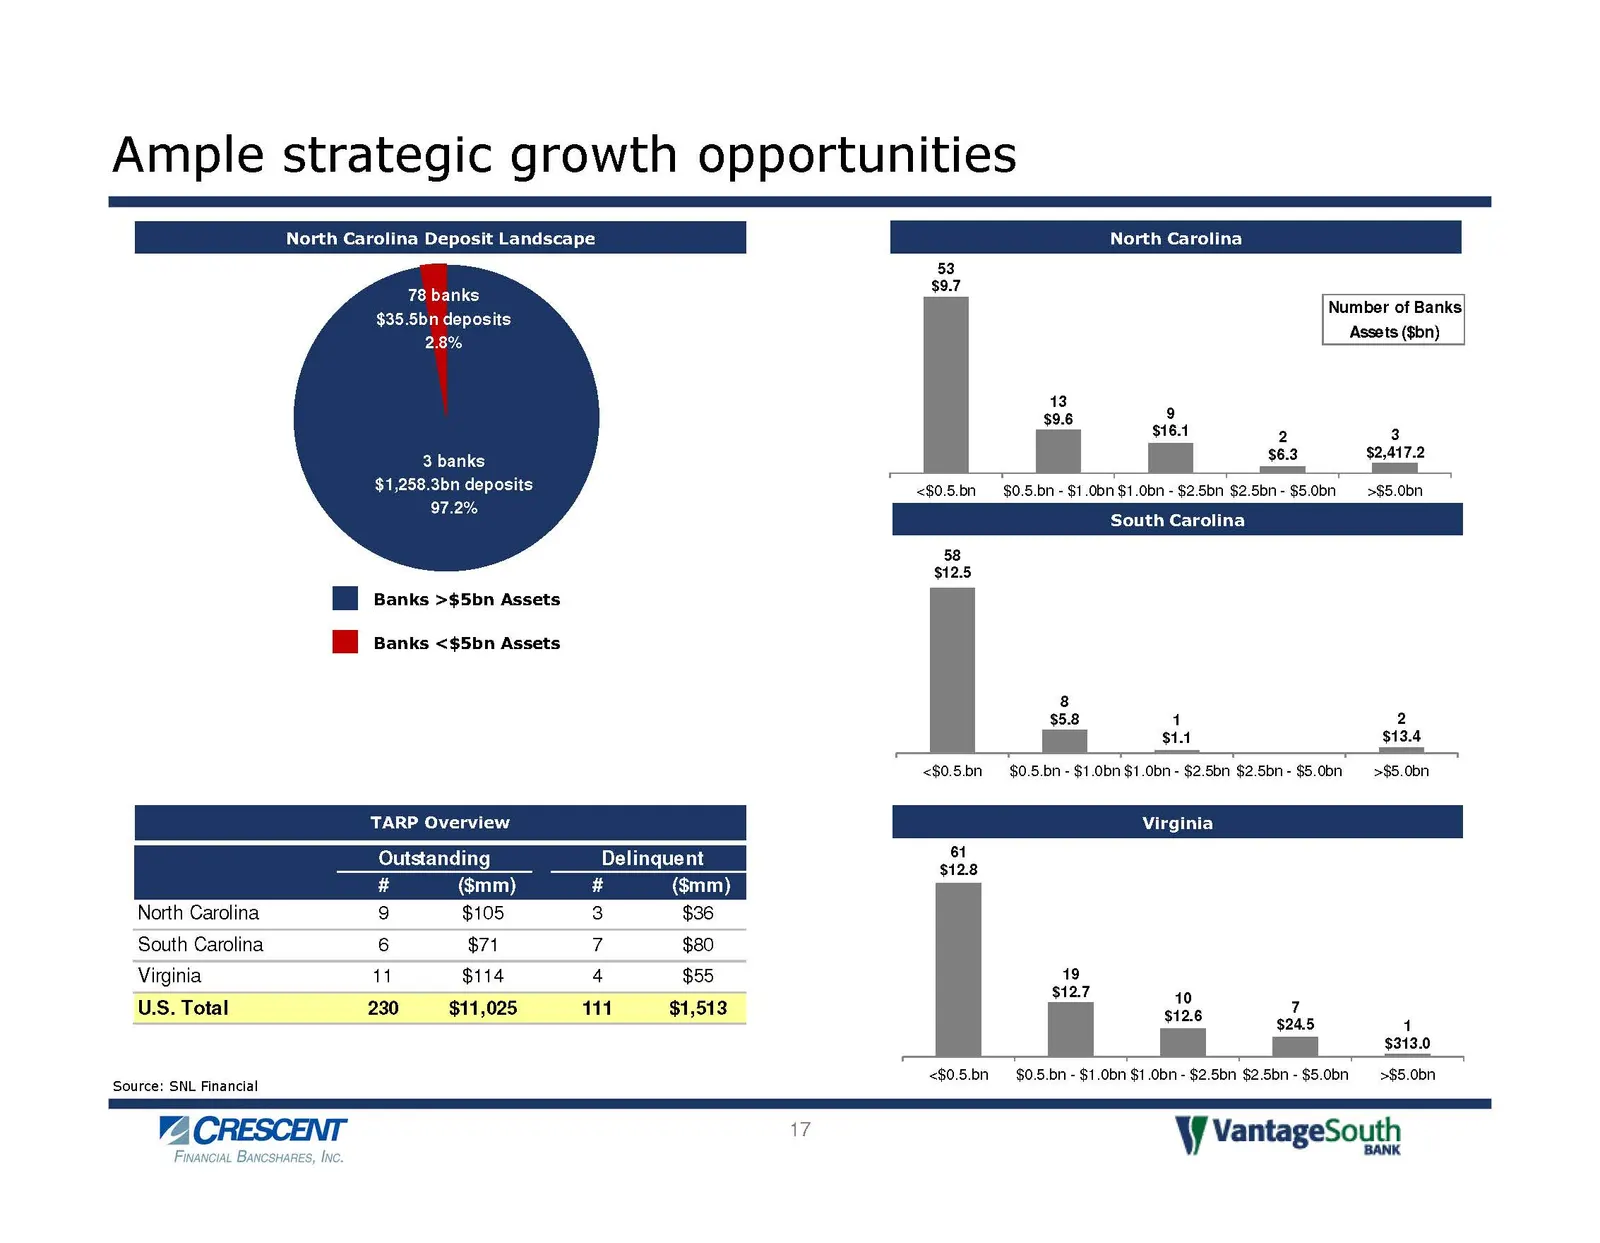
Slide 17: Ample strategic growth opportunities
Ample strategic growth opportunities $9.7 North Caroli 78 banks $35.5bn deposits 2.8% Number of Banks| Assets ($bn) 3 3 banks $2,417.2 $1,258.3bn deposits 97.2 7 South Carolina 58 $12.5 <$0.5.bn _$0.5.bn - $1.0bn $1.0bn - $2.5bn $2.5bn- $5.0bn _ >$5.0bn I Banks >$5bn Assets I Banks <$5bn Assets 8 $5
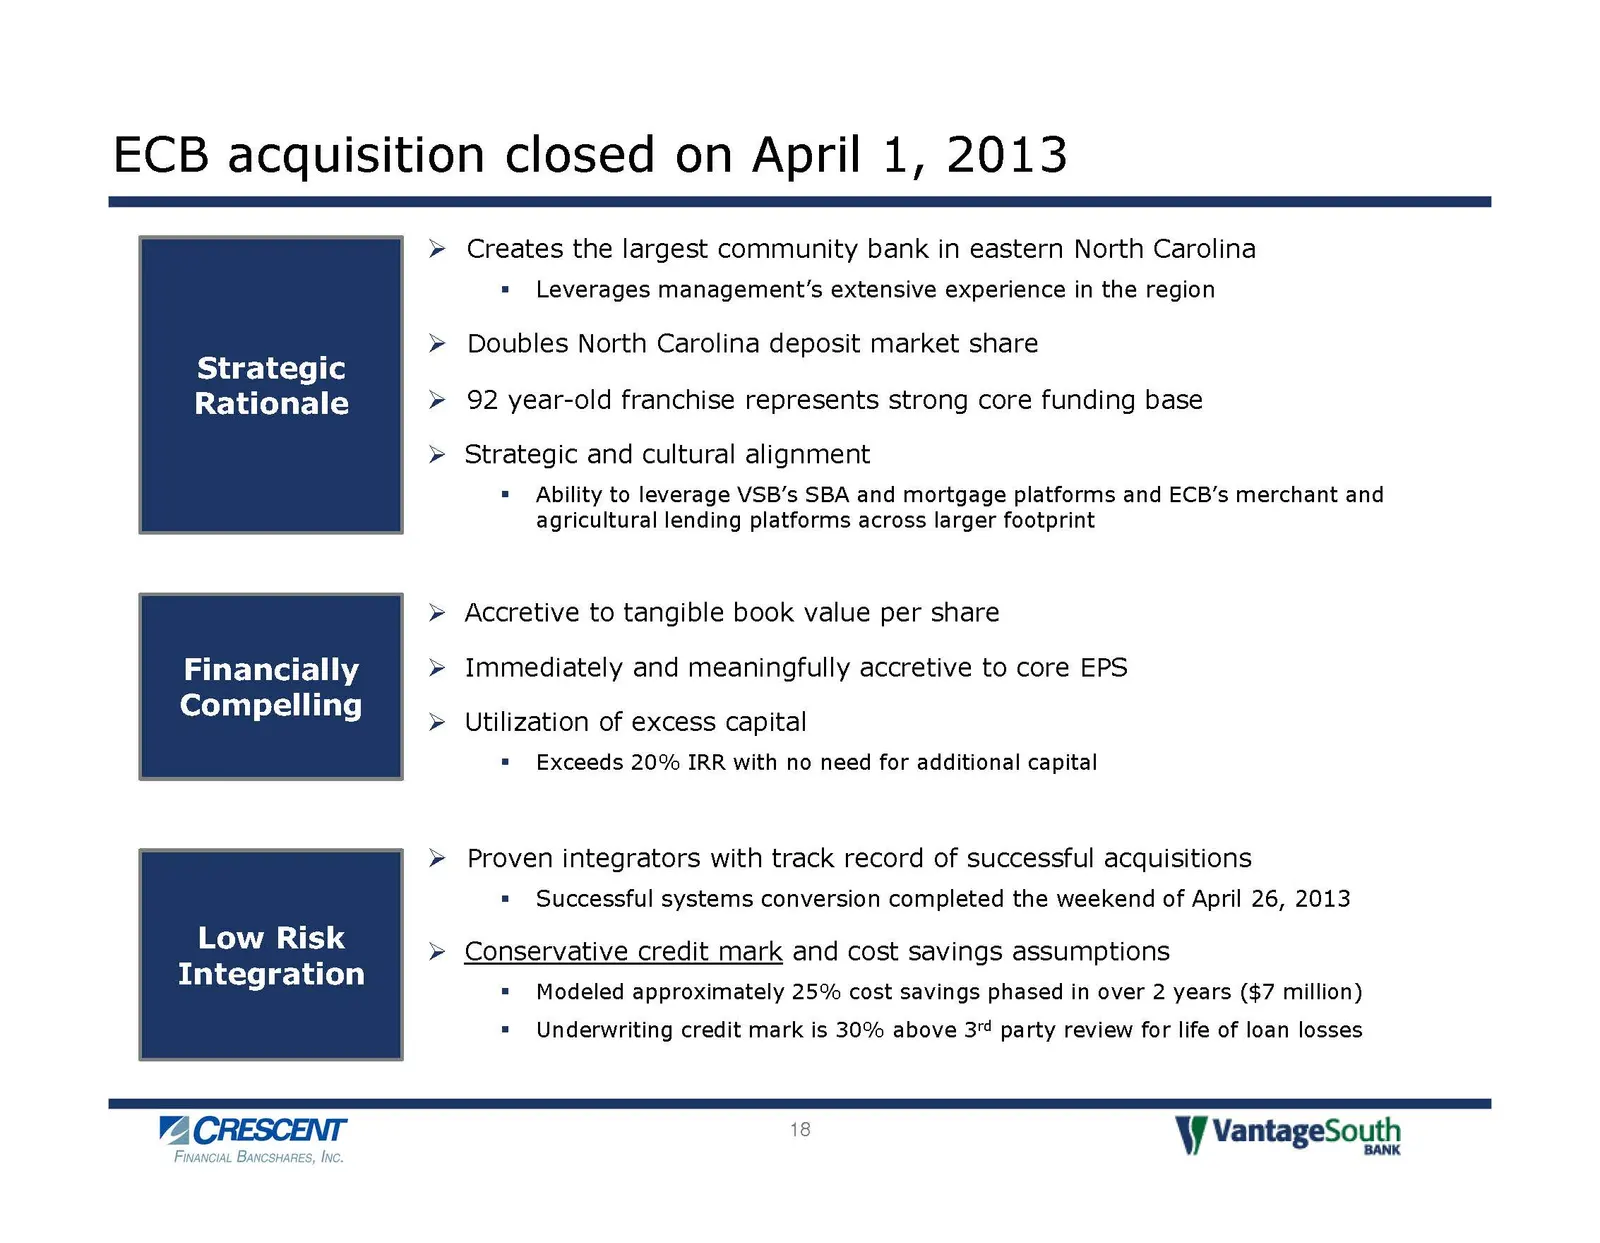
Slide 18: ECB acquisition closed on April 1, 2013
ECB acquisition closed on April 1, 2013 > Creates the largest community bank in eastern North Carolina = Leverages management’s extensive experience in the region . » Doubles North Carolina deposit market share Strategic Rationale > 92 year-old franchise represents strong core funding base > Strateg
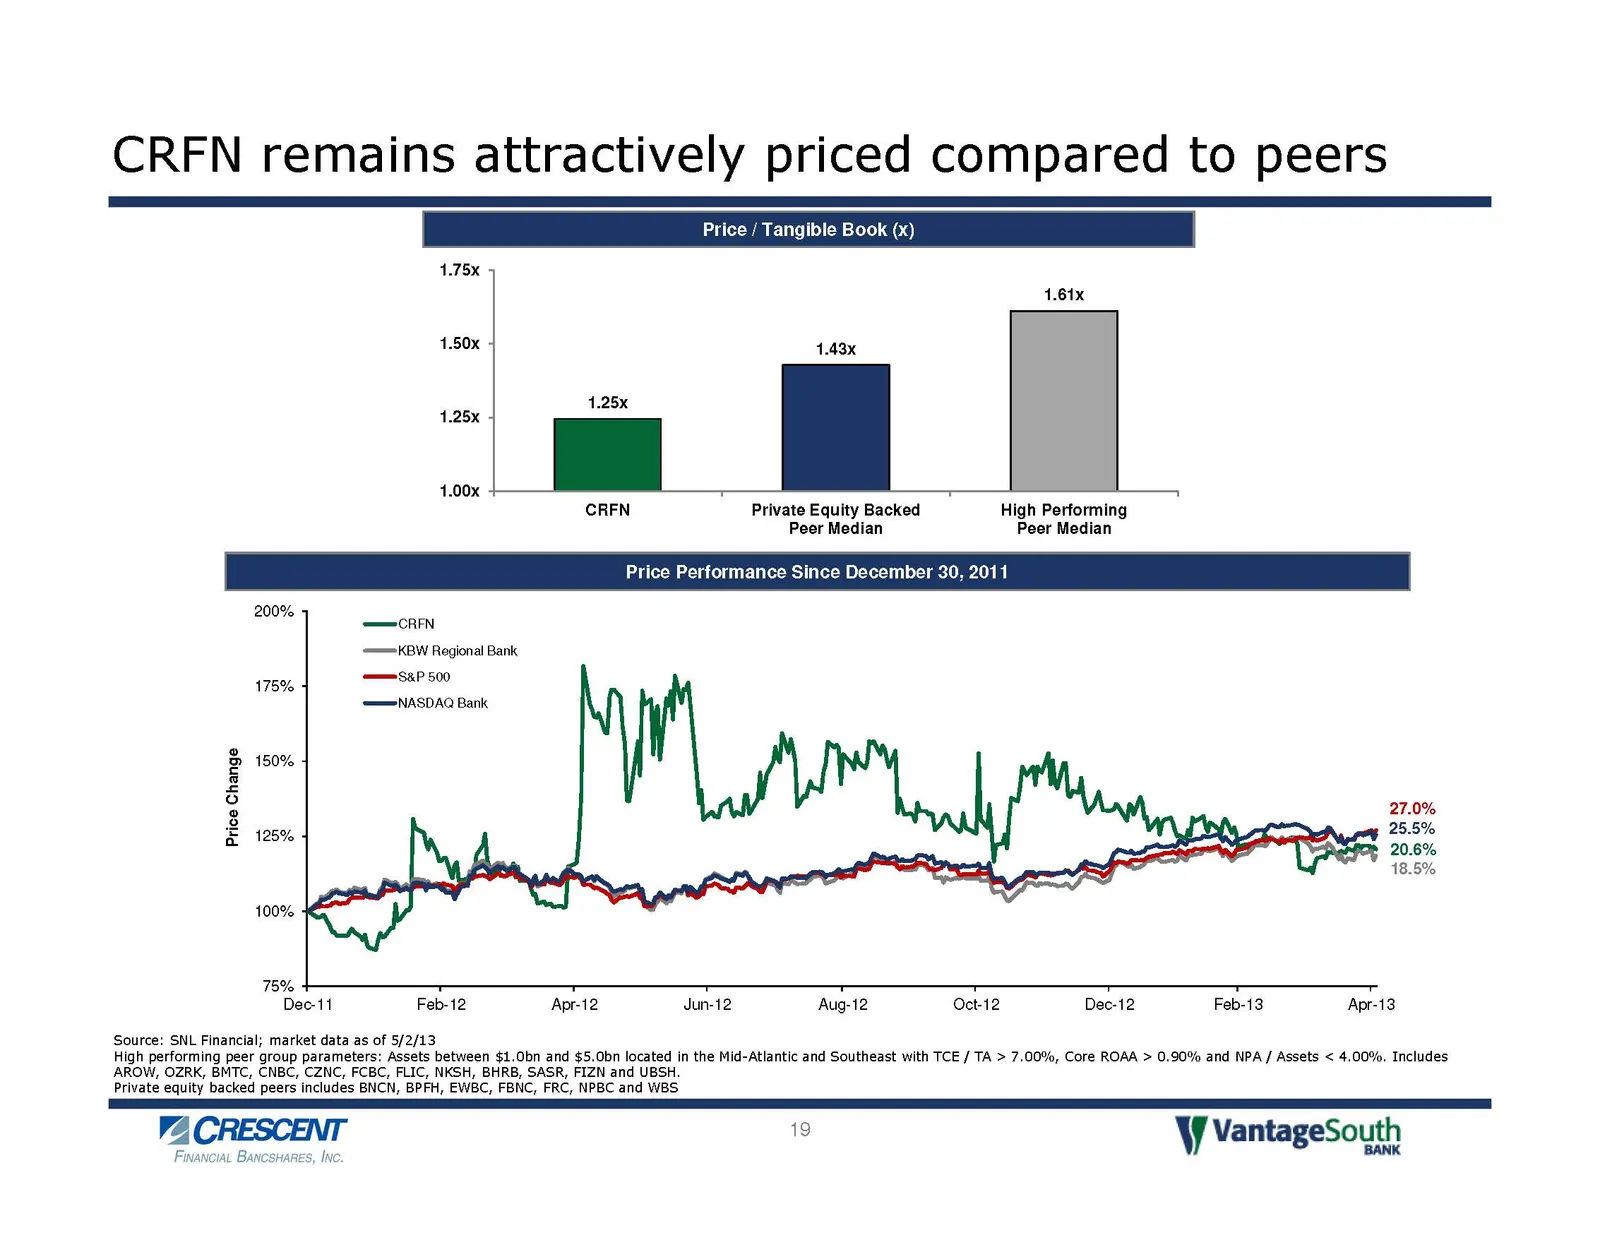
Slide 19: CRFN remains attractively priced compared to peers
CRFN remains attractively priced compared to peers Price / Tangible Book (x) 1.75x 1.61x 1.50% 1.43x 1.25x 1.25x 1.00x + CRFN Private Equity Backed High Performing Peer Median Peer Median Price Performance Since December 30, 2011 200% —crFN —=KBW Regional Bank qrese ser 500 NASDAQ Bank B 150% 5 = 8
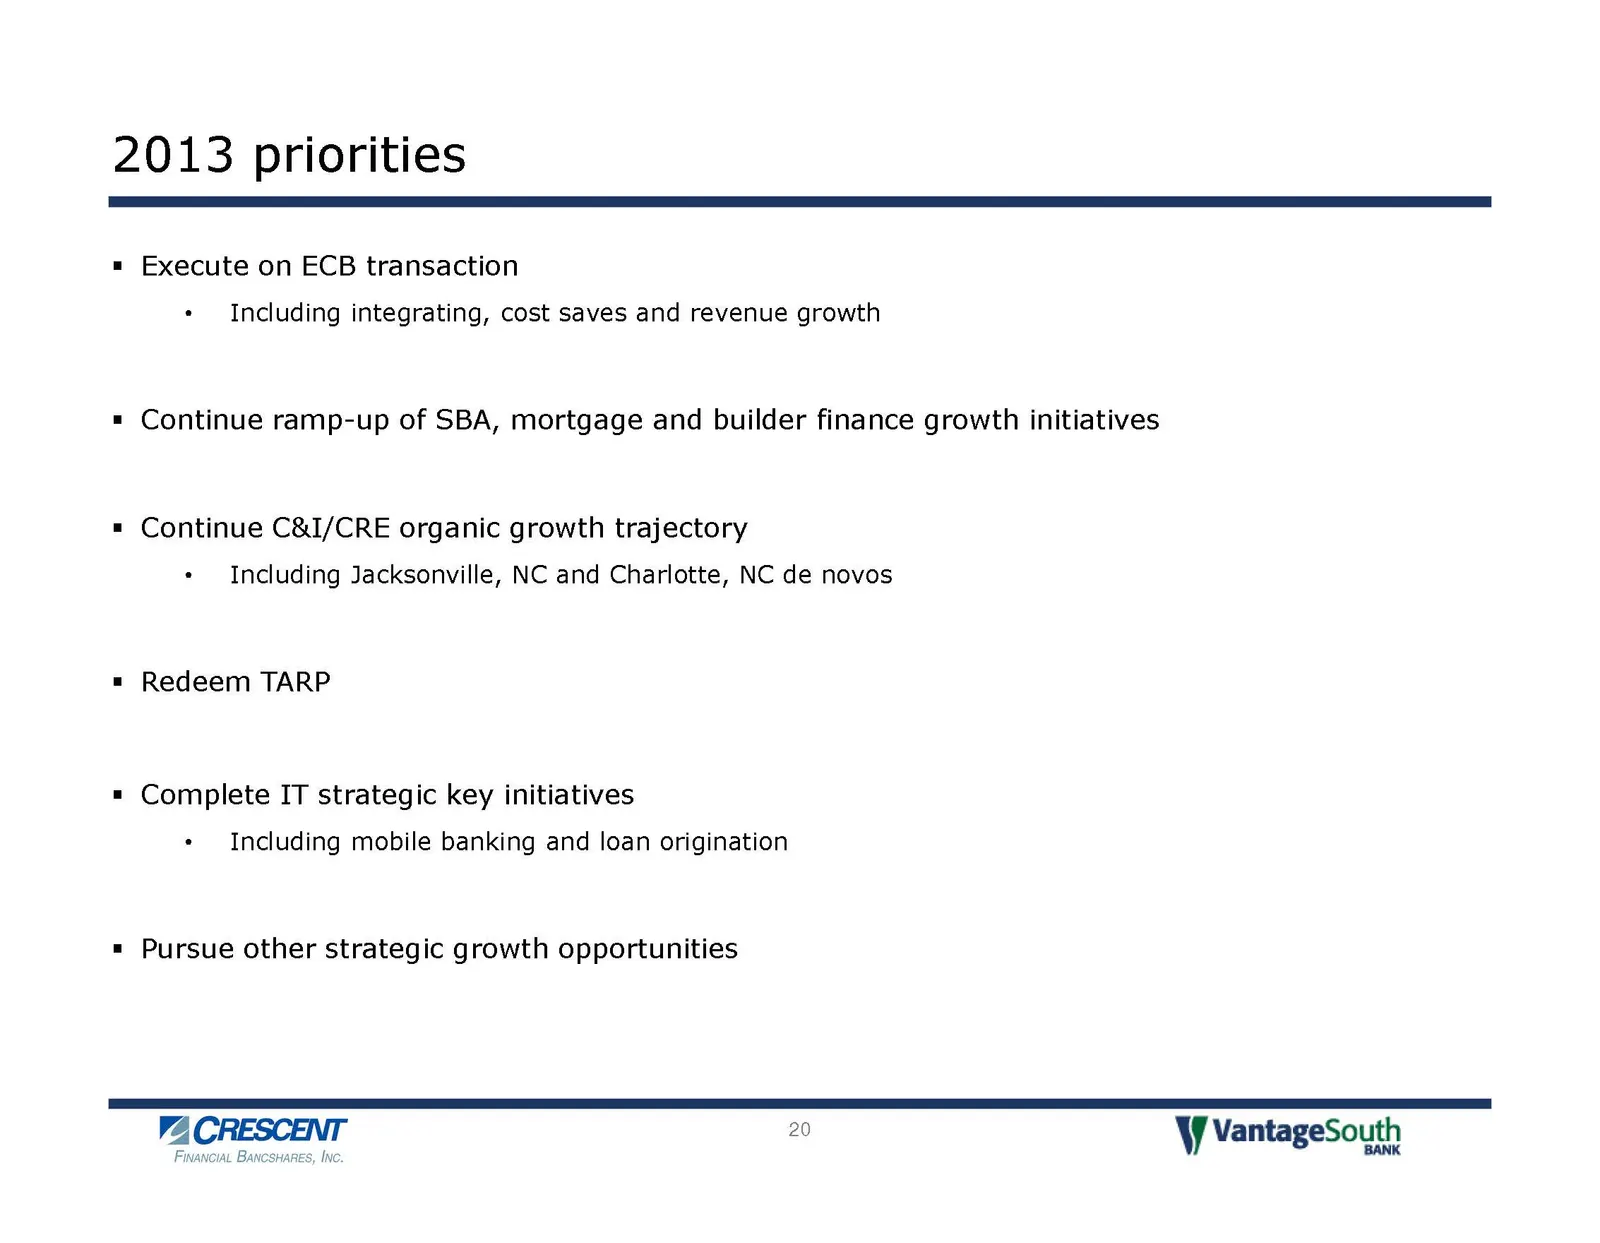
Slide 20: 2013 priorities
2013 priorities = Execute on ECB transaction + Including integrating, cost saves and revenue growth « Continue ramp-up of SBA, mortgage and builder finance growth initiatives * Continue C&I/CRE organic growth trajectory * Including Jacksonville, NC and Charlotte, NC de novos Redeem TARP Complete IT
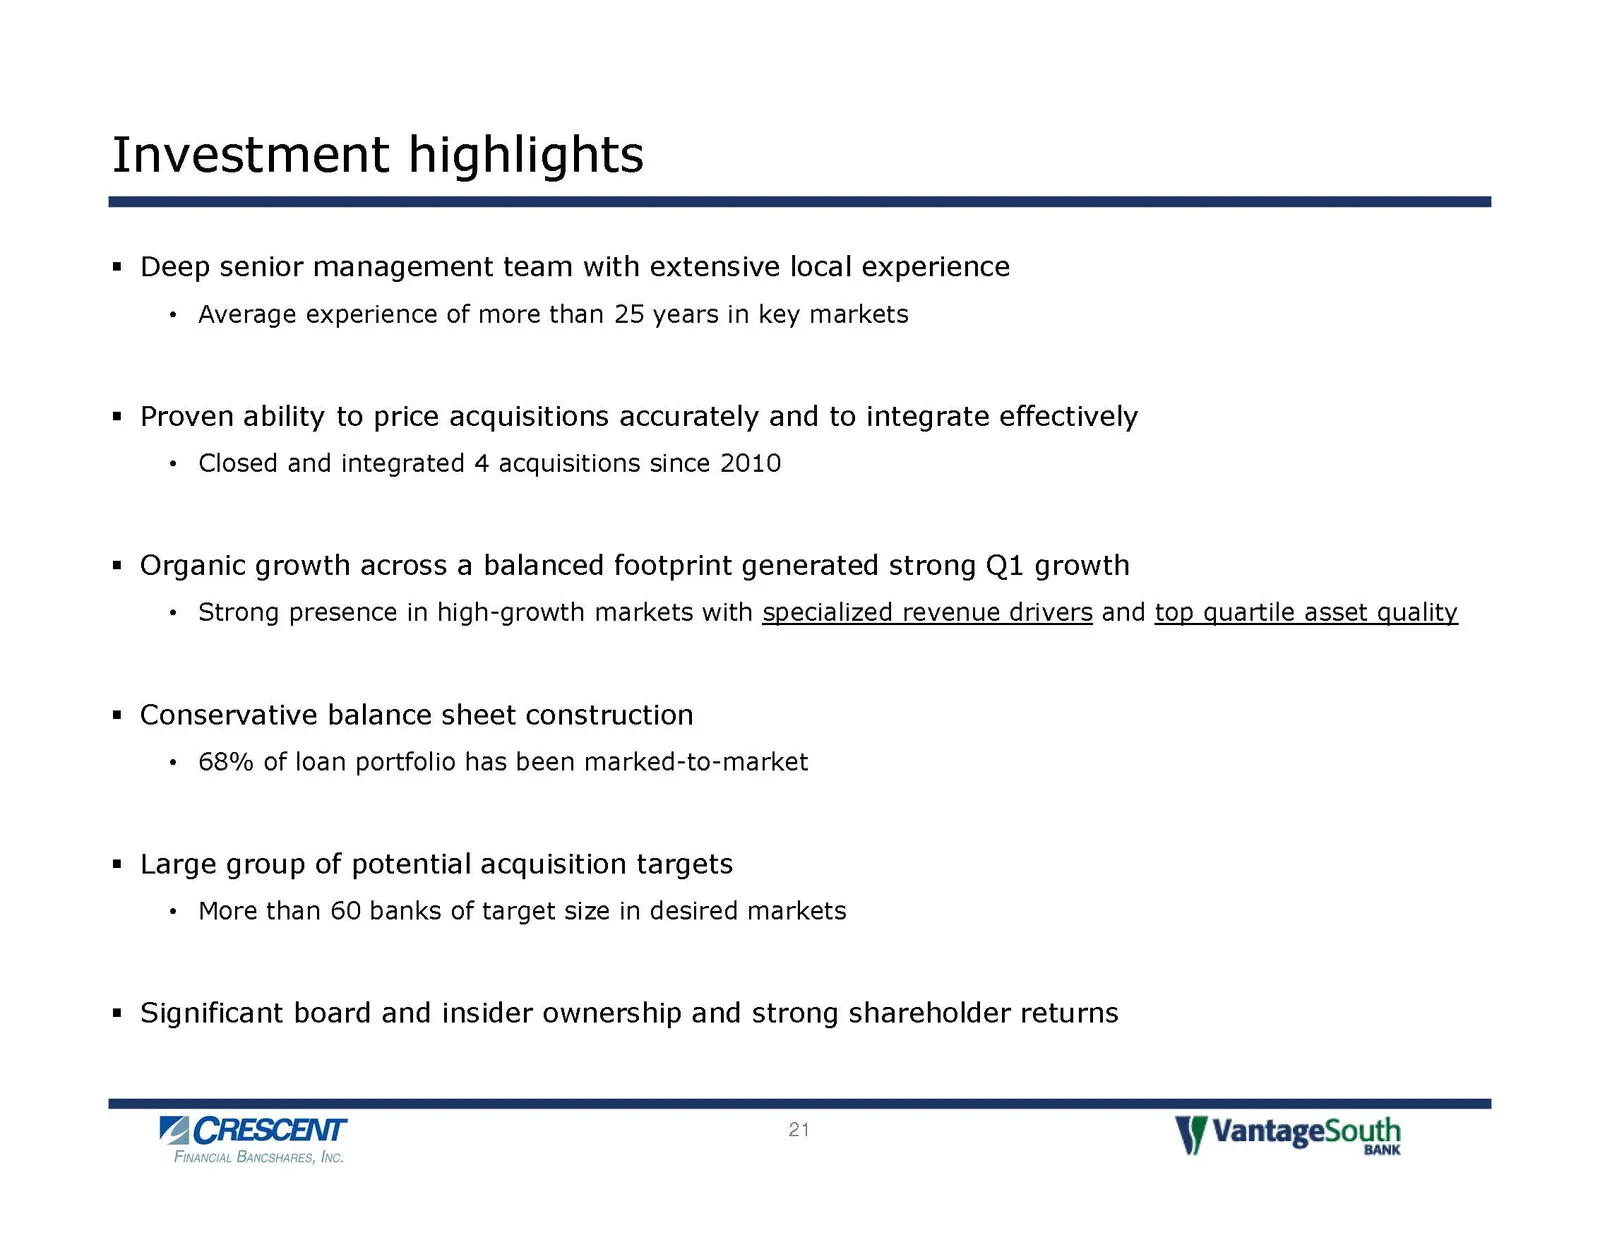
Slide 21: Investment highlights
Investment highlights = Deep senior management team with extensive local experience + Average experience of more than 25 years in key markets « Proven ability to price acquisitions accurately and to integrate effectively * Closed and integrated 4 acquisitions since 2010 " Organic growth across a bal
Slide 22: Appendix
Appendix VA CRESCENT Yy VantageSouth BANK FINANCIAL BANCSHARES, INC. 22
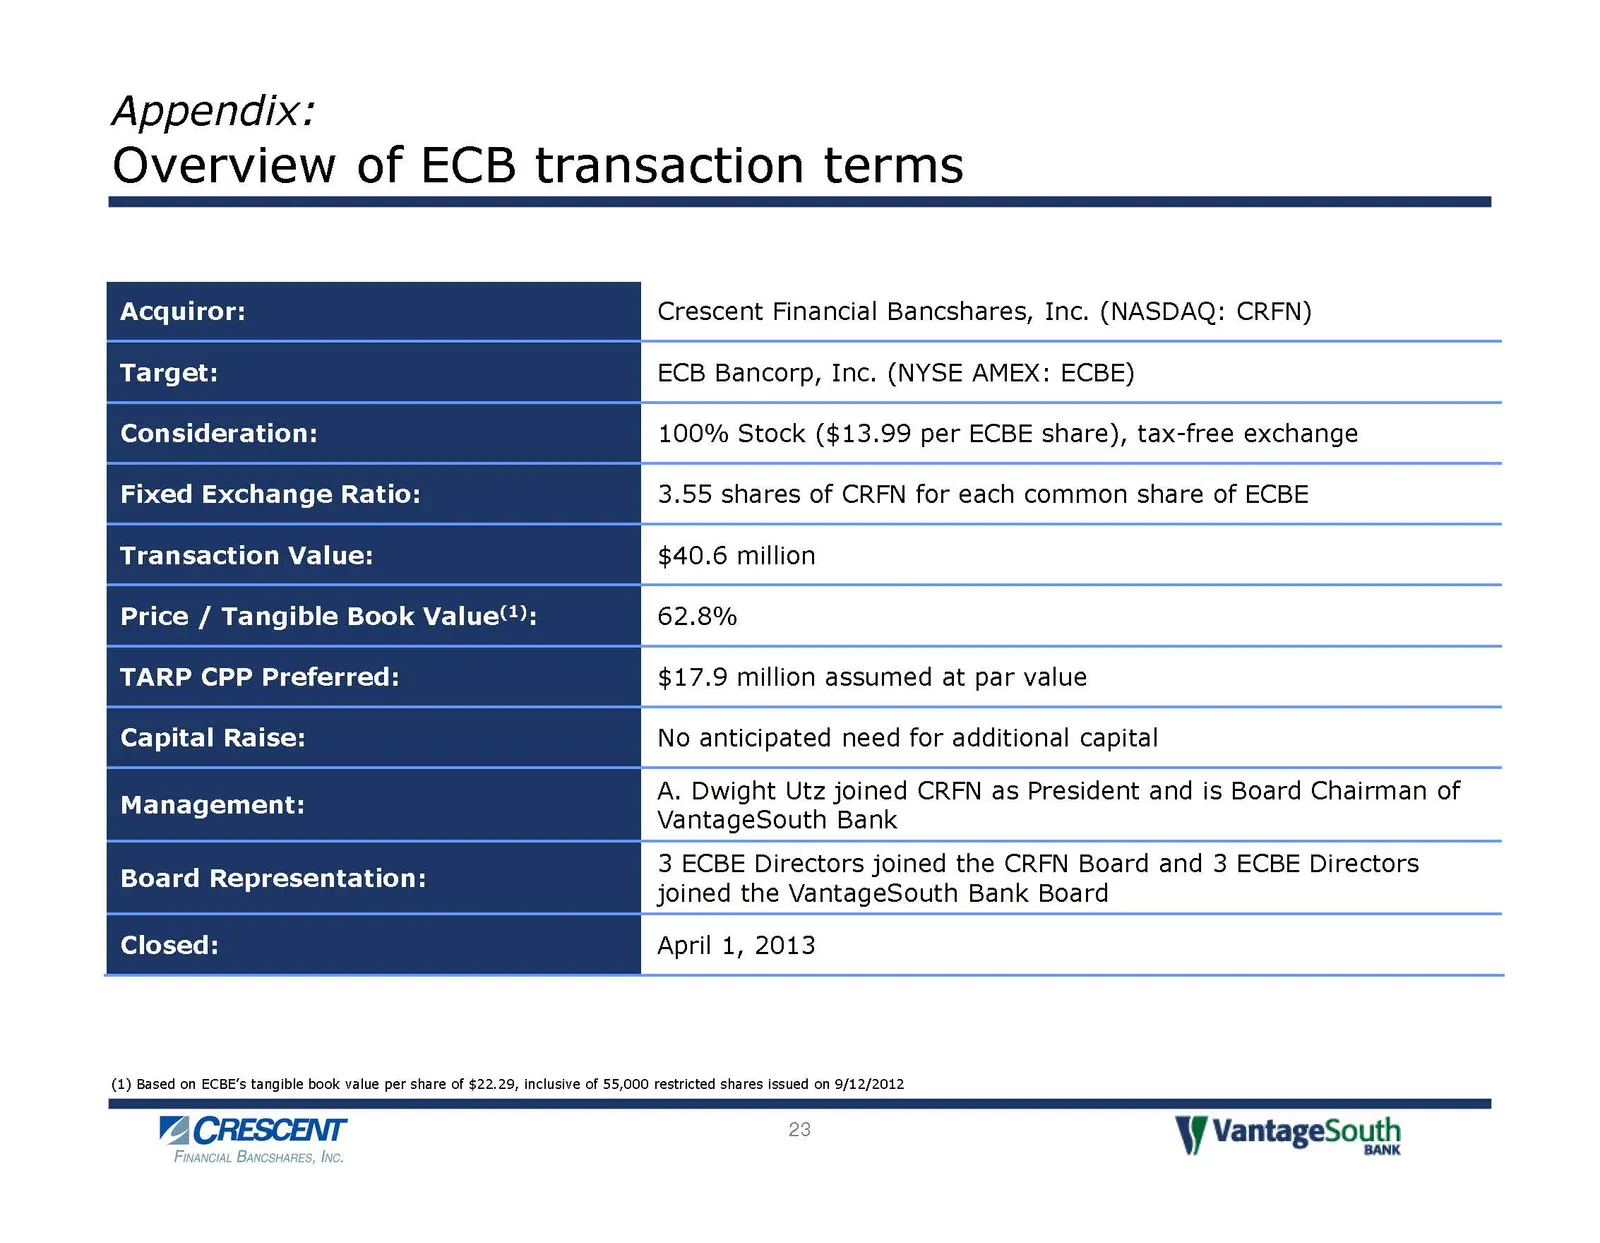
Slide 23: Overview of ECB transaction terms
Appendix: Overview of ECB transaction terms Acquiror: Target: Consideration: Fixed Exchange Ratio: Transaction Value: Price / Tangible Book Value): TARP CPP Preferred: Capital Raise: Management: Board Representation: Closed: Crescent Financial Bancshares, Inc. (NASDAQ: CRFN) ECB Bancorp, Inc. (NYSE
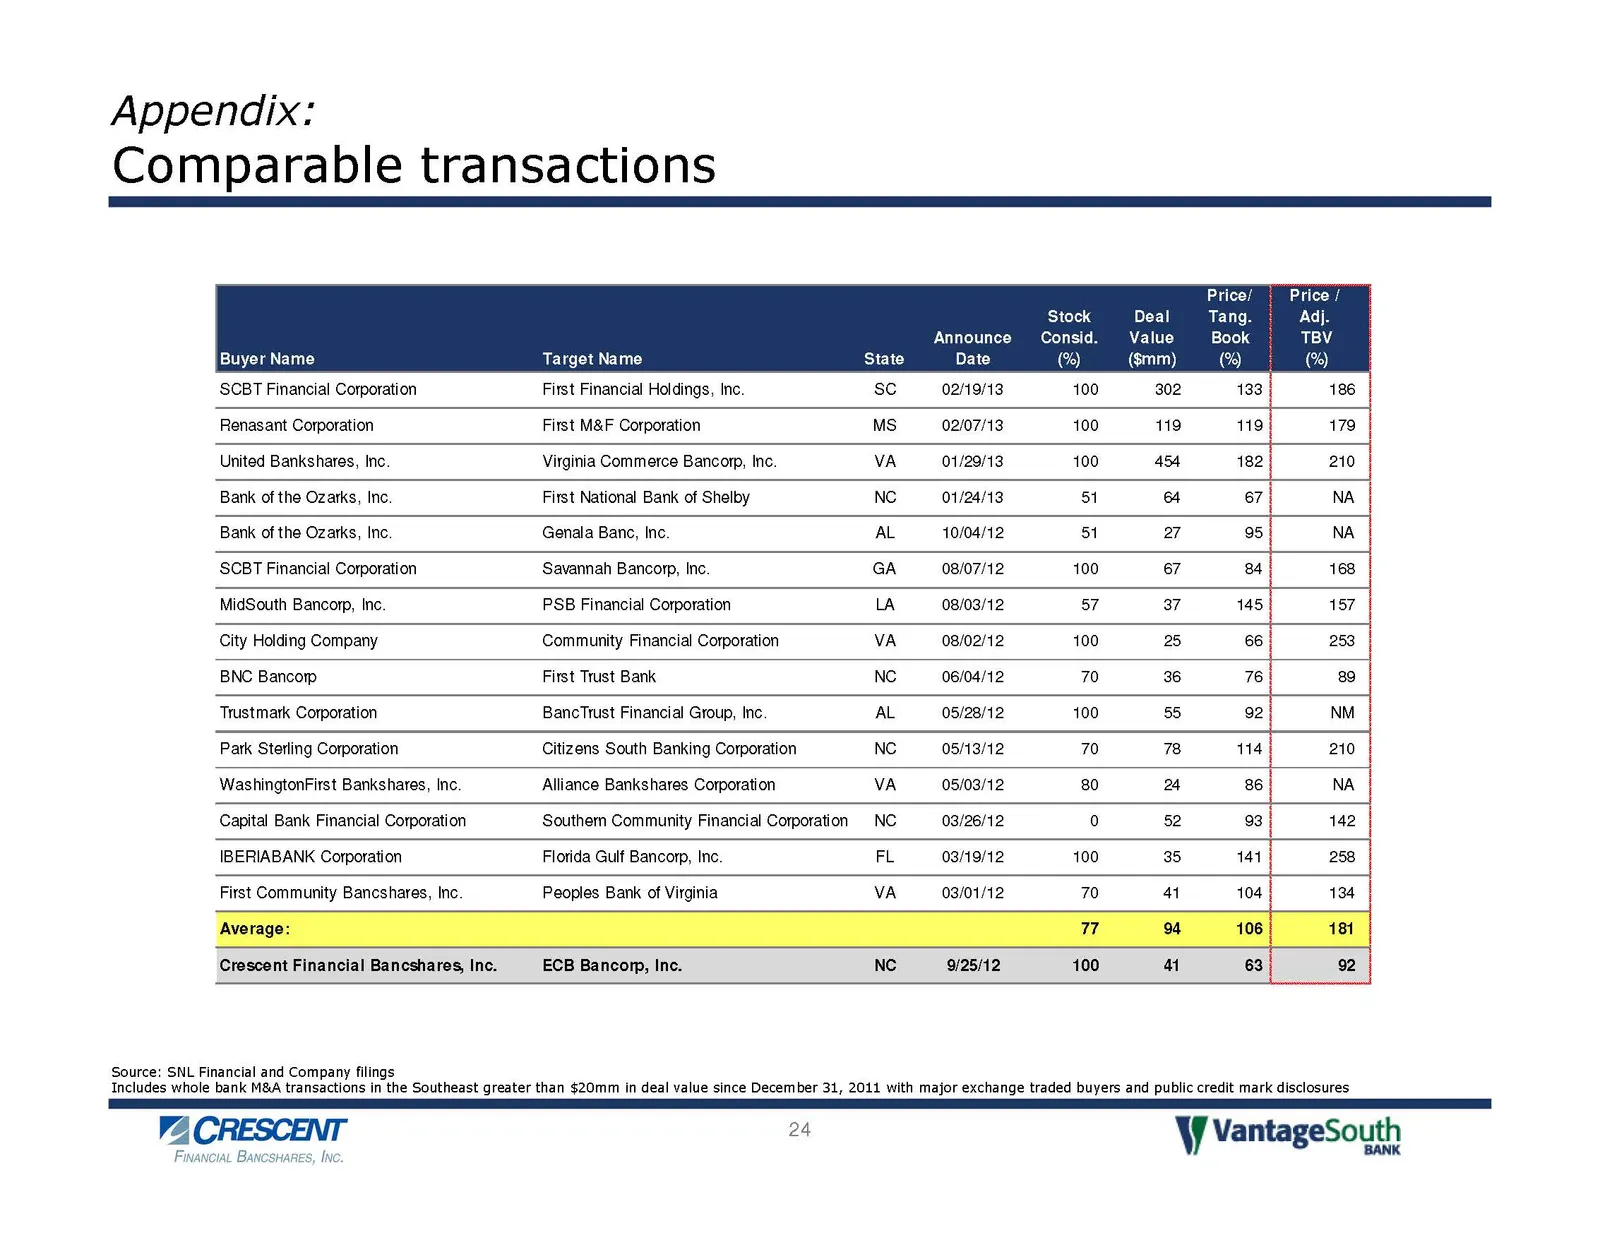
Slide 24: Comparable transactions
Appendix: Comparable transactions Price) | Price / Stock Tang. Adj. Announce _Consid. Book TBV Buyer Name Target Name Date (6) (%) (%) SCBT Financial Corporation First Financial Holdings, Inc. SC 02/9/13 400 302 133 186 Renasant Corporation First M&F Corporation MS 02/07/13 400 119 119 179 United Ba
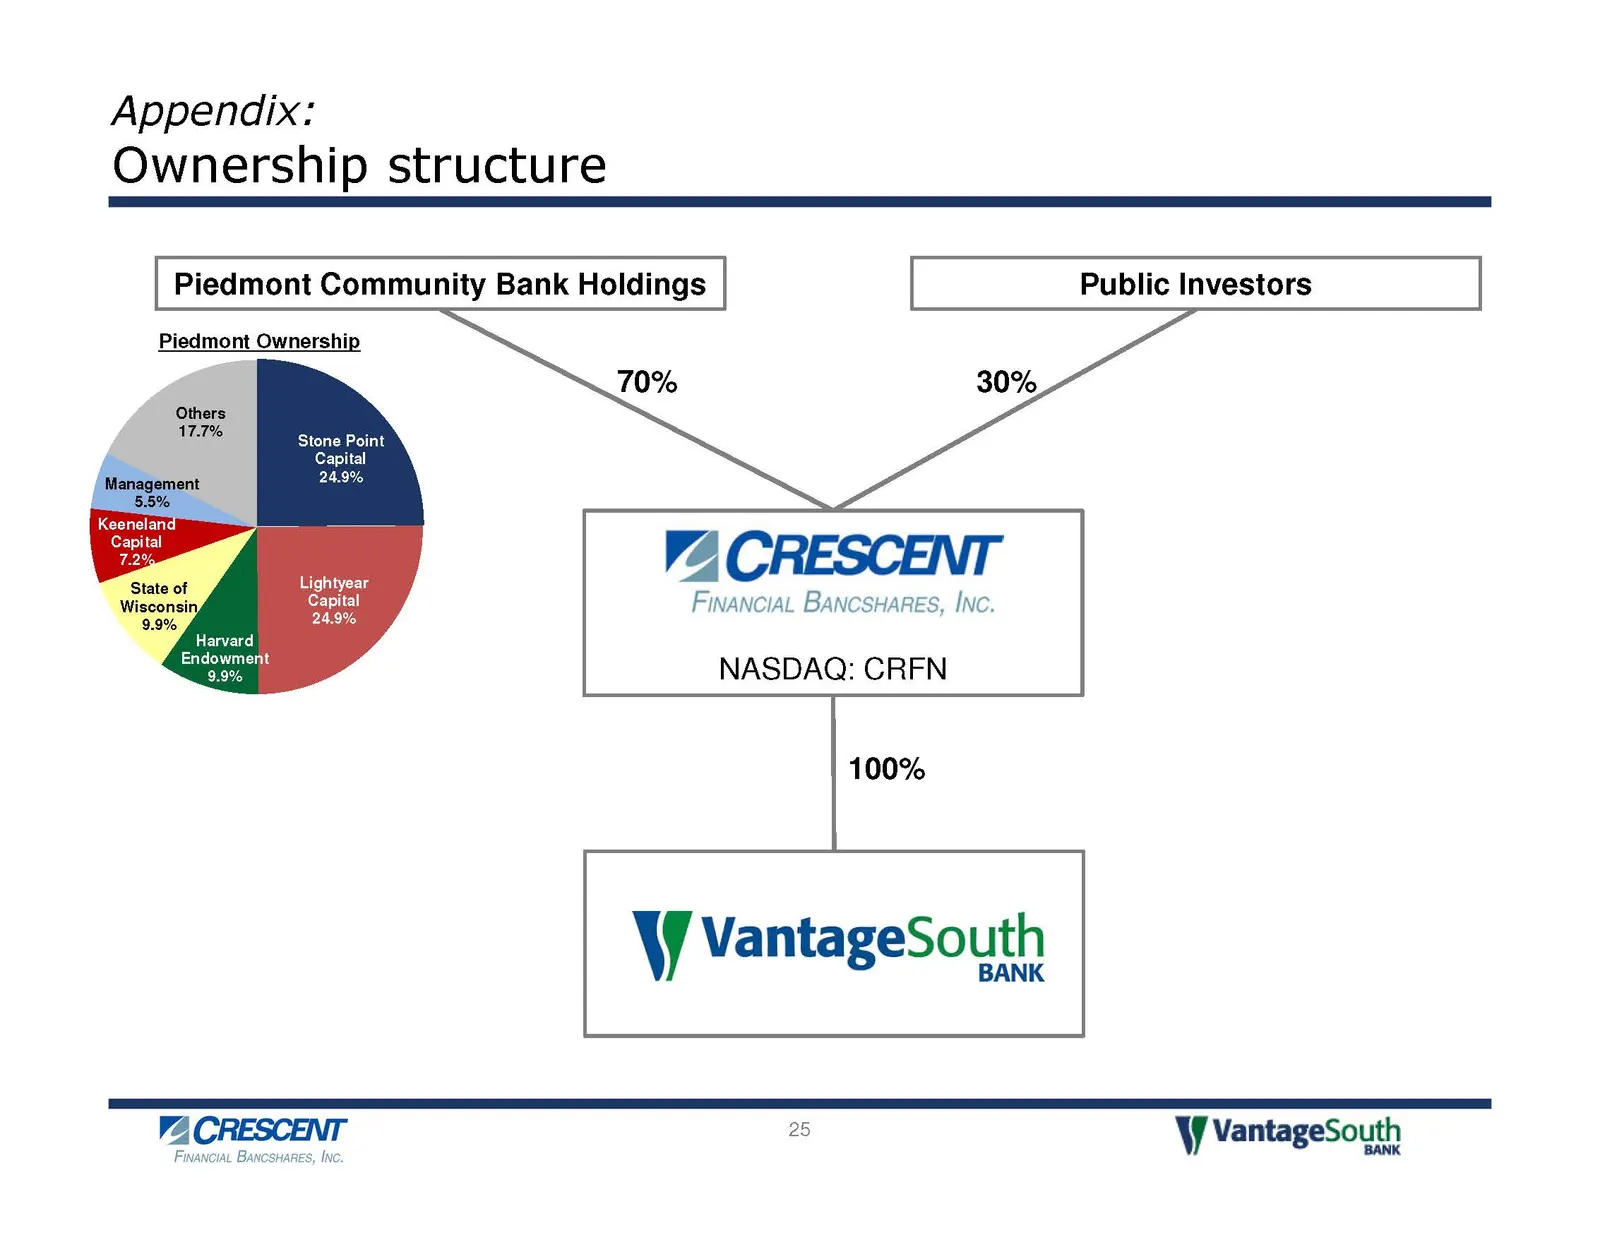
Slide 25: Ownership structure
Appendix: Ownership structure Piedmont Community Bank Holdings Public Investors Piedmont Ownership 70% 30% Stone Point Capital 24.9% Keeneland ag V2. CRESCENT Lightyear Capita FINANCIAL BANCSHARES, INC. y Harvard Endowment NASDAQ: CRFN 100% YJ VantageSouth BANK 25 Y VantageSouth

Slide 26: Presenter biographies and contact information
Appendix: Presenter biographies and contact information Scott M. Custer - Chief Executive Officer of VantageSouth Bank Email: [email protected] Phone: 919-659-9002 Scott Custer has been a director of VantageSouth Bank since February 2010, and a director and Chief Executive Officer of VantageSouth
Source: SEC EDGAR · 8-K filed May 15, 2013
More decks from Vantagesouth Bancshares Inc.
 Gulf South Conference (May 2014)25 slides · May 12, 2014
 Q1 2014 Earnings Presentation15 slides · Apr 23, 2014
 Merger or Acquisition (March 2014)23 slides · Mar 4, 2014
 Merger or Acquisition (January 2014)15 slides · Jan 27, 2014
 Investor Presentation (December 2013)17 slides · Dec 18, 2013
 Q3 2013 Earnings Presentation14 slides · Oct 30, 2013