Investors Bancorp — Shareholder Meeting (May 2013)
16 slides from Investors Bancorp's shareholder meeting presentation, May 31, 2013
Slide 1: Investors Presentation Annual Shareholder Meeting
Exhibit 99.1 © Investors Presentation Annual Shareholder Meeting May 30, 2012 & investorsBancorp, ne
Slide 2: Forward Looking Statements
Investors Bancorp, Inc. Investor Presentation Forward Looking Statements Certain statements contained herein are “forward looking statements” within the meaning of Section 27A of the Securities Act of 1933 and Section 21E of the Securities Exchange Act of 1934. Such forw looking statements may t be
Slide 3: Core Values
& investorsBancorp, ne. Core Values % Cooperation The act of working together towards a common purpose or benefit. % Character The combination of features and traits that form the individual nature of a person or team. % Community A self-organized network of people who collaborate by sharing ideas a
Slide 4: Corporate Profile
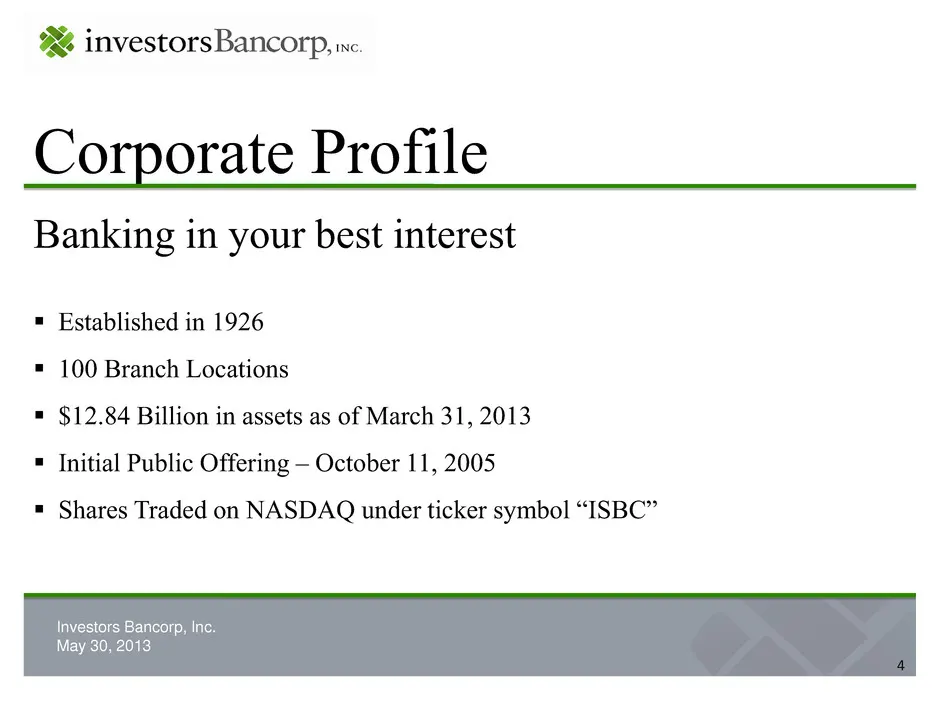
& investorsBancorp, ne. Corporate Profile Banking in your best interest = Established in 1926 = 100 Branch Locations = $12.84 Billion in assets as of March 31, 2013 = Initial Public Offering — October 11, 2005 = Shares Traded on NASDAQ under ticker symbol “ISBC” Investors Bancorp, Inc. May 30, 2013
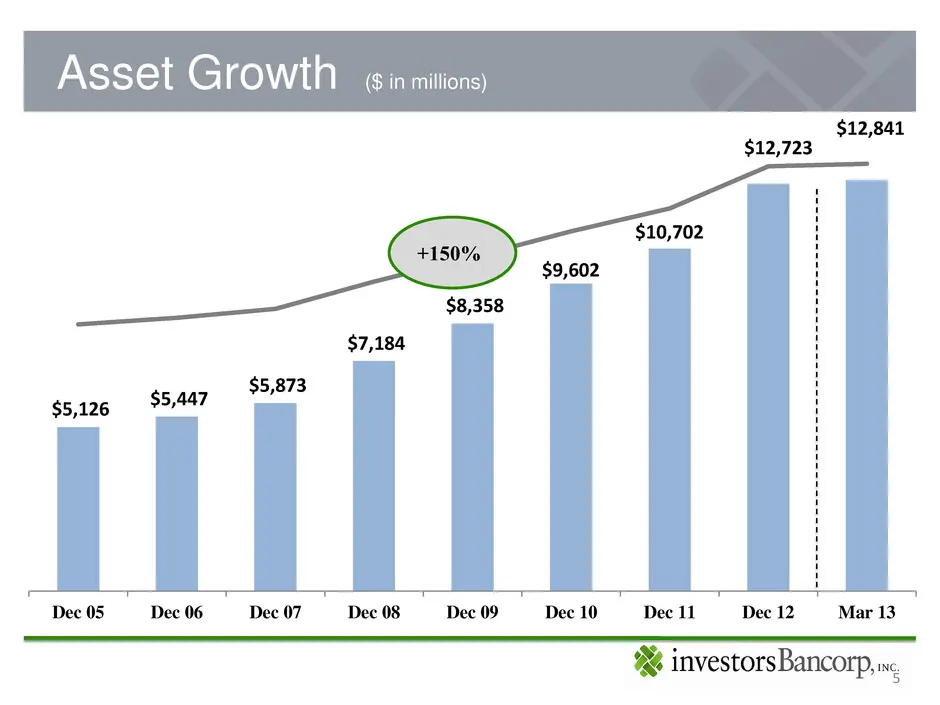
Slide 5: Asset Growth
sset Growth ginmitions) $12,841 $12,723 $8,358 $7,184 5,873 $5,126 $5447 i. Dec 05 Dec 06 Dec 07 Dec 08 Dec 09 Dec 10 Dec 11 Dec 12 Mar 13 %& investorsBancorp, n« i
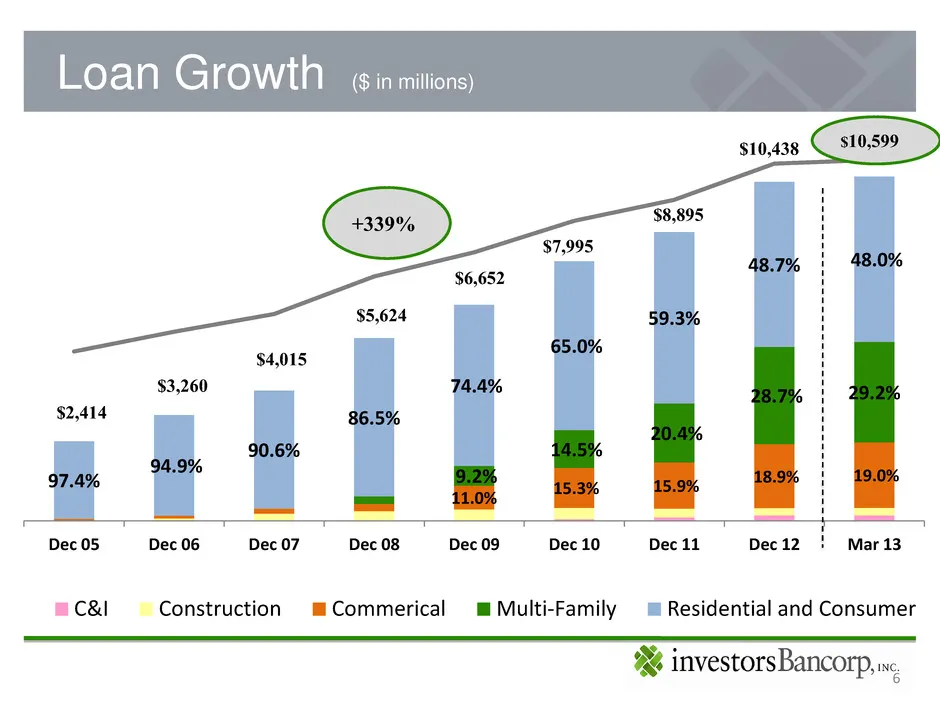
Slide 6: Loan Growth
Loan Growth (8 in millions) $10,438 38,895 $7,995 $5,624 $4,015 $3,260 Dec 05 Dec 06 Dec 07 Dec 08 Dec 09 Dec 10 Dec 11 Dec 12 Mar 13 C&l = Construction Commerical m Multi-Family ™ Residential and Consumer %& investorsBancorp, n- 6
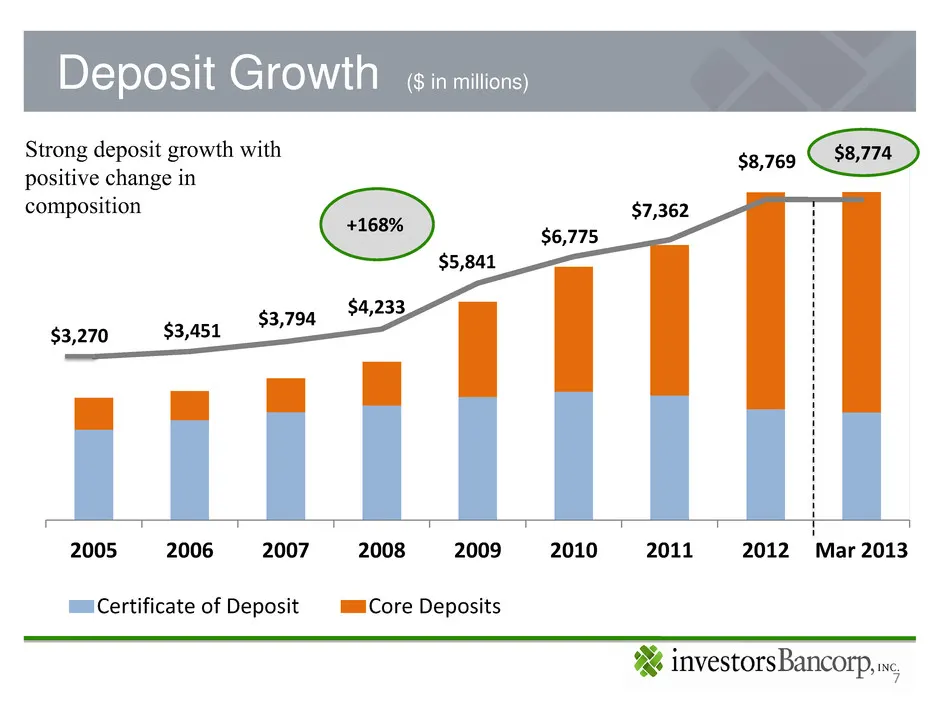
Slide 7: Deposit Growth
($ in millions) Deposit Grow Strong deposit growth with $8,769 positive change in composition (wee) $5,841 $4,233, $3,794 $3,270 $3,451 2005 2006 2007 2008 2009 2010 2011 2012 Mar 2013 M@aCertificate of Deposit | mmCore Deposits %& investorsBancorp, n- 7
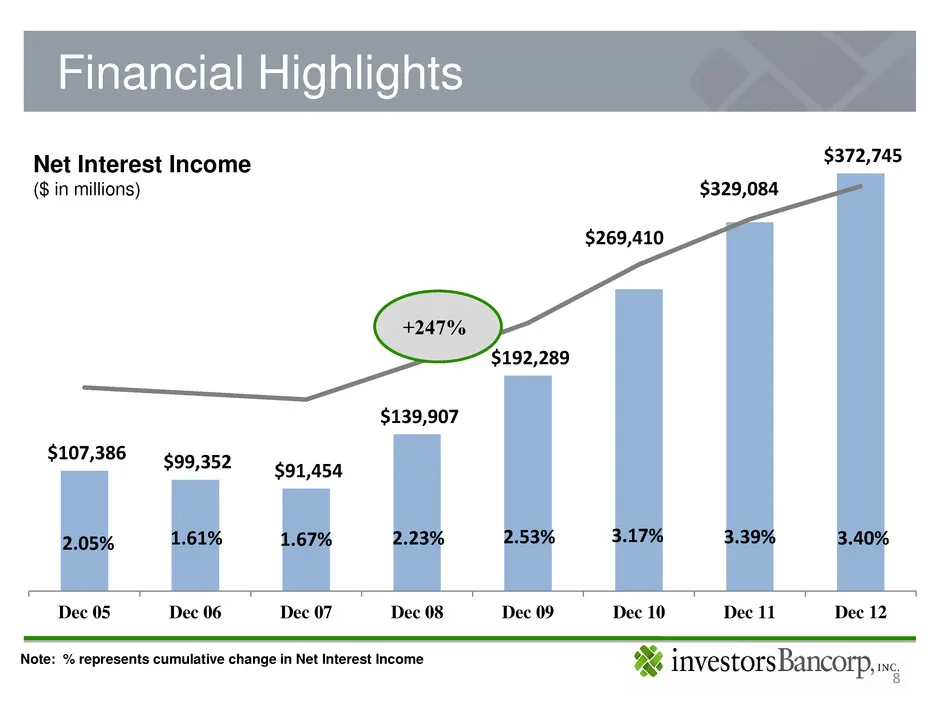
Slide 8: Financial Highlights
ial Highlig Net Interest Income $372,745 ($ in millions) $329,084 $139,907 $107,386 : $99,352 g91,454 2.05% 1.61% 1.67% 2.23% 2.53% 3.17% 3.39% 3.40% Dec 05 Dec 06 Dec 07 Dec 08 Dec 09 Dec 10 Dec 11 Dec 12 Note: %& investorsBancorp,
Slide 9: Opportunities and Growth - Acquisitions
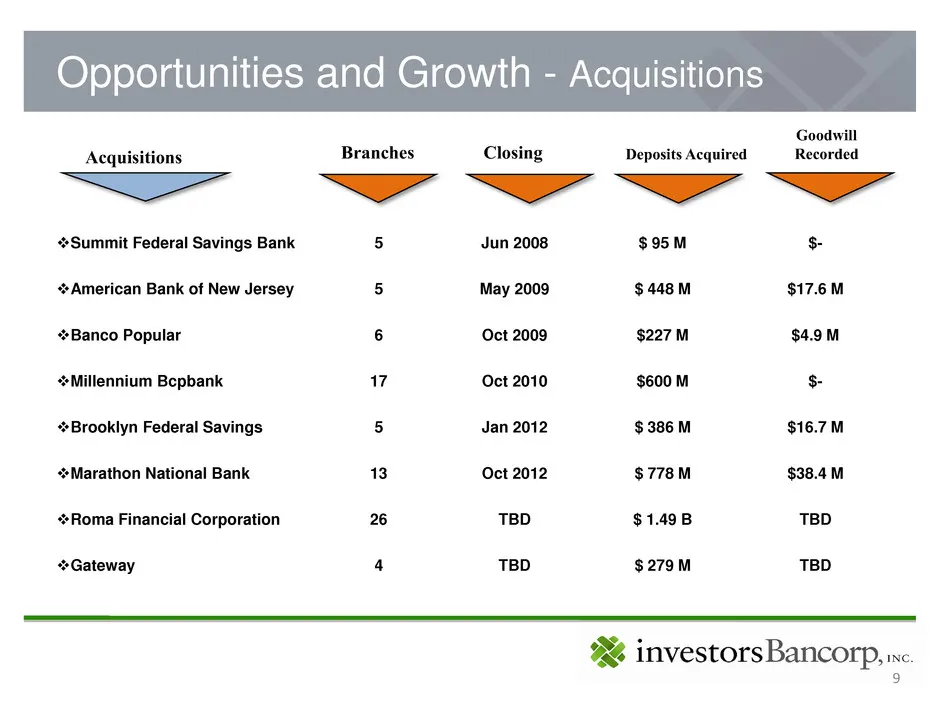
Opportunities and Growth - Acquisitions Goodwill Acquisitions Branches Closing Deposits Acquired Recorded Summit Federal Savings Bank 5 Jun 2008 $95M $- “American Bank of New Jersey 5 May 2009 $448M $17.6M “Banco Popular 6 Oct 2009 $227M $4.9M Millennium Bepbank af Oct 2010 $600 M $- “Brooklyn Feder
Slide 10: Opportunities and Growth - De Novo Branches
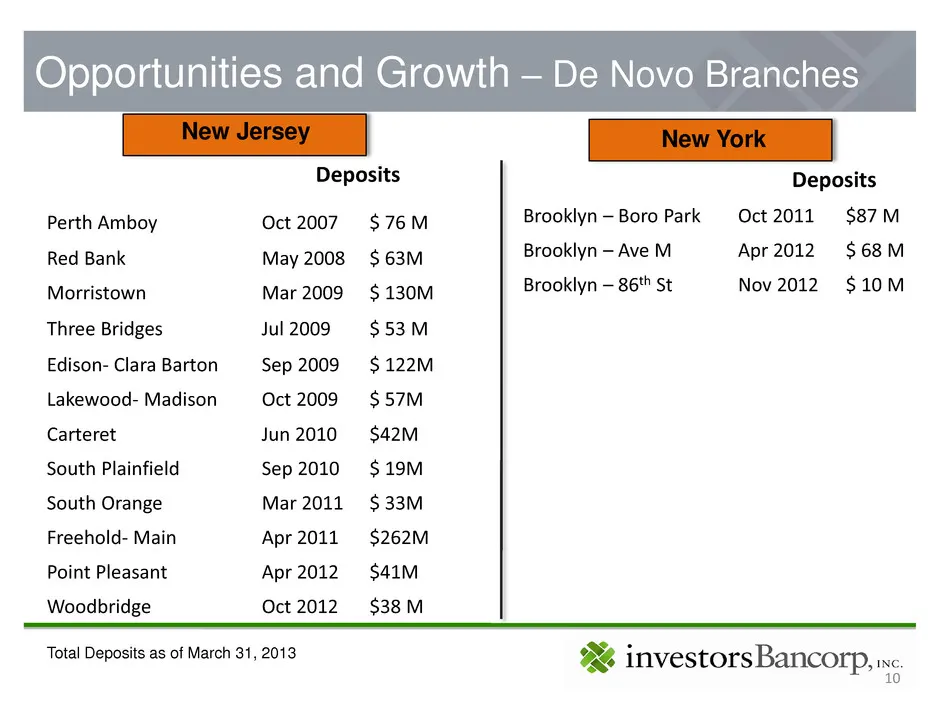
Opportunities and Growth — De Novo Branches Perth Amboy Red Bank Morristown Three Bridges Edison- Clara Barton Lakewood- Madison Carteret South Plainfield South Orange Freehold- Main Point Pleasant Woodbridge Deposits Oct 2007 $76M May 2008 $63M Mar 2009 $ 130M Jul2009 $53M Sep 2009 $122M Oct 2009 $
Slide 11: Branch network map
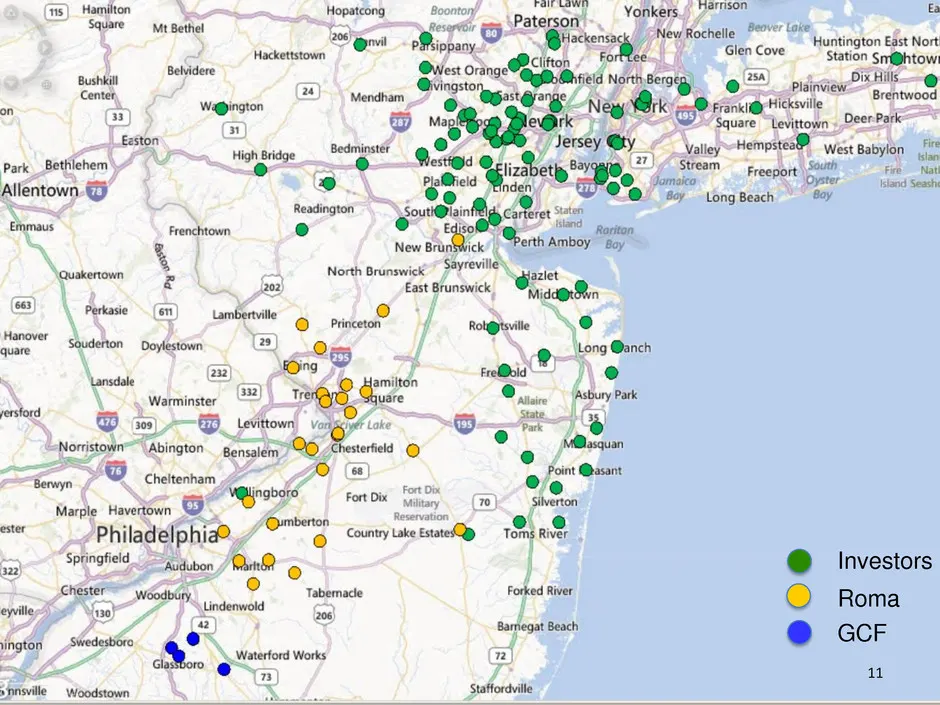
i Beover take Huntington East Nort 3 ake S, ge ee a joa New North Brunswick’ East pareay Levittown, geo Ty > is °e @ Investors © Roma @ ccr ai
Slide 12: Investors Financial Group
& investorsBancorp, we. Investors Financial Group % “Investment Program of the Year” by our Clearing Broker % “One of the top 20 programs” by Bank Investment Consultant Magazine Investors Bancorp, Inc. May 30, 2013
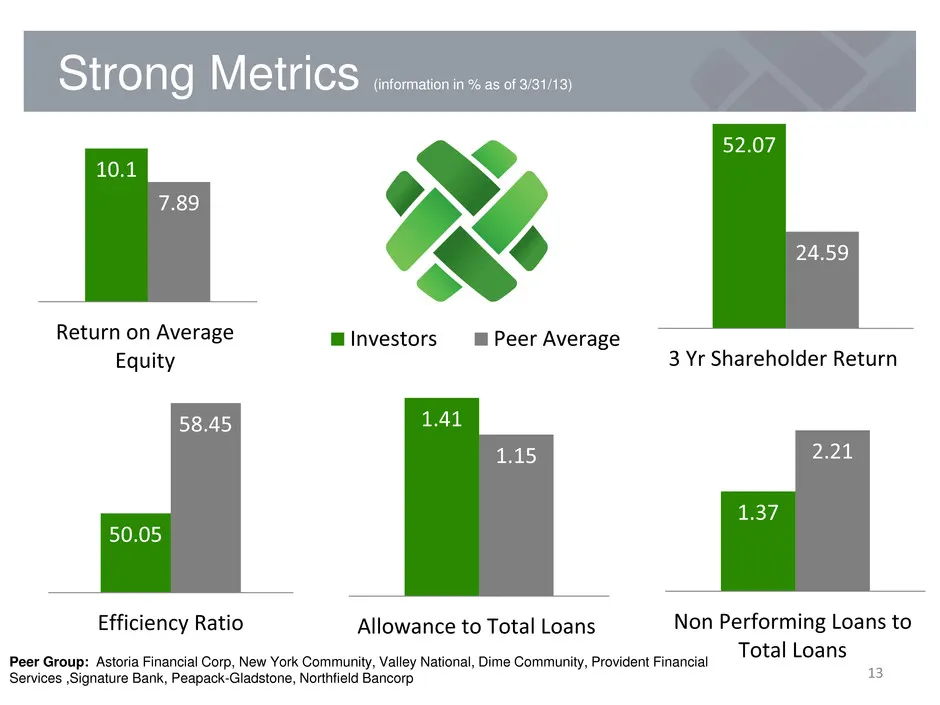
Slide 13: Strong Metrics
StrONG MeHriCS onsornseaseso0v9 ¢ Return on Average Mlnvestors im Peer Average Equity 3 Yr Shareholder Return 1.41 T15) Efficiency Ratio Allowance to Total Loans Non Performing Loans to eer Group: Astoria Financial Corp, Ne , Valley National, Dit ity, Provident Financial Total Loans Services Signatu
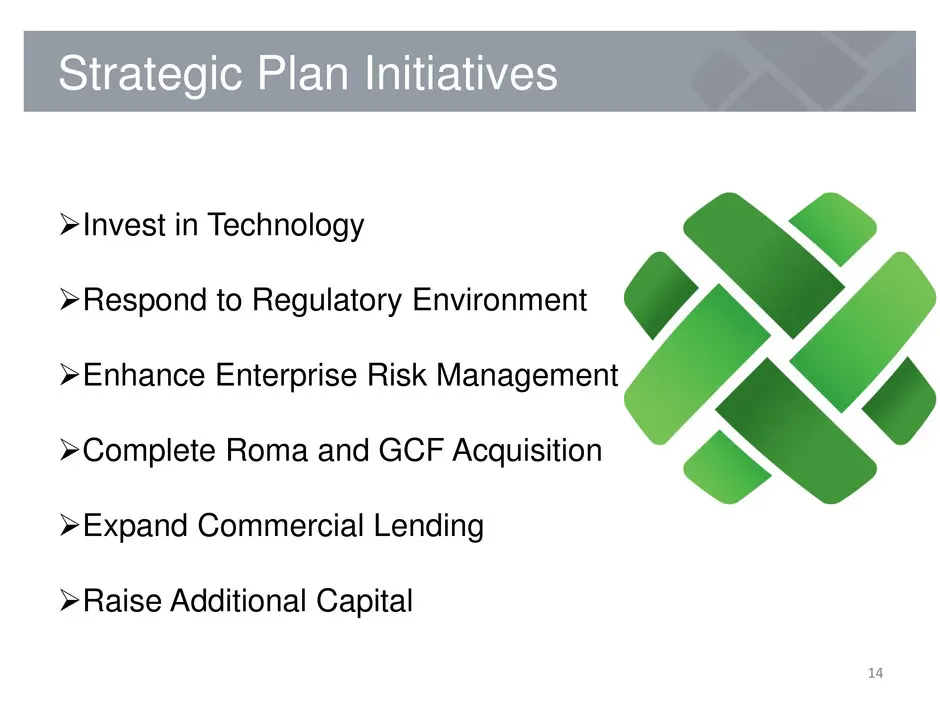
Slide 14: Strategic Plan Initiatives
Strategic Plan Initiatives >Invest in Technology >» Respond to Regulatory Environment >Enhance Enterprise Risk a / >Complete Roma and GCF Acquisition >Expand Commercial Lending >» Raise Additional Capital
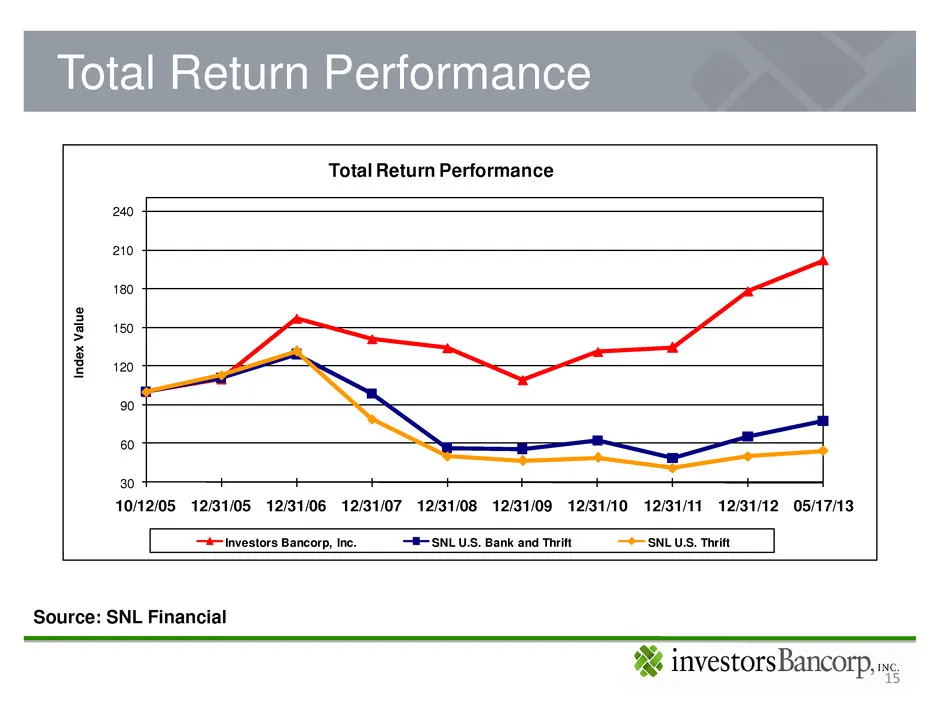
Slide 15: Total Return Performance
Total Return Performance Index Value 30 10/12/05 12/31/05 12/31/06 12/31/07 12/31/08 12/31/09 12/3110 12/31/11 12/31/12 05/17/13 [ he: —#—SNLUS. Bank and Thrift —SSNLUS. Thrift ] Source: SNL Financial %& investorsBancorp, Bho
Slide 16: Thank You
Thank You For More Information: + Log onto our web site: www.myinvestorsbank.com * Log onto our website above or www.sec.gov to obtain free copies of documents filed by Investors with the SEC % investorsBancorp, nc.
Source: SEC EDGAR · 8-K filed May 31, 2013
More decks from Investors Bancorp Inc
 Q4 2021 Earnings Presentation4 slides · Jan 26, 2022
 Q3 2021 Earnings Presentation4 slides · Oct 27, 2021
 Q2 2021 Earnings Presentation4 slides · Jul 28, 2021
 Merger or Acquisition (July 2021)17 slides · Jul 28, 2021
 Q1 2021 Earnings Presentation4 slides · Apr 28, 2021
 Q4 2020 Earnings Presentation4 slides · Jan 28, 2021