STORE Capital — Investor Presentation (April 2015)
21 slides from STORE Capital's investor presentation, Apr 1, 2015
Slide 1: The Leader in Middle Market Real Estate Capital Solutions
The LEADER in Middle Market Real Estate Capital Solutions S│T│O│R│E CAPITAL April 2015
Slide 2: STORE Overview
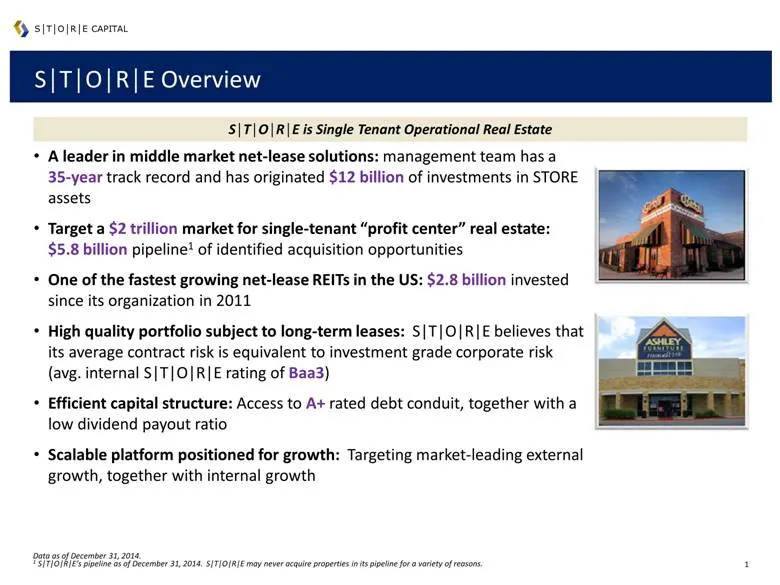
S│T│O│R│E Overview A leader in middle market net-lease solutions: management team has a 35-year track record and has originated $12 billion of investments in STORE assets Target a $2 trillion market for single-tenant “profit center” real estate: $5.8 billion pipeline1 of identified acquisition oppor
Slide 3: Experienced Leadership Team with a Proven Track Record
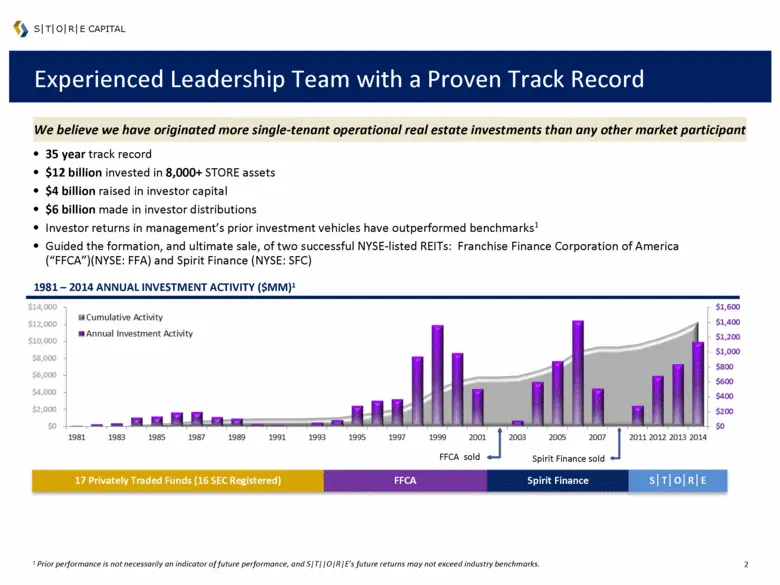
Experienced Leadership Team with a Proven Track Record 35 year track record $12 billion invested in 8,000+ STORE assets $4 billion raised in investor capital $6 billion made in investor distributions Investor returns in management’s prior investment vehicles have outperformed benchmarks1 Guided the
Slide 4: Experienced Leadership Team with a Proven Track Record: Annualized Total Returns
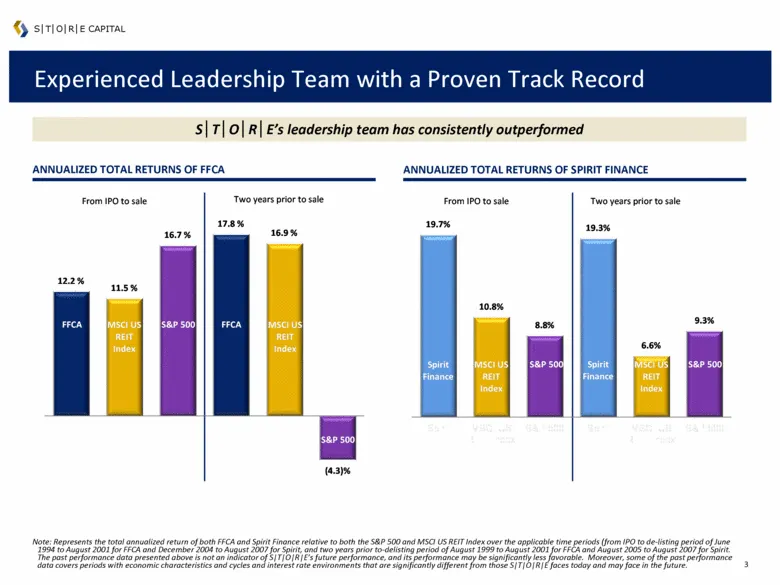
Experienced Leadership Team with a Proven Track Record ANNUALIZED TOTAL RETURNS OF SPIRIT FINANCE S│T│O│R│E’s leadership team has consistently outperformed ANNUALIZED TOTAL RETURNS OF FFCA S│T│O│R│E CAPITAL Note: Represents the total annualized return of both FFCA and Spirit Finance relative to both
Slide 5: Target Market Exceeding $2 Trillion in Size
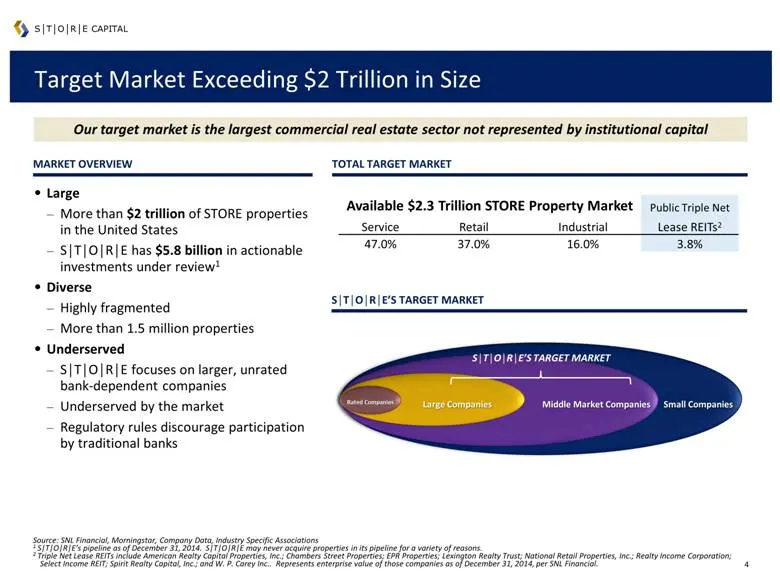
Target Market Exceeding $2 Trillion in Size Large More than $2 trillion of STORE properties in the United States S│T│O│R│E has $5.8 billion in actionable investments under review1 Diverse Highly fragmented More than 1.5 million properties Underserved S│T│O│R│E focuses on larger, unrated bank-depende
Slide 6: Superior Direct Origination Platform
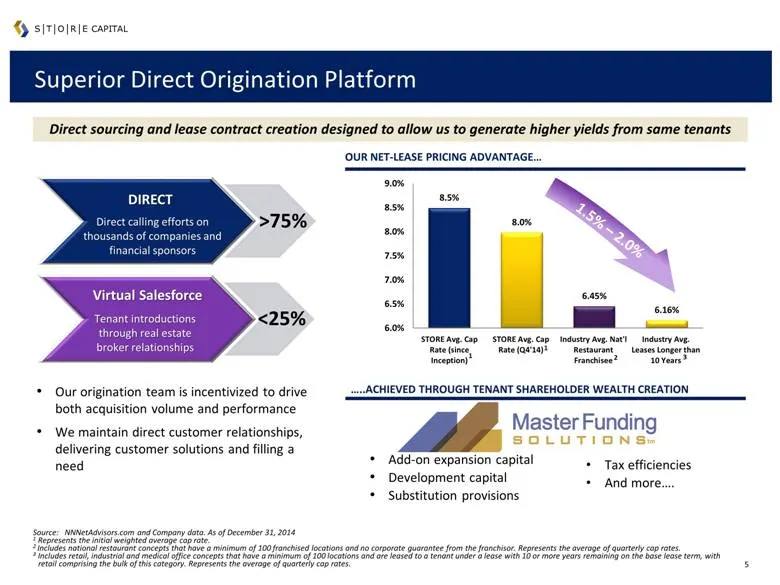
tm Superior Direct Origination Platform Our origination team is incentivized to drive both acquisition volume and performance We maintain direct customer relationships, delivering customer solutions and filling a need Direct sourcing and lease contract creation designed to allow us to generate highe
Slide 7: STORE Contracts vs. Investment Grade Tenant Leases
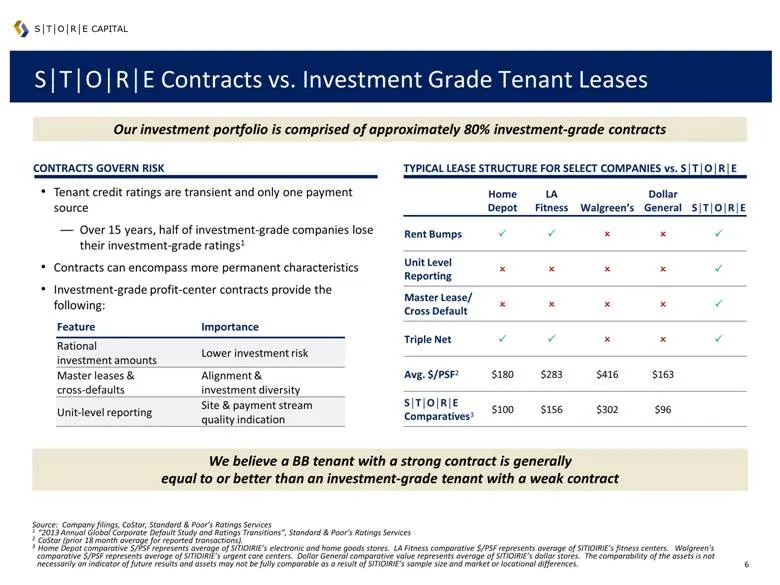
S│T│O│R│E Contracts vs. Investment Grade Tenant Leases S│T│O│R│E CAPITAL TYPICAL LEASE STRUCTURE FOR SELECT COMPANIES vs. S│T│O│R│E Tenant credit ratings are transient and only one payment source Over 15 years, half of investment-grade companies lose their investment-grade ratings1 Contracts can enc
Slide 8: Stable and Attractive Lease Rates
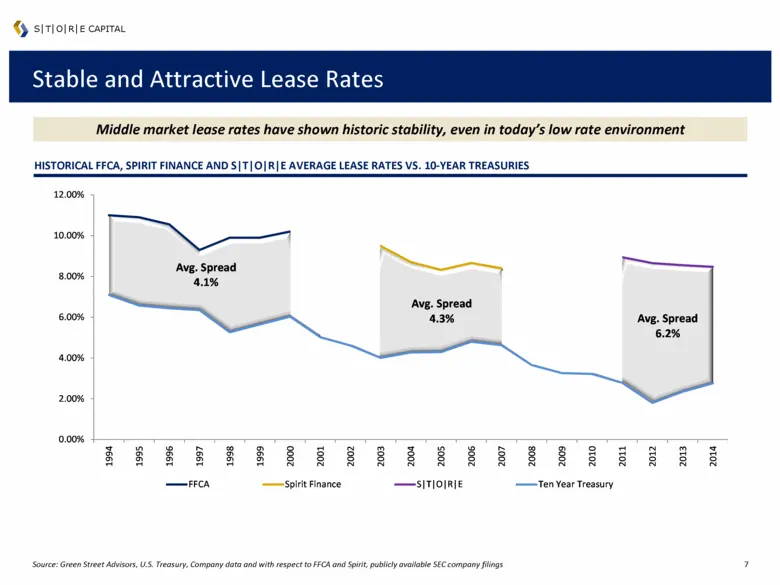
Stable and Attractive Lease Rates Middle market lease rates have shown historic stability, even in today’s low rate environment HISTORICAL FFCA, SPIRIT FINANCE AND S|T|O|R|E AVERAGE LEASE RATES VS. 10-YEAR TREASURIES Source: Green Street Advisors, U.S. Treasury, Company data and with respect to FFCA
Slide 9: We have a $5.8 billion Pipeline of Potential Investments
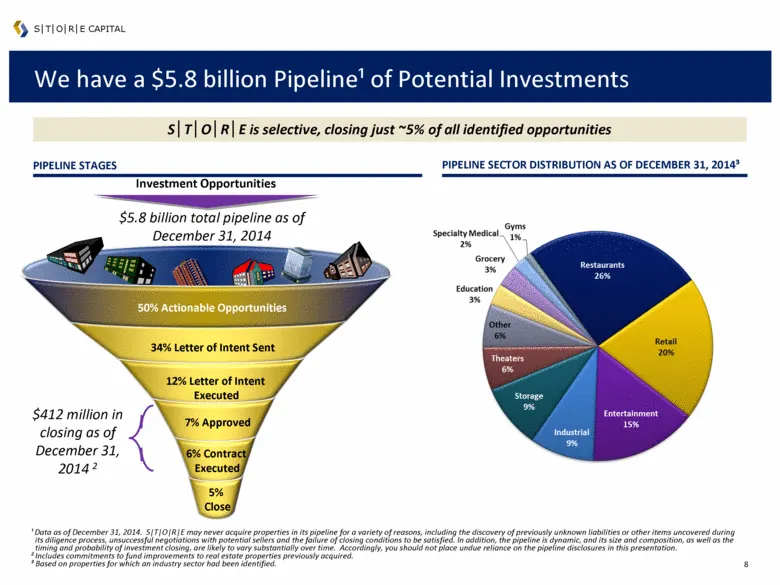
We have a $5.8 billion Pipeline¹ of Potential Investments ¹ Data as of December 31, 2014. S|T|O|R|E may never acquire properties in its pipeline for a variety of reasons, including the discovery of previously unknown liabilities or other items uncovered during its diligence process, unsuccessful neg
Slide 10: Time-Tested Underwriting Approach
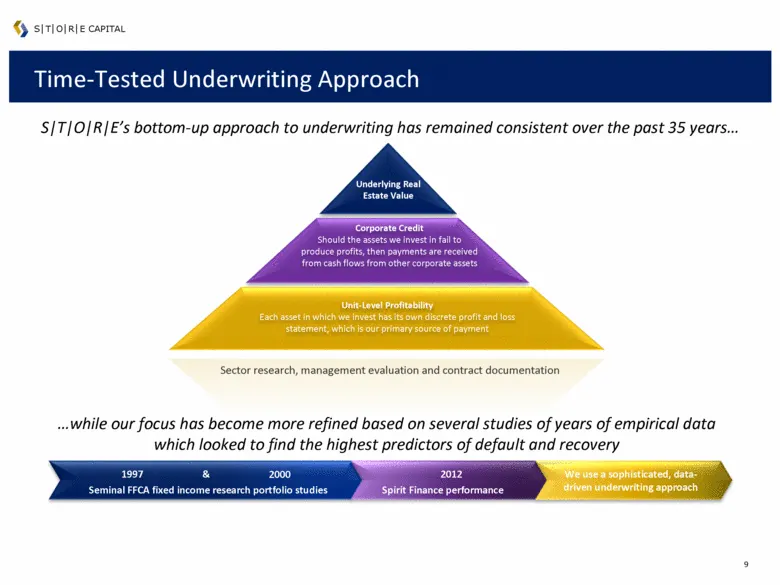
Time-Tested Underwriting Approach S|T|O|R|E’s bottom-up approach to underwriting has remained consistent over the past 35 years Unit-Level Profitability Each asset in which we invest has its own discrete profit and loss statement, which is our primary source of payment Corporate Credit Should the as
Slide 11: FFCA 1997 and 2000 Default Studies
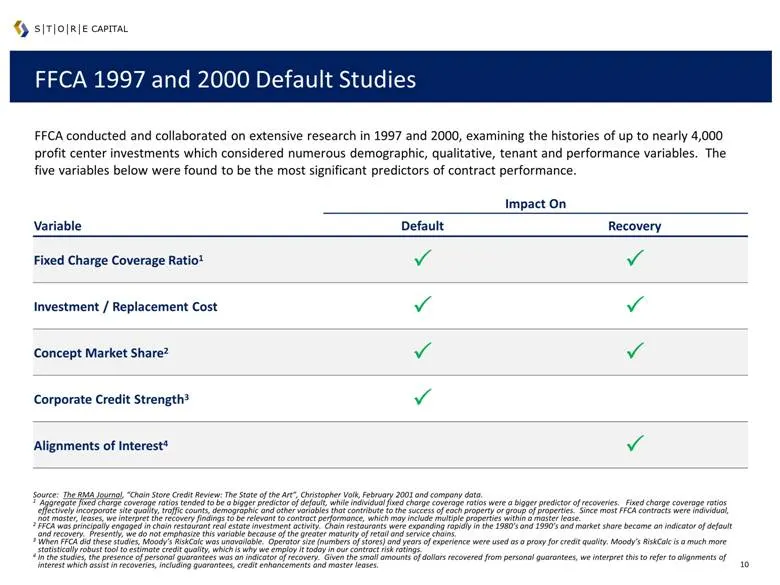
FFCA 1997 and 2000 Default Studies S│T│O│R│E CAPITAL FFCA conducted and collaborated on extensive research in 1997 and 2000, examining the histories of up to nearly 4,000 profit center investments which considered numerous demographic, qualitative, tenant and performance variables. The five variable
Slide 12: Risk Management – The STORE Score
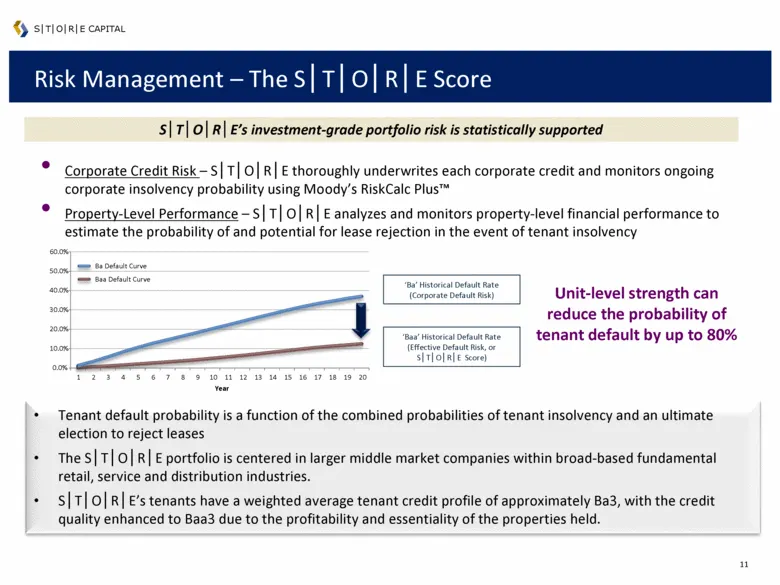
Risk Management – The S│T│O│R│E Score S│T│O│R│E CAPITAL Corporate Credit Risk – S│T│O│R│E thoroughly underwrites each corporate credit and monitors ongoing corporate insolvency probability using Moody’s RiskCalc Plus™ Property-Level Performance – S│T│O│R│E analyzes and monitors property-level financ
Slide 13: State-of-the-Art Servicing Organization
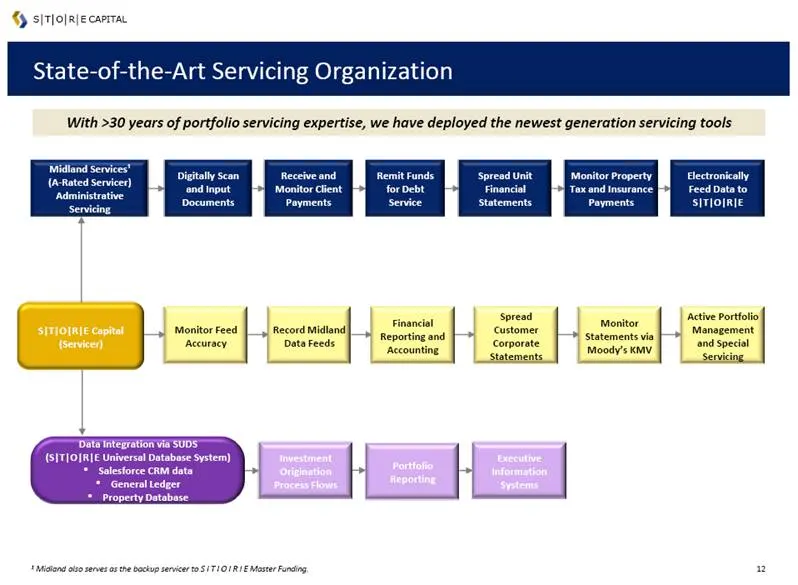
State-of-the-Art Servicing Organization With >30 years of portfolio servicing expertise, we have deployed the newest generation servicing tools S│T│O│R│E CAPITAL 1 Midland also serves as the backup servicer to S l T l O l R l E Master Funding. Midland Services¹ (A-Rated Servicer) Administrative Serv
Slide 14: Cutting-Edge Servicing Platform
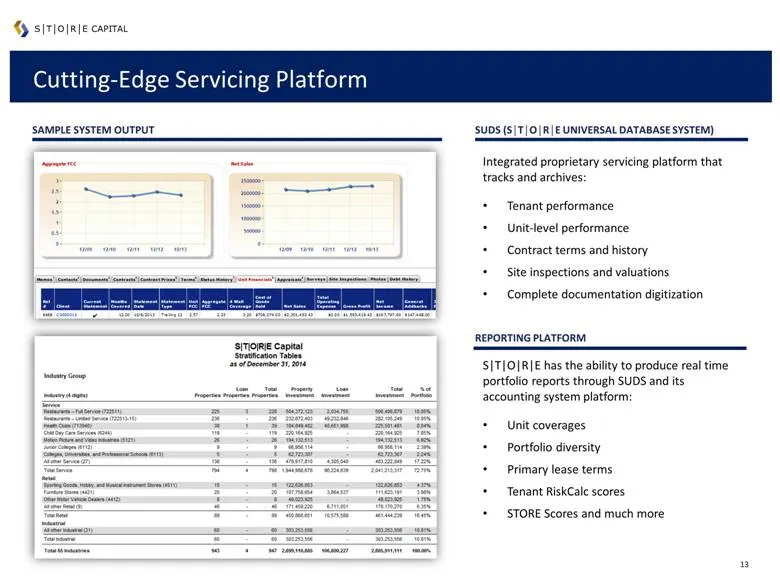
Cutting-Edge Servicing Platform SUDS (S│T│O│R│E UNIVERSAL DATABASE SYSTEM) Integrated proprietary servicing platform that tracks and archives: Tenant performance Unit-level performance Contract terms and history Site inspections and valuations Complete documentation digitization REPORTING PLATFORM S
Slide 15: Portfolio – At a Glance
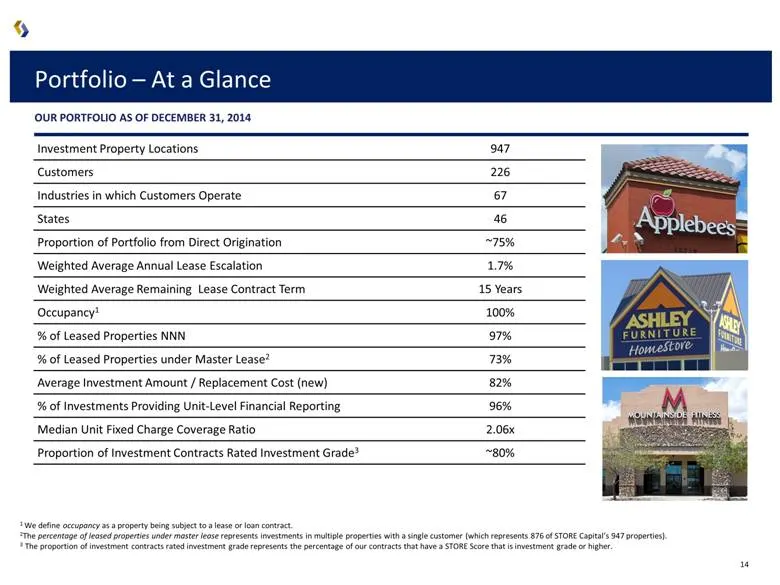
Portfolio – At a Glance OUR PORTFOLIO AS OF DECEMBER 31, 2014 Investment Property Locations 947 Customers 226 Industries in which Customers Operate 67 States 46 Proportion of Portfolio from Direct Origination ~75% Weighted Average Annual Lease Escalation 1.7% Weighted Average Remaining Lease Contrac
Slide 16: Diversified Across Geographies
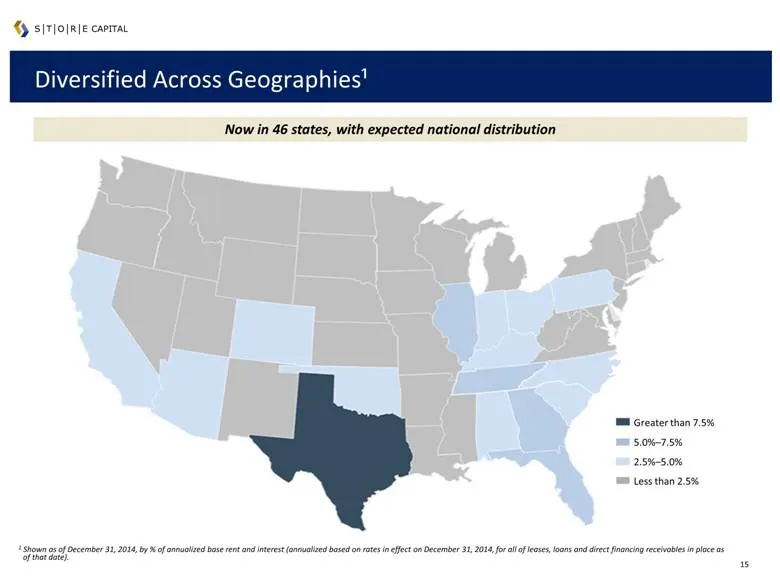
Diversified Across Geographies¹ Now in 46 states, with expected national distribution S│T│O│R│E CAPITAL 1 Shown as of December 31, 2014, by % of annualized base rent and interest (annualized based on rates in effect on December 31, 2014, for all of leases, loans and direct financing receivables in p
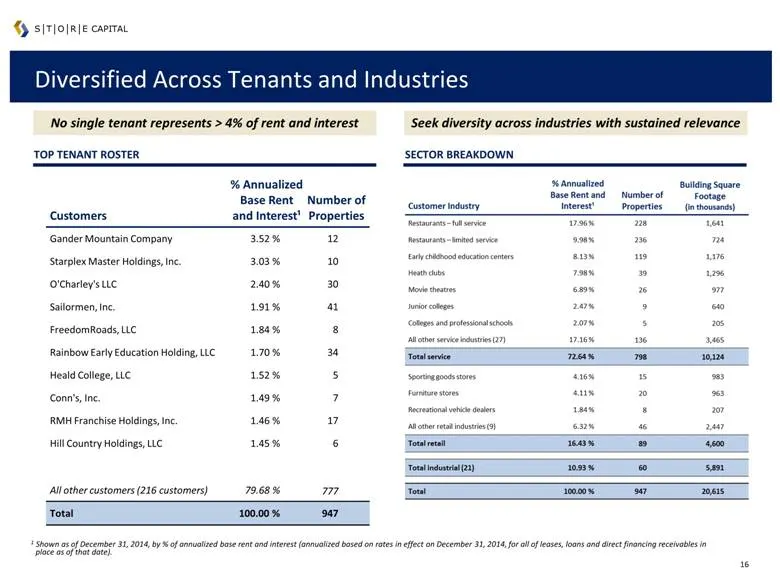
Slide 17: Diversified Across Tenants and Industries
Diversified Across Tenants and Industries No single tenant represents > 4% of rent and interest TOP TENANT ROSTER SECTOR BREAKDOWN Seek diversity across industries with sustained relevance S│T│O│R│E CAPITAL Customers % Annualized Base Rent and Interest¹ Number of Properties Gander Mountain Company 3
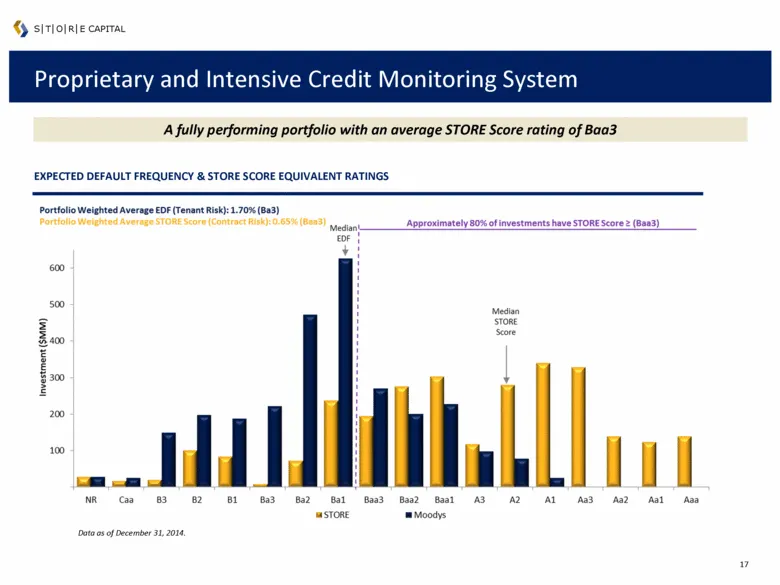
Slide 18: Proprietary and Intensive Credit Monitoring System
Proprietary and Intensive Credit Monitoring System A fully performing portfolio with an average STORE Score rating of Baa3 S│T│O│R│E CAPITAL Data as of December 31, 2014. EXPECTED DEFAULT FREQUENCY & STORE SCORE EQUIVALENT RATINGS
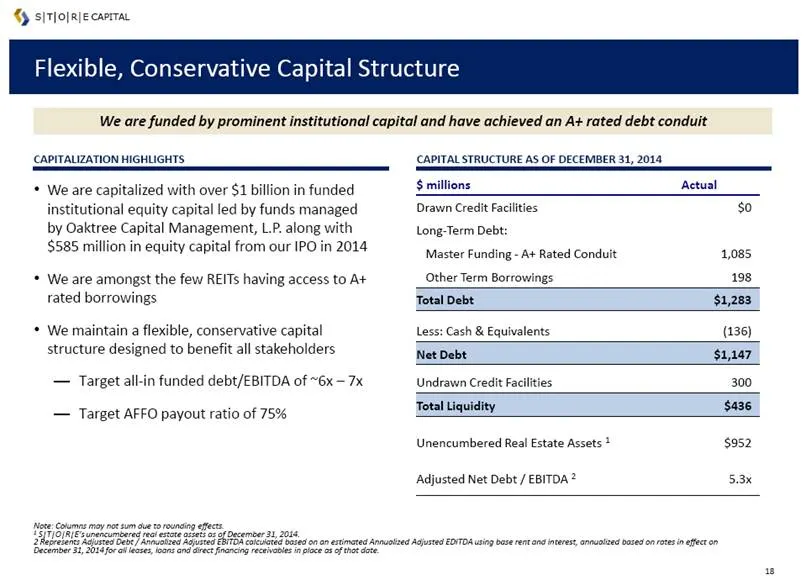
Slide 19: Flexible, Conservative Capital Structure
Flexible, Conservative Capital Structure CAPITALIZATION HIGHLIGHTS CAPITAL STRUCTURE AS OF DECEMBER 31, 2014 We are capitalized with over $1 billion in funded institutional equity capital led by funds managed by Oaktree Capital Management, L.P. along with $585 million in equity capital from our IPO
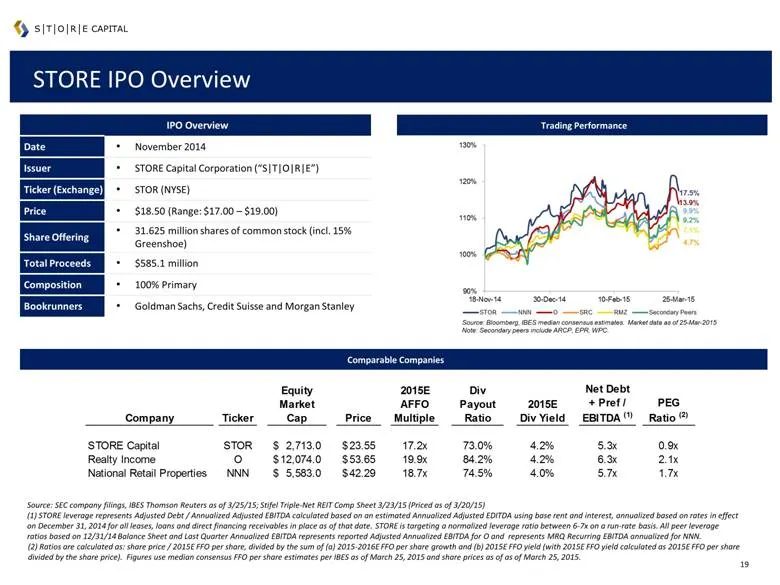
Slide 20: IPO Overview
IPO Overview Date November 2014 Issuer STORE Capital Corporation (“S|T|O|R|E”) Ticker (Exchange) STOR (NYSE) Price $18.50 (Range: $17.00 – $19.00) Share Offering 31.625 million shares of common stock (incl. 15% Greenshoe) Total Proceeds $585.1 million Composition 100% Primary Bookrunners Goldman Sac
Slide 21: Forward-Looking Statements
Forward-Looking Statements Forward-Looking Statements Certain statements contained in this document that are not historical facts may contain forward-looking statements. Forward-looking statements can be identified by the use of words such as "estimate," "anticipate," "expect," "believe," "intend,"
Source: SEC EDGAR · 8-K filed Apr 1, 2015
More decks from STORE Capital Corp
 Q2 2023 Earnings Presentation10 slides · Aug 4, 2023
 Q2 2022 Earnings Presentation26 slides · Aug 3, 2022
 Q2 2022 Earnings Presentation22 slides · Aug 3, 2022
 Q1 2022 Earnings Presentation26 slides · May 4, 2022
 Q1 2022 Earnings Presentation22 slides · May 4, 2022
 Q4 2021 Earnings Presentation33 slides · Feb 23, 2022