Condor Hospitality Trust — Investor Presentation (November 2017)
26 slides from Condor Hospitality Trust's investor presentation, Nov 7, 2017
Slide 1: Condor Hospitality Trust, Inc. Investor Presentation | November 2017
Condor Hospitality Trust, Inc. Investor Presentation | November 2017 NYSE AMERICAN: CDOR Exhibit 99.1

Slide 2: Safe Harbor Statement
Safe Harbor Statement All statements included in this presentation, other than statements of historical fact, are or may be deemed to be “forward-looking statements” within the meaning of the safe harbor provisions of the U.S. Private Securities Litigation Reform Act of 1995. Forward-looking stateme
Slide 3: November 2017 Update
>) ‘@ November 2017 Update
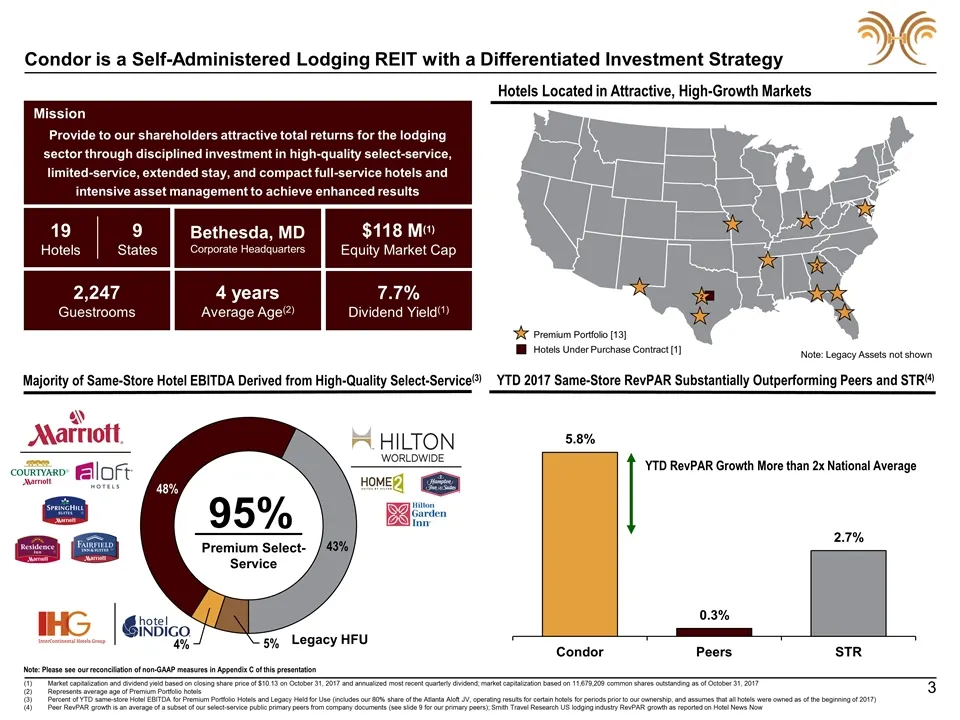
Slide 4: Condor is a Self-Administered Lodging REIT with a Differentiated Investment Strategy
Condor is a Self-Administered Lodging REIT with a Differentiated Investment Strategy 3 Mission Provide to our shareholders attractive total returns for the lodging sector through disciplined investment in high-quality select-service, limited-service, extended stay, and compact full-service hotels an
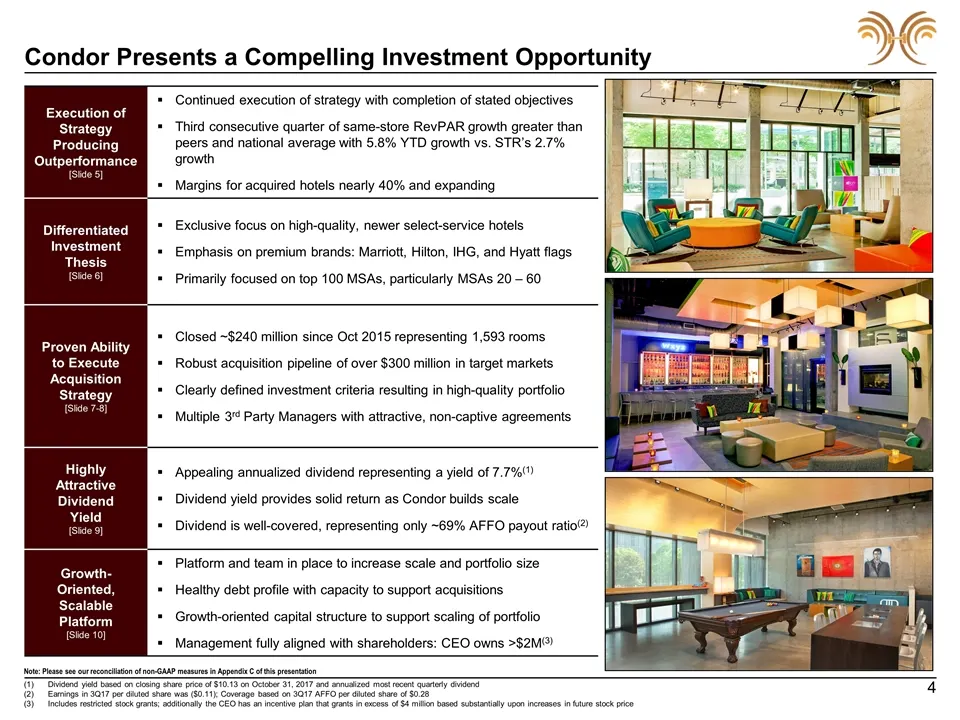
Slide 5: Condor Presents a Compelling Investment Opportunity
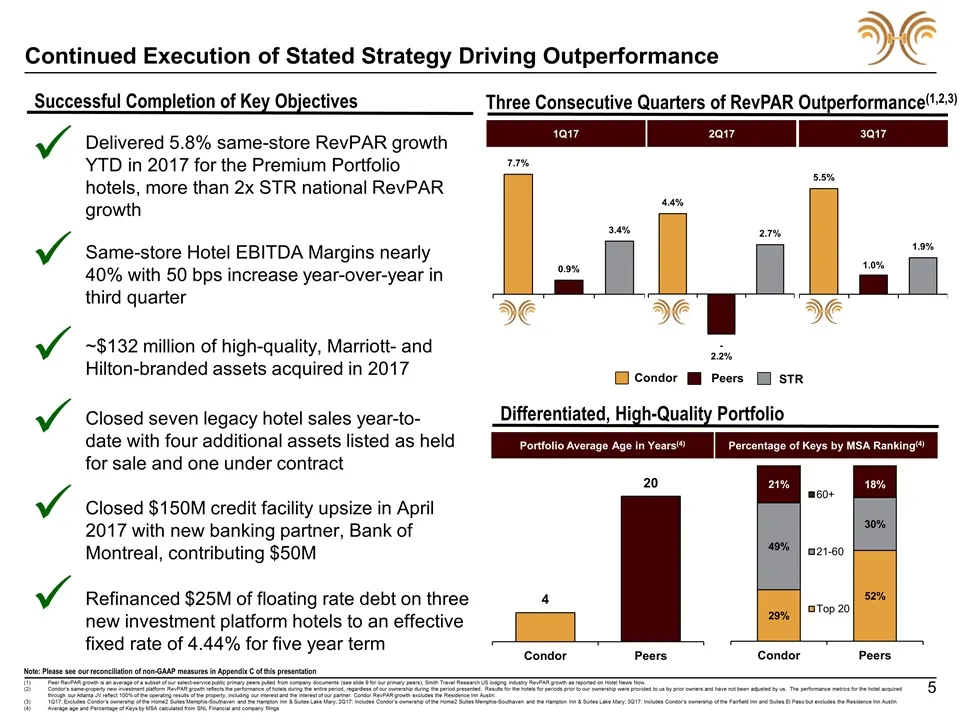
Condor Presents a Compelling Investment Opportunity Execution of Strategy Producing Outperformance [Slide 5] Continued execution of strategy with completion of stated objectives Third consecutive quarter of same-store RevPAR growth greater than peers and national average with 5.8% YTD growth vs. STR
Slide 6: Continued Execution of Stated Strategy Driving Outperformance
5 Continued Execution of Stated Strategy Driving Outperformance Successful Completion of Key Objectives Same-store Hotel EBITDA Margins nearly 40% with 50 bps increase year-over-year in third quarter Three Consecutive Quarters of RevPAR Outperformance(1,2,3) ~$132 million of high-quality, Marriott-
Slide 7: Slower Supply Growth in Targeted Secondary Markets
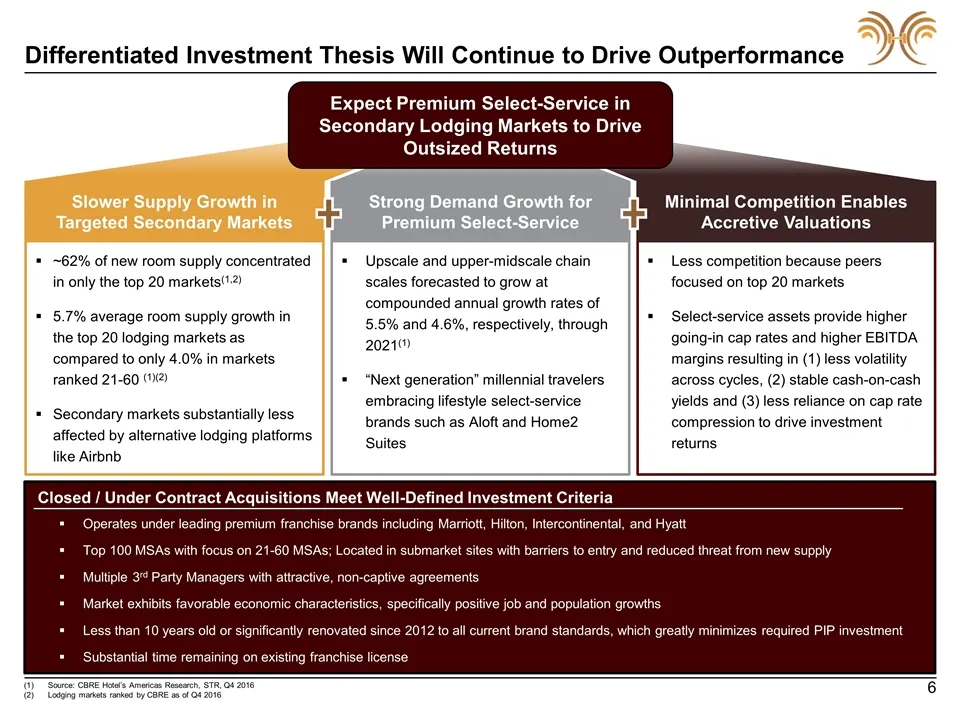
~62% of new room supply concentrated in only the top 20 markets(1,2) 5.7% average room supply growth in the top 20 lodging markets as compared to only 4.0% in markets ranked 21-60 (1)(2) Secondary markets substantially less affected by alternative lodging platforms like Airbnb Slower Supply Growth i

Slide 8: Proven Ability to Execute Acquisition Strategy with Robust Pipeline
Over $300 million of premium branded select-service assets under consideration that represent the top four hotel franchises with an average age of less than 10 years Acquired / Under Contract Pipeline Hotel Indigo Atlanta, GA Rooms: 142 Acquired: October 2015 SpringHill Suites San Antonio, TX Rooms:
Slide 9: Attractive Third Party Management Agreements
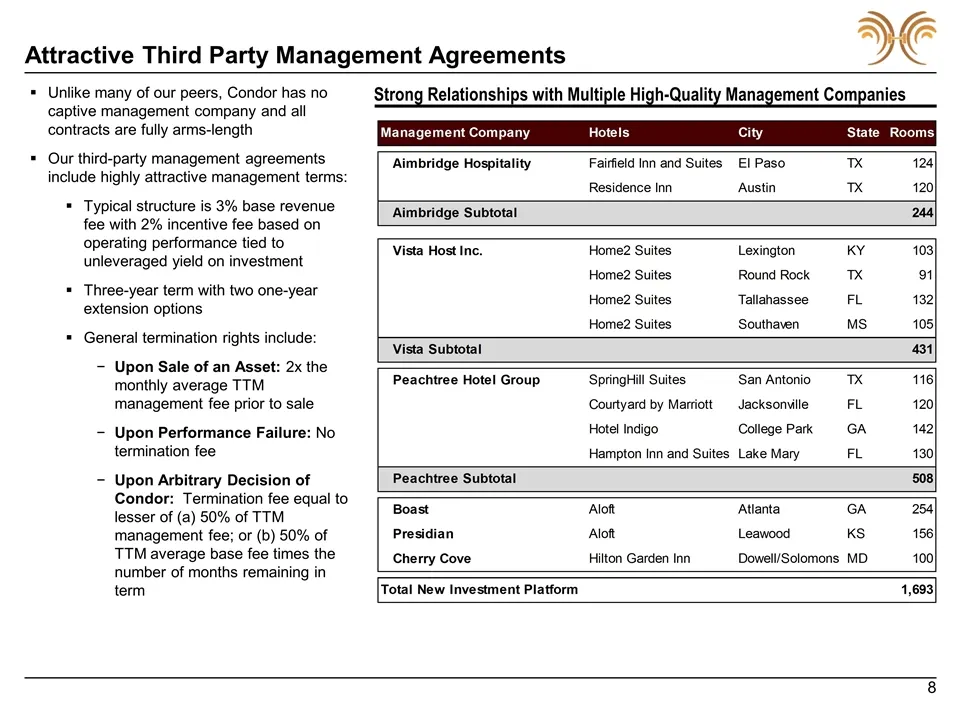
Attractive Third Party Management Agreements Closed / Under Contract Acquisitions Meet Well-Defined Investment Criteria Unlike many of our peers, Condor has no captive management company and all contracts are fully arms-length Our third-party management agreements include highly attractive managemen
Slide 10: Attractive Dividend Yield Highest in Public Company Lodging Industry
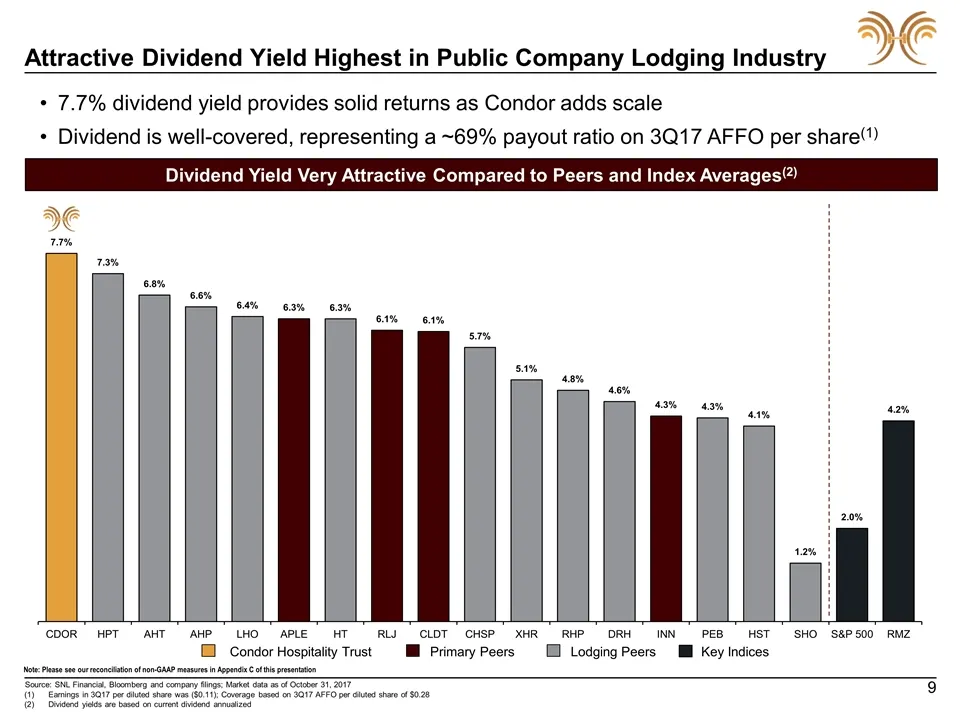
Attractive Dividend Yield Highest in Public Company Lodging Industry Dividend Yield Very Attractive Compared to Peers and Index Averages(2) Source: SNL Financial, Bloomberg and company filings; Market data as of October 31, 2017 7.7% dividend yield provides solid returns as Condor adds scale Dividen
Slide 11: Growth-Oriented, Scalable Platform Poised to Create Shareholder Value
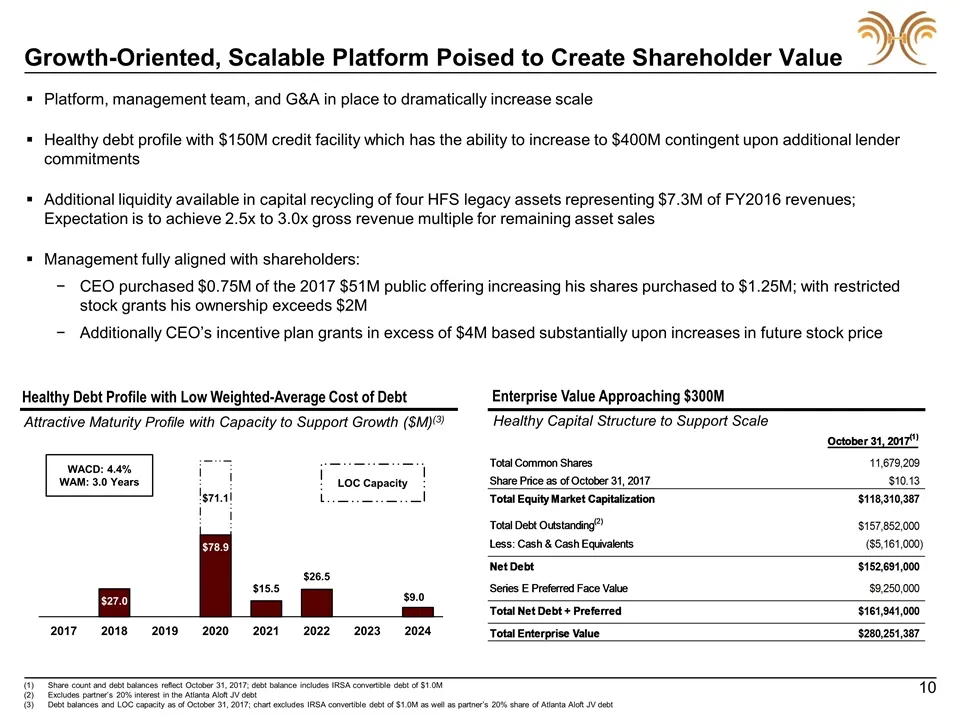
Growth-Oriented, Scalable Platform Poised to Create Shareholder Value Healthy Debt Profile with Low Weighted-Average Cost of Debt Share count and debt balances reflect October 31, 2017; debt balance includes IRSA convertible debt of $1.0M Excludes partner’s 20% interest in the Atlanta Aloft JV debt
Slide 12: Appendix A | Case Studies
>) ‘@ Appendix A | Case Studies
Slide 13: Case Study | Peachtree Portfolio Acquisition
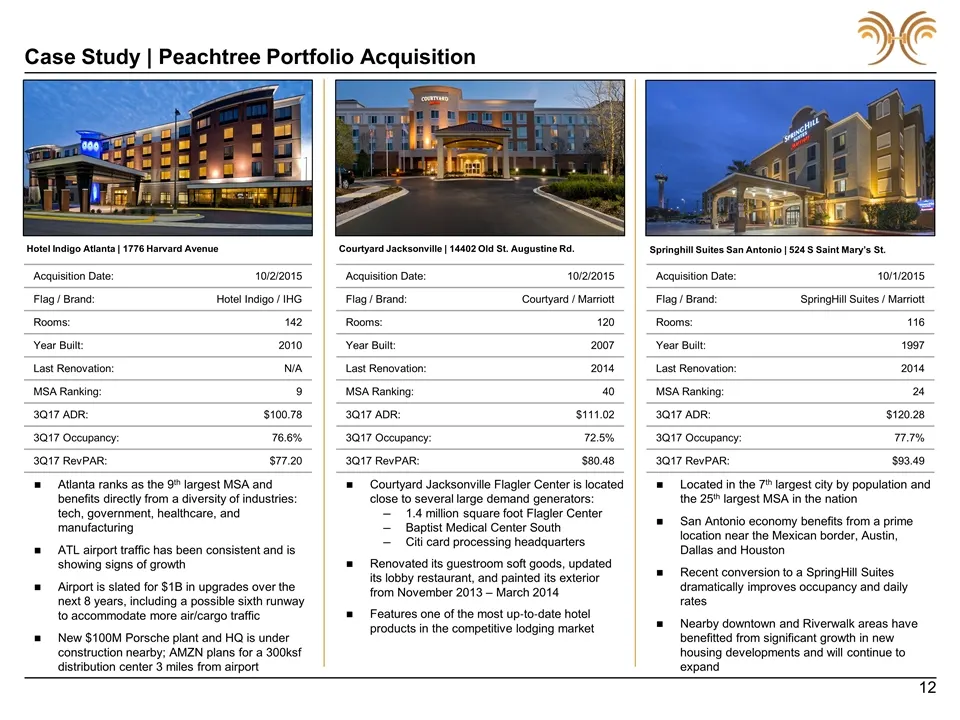
Case Study | Peachtree Portfolio Acquisition Atlanta ranks as the 9th largest MSA and benefits directly from a diversity of industries: tech, government, healthcare, and manufacturing ATL airport traffic has been consistent and is showing signs of growth Airport is slated for $1B in upgrades over th
Slide 14: Case Study | Individual Hotel Acquisitions
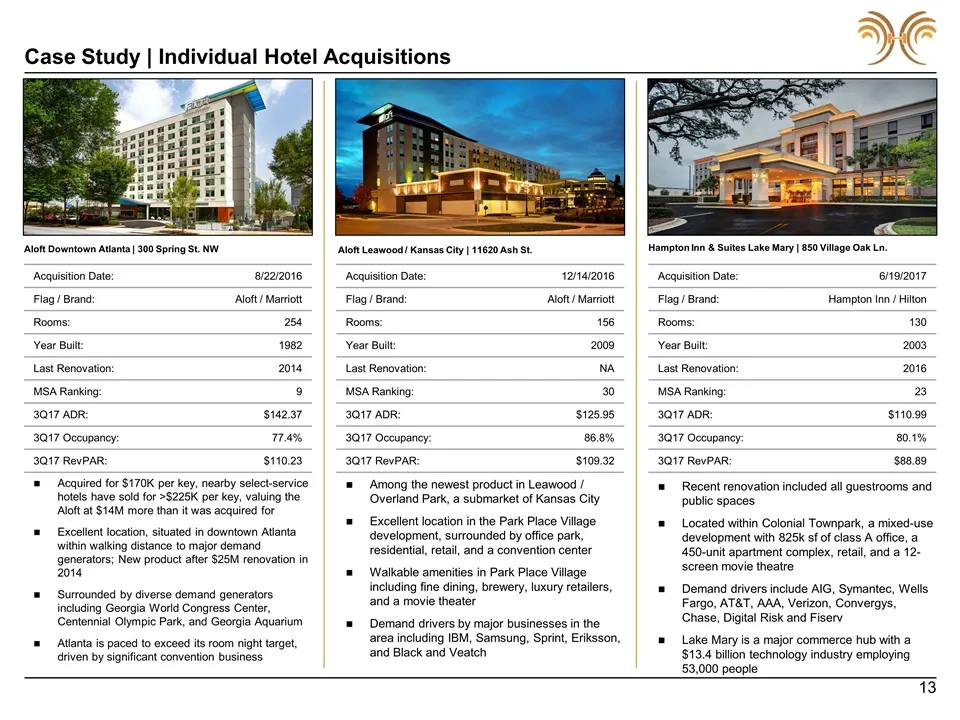
Case Study | Individual Hotel Acquisitions Acquired for $170K per key, nearby select-service hotels have sold for >$225K per key, valuing the Aloft at $14M more than it was acquired for Excellent location, situated in downtown Atlanta within walking distance to major demand generators; New product a
Slide 15: Case Study | Vista Portfolio Acquisition
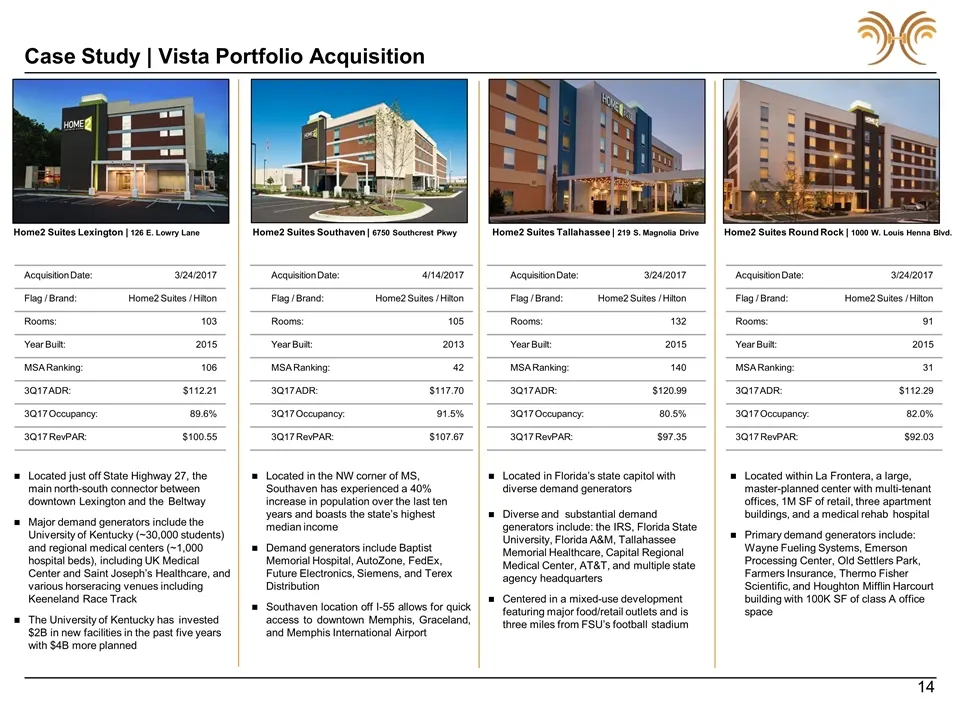
Case Study | Vista Portfolio Acquisition Located in Florida’s state capitol with diverse demand generators Diverse and substantial demand generators include: the IRS, Florida State University, Florida A&M, Tallahassee Memorial Healthcare, Capital Regional Medical Center, AT&T, and multiple state age
Slide 16: Case Study | Bedford Portfolio Acquisition
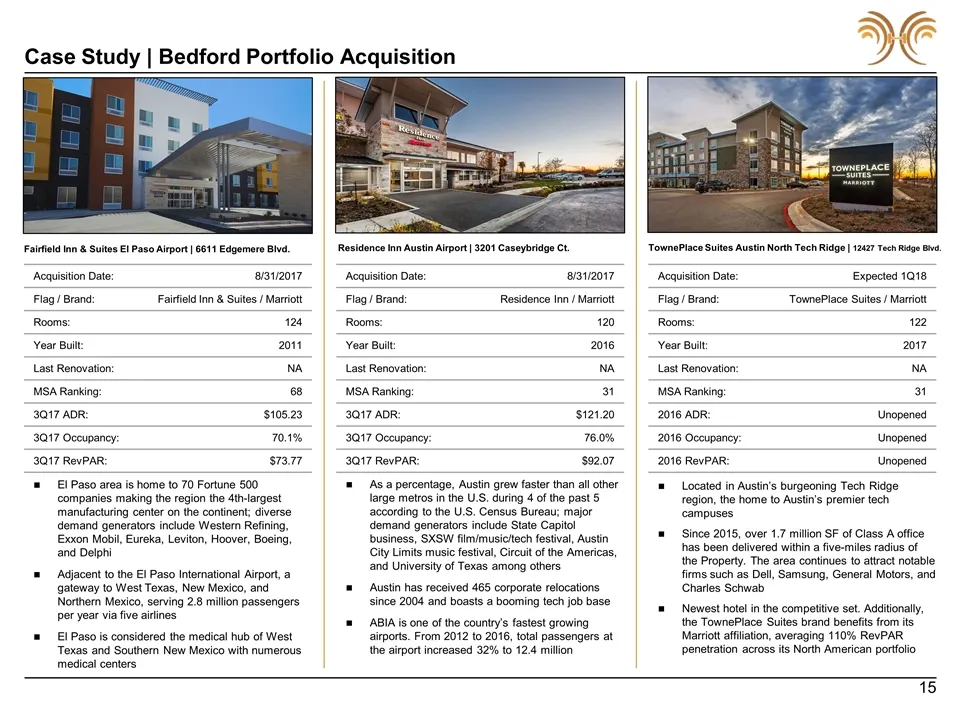
Case Study | Bedford Portfolio Acquisition El Paso area is home to 70 Fortune 500 companies making the region the 4th-largest manufacturing center on the continent; diverse demand generators include Western Refining, Exxon Mobil, Eureka, Leviton, Hoover, Boeing, and Delphi Adjacent to the El Paso In
Slide 17: Appendix B | Asset List
>) ‘@ Appendix B | Asset List
Slide 18: Condor Portfolio
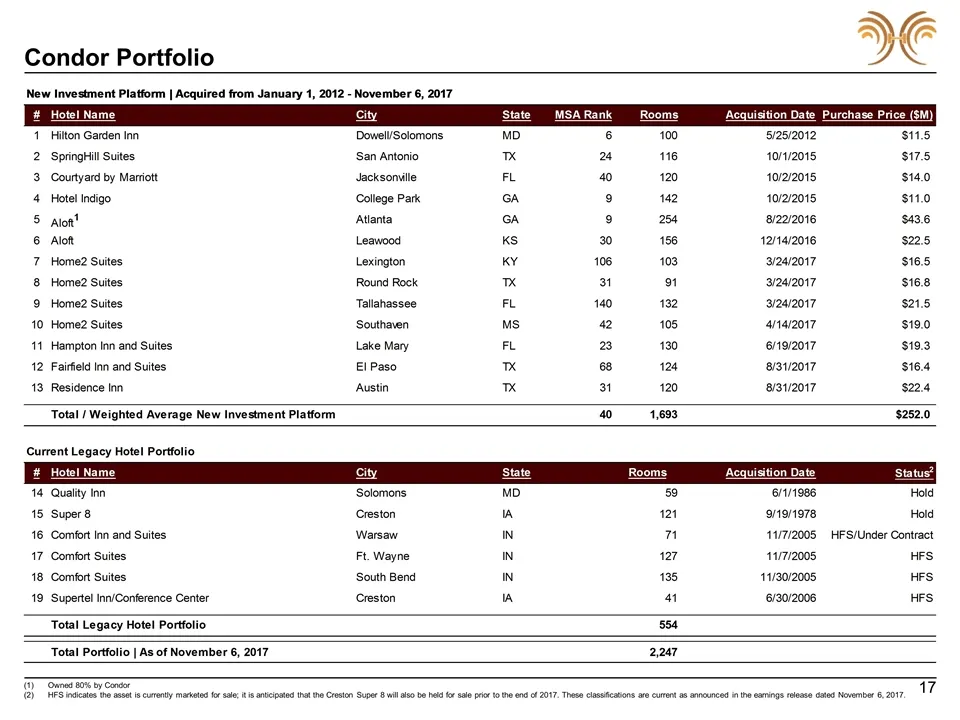
Condor Portfolio Owned 80% by Condor HFS indicates the asset is currently marketed for sale; it is anticipated that the Creston Super 8 will also be held for sale prior to the end of 2017. These classifications are current as announced in the earnings release dated November 6, 2017.
Slide 19: Current Portfolio Distribution by Market and Flag
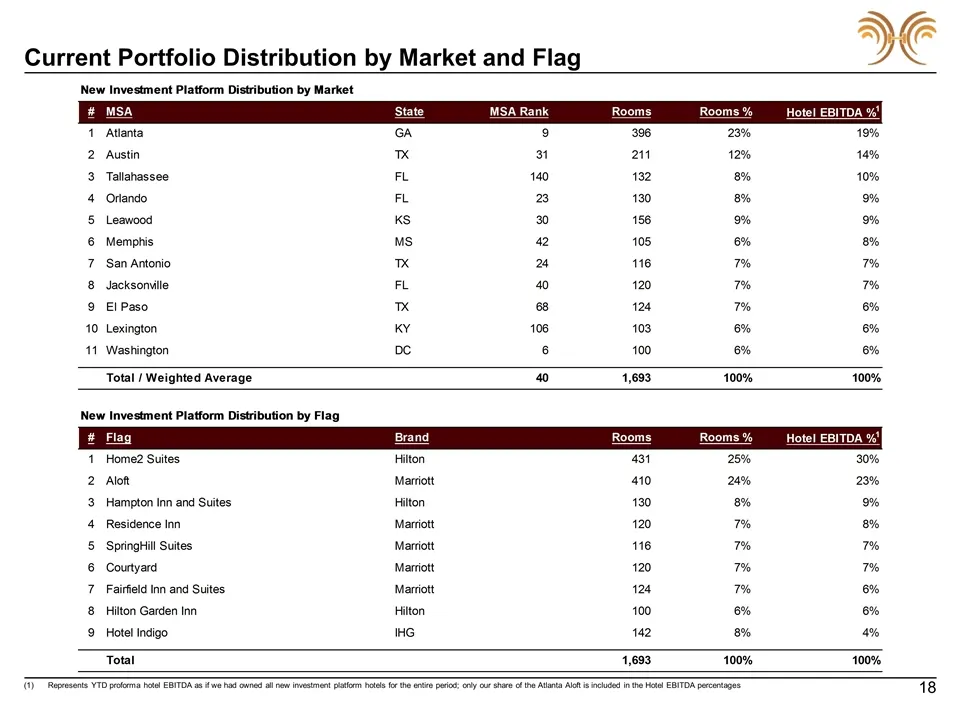
Current Portfolio Distribution by Market and Flag Represents YTD proforma hotel EBITDA as if we had owned all new investment platform hotels for the entire period; only our share of the Atlanta Aloft is included in the Hotel EBITDA percentages
Slide 20: Appendix C | Non-GAAP Reconciliation
Appendix C | Non-GAAP Reconciliation
Slide 21: Funds From Operations (FFO) and Adjusted Funds From Operations (AFFO)
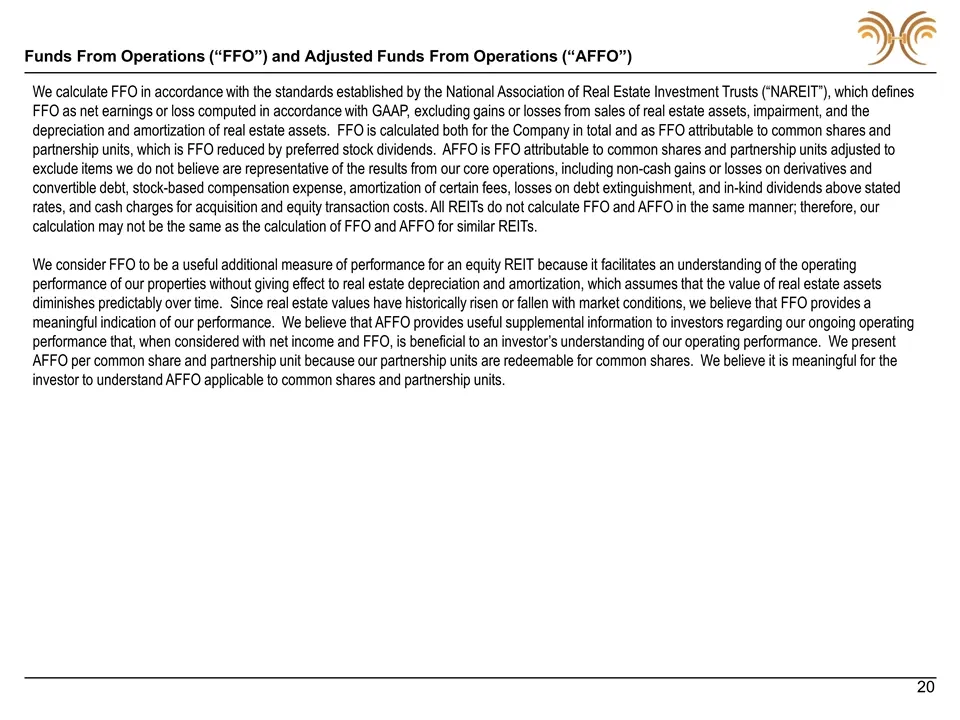
Funds From Operations (“FFO”) and Adjusted Funds From Operations (“AFFO”) We calculate FFO in accordance with the standards established by the National Association of Real Estate Investment Trusts (“NAREIT”), which defines FFO as net earnings or loss computed in accordance with GAAP, excluding gains
Slide 22: Non-GAAP Reconciliation: FFO and AFFO
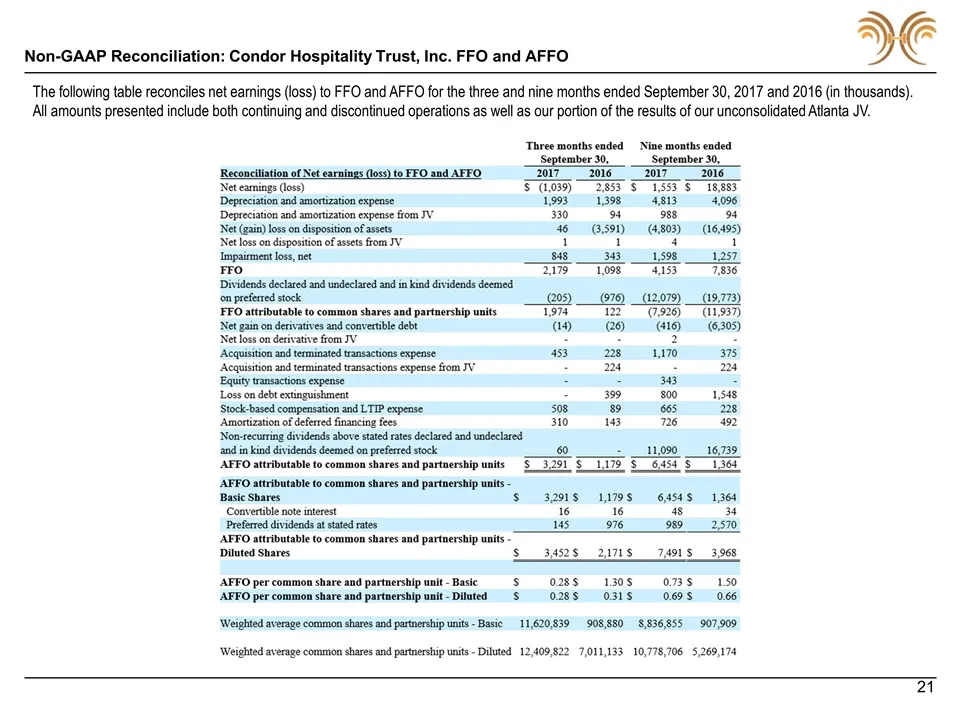
Non-GAAP Reconciliation: Condor Hospitality Trust, Inc. FFO and AFFO The following table reconciles net earnings (loss) to FFO and AFFO for the three and nine months ended September 30, 2017 and 2016 (in thousands). All amounts presented include both continuing and discontinued operations as well as
Slide 23: EBITDA, Adjusted EBITDA, and Hotel EBITDA
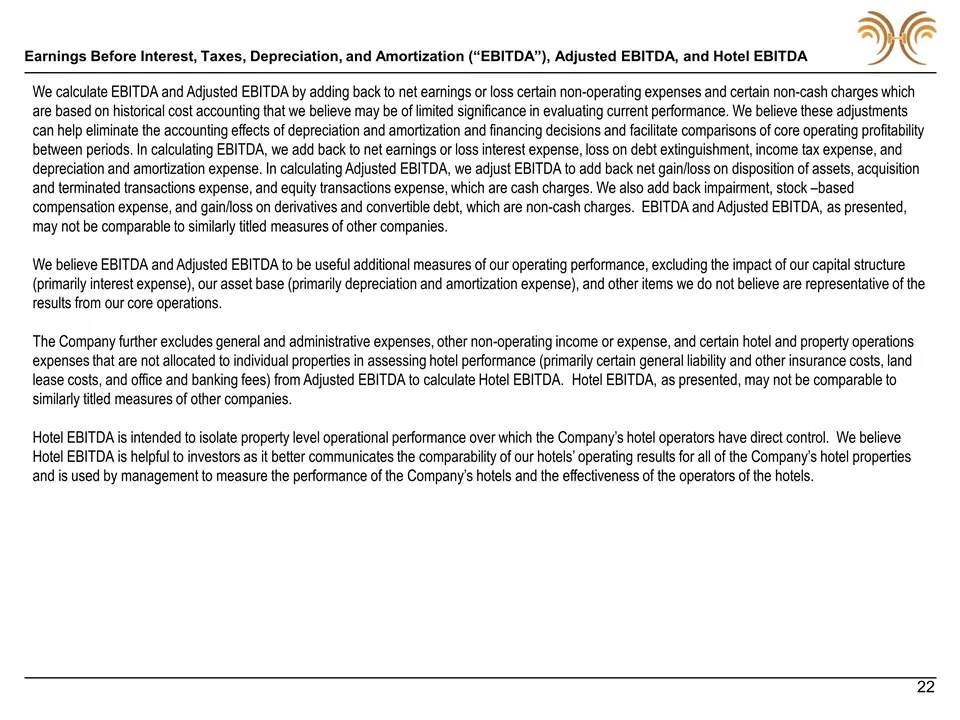
Earnings Before Interest, Taxes, Depreciation, and Amortization (“EBITDA”), Adjusted EBITDA, and Hotel EBITDA We calculate EBITDA and Adjusted EBITDA by adding back to net earnings or loss certain non-operating expenses and certain non-cash charges which are based on historical cost accounting that
Slide 24: Non-GAAP Reconciliation: EBITDA, Adjusted EBITDA, and Hotel EBITDA
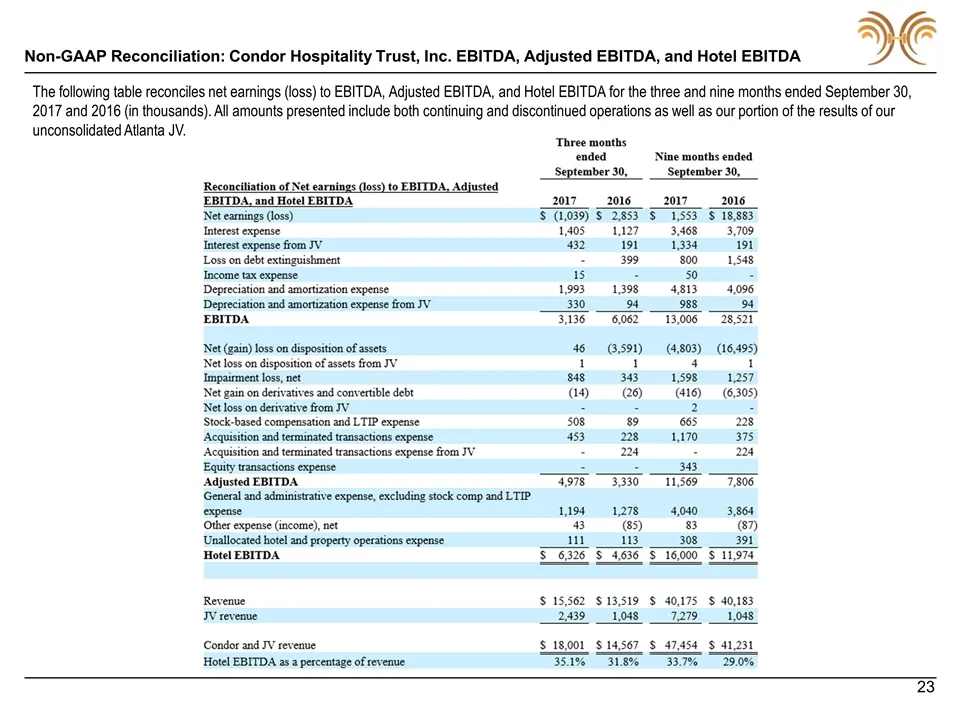
Non-GAAP Reconciliation: Condor Hospitality Trust, Inc. EBITDA, Adjusted EBITDA, and Hotel EBITDA The following table reconciles net earnings (loss) to EBITDA, Adjusted EBITDA, and Hotel EBITDA for the three and nine months ended September 30, 2017 and 2016 (in thousands). All amounts presented incl
Slide 25: Non-GAAP Reconciliation: Same-Store Hotel EBITDA by Property Type
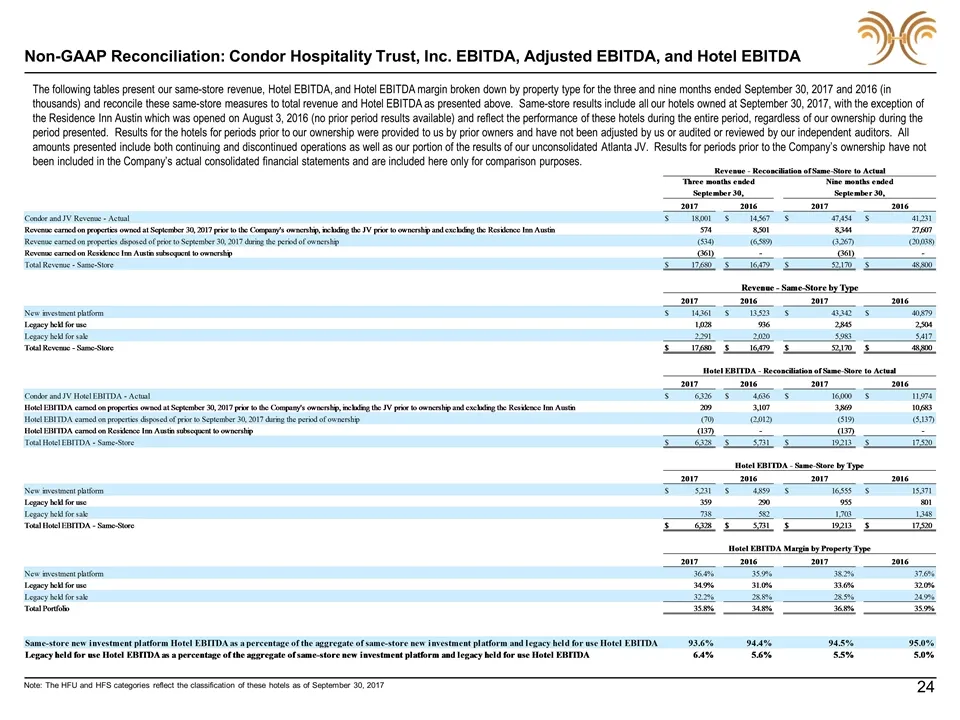
Non-GAAP Reconciliation: Condor Hospitality Trust, Inc. EBITDA, Adjusted EBITDA, and Hotel EBITDA The following tables present our same-store revenue, Hotel EBITDA, and Hotel EBITDA margin broken down by property type for the three and nine months ended September 30, 2017 and 2016 (in thousands) and
Slide 26: Operating Performance Metrics
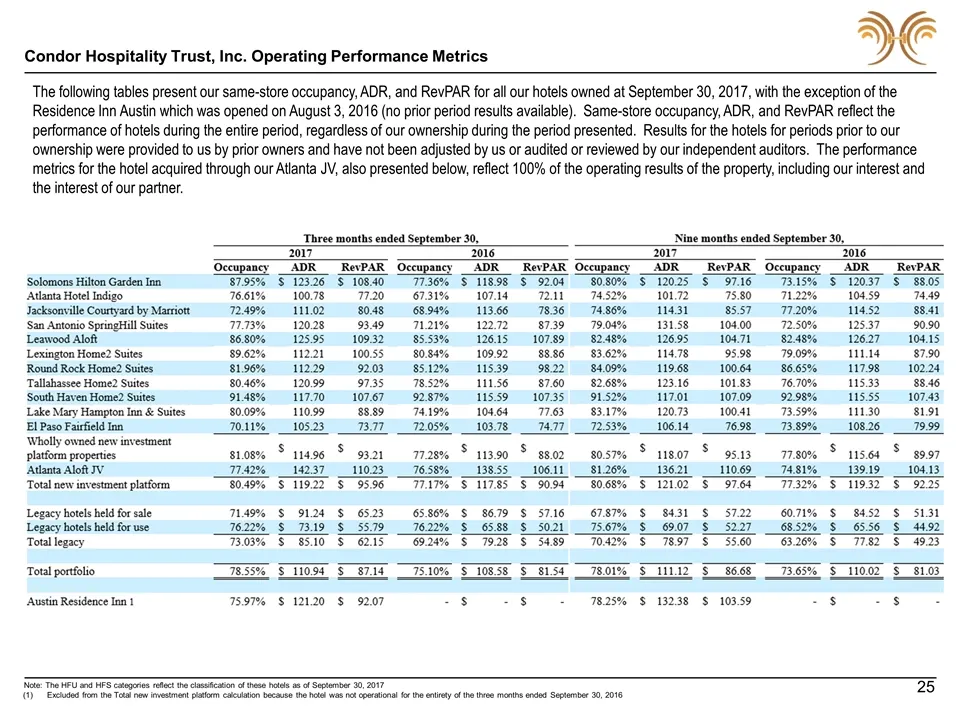
Condor Hospitality Trust, Inc. Operating Performance Metrics The following tables present our same-store occupancy, ADR, and RevPAR for all our hotels owned at September 30, 2017, with the exception of the Residence Inn Austin which was opened on August 3, 2016 (no prior period results available). S
Source: SEC EDGAR · 8-K filed Nov 7, 2017
More decks from Condor Hospitality Trust Inc
 Investor Presentation (November 2020)11 slides · Nov 19, 2020
 Corporate Update (October 2020)8 slides · Oct 27, 2020
 Investor Presentation (October 2020)13 slides · Oct 22, 2020
 Investor Presentation (May 2018)27 slides · May 11, 2018
 Investor Presentation (March 2018)27 slides · Mar 21, 2018
 Investor Presentation (September 2017)26 slides · Sep 12, 2017