Alpha Natural Resources — Foundation Coal Holdings — Howard Weil Annual Energy Conference 2007
27 slides from Alpha Natural Resources's conference presentation, Apr 4, 2007
Slide 1: Foundation Coal Holdings, Inc.
Fc [LISTED] NYSE FOUNDATION COAL HOLDINGS, INC.

Slide 2

Slide 3

Slide 4: Howard Weil Annual Energy Conference, New Orleans, April 4, 2007
Howard Weil 35 th Annual Energy Conference New Orleans, LA April 4, 2007 Exhibit 99.1

Slide 5: Forward-Looking Statements and Reconciliation of Non-GAAP Measures
FORWARD-LOOKING STATEMENTS AND RECONCILIATION OF NON-GAAP MEASURES Statements in this presentation which are not statements of historical fact are “forward-looking statements” within the “safe harbor” provision of the Private Securities Litigation Reform Act of 1995. These forward-looking statements

Slide 6: Why Invest in FCL?
WHY INVEST IN FCL? • Diversified producer with major presence in NAPP and PRB • Developing internal growth prospects and positioned to capitalize on external growth possibilities • Solid margins driven by low cost structure • Positive cash flow generation since IPO and projected positive cash flow i
Slide 7: Performance Highlights
PERFORMANCE HIGHLIGHTS
Slide 8: Key Performance Highlights
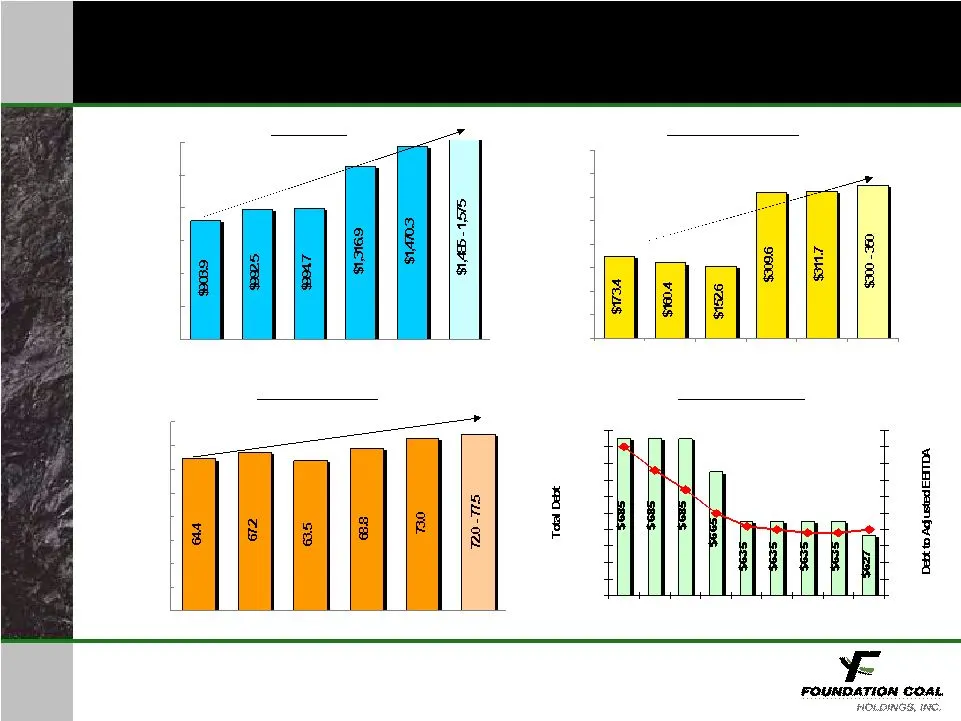
KEY PERFORMANCE HIGHLIGHTS 1,000 1,250 1,500 Notes: In millions 2002 – 04 data on pro forma basis 2005-07 data reflect results for successor company 2007 data per 2/15/07 guidance Revenues Revenues Adjusted EBITDA Adjusted EBITDA Coal Shipments Coal Shipments 4.5 3.8 3.2 2.5 1.9 1.9 2.0 2.1 2.0 Q4 Q
Slide 9: Strong Positive Free Cash Flow
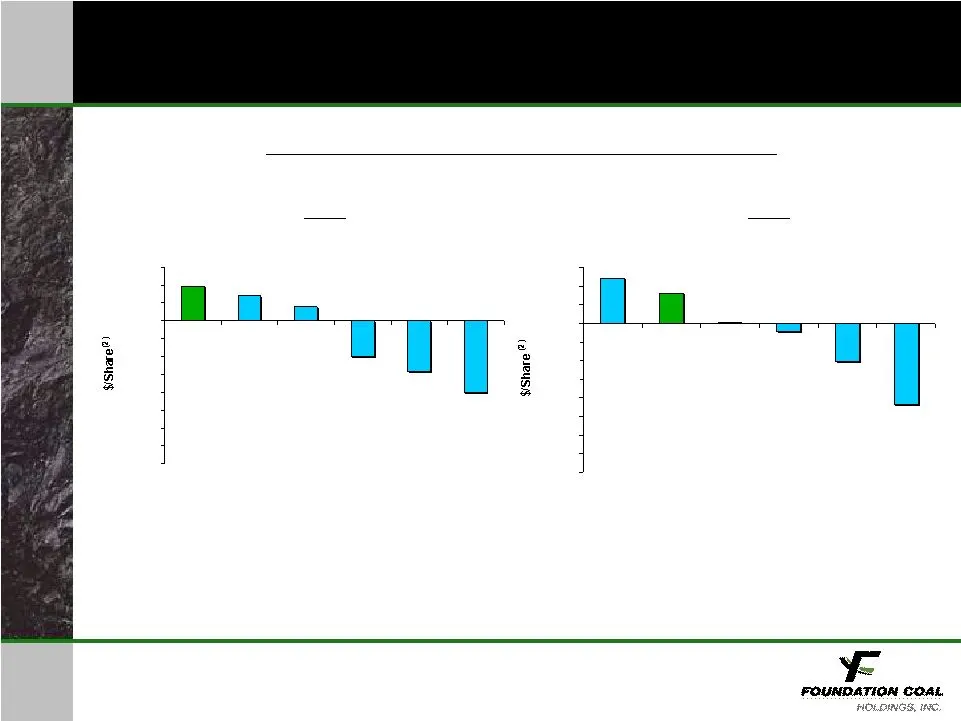
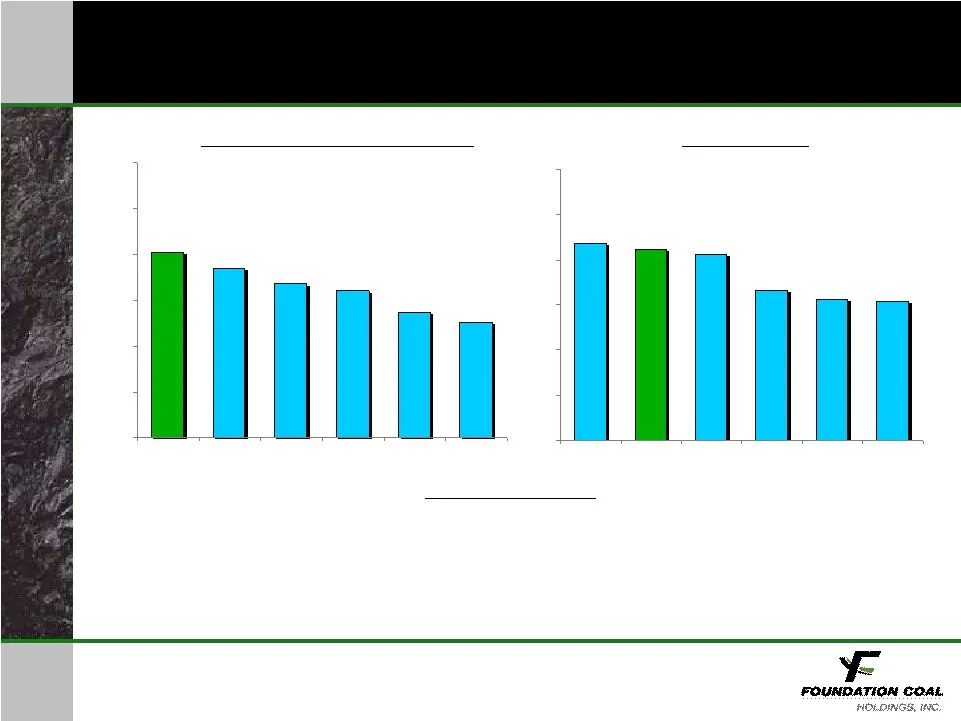
STRONG POSITIVE FREE CASH FLOW -$4.00 -$3.50 -$3.00 -$2.50 -$2.00 -$1.50 -$1.00 -$0.50 $0.00 $0.50 $1.00 $1.50 A FCL B C D E Notes: (1) Represents cash flow from operating activities less purchases of property, plant & equipment, including amounts paid under coal leases (bonus bids, minimum royaltie
Slide 10: Favorable Margin Comparison
FAVORABLE MARGIN COMPARISON • Large, diversified producer • Safe, low-cost, highly productive operations • Effective use of technology Note: * Excludes margin from non-coal related core assets Source: Public company filings and press releases; EBITDA adjusted for unusual and one-time items • Emphasi
Slide 11: Foundation Coal Holdings, Inc.
FOUNDATION COAL HOLDINGS, INC

Slide 12

Slide 13

Slide 14

Slide 15

Slide 16: Energy Industry Overview
ENERGY INDUSTRY OVERVIEW
Slide 17: Have Coal Prices Found New Floor?
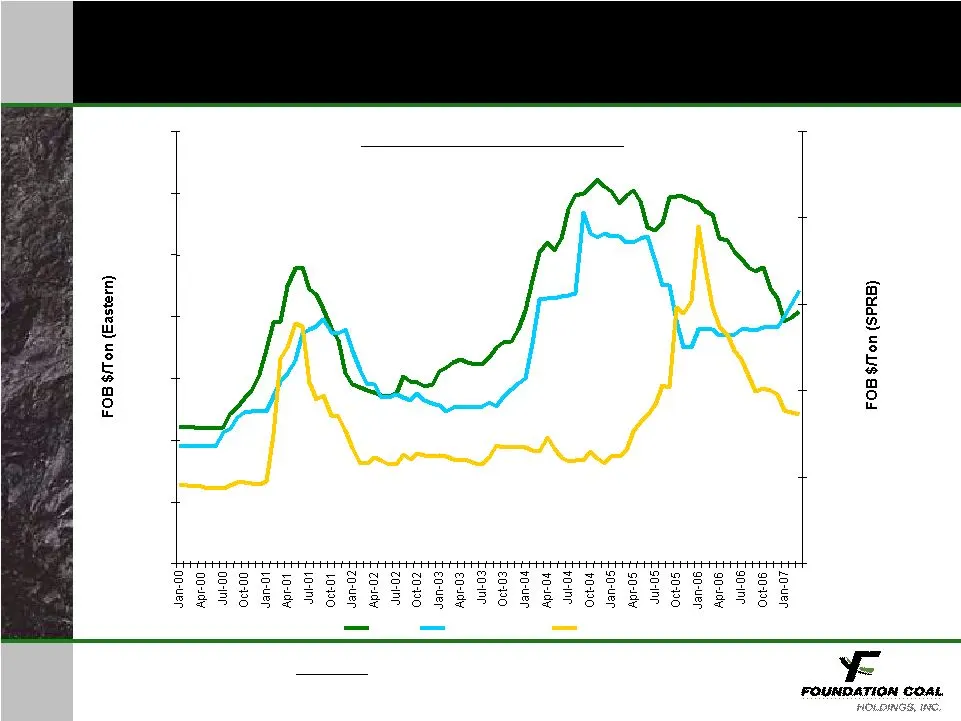
HAVE COAL PRICES FOUND NEW FLOOR? Source: Platts Coal Outlook Average Average Monthly Monthly Spot Spot Prices Prices $0.00 $10.00 $20.00 $30.00 $40.00 $50.00 $60.00 $70.00 $0.00 $5.00 $10.00 $15.00 $20.00 $25.00 NYMEX Pitt 8, 4.0 LB. SO2 PRB 8800
Slide 18: Coal Is Still the Most Competitive Fossil Fuel for Baseload Generation
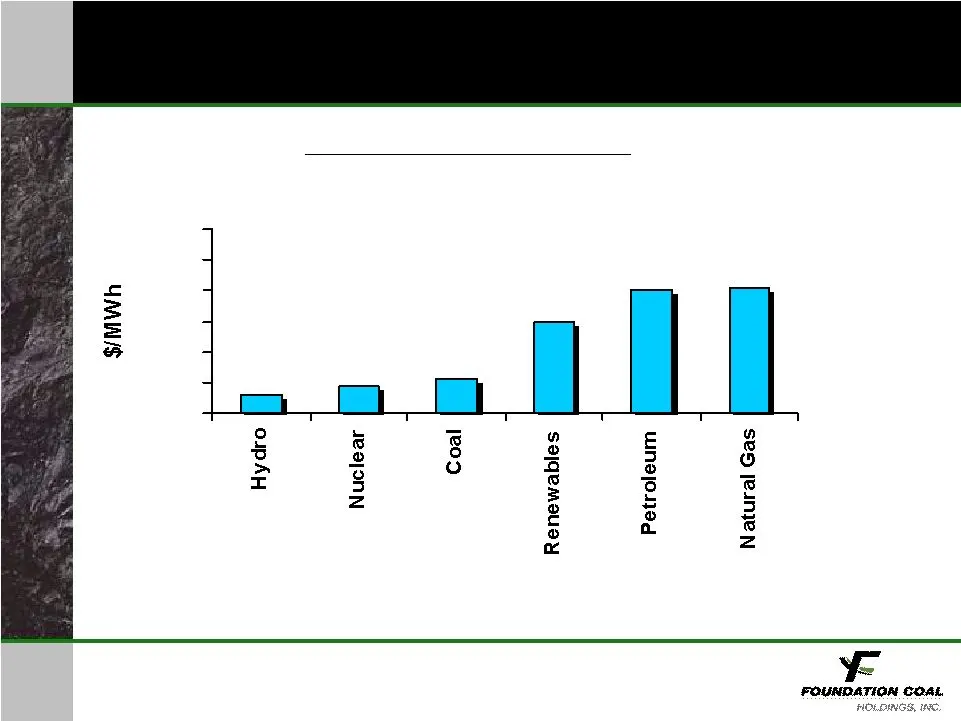
COAL IS STILL THE MOST COMPETITIVE FOSSIL FUEL FOR BASELOAD GENERATION $81.58 $80.61 $59.57 $21.62 $17.27 $11.41 Power Power Production Production Cost Cost Comparison Comparison Sources: Global Energy Advisors, via FERC Form 1 and EIA Form 906; based on average fuel costs of: Natural Gas - $7.21/mm
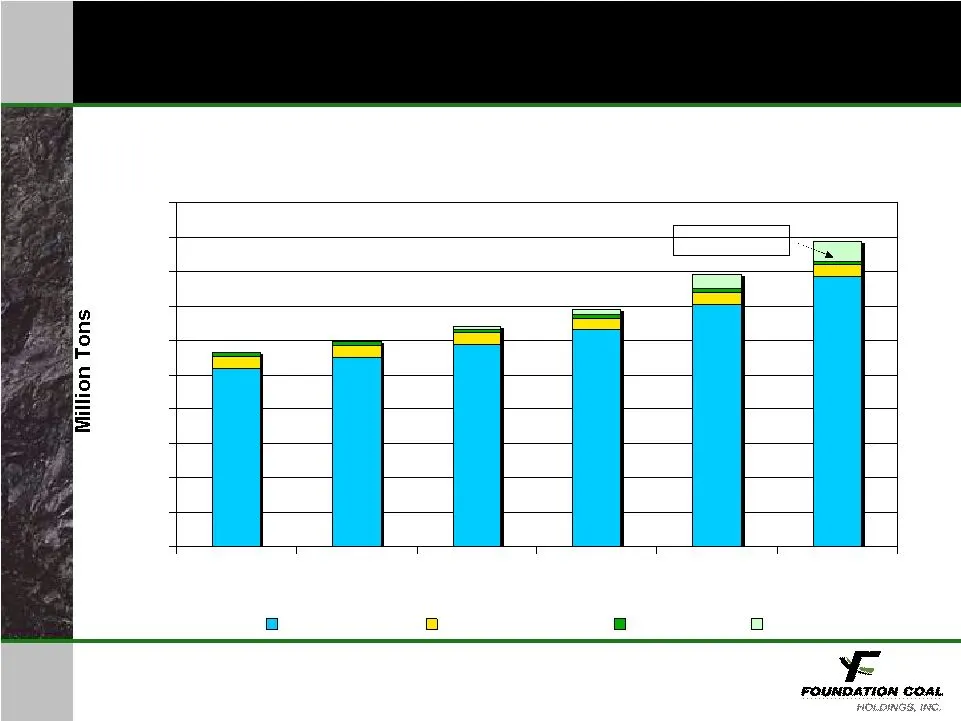
Slide 19: Future Demand Growth Through Increased Capacity Utilization and New Coal Plants
FUTURE DEMAND GROWTH THROUGH INCREASED CAPACITY UTILIZATION AND NEW COAL PLANTS Source: Energy Information Administration, Annual Energy Outlook (Early Release), Reference Case 1,000 1,200 1,400 1,600 1,800 2,000 Electric Power Industrial & Other Coke Plants CTL 112 MM tons
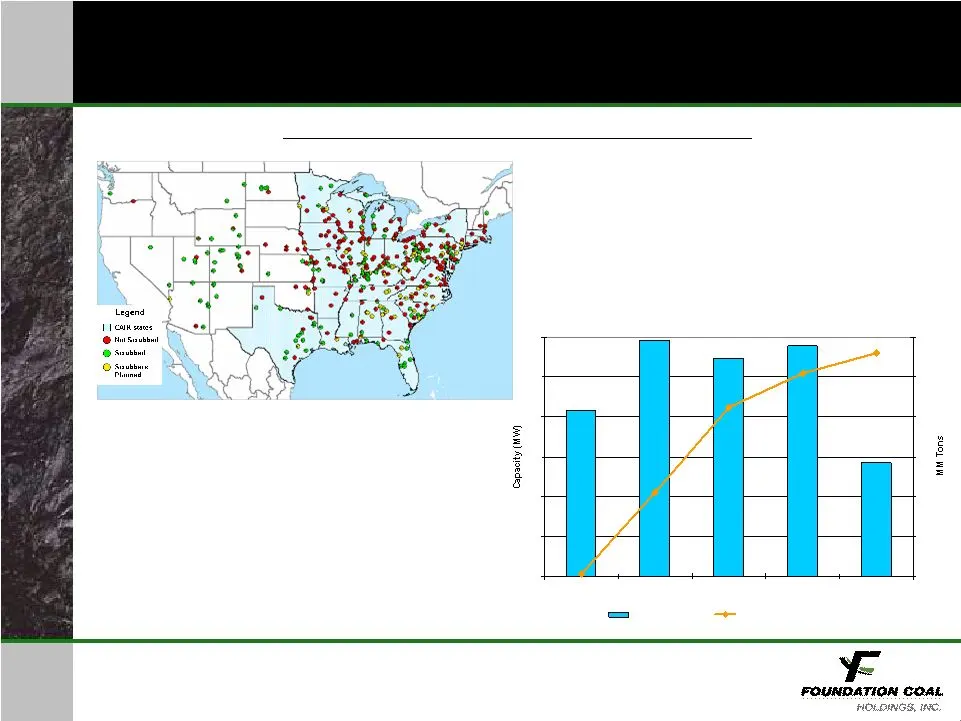
Slide 20: Additional Scrubbed Capacity Will Provide New Outlets for Higher Sulfur Coals
ADDITIONAL SCRUBBED CAPACITY WILL PROVIDE NEW OUTLETS FOR HIGHER SULFUR COALS Source: Cambridge Energy Research Associates and various news sources Existing Existing and and Proposed Proposed Scrubbers Scrubbers at at U.S. U.S. Coal Coal Plants Plants 2011+ Scrubber Additions FCL NAPP/ILB Open Tons
Slide 21: Foundation Coal Holdings, Inc.
re FOUNDATION COAL HOLDINGS, INC
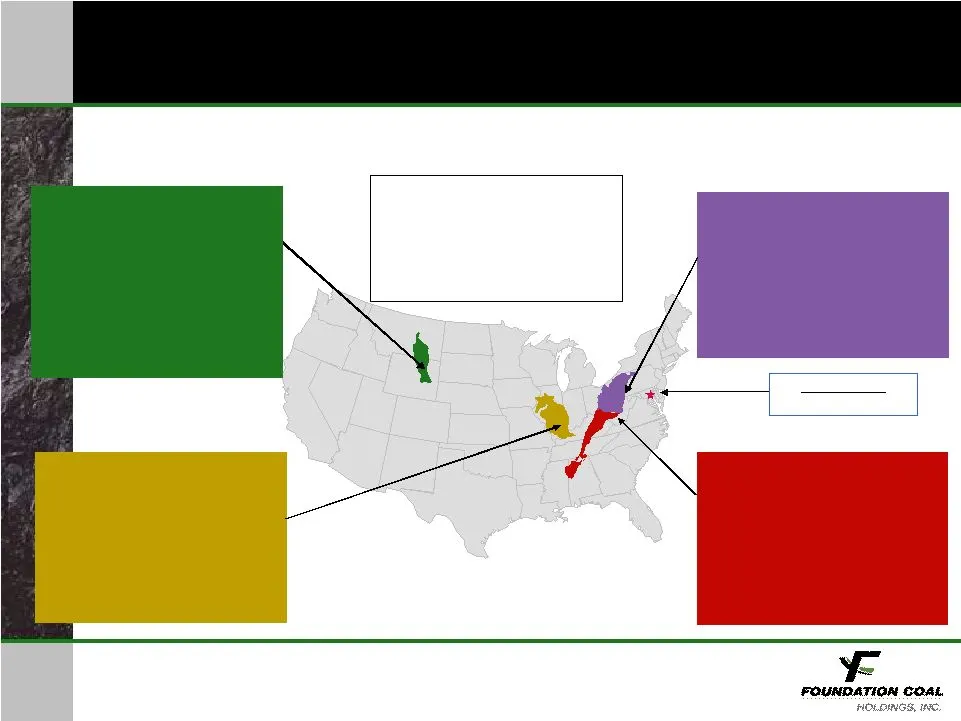
Slide 22: Diversified Operations
Shipments (tons MM) Sales ($ MM) Reserves (tons MM) Btu Sulfur Content 1.2 $32.6 64.0 Medium Medium Shipments (1) (tons MM) Sales (1) ($ MM) Reserves (tons MM) Btu Sulfur Content 8.9 $418.4 197.2 High Compliance and Low Shipments (tons MM) Sales ($ MM) Reserves (tons MM) Btu Sulfur Content 13.8 $535
Slide 23: Priced and Unpriced Tonnage (as of 1/24/07)
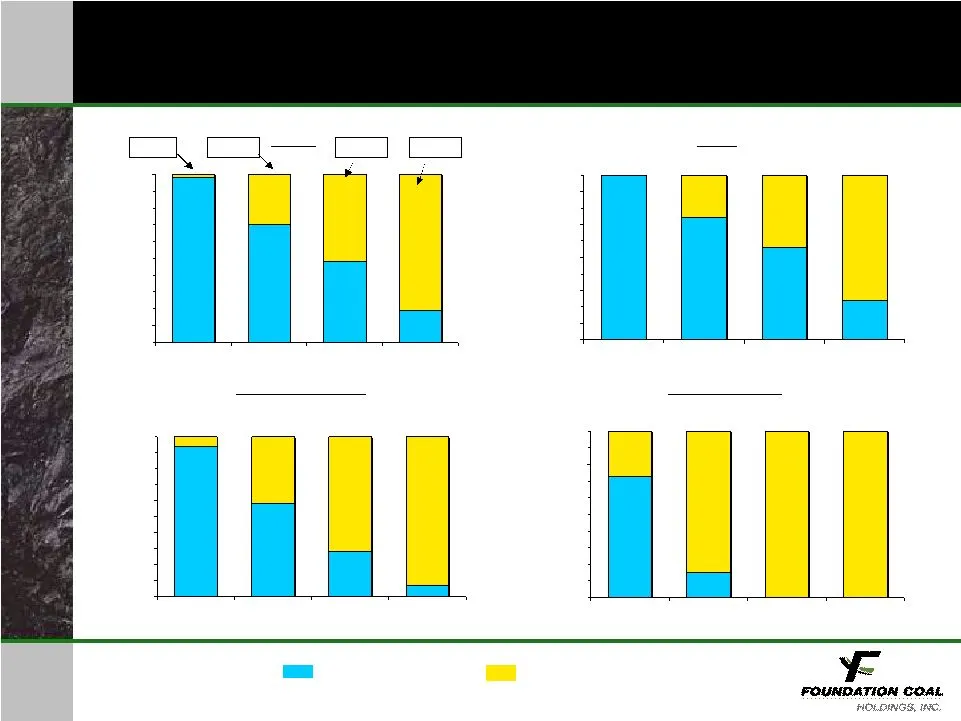
PRICED AND UNPRICED TONNAGE (AS OF 1/24/07) 70% 48% 19% 30% 52% 81% 98% 2% 0% 10% 20% 30% 40% 50% 60% 70% 80% 90% 100% Total Total PRB PRB Eastern Steam Eastern Steam Metallurgical Metallurgical Committed and priced Uncommitted and unpriced 74% 56% 24% 26% 44% 76% 100% 0% 0% 10% 20% 30% 40% 50% 60%

Slide 24: A Wealth of Growth and Sustainability Projects Ensure Future Production Potential
A WEALTH OF GROWTH AND SUSTAINABILITY PROJECTS ENSURE FUTURE PRODUCTION POTENTIAL • Powder River Basin – Belle Ayr Mine can expand to 30 million tons of capacity by 2008, if market warrants • Phase I (2006) 5 million tons • Phase II (2008) 5 million tons possible • Phase III (by 2012) 10 million ton
Slide 25: FCL Valuation Versus Its Peers
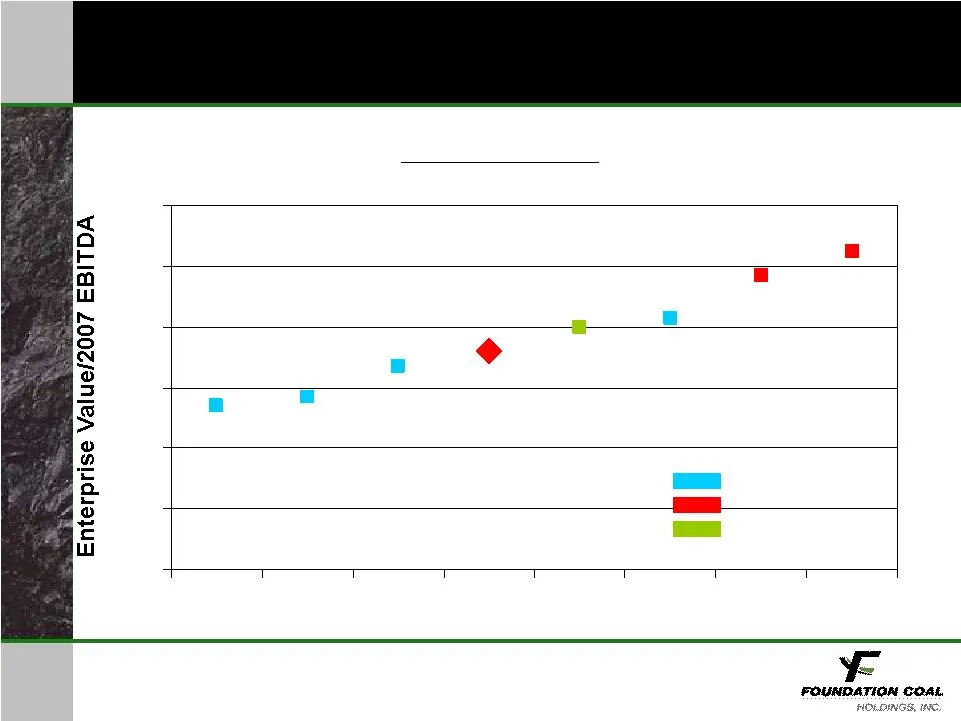
FCL VALUATION VERSUS ITS PEERS Valuation Comparison Valuation Comparison Notes: 2007 EBITDA per 3/23/07 First Call Mean 0x 2x 4x 6x 8x 10x 12x A F D FCL B G E C < 50 MM TPY, regional > 50 MM TPY, diversified > 50 MM TPY, regional

Slide 26: Summary
SUMMARY • Major player in NAPP and PRB • Successful business strategy • Proven record of performance • Well-balanced near-term and future contract position • Favorable long-term market fundamentals • Excellent long-term outlook Solid company, solid performance

Slide 27: Foundation Coal Holdings, Inc.
y- FOUNDATION COAL HOLDINGS, INC.
Source: SEC EDGAR · 8-K filed Apr 4, 2007
More decks from Alpha Natural Resources Inc
 J.P. Morgan Global High Yield & Leveraged Finance Conference (February 2015)36 slides · Feb 23, 2015
 Barclays CEO Energy-Power Conference 201435 slides · Sep 2, 2014
 2014 BMO 23rd Global Metals and Mining Conference; Sterne Agee 2014 Boston Executive Summi33 slides · Jun 17, 2014
 2014 BMO 23rd Global Metals and Mining Conference / Brean Capital 2014 Global Resources &30 slides · May 28, 2014
 2014 BMO 23rd Global Metals and Mining Conference30 slides · Feb 24, 2014
 Tuohy Brothers' 4th Annual Energy Conference (August 2013)26 slides · Aug 5, 2013