Endurance Specialty Holdings Ltd
Endurance Specialty — Investor Presentation (November 2009)
37 slides from Endurance Specialty's investor presentation, Nov 13, 2009
Slide 1: Investor Presentation
Investor Presentation
Slide 2: Forward looking statements & Regulation G disclaimer
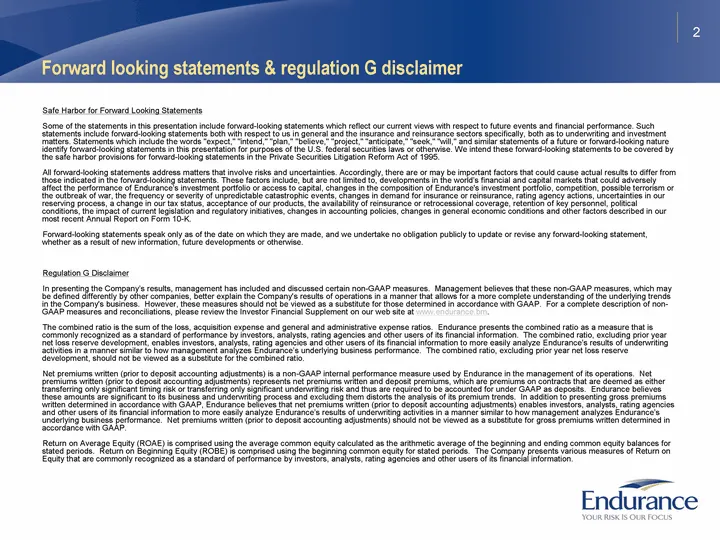
2 Forward looking statements & regulation G disclaimer Safe Harbor for Forward Looking Statements Some of the statements in this presentation include forward-looking statements which reflect our current views with respect to future events and financial performance. Such statements include forward-lo
Slide 3: Investor value proposition
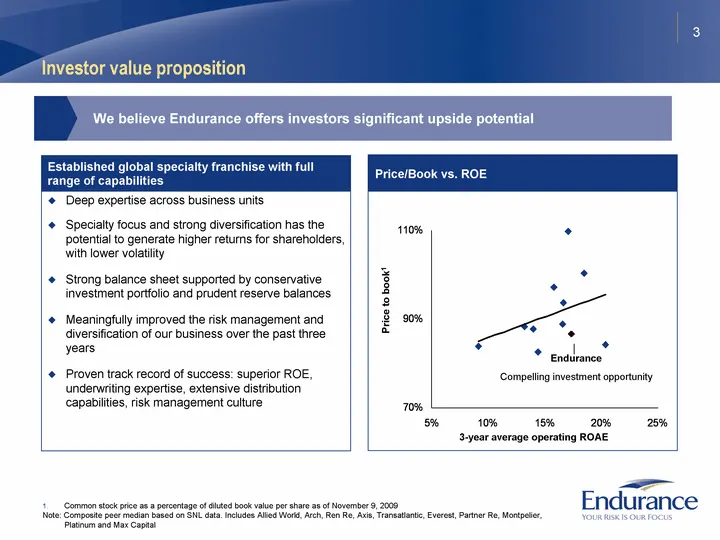
3 Investor value proposition Deep expertise across business units Specialty focus and strong diversification has the potential to generate higher returns for shareholders, with lower volatility Strong balance sheet supported by conservative investment portfolio and prudent reserve balances Meaningfu
Slide 4: Introduction to Endurance Specialty Holdings
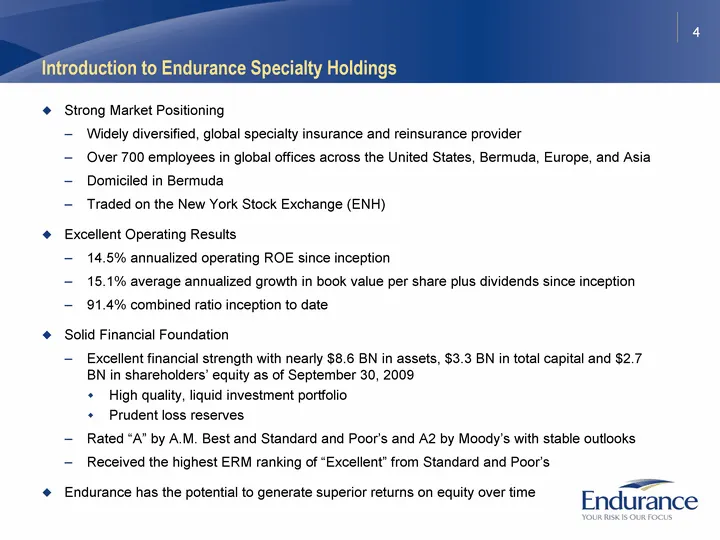
4 Introduction to Endurance Specialty Holdings Strong Market Positioning Widely diversified, global specialty insurance and reinsurance provider Over 700 employees in global offices across the United States, Bermuda, Europe, and Asia Domiciled in Bermuda Traded on the New York Stock Exchange (ENH) E
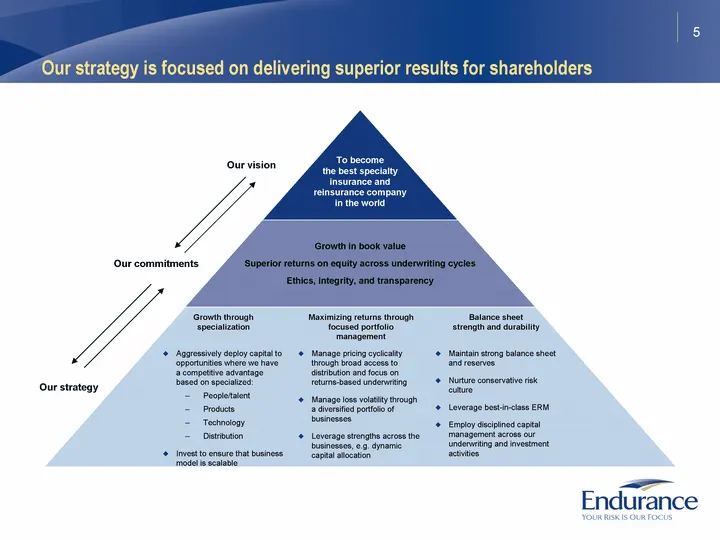
Slide 5: Our strategy is focused on delivering superior results for shareholders
5 Our strategy is focused on delivering superior results for shareholders Our vision Our commitments Our strategy Growth in book value Superior returns on equity across underwriting cycles Ethics, integrity, and transparency To become the best specialty insurance and reinsurance company in the world
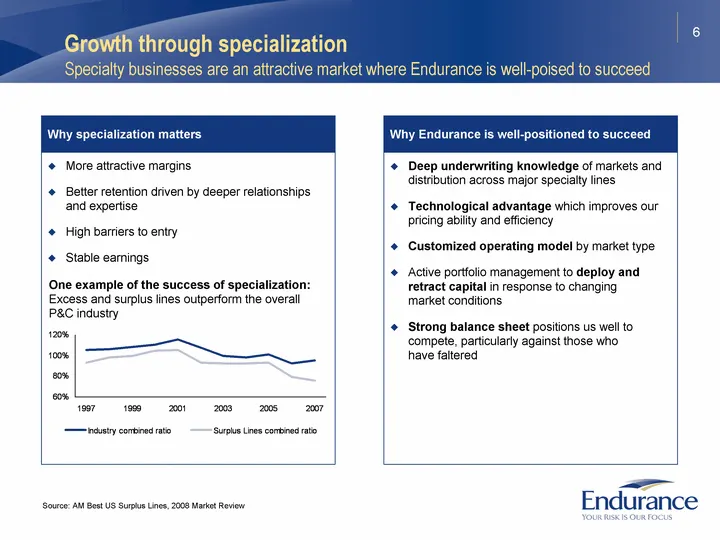
Slide 6: Why specialization matters
6 More attractive margins Better retention driven by deeper relationships and expertise High barriers to entry Stable earnings Why specialization matters Why Endurance is well-positioned to succeed Deep underwriting knowledge of markets and distribution across major specialty lines Technological adv
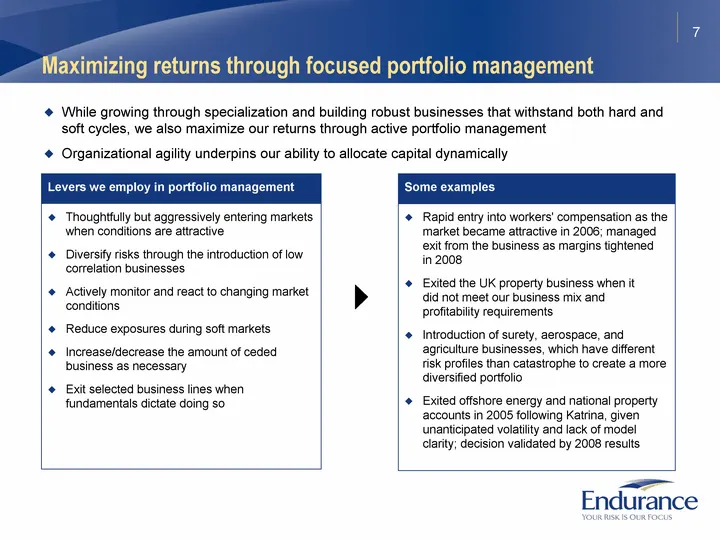
Slide 7: Maximizing returns through focused portfolio management
7 Rapid entry into workers' compensation as the market became attractive in 2006; managed exit from the business as margins tightened in 2008 Exited the UK property business when it did not meet our business mix and profitability requirements Introduction of surety, aerospace, and agriculture busine
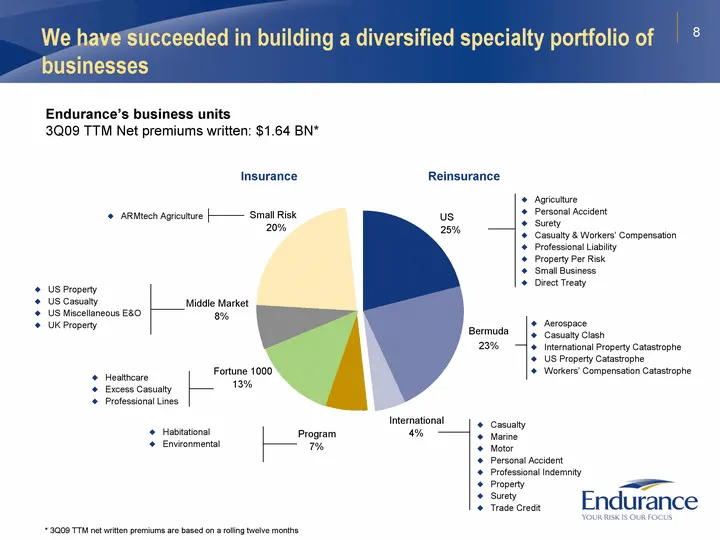
Slide 8: Diversified specialty portfolio of businesses
8 We have succeeded in building a diversified specialty portfolio of businesses Endurance's business units 3Q09 TTM Net premiums written: $1.64 BN* Reinsurance Insurance Agriculture Personal Accident Surety Casualty & Workers' Compensation Professional Liability Property Per Risk Small Business Dire
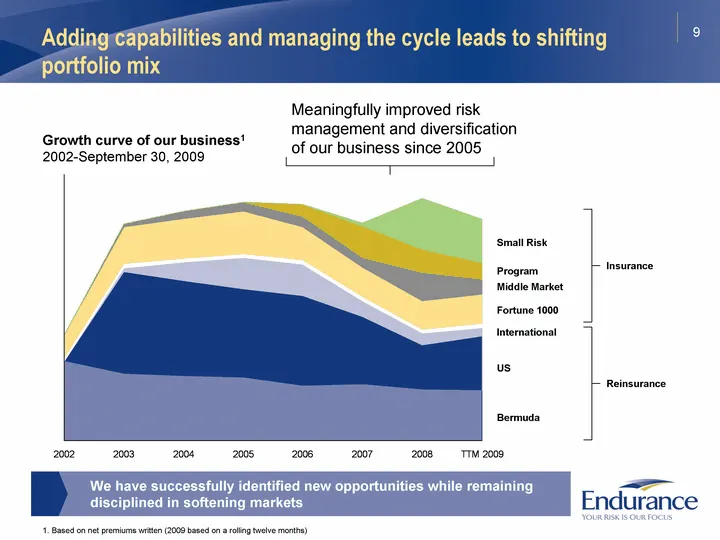
Slide 9: Shifting portfolio mix
9 Adding capabilities and managing the cycle leads to shifting portfolio mix 2002 2003 2004 2005 2006 2007 2008 TTM 2009 Bermuda 596256 498561 484497 470998 411012 420658 384437 377700 US 0 771677 718022 672209 679578 509202 334114 411200 International 29444 137731 231777 237332 121701 90233 62200 3
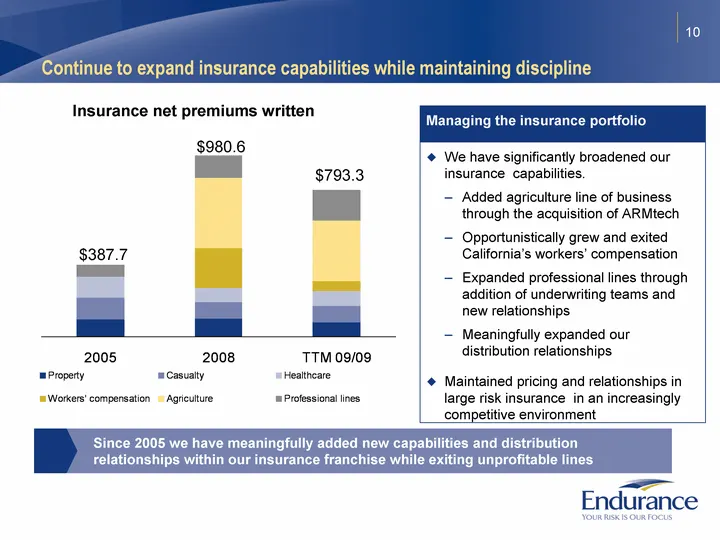
Slide 10: Continue to expand insurance capabilities while maintaining discipline
10 Continue to expand insurance capabilities while maintaining discipline 2005 2008 TTM 09/09 Property 91.8 98 78.5 Casualty 117 86.6 89.6 Healthcare 117.1 80 79.9 Workers' compensation 0 215.8 50.8 Agriculture 0 380.7 328.7 Professional lines 61.7 119.4 165.8 G 7 14 H 8 8 $387.7 $980.6 Since 2005 w
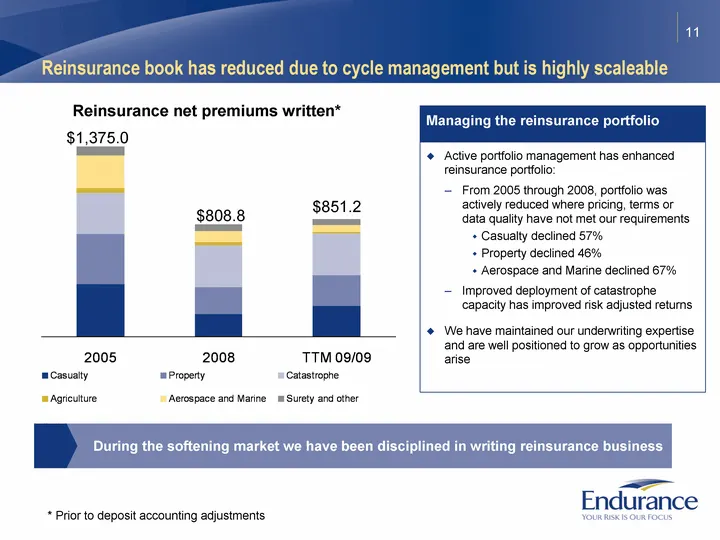
Slide 11: Reinsurance book reduced due to cycle management but highly scaleable
11 Reinsurance book has reduced due to cycle management but is highly scaleable 2005 2008 TTM 09/09 Casualty 380.3 163.5 223.5 Property 360.5 195.8 219.1 Catastrophe 297 302.1 303.5 Agriculture 33 21 9.9 Aerospace and Marine 239.5 77.8 50.9 Surety and other 64.6 48.6 44.3 G 7 14 H 8 8 $1,375.0 $808.
Slide 12: Our results summary
12 Our results Summary Strong return to shareholders Inception to date average total return to investors of 19.1%. Total return measured by the annual change in diluted book value per common share plus dividends divided by beginning diluted book value per share. Superior returns on equity 19.3% aver
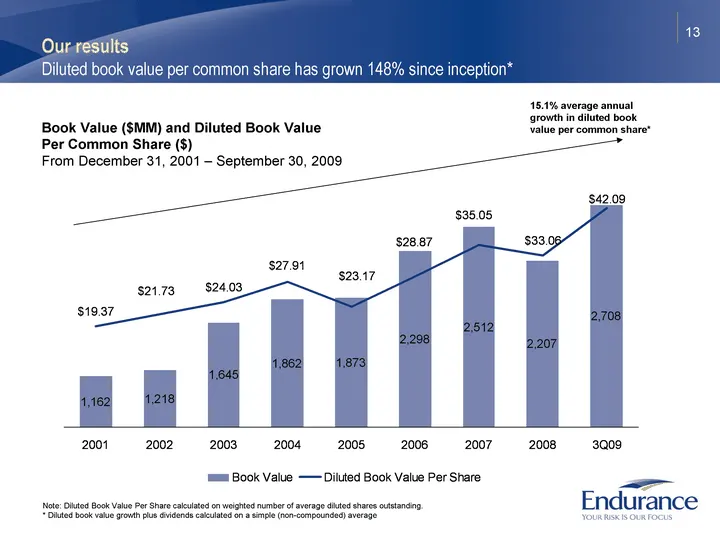
Slide 13: Diluted book value per common share has grown 148% since inception
13 Our results Diluted book value per common share has grown 148% since inception* Book Value ($MM) and Diluted Book Value Per Common Share ($) From December 31, 2001 - September 30, 2009 2001 2002 2003 2004 2005 2006 2007 2008 1Q09 3Q09 Diluted Book Value Per Share 19.37 21.73 24.03 27.91 23.17 28.
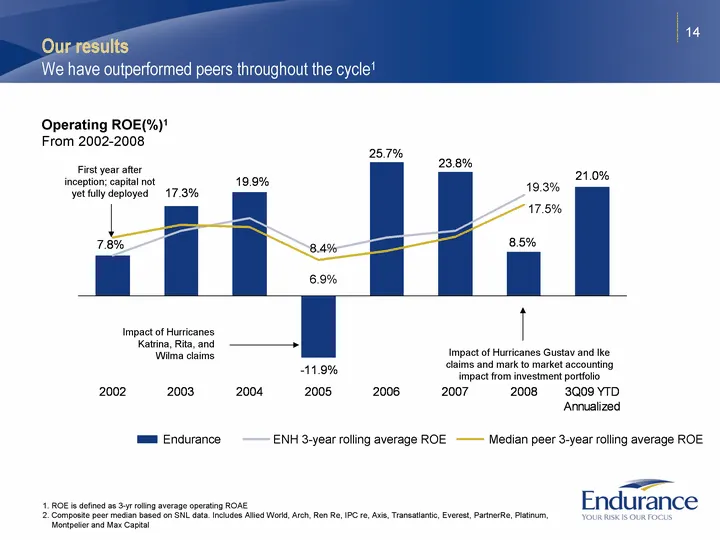
Slide 14: Operating ROE 2002-2008
14 2002 2003 2004 2005 2006 2007 2008 3Q09 YTD Annualized Endurance ROE 0.078 0.173 0.199 -0.119 0.257 0.238 0.085 0.21 0.978 0.9767 0.97 Endurance 3-year rolling average 0.078 0.1255 0.15 0.084333333 0.112333333 0.125333333 0.193333333 Peer 3-year rolling average ROE 0.165 0.146 0.0745 0.0928 0.116
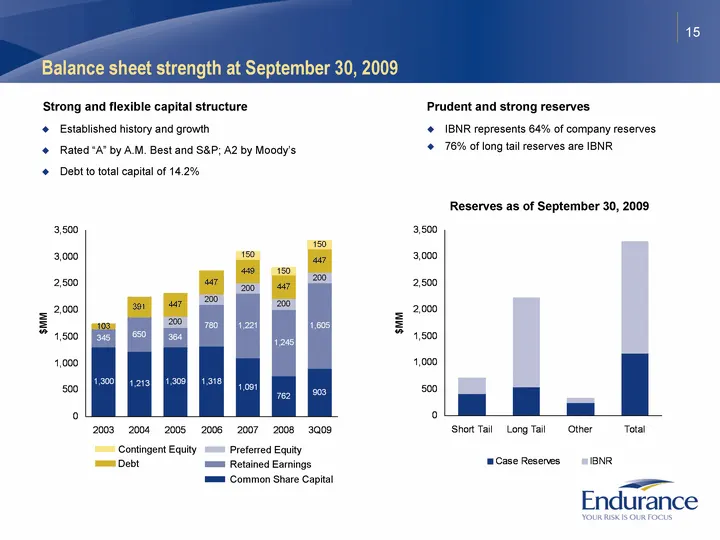
Slide 15: Balance sheet strength at September 30, 2009
15 Balance sheet strength at September 30, 2009 Strong and flexible capital structure IBNR represents 64% of company reserves 76% of long tail reserves are IBNR Prudent and strong reserves Short Tail Long Tail Other Total 2007 2008 Case Reserves 402.311 538.386 233.282 1173.979 3111.1 2804.3 IBNR 31
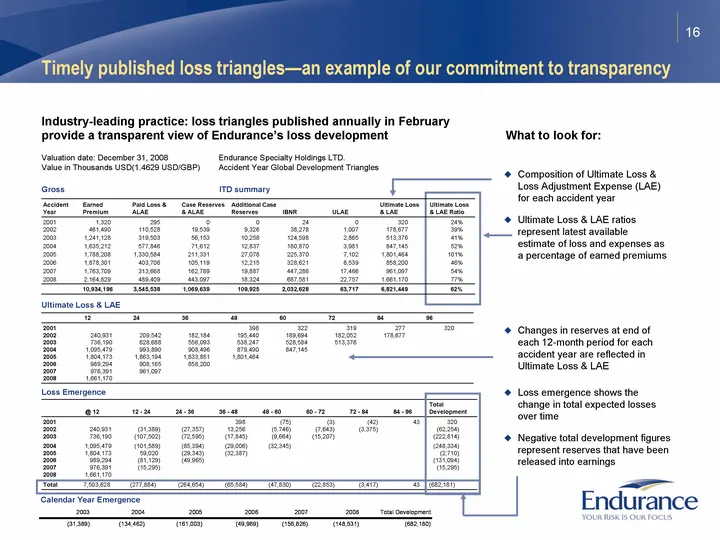
Slide 16: Timely published loss triangles
16 Timely published loss triangles-an example of our commitment to transparency Industry-leading practice: loss triangles published annually in February provide a transparent view of Endurance's loss development Composition of Ultimate Loss & Loss Adjustment Expense (LAE) for each accident year Ulti
Slide 17: Investment portfolio composition at September 30, 2009
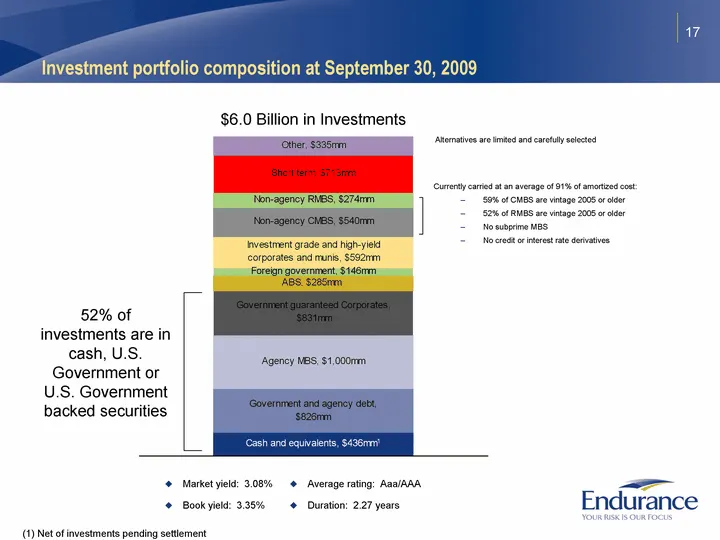
17 Cash and equivalents 436 Government and agency debt 825 Agency MBS 1000 Government guaranteed corporates 831 ABS 285 Foreign government 146 Investment grade and high-yield corporates and munis 592 Non-agency CMBS 540 Non-agency RMBS 274 Short term 713 Preferred equity securities Other 335 Aggrega
Slide 18: Senior non-agency RMBS portfolio
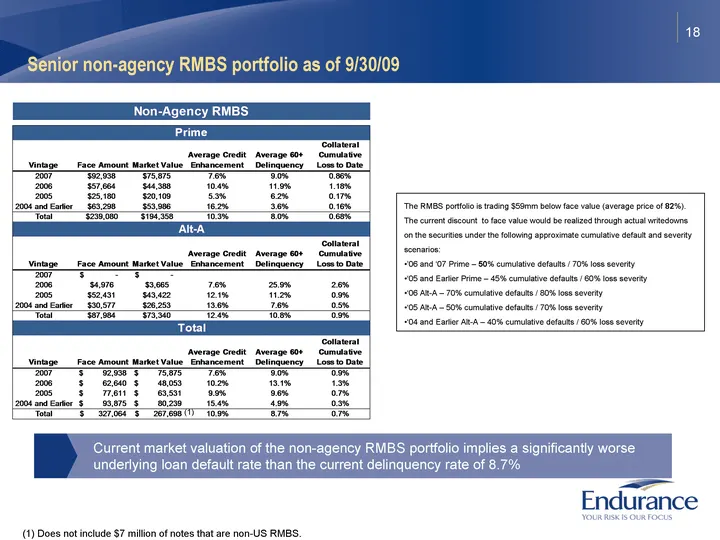
18 Senior non-agency RMBS portfolio as of 9/30/09 (1) Does not include $7 million of notes that are non-US RMBS. (1) Current market valuation of the non-agency RMBS portfolio implies a significantly worse underlying loan default rate than the current delinquency rate of 8.7% The RMBS portfolio is tr
Slide 19: Senior non-agency CMBS portfolio
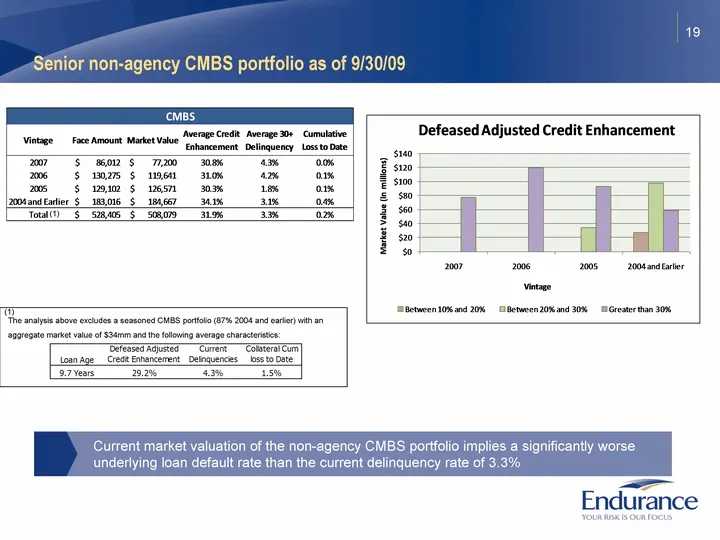
The analysis above excludes a seasoned CMBS portfolio (87% 2004 and earlier) with an aggregate market value of $34mm and the following average characteristics: 19 Senior non-agency CMBS portfolio as of 9/30/09 (1) (1) Current market valuation of the non-agency CMBS portfolio implies a significantly
Slide 20: Conclusion: Endurance is a compelling investment opportunity
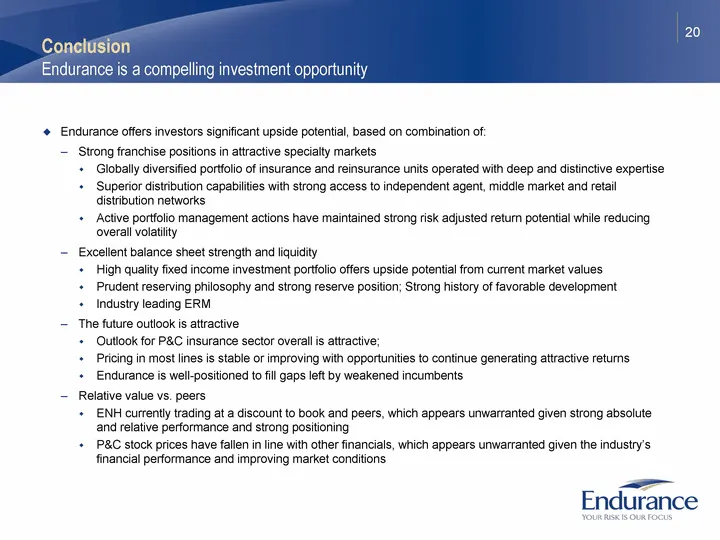
20 Conclusion Endurance is a compelling investment opportunity Endurance offers investors significant upside potential, based on combination of: Strong franchise positions in attractive specialty markets Globally diversified portfolio of insurance and reinsurance units operated with deep and distinc

Slide 21: Endurance
> - Endurance
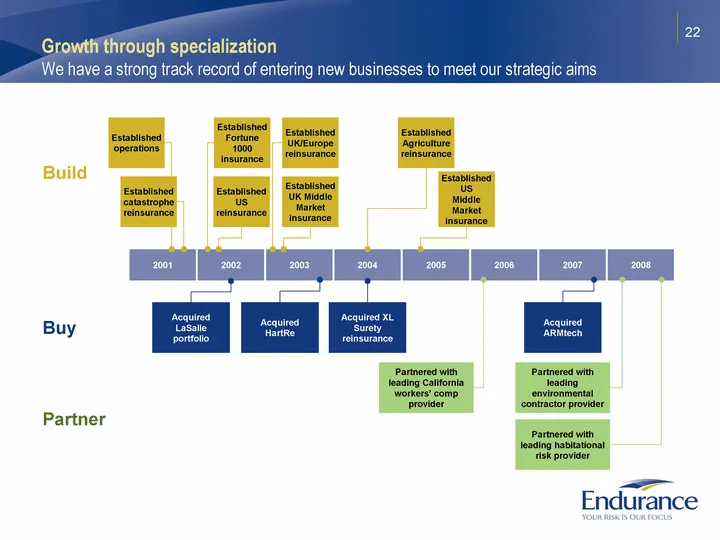
Slide 22: Growth through specialization
22 Growth through specialization We have a strong track record of entering new businesses to meet our strategic aims Buy Build Partner 2008 2006 2001 2002 2003 2004 2005 2007 Acquired LaSalle portfolio Acquired HartRe Acquired ARMtech Partnered with leading California workers' comp provider Acquired
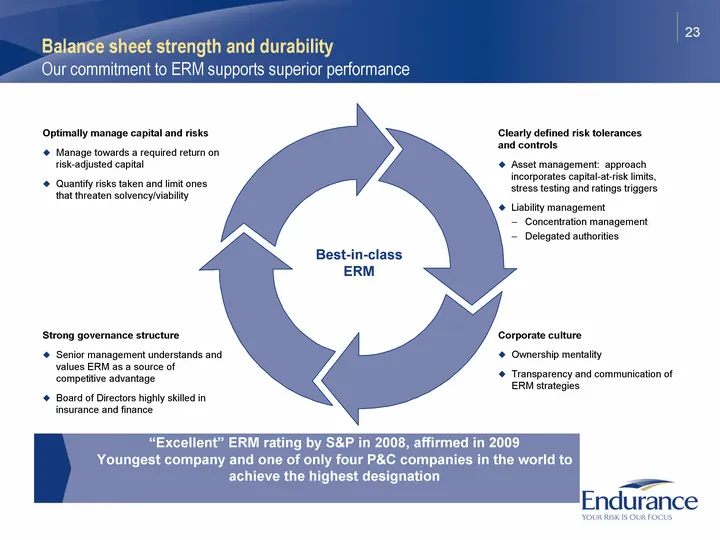
Slide 23: Balance sheet strength and durability: ERM
23 Balance sheet strength and durability Our commitment to ERM supports superior performance Best-in-class ERM Optimally manage capital and risks Manage towards a required return on risk-adjusted capital Quantify risks taken and limit ones that threaten solvency/viability Clearly defined risk tolera
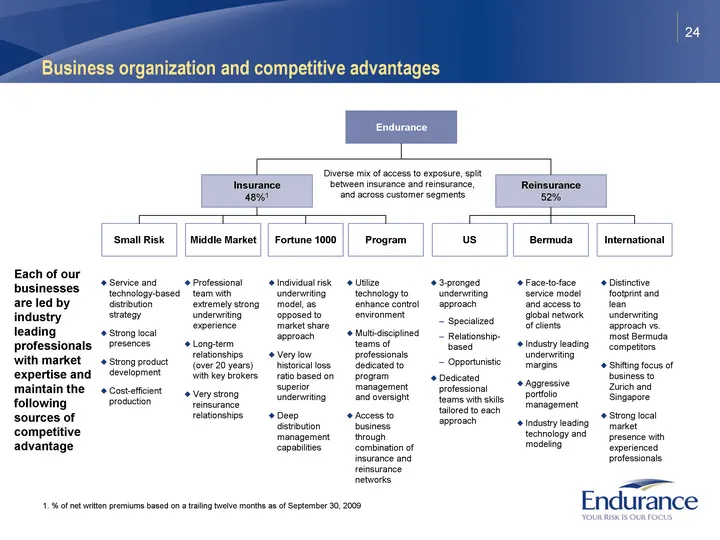
Slide 24: Business organization and competitive advantages
24 Business organization and competitive advantages 1. % of net written premiums based on a trailing twelve months as of September 30, 2009 Each of our businesses are led by industry leading professionals with market expertise and maintain the following sources of competitive advantage Endurance Ins
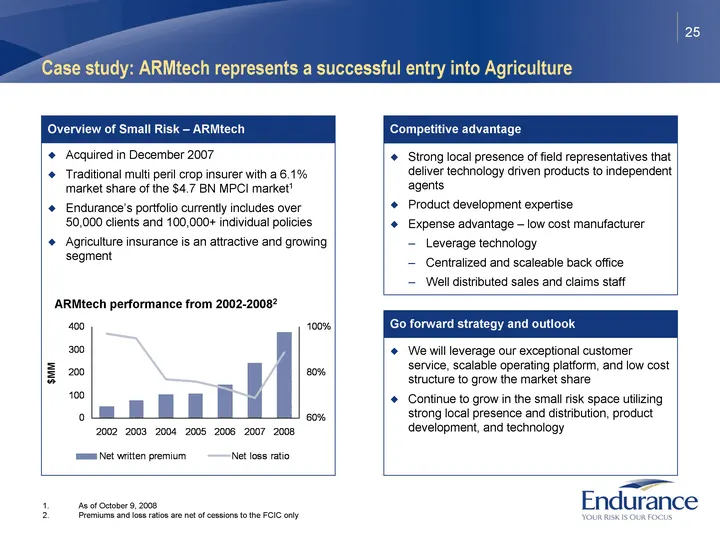
Slide 25: Case study: ARMtech entry into Agriculture
25 Case study: ARMtech represents a successful entry into Agriculture As of October 9, 2008 Premiums and loss ratios are net of cessions to the FCIC only Acquired in December 2007 Traditional multi peril crop insurer with a 6.1% market share of the $4.7 BN MPCI market1 Endurance's portfolio currentl
Slide 26: Building a differentiated portfolio within Middle Market
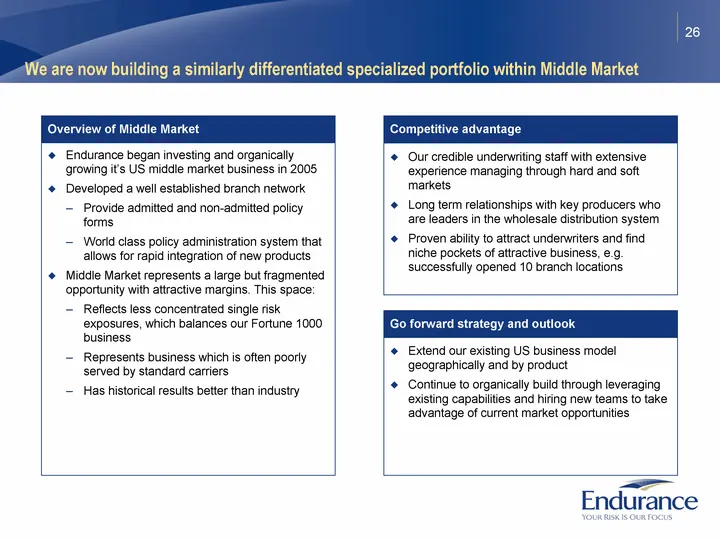
26 We are now building a similarly differentiated specialized portfolio within Middle Market Endurance began investing and organically growing it's US middle market business in 2005 Developed a well established branch network Provide admitted and non-admitted policy forms World class policy administ
Slide 27: Case study: Strong performance in Bermuda Cat
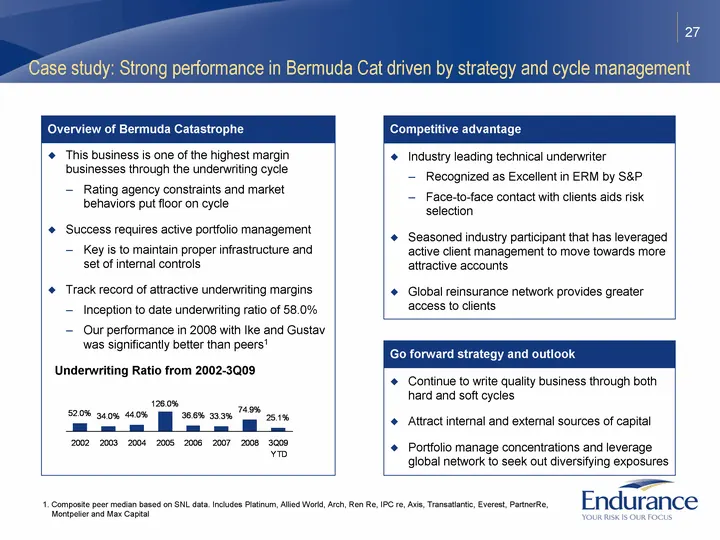
27 Case study: Strong performance in Bermuda Cat driven by strategy and cycle management This business is one of the highest margin businesses through the underwriting cycle Rating agency constraints and market behaviors put floor on cycle Success requires active portfolio management Key is to maint
Slide 28: Case study: California Workers' Comp insurance
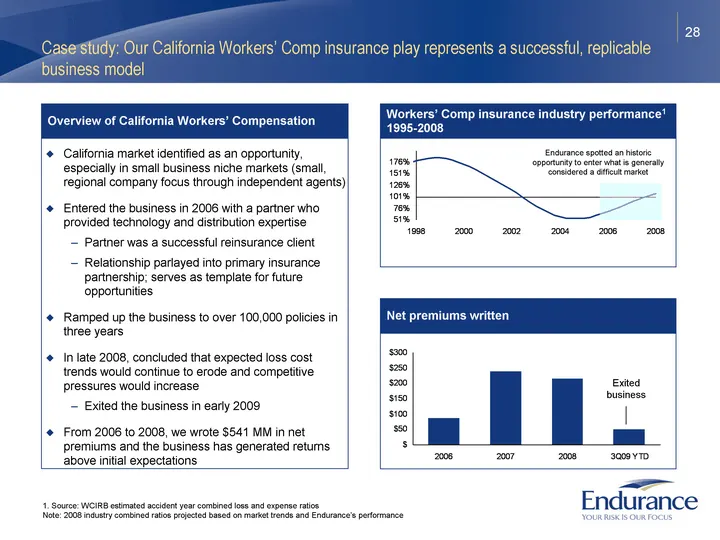
28 Industry combined ratio 1995 1.29 1996 1.4 1997 1.57 1998 1.79 1999 1.86 2000 1.7 2001 1.44 2002 1.15 2003 0.79 2004 0.57 2005 0.54 2006 0.69 2007 0.9 2008 1.08 Case study: Our California Workers' Comp insurance play represents a successful, replicable business model California market identified
Slide 29: Fortune 1000: historically a high margin business
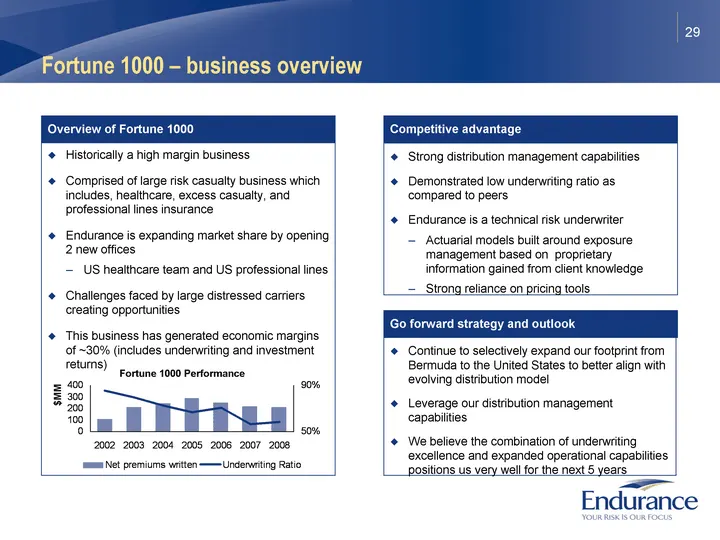
29 Historically a high margin business Comprised of large risk casualty business which includes, healthcare, excess casualty, and professional lines insurance Endurance is expanding market share by opening 2 new offices US healthcare team and US professional lines Challenges faced by large distresse
Slide 30: Program business overview
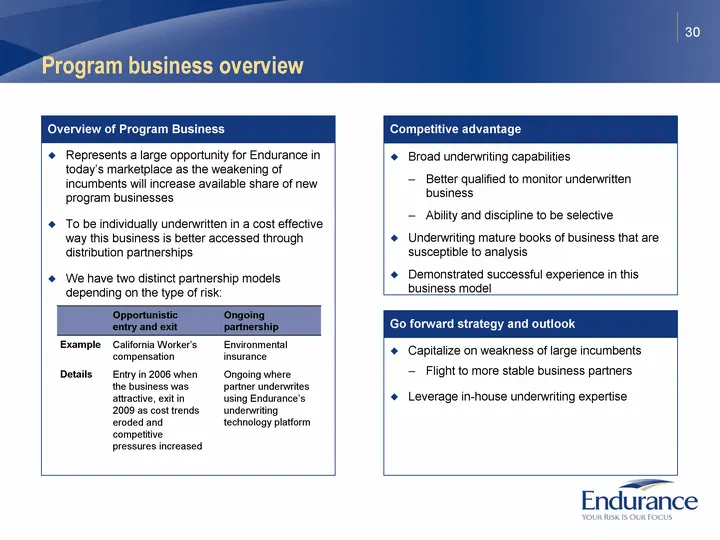
30 Program business overview Represents a large opportunity for Endurance in today's marketplace as the weakening of incumbents will increase available share of new program businesses To be individually underwritten in a cost effective way this business is better accessed through distribution partne
Slide 31: Overview of US Reinsurance
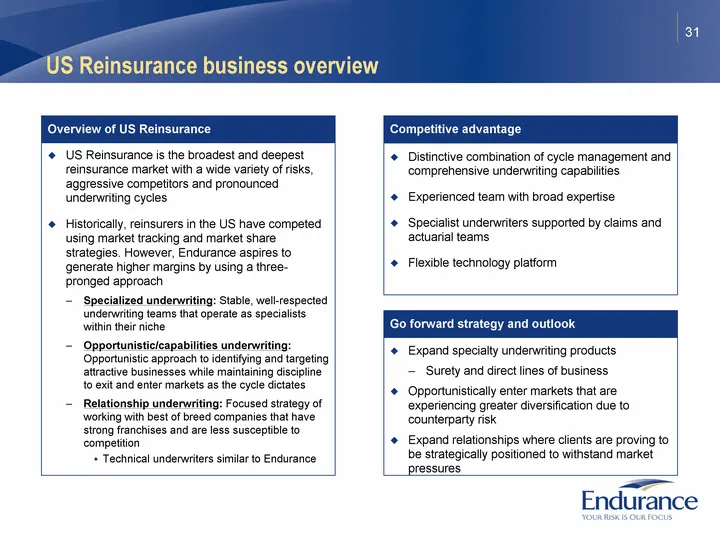
31 US Reinsurance is the broadest and deepest reinsurance market with a wide variety of risks, aggressive competitors and pronounced underwriting cycles Historically, reinsurers in the US have competed using market tracking and market share strategies. However, Endurance aspires to generate higher m
Slide 32: Global operations in London, Zurich, and Singapore
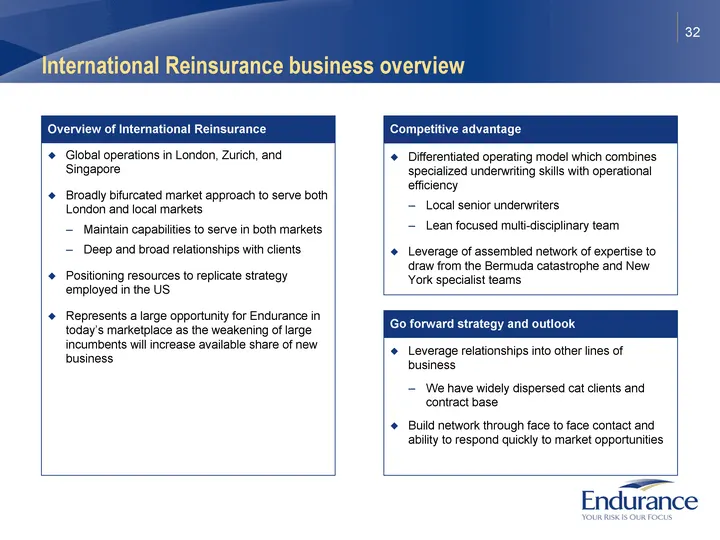
32 Global operations in London, Zurich, and Singapore Broadly bifurcated market approach to serve both London and local markets Maintain capabilities to serve in both markets Deep and broad relationships with clients Positioning resources to replicate strategy employed in the US Represents a large o
Slide 33: Financial results for Third quarter 2009
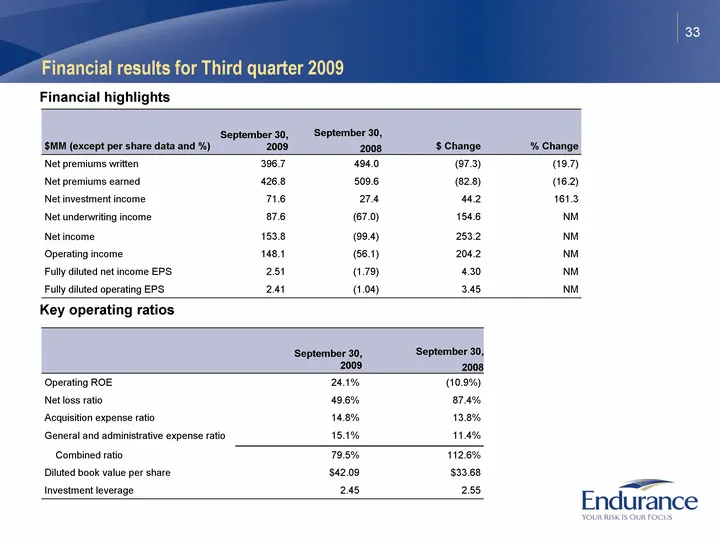
33 Financial results for Third quarter 2009 $MM (except per share data and %) September 30, 2009 September 30, 2008 $ Change % Change Net premiums written 396.7 494.0 (97.3) (19.7) Net premiums earned 426.8 509.6 (82.8) (16.2) Net investment income 71.6 27.4 44.2 161.3 Net underwriting income 87.6 (
Slide 34: Third quarter net written premiums
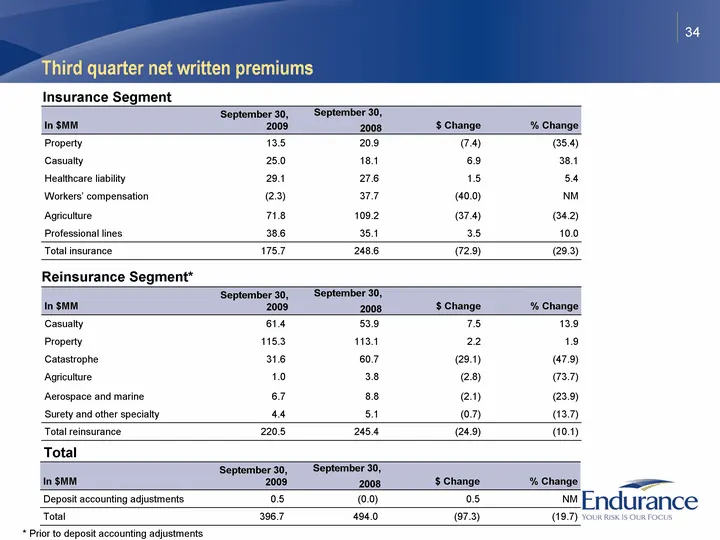
34 Third quarter net written premiums In $MM September 30, 2009 September 30, 2008 $ Change % Change Property 13.5 20.9 (7.4) (35.4) Casualty 25.0 18.1 6.9 38.1 Healthcare liability 29.1 27.6 1.5 5.4 Workers' compensation (2.3) 37.7 (40.0) NM Agriculture 71.8 109.2 (37.4) (34.2) Professional lines 3
Slide 35: Financial overview: historical
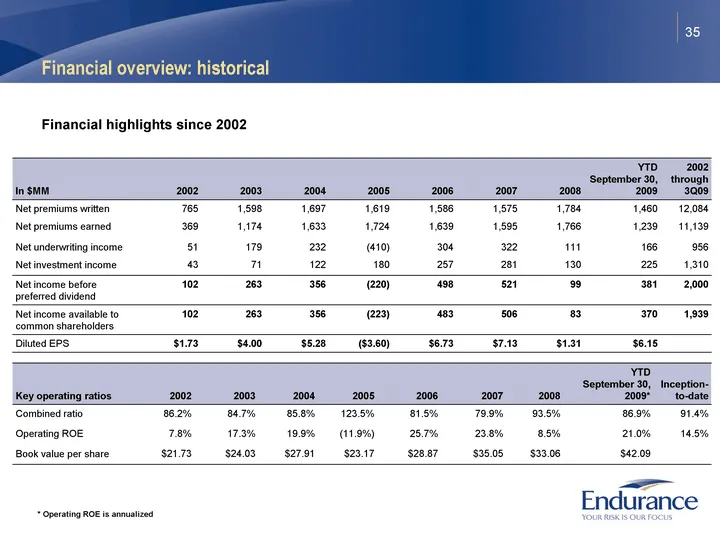
35 Financial overview: historical In $MM 2002 2003 2004 2005 2006 2007 2008 YTD September 30, 2009 2002 through 3Q09 Net premiums written 765 1,598 1,697 1,619 1,586 1,575 1,784 1,460 12,084 Net premiums earned 369 1,174 1,633 1,724 1,639 1,595 1,766 1,239 11,139 Net underwriting income 51 179 232 (
Slide 36: Capital management and dividends
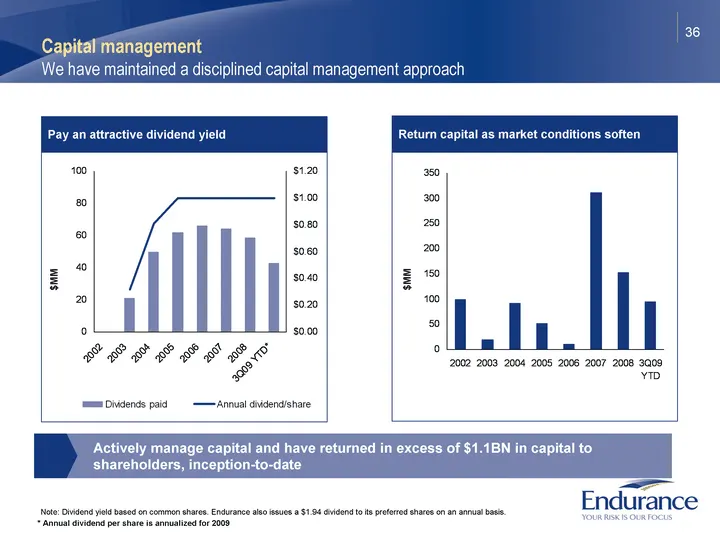
36 2002 2003 2004 2005 2006 2007 2008 3Q09 YTD* Annual dividend/share 0.32 0.81 1 1 1 1 1 Dividends paid 21 50 62 66 64 58.7 42.9 C 3 2.9 3.7 5 D 4 3 4.5 6 E 4 6 6.5 7 F 9 7 7.2 8 G 11 8 2 9 H 5 8 9 10 $MM 2002 2003 2004 2005 2006 2007 2008 3Q09 YTD Annual dividend 0.32 0.81 1 1 1 1 Capital returned
Slide 37: Underwriting Has Been Strong
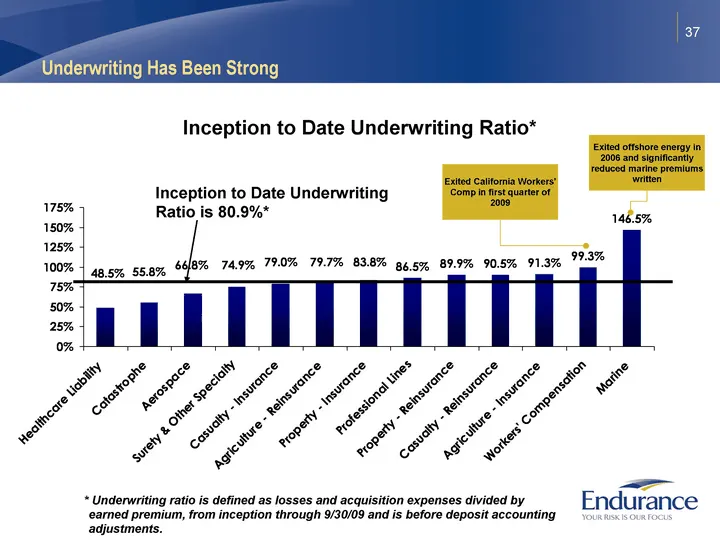
37 Underwriting Has Been Strong Healthcare Liability Catastrophe Aerospace Surety & Other Specialty Casualty - Insurance Agriculture - Reinsurance Property - Insurance Professional Lines Property - Reinsurance Casualty - Reinsurance Agriculture - Insurance Workers' Compensation Marine Premiums 0.485
Source: SEC EDGAR · 8-K filed Nov 13, 2009
More decks from Endurance Specialty Holdings Ltd
 Merger or Acquisition (October 2016)17 slides · Oct 12, 2016
 Investor Presentation (August 2016)29 slides · Aug 9, 2016
 Investor Presentation (May 2016)28 slides · May 10, 2016
 Investor Presentation (February 2016)29 slides · Feb 9, 2016
 Investor Presentation (February 2015)28 slides · Feb 11, 2015
 Merger or Acquisition (April 2014)22 slides · Apr 14, 2014