OMNOVA Solutions — J.P. Morgan Global High Yield & Leveraged Finance Conference 2015
29 slides from OMNOVA Solutions's conference presentation, Feb 23, 2015

Slide 1: Global Innovator of Performance Chemicals and Engineered Surfaces
Global Innovator of Performance Chemicals and Engineered Surfaces Creating Sustainable Long-Term Value Kevin M. McMullen Chairman & CEO February 23, 2015 J.P. Morgan Global High Yield & Leveraged Finance Conference
Slide 2: Forward-Looking Statements
Forward-Looking Statements • This presentation and the accompanying oral remarks include descriptions of our current business, operations, assets and other matters affecting the Company as well as “forward- looking statements,” as defined by federal securities laws. All forward-looking statements by
Slide 3: OMNOVA Solutions Today
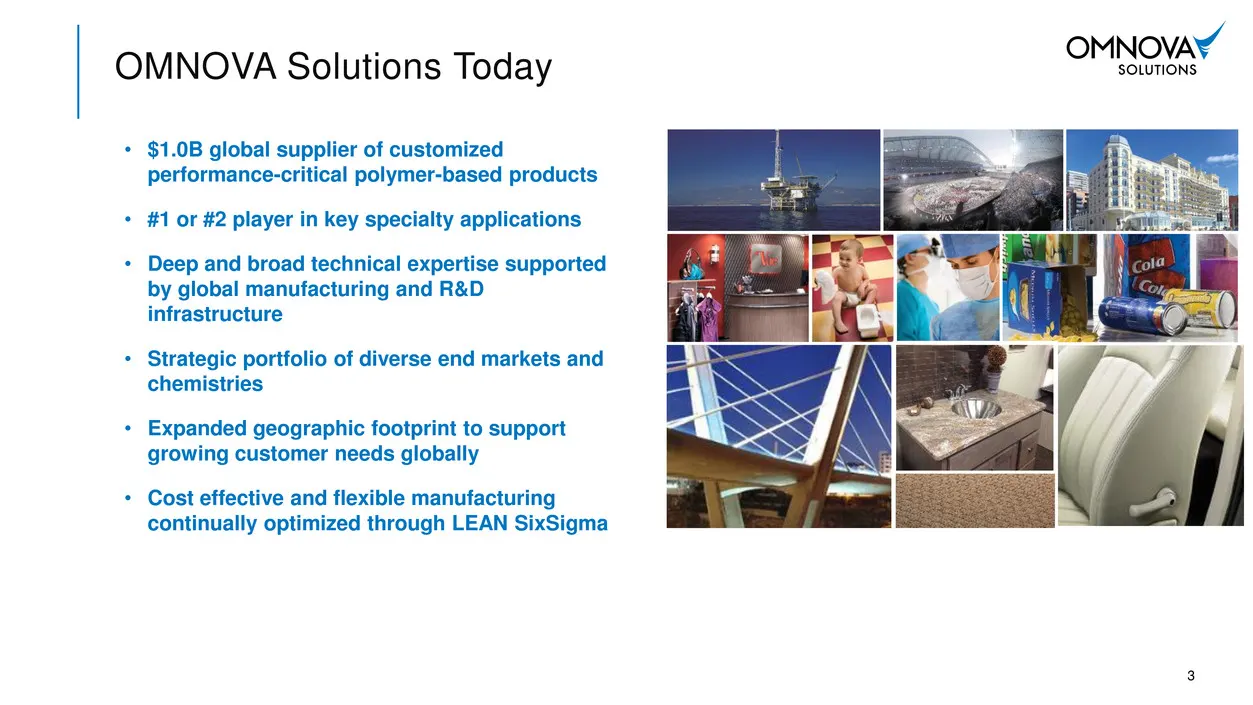
OMNOVA Solutions Today • $1.0B global supplier of customized performance-critical polymer-based products • #1 or #2 player in key specialty applications • Deep and broad technical expertise supported by global manufacturing and R&D infrastructure • Strategic portfolio of diverse end markets and chem
Slide 4: Global Supplier of Performance-Critical Products
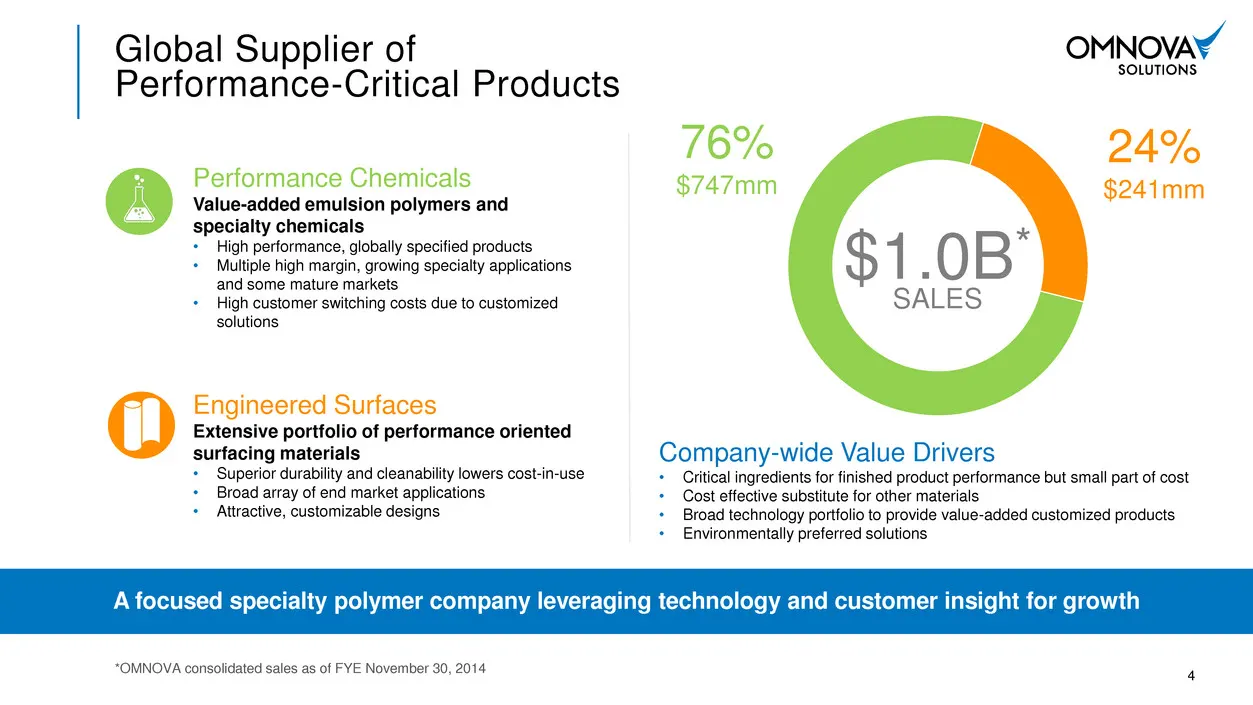
Performance Chemicals Value-added emulsion polymers and specialty chemicals • High performance, globally specified products • Multiple high margin, growing specialty applications and some mature markets • High customer switching costs due to customized solutions A focused specialty polymer company l
Slide 5: Common Technologies and Assets Serve Diverse End Markets
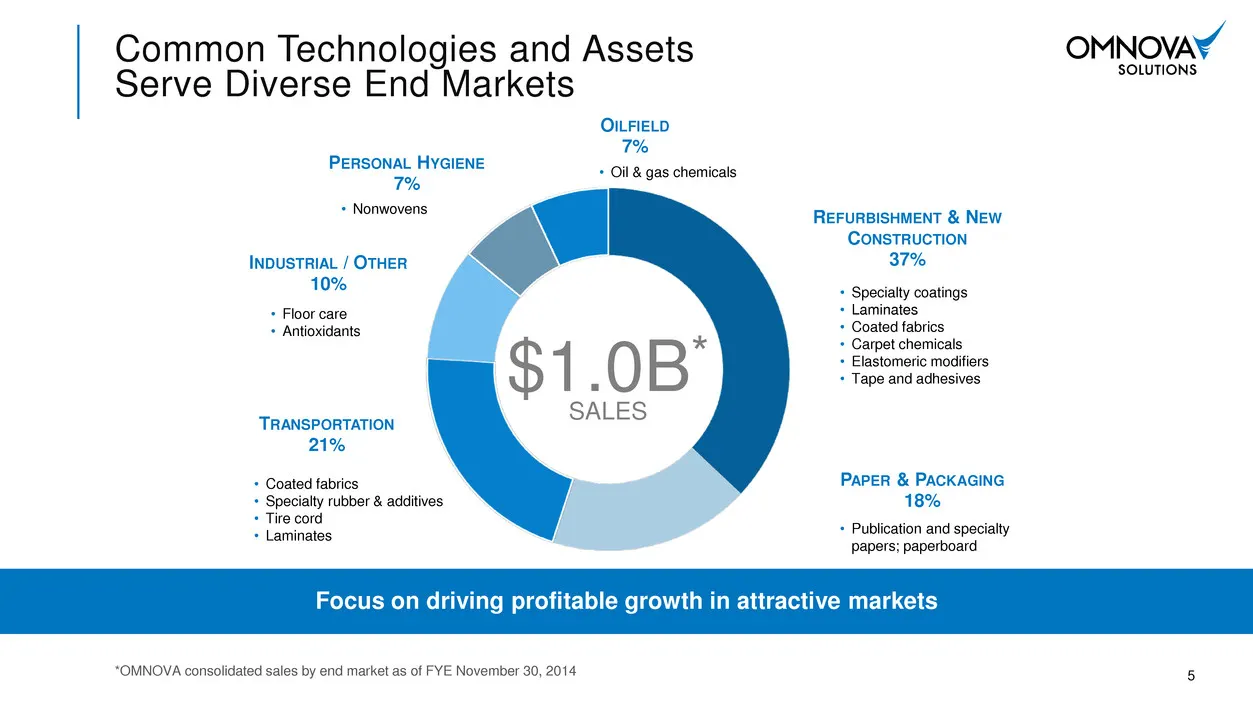
REFURBISHMENT & NEW CONSTRUCTION 37% PAPER & PACKAGING 18% TRANSPORTATION 21% INDUSTRIAL / OTHER 10% PERSONAL HYGIENE 7% OILFIELD 7% Common Technologies and Assets Serve Diverse End Markets Focus on driving profitable growth in attractive markets *OMNOVA consolidated sales by end market as of FYE No
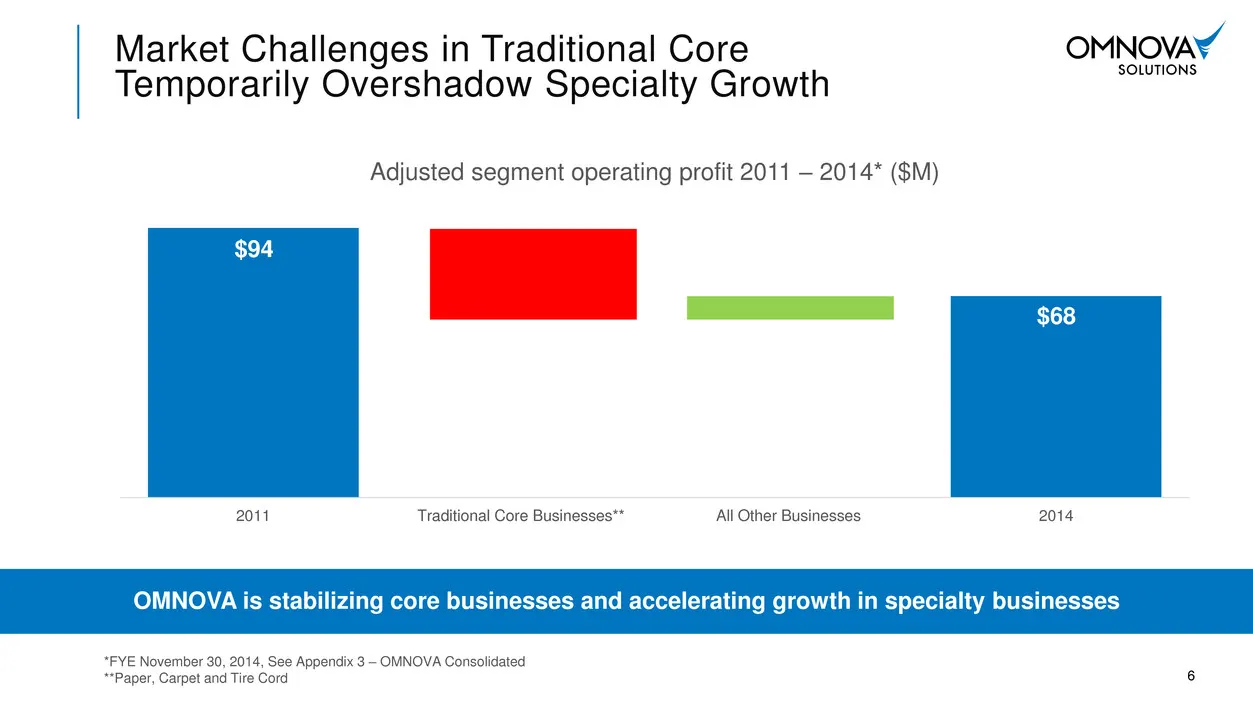
Slide 6: Market Challenges in Traditional Core Temporarily Overshadow Specialty Growth
2011 Traditional Core Businesses** All Other Businesses 2014 Adjusted segment operating profit 2011 – 2014* ($M) $91 6 Market Challenges in Traditional Core Temporarily Overshadow Specialty Growth OMNOVA is stabilizing core businesses and accelerating growth in specialty businesses *FYE November 30,
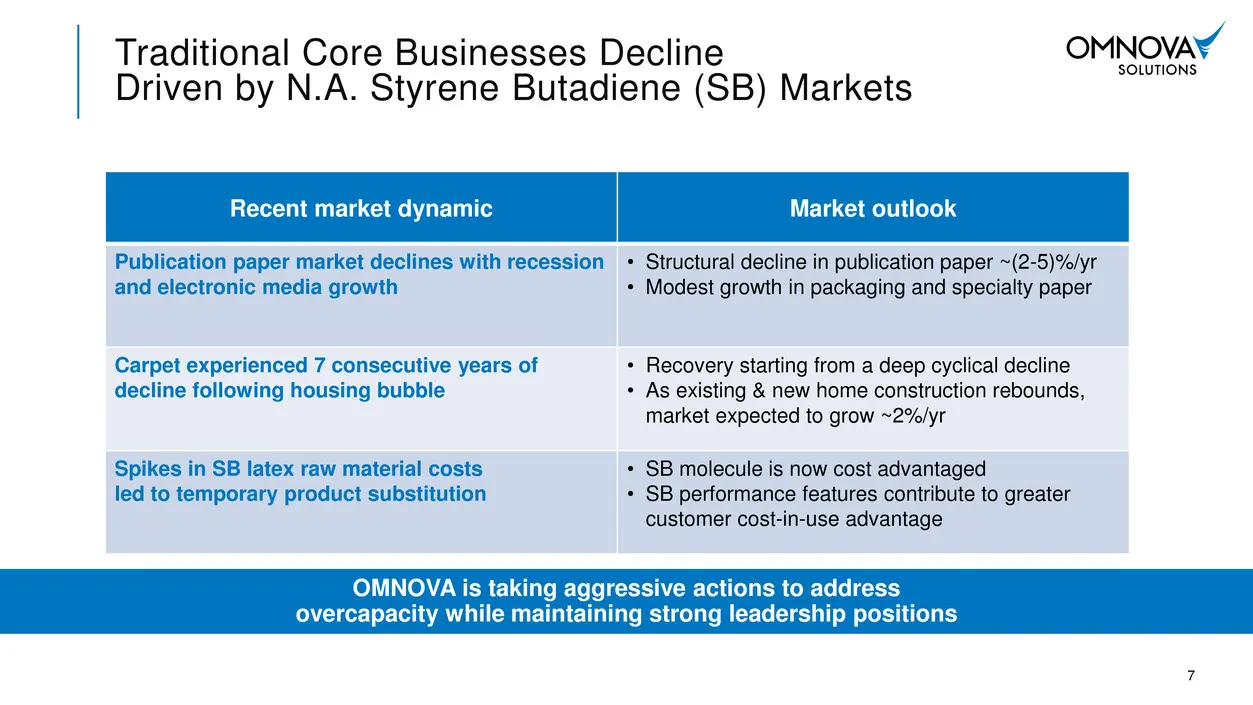
Slide 7: Traditional Core Businesses Decline Driven by N.A. Styrene Butadiene Markets
Recent market dynamic Market outlook Publication paper market declines with recession and electronic media growth • Structural decline in publication paper ~(2-5)%/yr • Modest growth in packaging and specialty paper Carpet experienced 7 consecutive years of decline following housing bubble • Recover
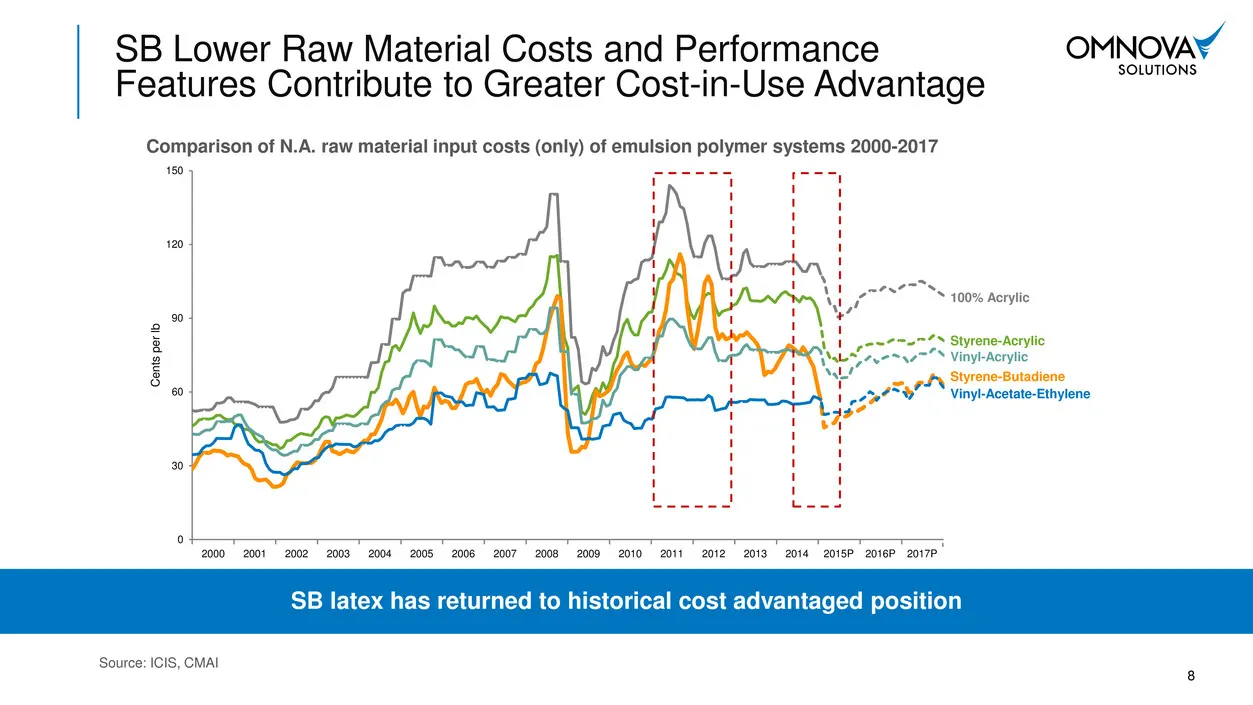
Slide 8: SB Lower Raw Material Costs and Performance Features Contribute to Cost-in-Use Advantage
SB Lower Raw Material Costs and Performance Features Contribute to Greater Cost-in-Use Advantage SB latex has returned to historical cost advantaged position Comparison of N.A. raw material input costs (only) of emulsion polymer systems 2000-2017 Source: ICIS, CMAI 0 30 60 90 120 150 Ce n ts p e r l
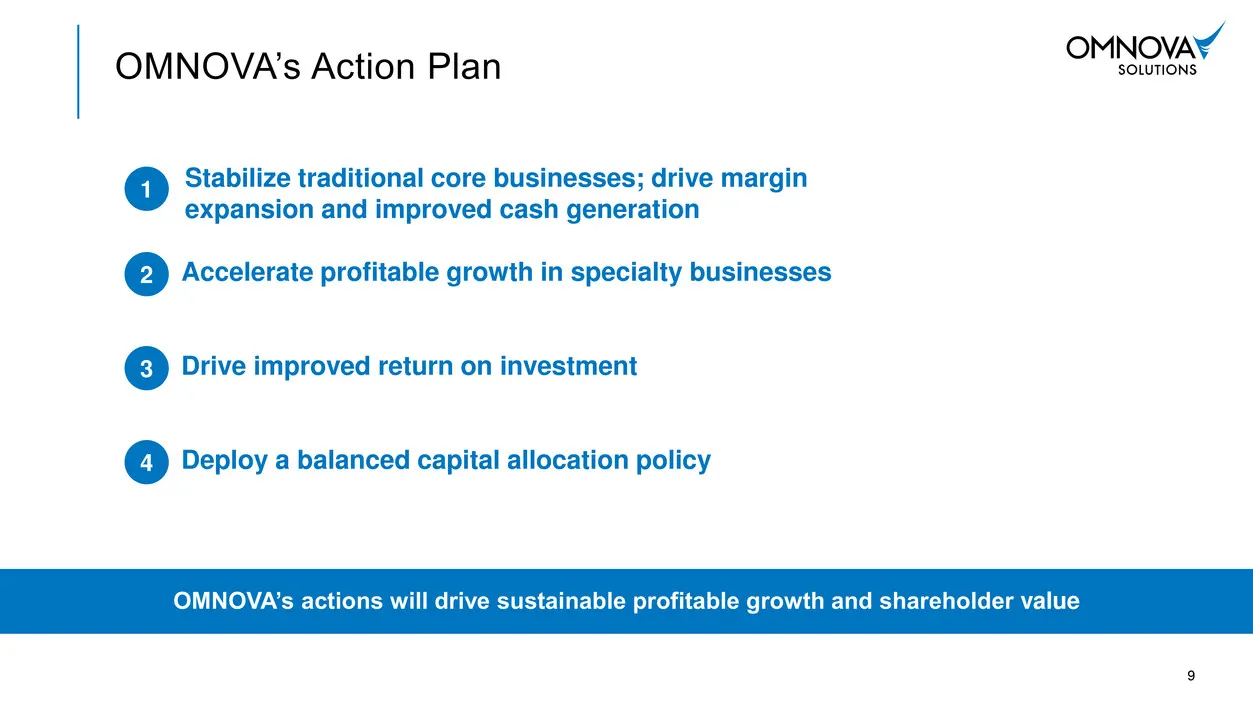
Slide 9: OMNOVA's Action Plan
OMNOVA’s Action Plan OMNOVA’s actions will drive sustainable profitable growth and shareholder value Stabilize traditional core businesses; drive margin expansion and improved cash generation Accelerate profitable growth in specialty businesses Drive improved return on investment Deploy a balanced c
Slide 10: OMNOVA's Action Plan: Focused actions for each business
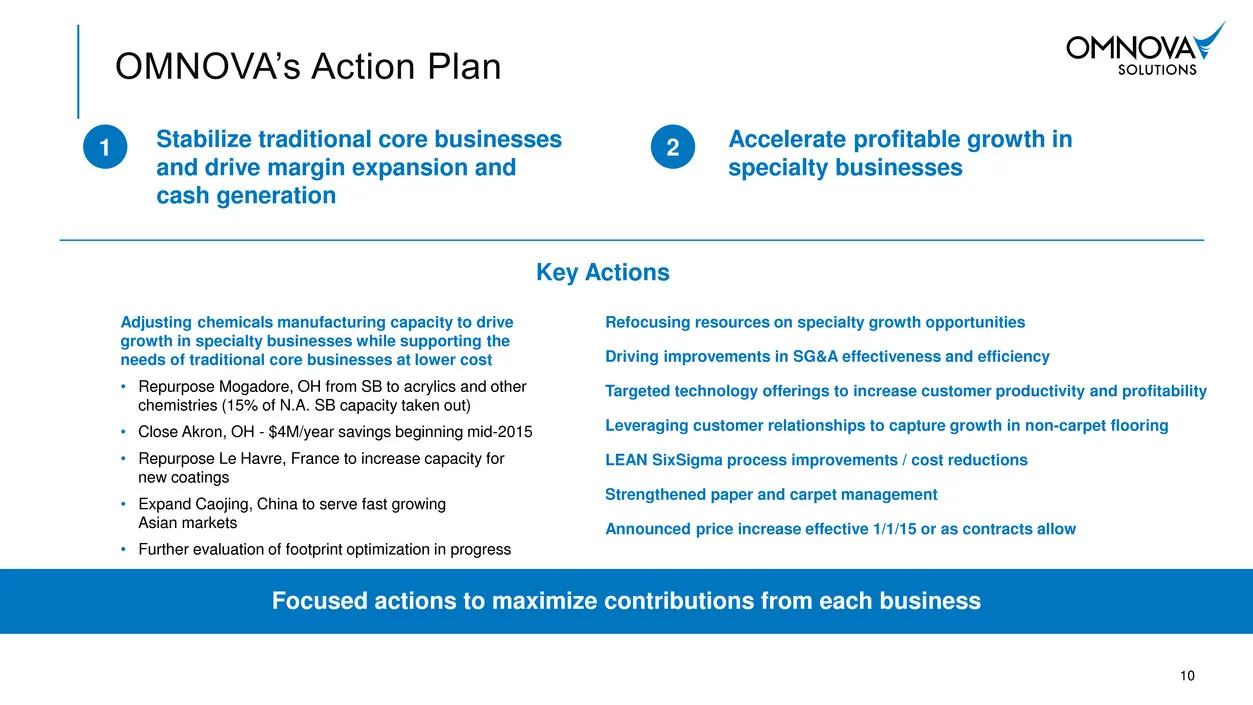
10 OMNOVA’s Action Plan Focused actions to maximize contributions from each business Stabilize traditional core businesses and drive margin expansion and cash generation Accelerate profitable growth in specialty businesses Adjusting chemicals manufacturing capacity to drive growth in specialty busin
Slide 11: Specialty Growth: Targeted Markets
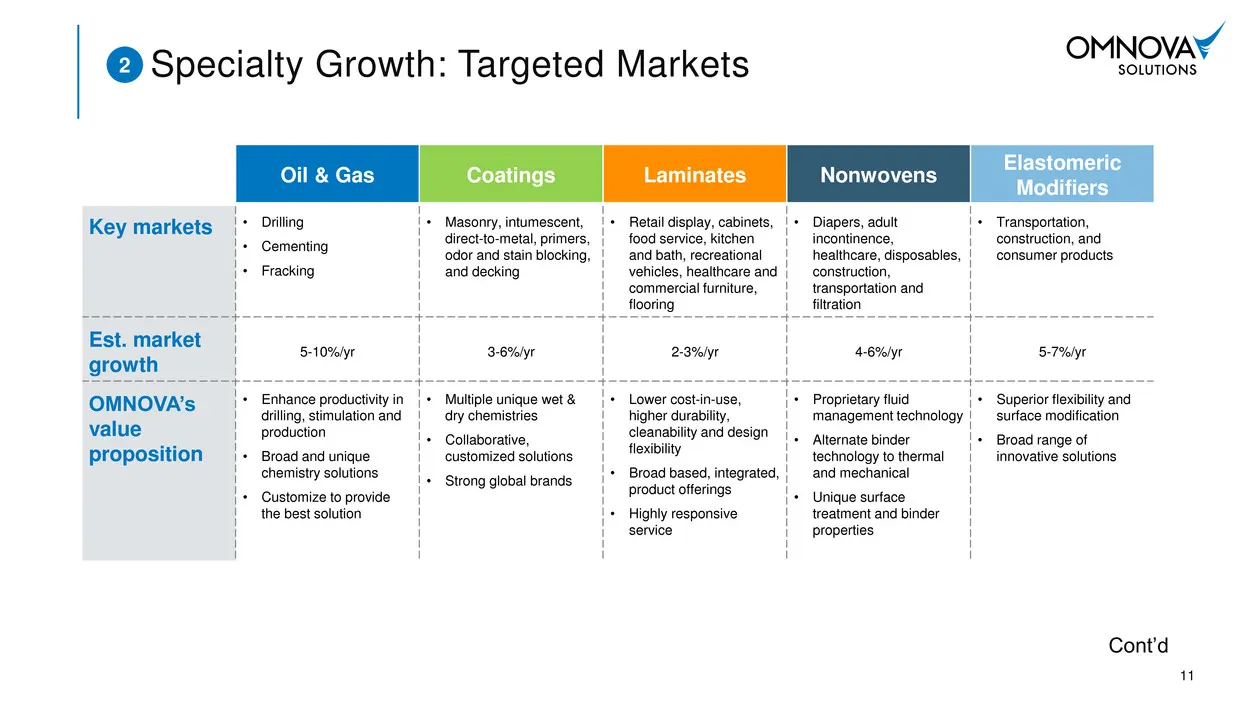
11 Specialty Growth: Targeted Markets Oil & Gas Coatings Laminates Nonwovens Elastomeric Modifiers Key markets • Drilling • Cementing • Fracking • Masonry, intumescent, direct-to-metal, primers, odor and stain blocking, and decking • Retail display, cabinets, food service, kitchen and bath, recreati
Slide 12: Specialty Growth: Targeted Markets, OMNOVA actions
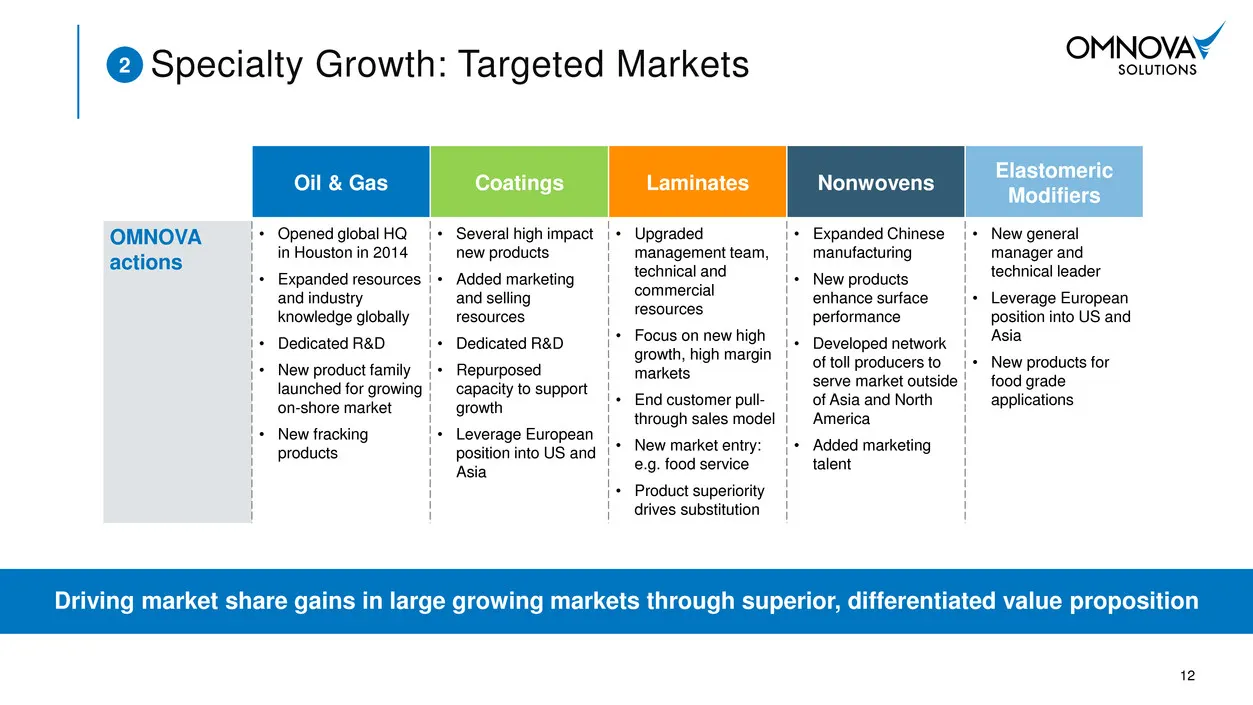
12 Specialty Growth: Targeted Markets Driving market share gains in large growing markets through superior, differentiated value proposition Oil & Gas Coatings Laminates Nonwovens Elastomeric Modifiers OMNOVA actions • Opened global HQ in Houston in 2014 • Expanded resources and industry knowledge g
Slide 13: Specialty Growth: Diversifying Chemistries to Drive Growth and Margins
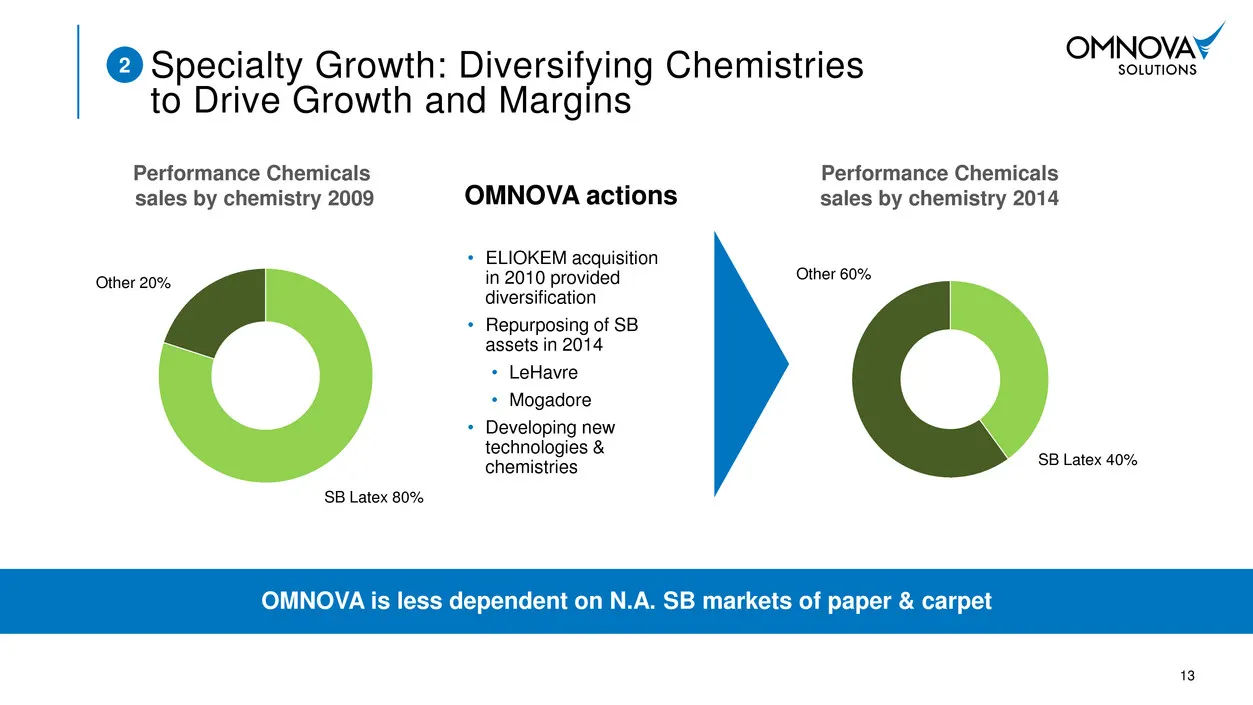
13 Specialty Growth: Diversifying Chemistries to Drive Growth and Margins OMNOVA is less dependent on N.A. SB markets of paper & carpet SB Latex 40% Other 60% Performance Chemicals sales by chemistry 2014 SB Latex 80% Other 20% Performance Chemicals sales by chemistry 2009 OMNOVA actions • ELIOKEM a
Slide 14: Specialty Growth: Global Expansion
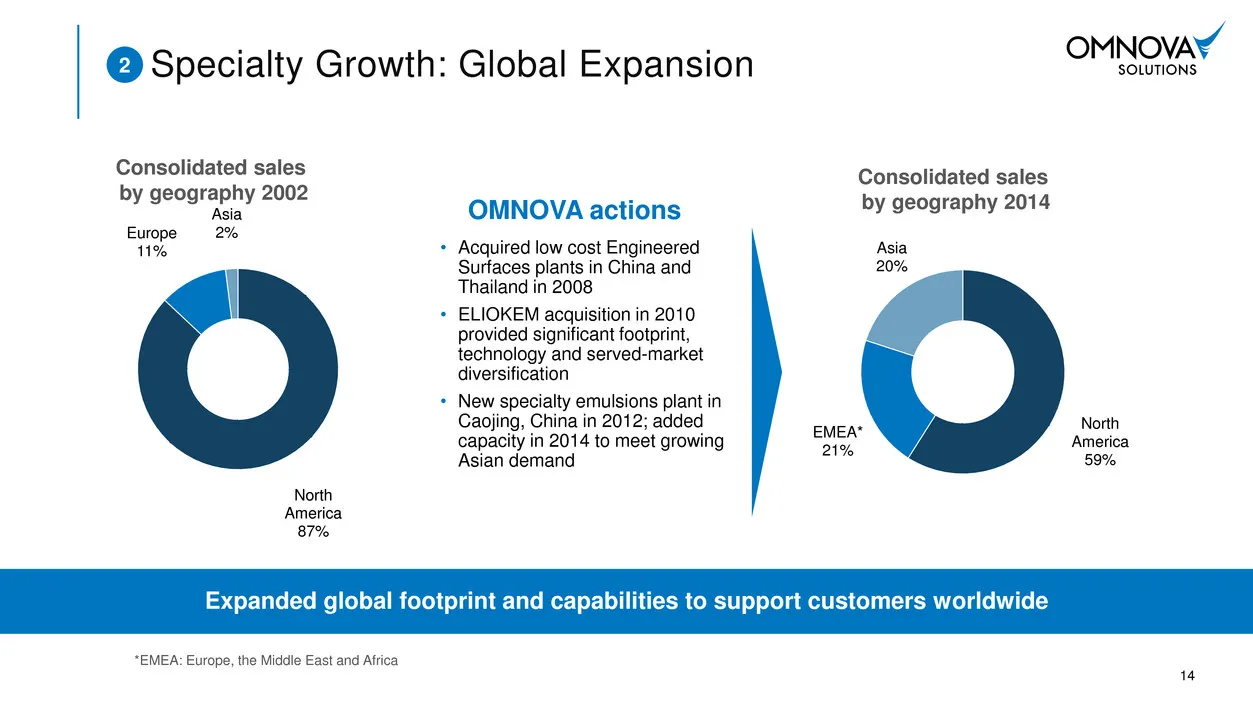
North America 87% Europe 11% Asia 2% North America 59% EMEA* 21% Asia 20% 14 Specialty Growth: Global Expansion Expanded global footprint and capabilities to support customers worldwide Consolidated sales by geography 2014 Consolidated sales by geography 2002 • Acquired low cost Engineered Surfaces
Slide 15: Specialty Growth: Technology and New Product Development
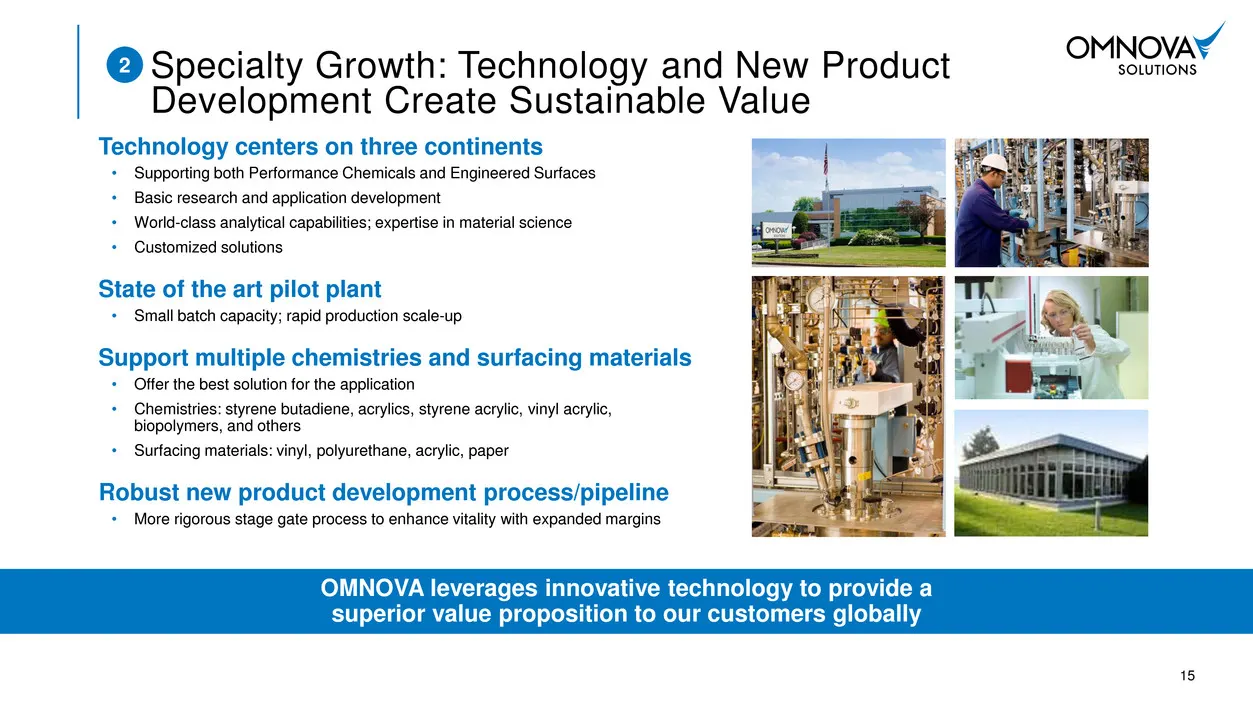
Technology centers on three continents • Supporting both Performance Chemicals and Engineered Surfaces • Basic research and application development • World-class analytical capabilities; expertise in material science • Customized solutions State of the art pilot plant • Small batch capacity; rapid p
Slide 16: Specialty Growth: Commercial Excellence Creates Sustainable Value
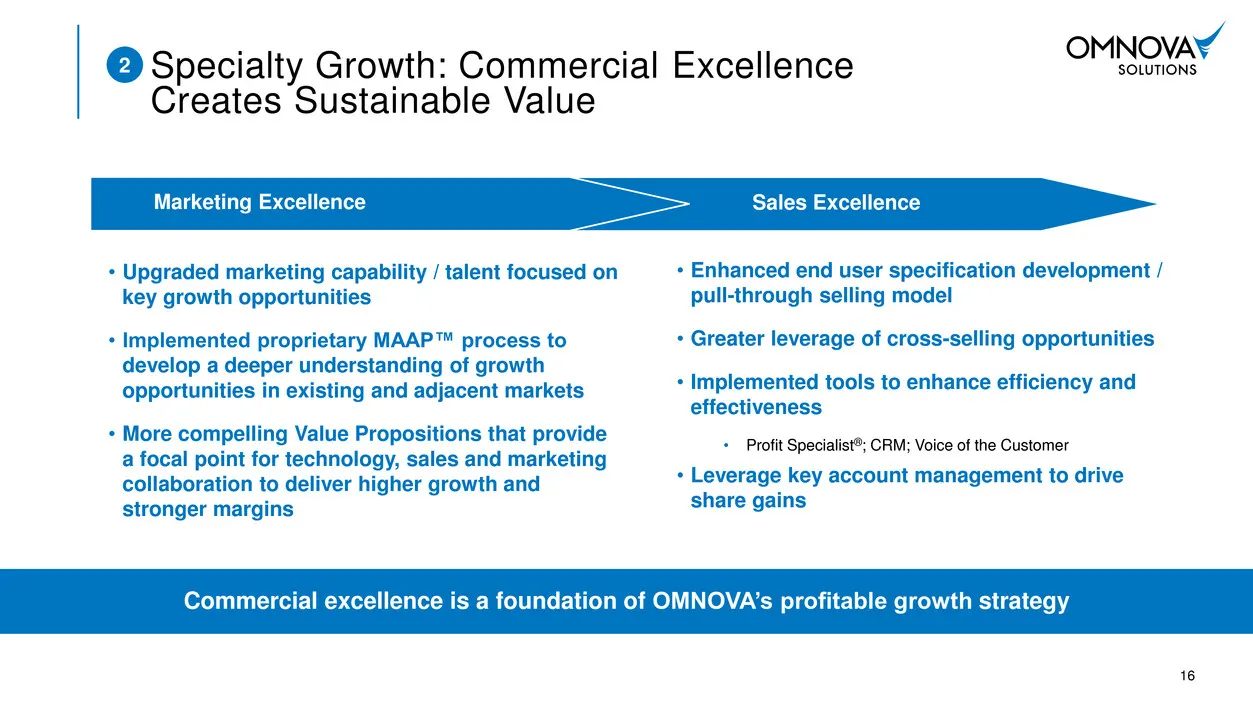
• Upgraded marketing capability / talent focused on key growth opportunities • Implemented proprietary MAAP™ process to develop a deeper understanding of growth opportunities in existing and adjacent markets • More compelling Value Propositions that provide a focal point for technology, sales and ma
Slide 17: Drive Improved Return on Investment
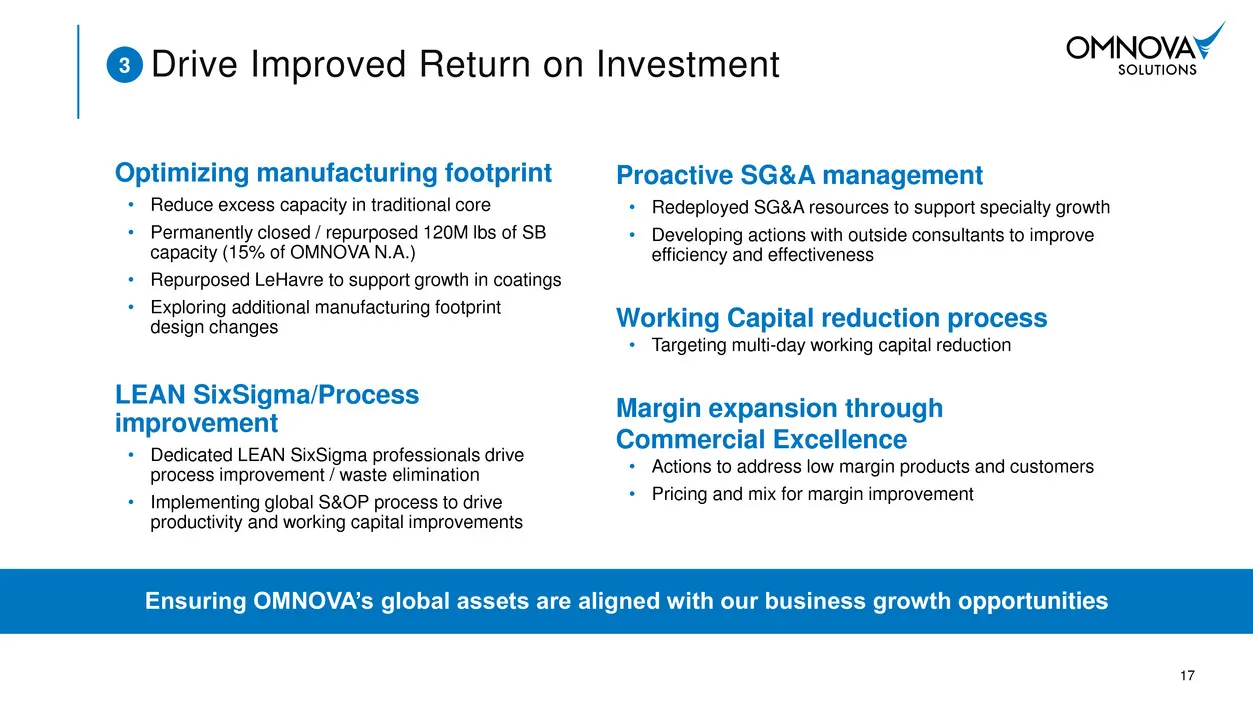
17 Drive Improved Return on Investment Ensuring OMNOVA’s global assets are aligned with our business growth opportunities Optimizing manufacturing footprint • Reduce excess capacity in traditional core • Permanently closed / repurposed 120M lbs of SB capacity (15% of OMNOVA N.A.) • Repurposed LeHavr
Slide 18: Deploy a Balanced Capital Allocation Policy
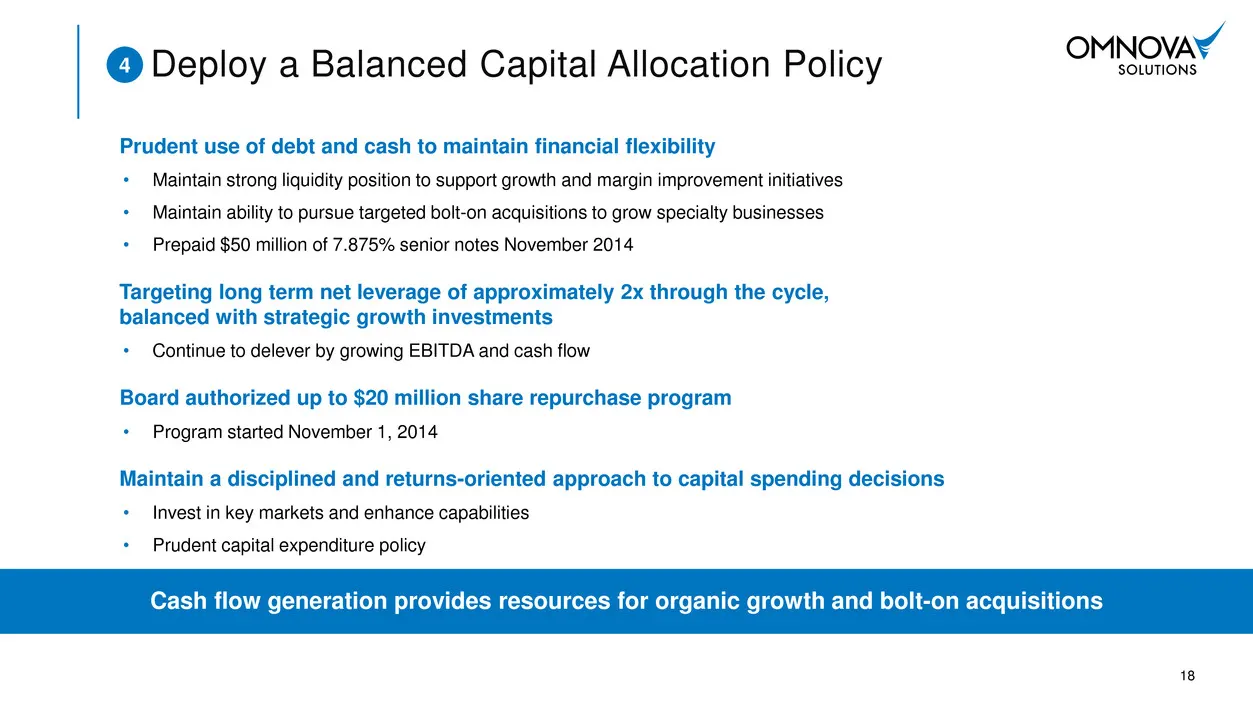
Prudent use of debt and cash to maintain financial flexibility • Maintain strong liquidity position to support growth and margin improvement initiatives • Maintain ability to pursue targeted bolt-on acquisitions to grow specialty businesses • Prepaid $50 million of 7.875% senior notes November 2014
Slide 19: History of Taking Decisive Action
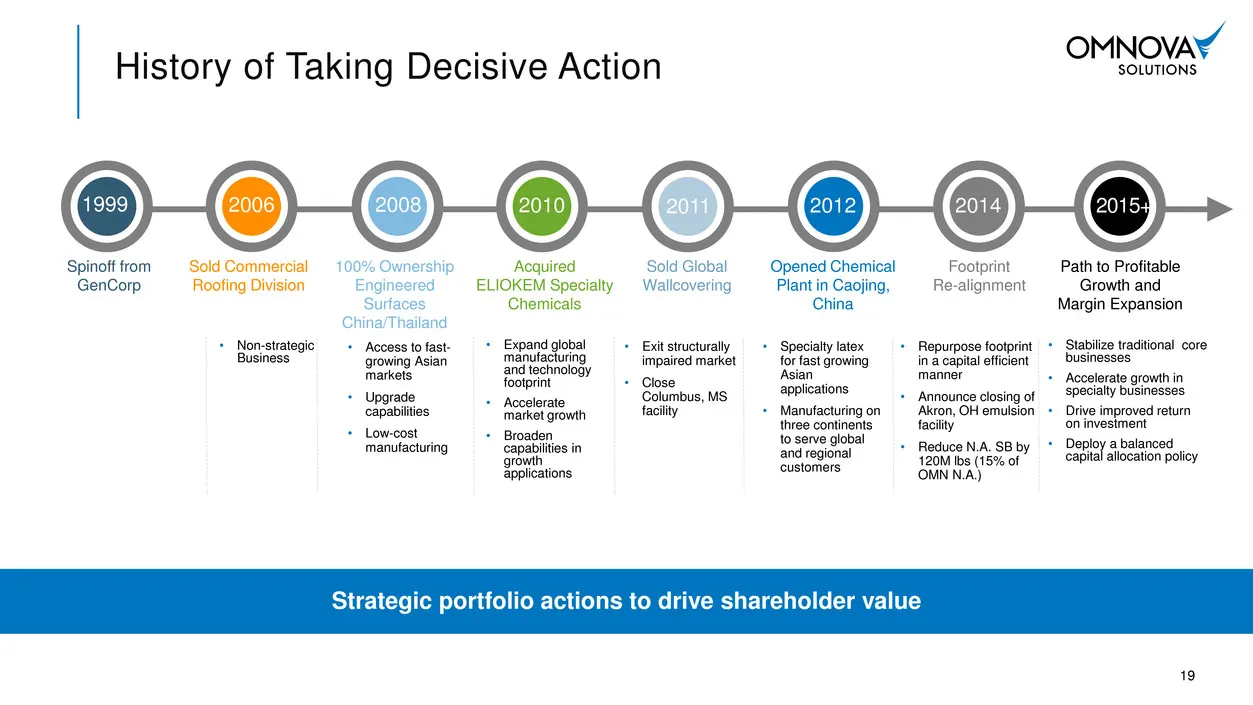
Strategic portfolio actions to drive shareholder value History of Taking Decisive Action • Access to fast- growing Asian markets • Upgrade capabilities • Low-cost manufacturing • Expand global manufacturing and technology footprint • Accelerate market growth • Broaden capabilities in growth applicat
Slide 20: Engineered Surfaces transformation provides model for Performance Chemicals
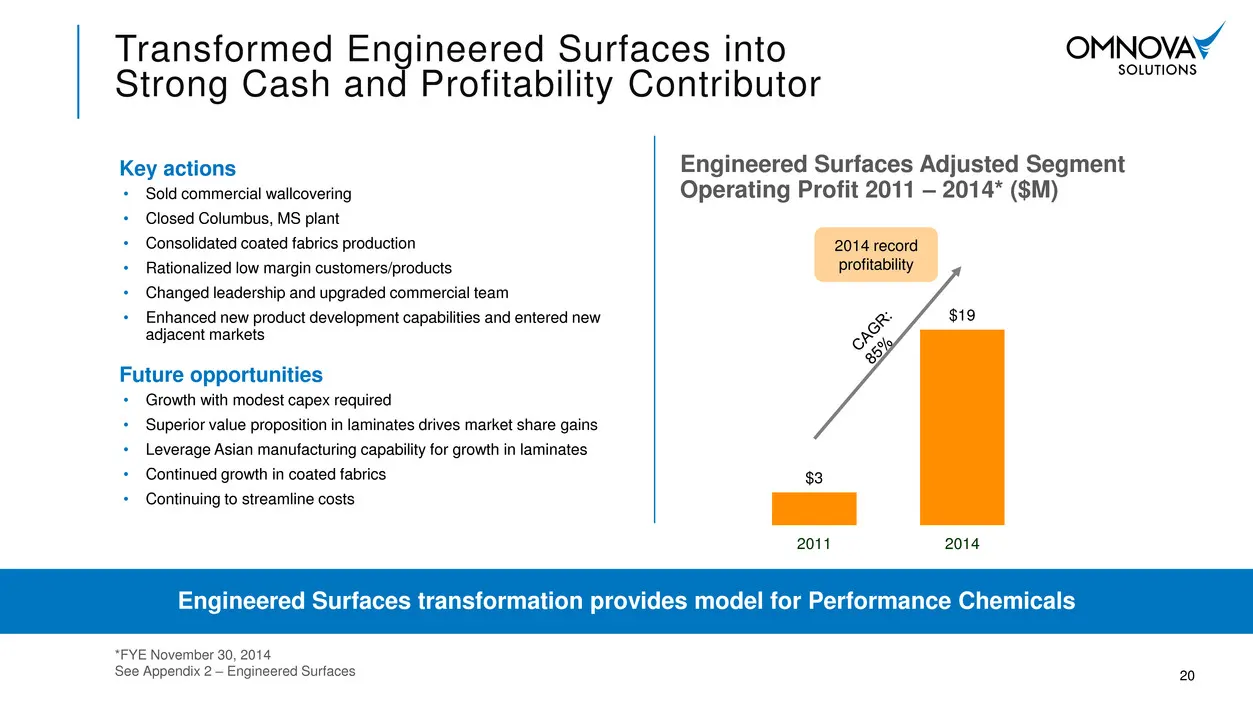
$3 $19 2011 2014 Key actions • Sold commercial wallcovering • Closed Columbus, MS plant • Consolidated coated fabrics production • Rationalized low margin customers/products • Changed leadership and upgraded commercial team • Enhanced new product development capabilities and entered new adjacent mar
Slide 21: Well Positioned to Achieve Long-Term Financial Targets
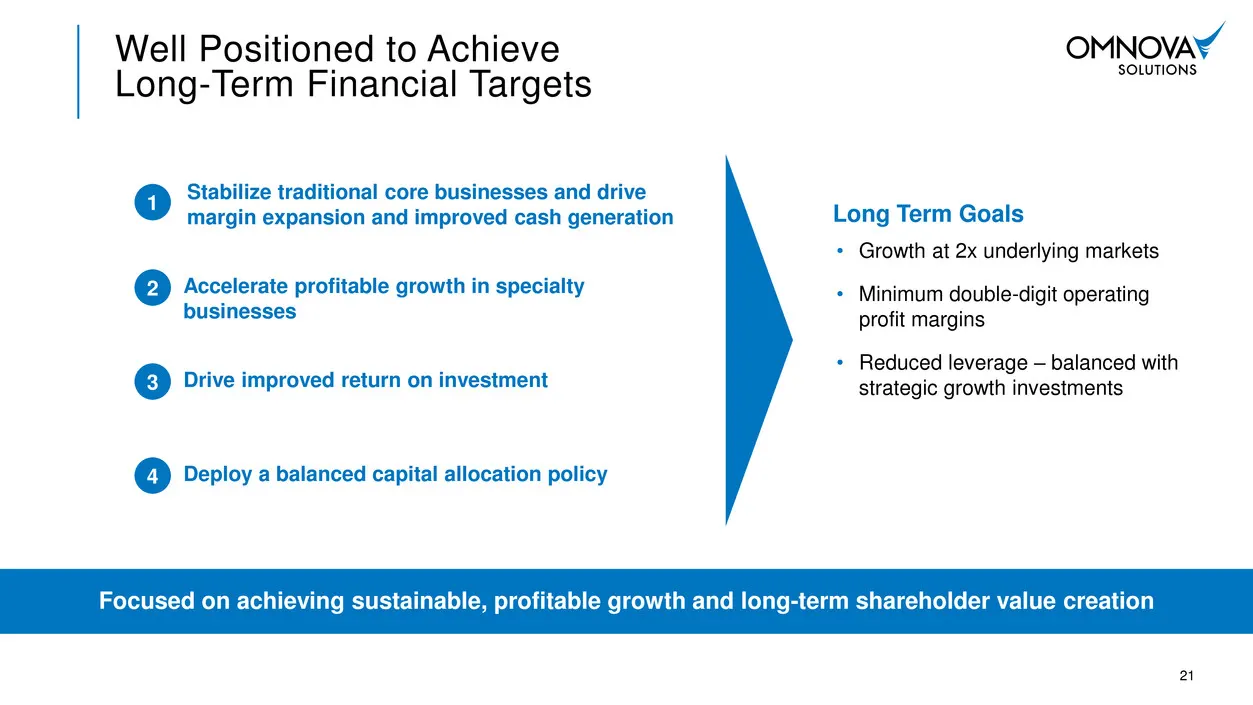
Focused on achieving sustainable, profitable growth and long-term shareholder value creation Well Positioned to Achieve Long-Term Financial Targets Long Term Goals • Growth at 2x underlying markets • Minimum double-digit operating profit margins • Reduced leverage – balanced with strategic growth in
Slide 22: OMNOVA Solutions
OMNOVAY SOLUTIONS
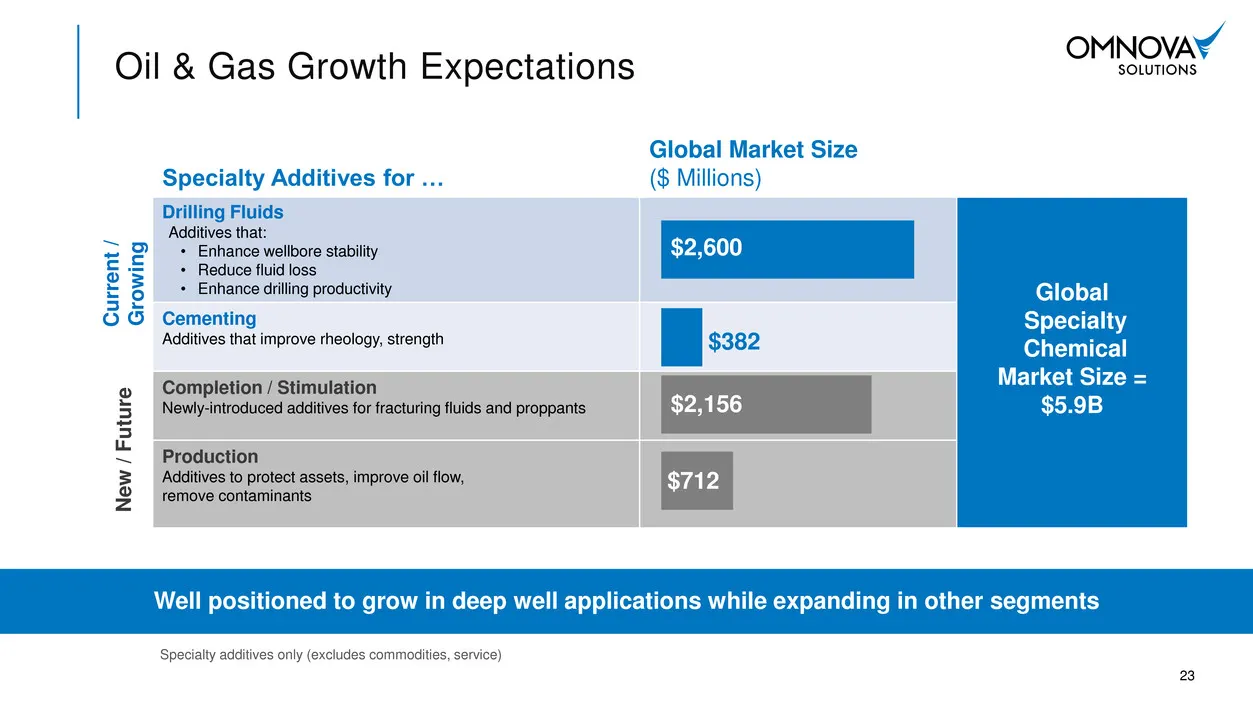
Slide 23: Oil & Gas Growth Expectations
Well positioned to grow in deep well applications while expanding in other segments Oil & Gas Growth Expectations Specialty additives only (excludes commodities, service) Specialty Additives for … Global Market Size ($ Millions) Current / G ro w in g Drilling Fluids Additives that: • Enhance wellbor
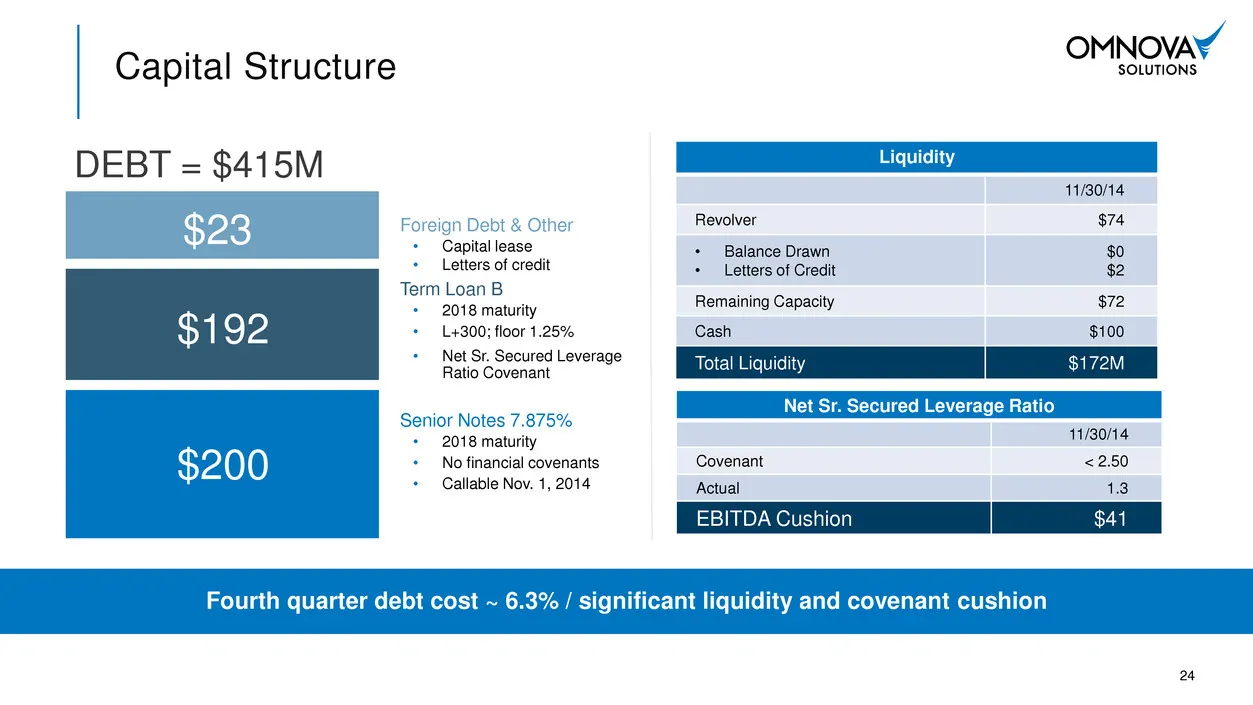
Slide 24: Liquidity and Capital Structure
Liquidity 11/30/14 Revolver $74 • Balance Drawn • Letters of Credit $0 $2 Remaining Capacity $72 Cash $100 Total Liquidity $172M Capital Structure Fourth quarter debt cost ~ 6.3% / significant liquidity and covenant cushion Net Sr. Secured Leverage Ratio 11/30/14 Covenant < 2.50 Actual 1.3 EBITDA Cu
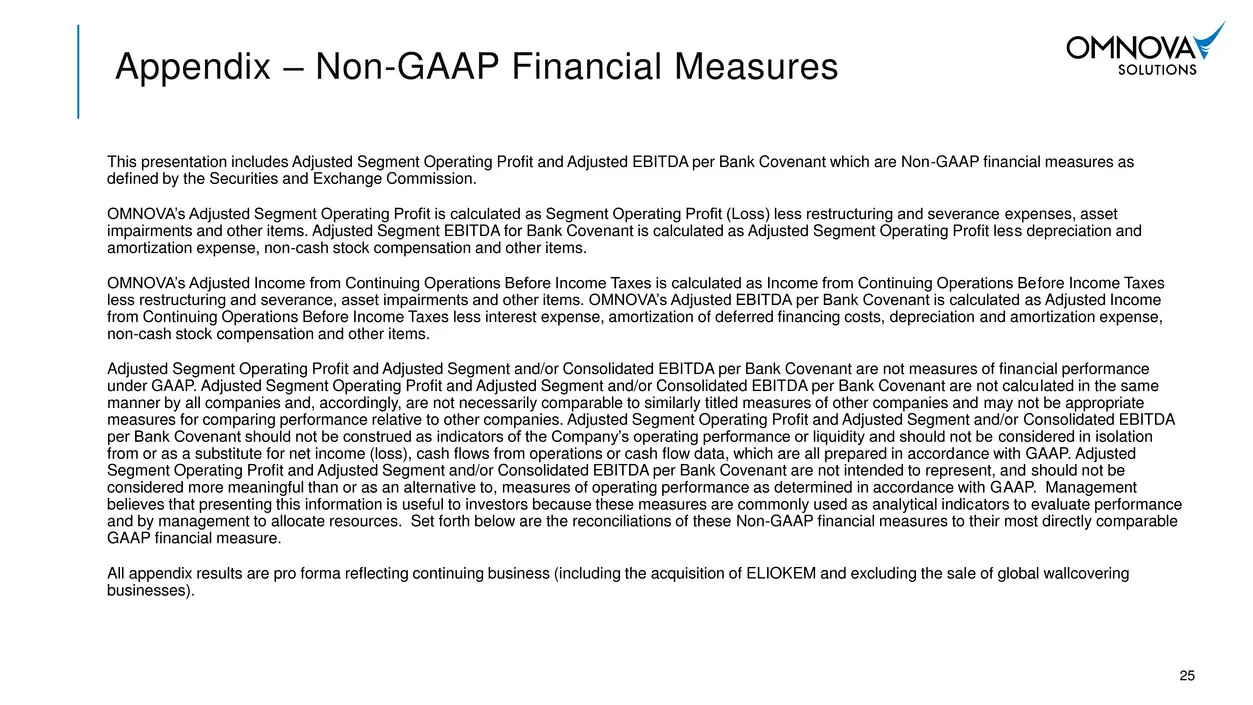
Slide 25: Non-GAAP Financial Measures
This presentation includes Adjusted Segment Operating Profit and Adjusted EBITDA per Bank Covenant which are Non-GAAP financial measures as defined by the Securities and Exchange Commission. OMNOVA’s Adjusted Segment Operating Profit is calculated as Segment Operating Profit (Loss) less restructurin
Slide 26: Appendix – Performance Chemicals
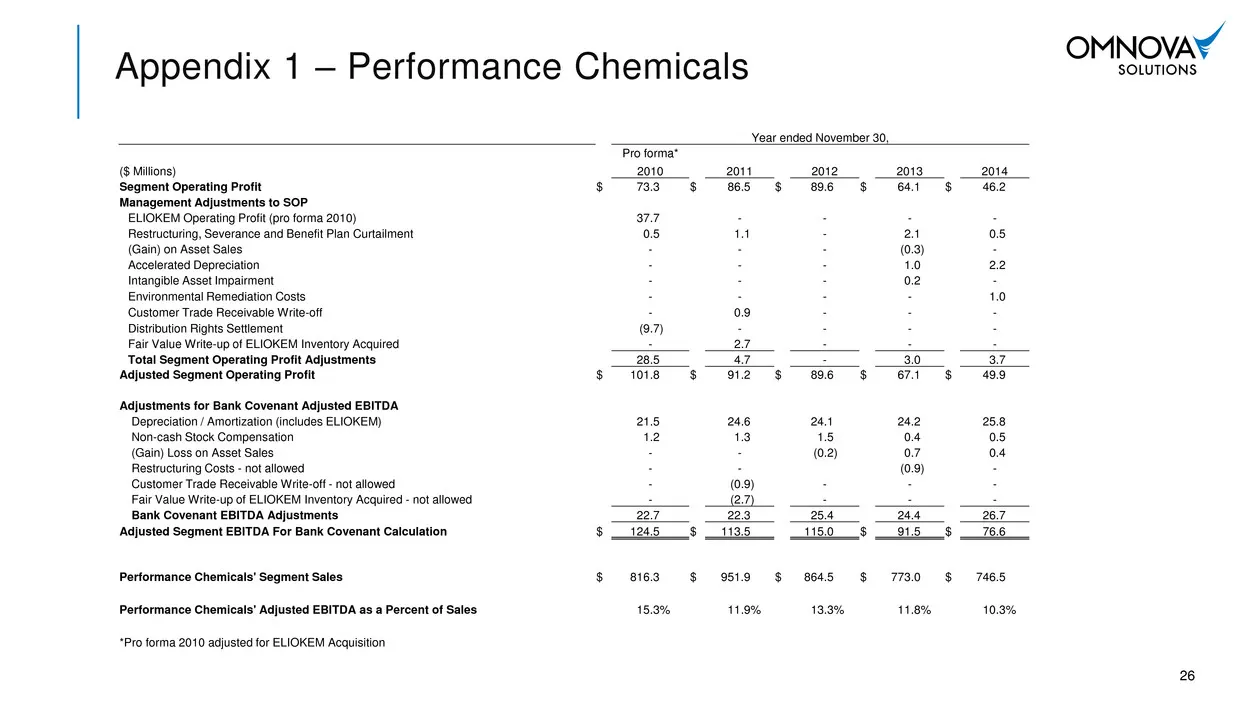
Appendix 1 – Performance Chemicals 26 Year ended November 30, Pro forma* ($ Millions) 2010 2011 2012 2013 2014 Segment Operating Profit $ 73.3 $ 86.5 $ 89.6 $ 64.1 $ 46.2 Management Adjustments to SOP ELIOKEM Operating Profit (pro forma 2010) 37.7 - - - - Restructuring, Severance and Benefit Plan Cu
Slide 27: Appendix – Engineered Surfaces
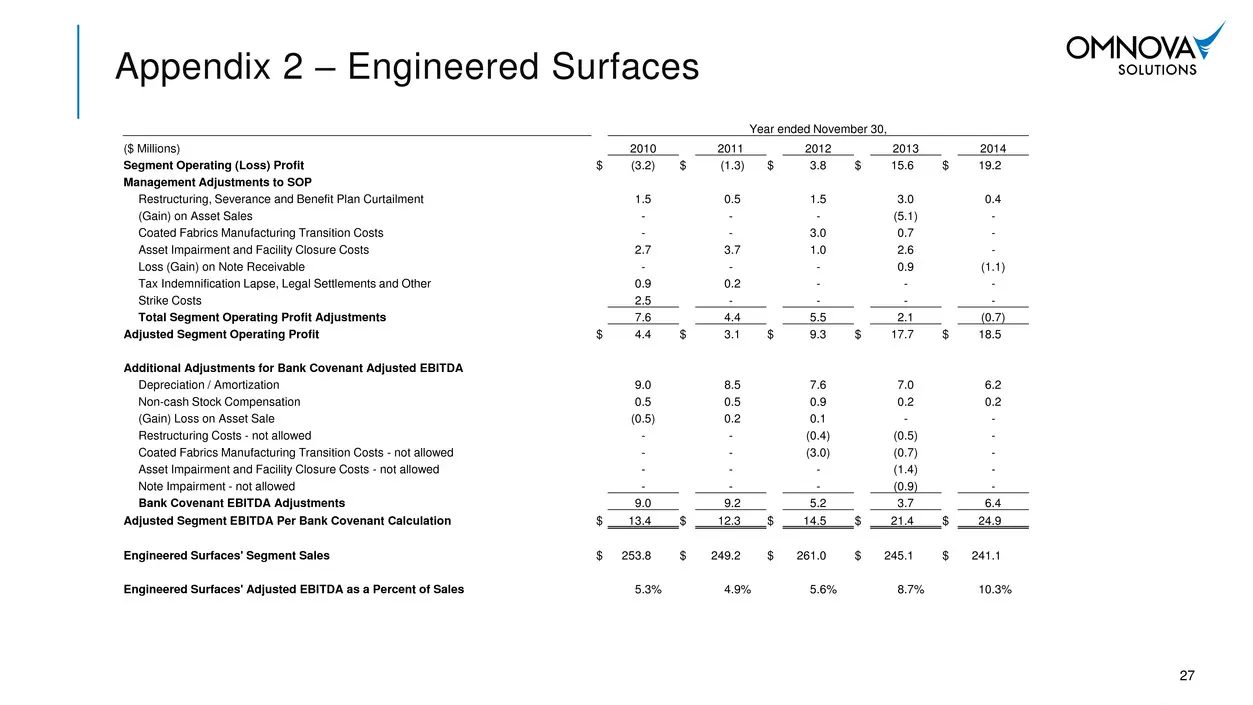
Appendix 2 – Engineered Surfaces 27 Year ended November 30, ($ Millions) 2010 2011 2012 2013 2014 Segment Operating (Loss) Profit $ (3.2) $ (1.3) $ 3.8 $ 15.6 $ 19.2 Management Adjustments to SOP Restructuring, Severance and Benefit Plan Curtailment 1.5 0.5 1.5 3.0 0.4 (Gain) on Asset Sales - - - (5
Slide 28: Appendix – OMNOVA Consolidated
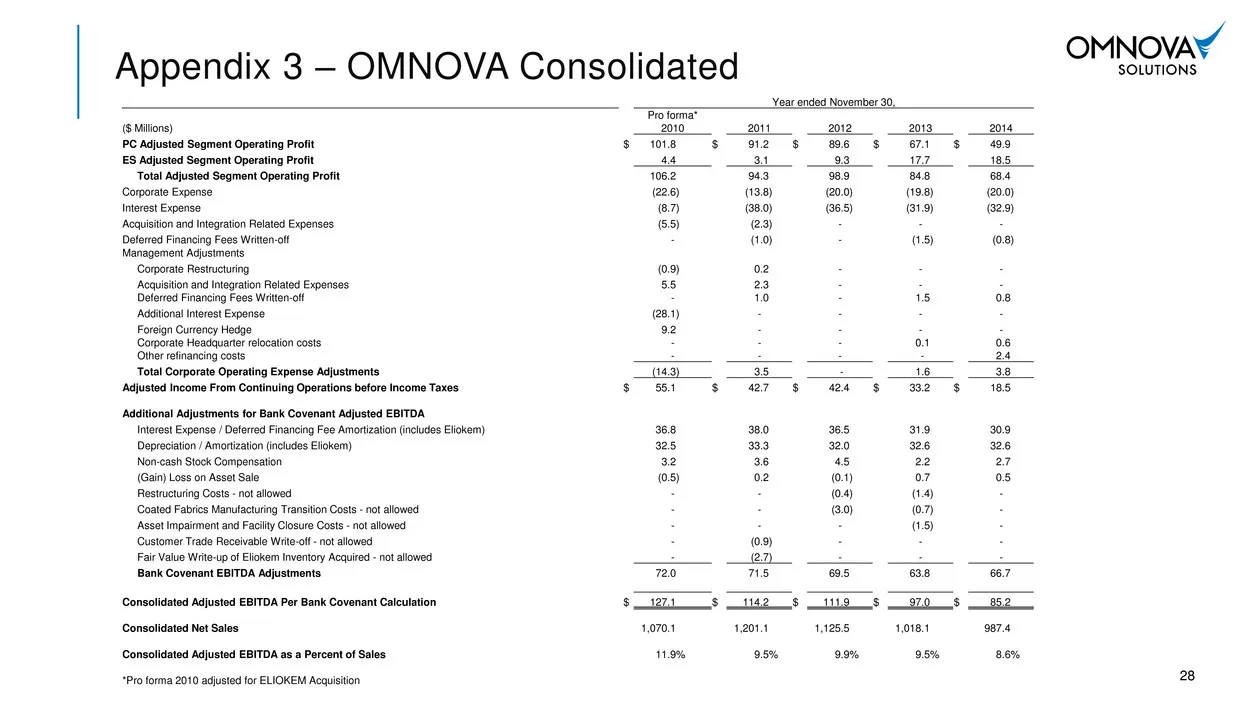
Appendix 3 – OMNOVA Consolidated 28 Year ended November 30, Pro forma* ($ Millions) 2010 2011 2012 2013 2014 PC Adjusted Segment Operating Profit $ 101.8 $ 91.2 $ 89.6 $ 67.1 $ 49.9 ES Adjusted Segment Operating Profit 4.4 3.1 9.3 17.7 18.5 Total Adjusted Segment Operating Profit 106.2 94.3 98.9 84.
Slide 29: OMNOVA Solutions
OMNOVAY SOLUTIONS
Source: SEC EDGAR · 8-K filed Feb 23, 2015
More decks from OMNOVA Solutions Inc
 Merger or Acquisition (July 2019)24 slides · Jul 3, 2019
 Q1 2019 Earnings Presentation32 slides · Mar 27, 2019
 Investor Presentation (February 2019)34 slides · Feb 22, 2019
 Q3 2018 Earnings Presentation32 slides · Sep 26, 2018
 Investor Presentation (July 2018)32 slides · Jul 20, 2018
 Investor Presentation (April 2018)32 slides · Apr 11, 2018