National Financial Partners Corp
National Financial Partners — UBS 2008 Global Financial Services Conference
27 slides from National Financial Partners's conference presentation, May 13, 2008

Slide 1: UBS 2008 Global Financial Services Conference
UBS 2008 Global Financial Services Conference May 13 , 2008 Exhibit 99.1 th

Slide 2: Related to Forward-Looking Statements
RELATED TO FORWARD-LOOKING STATEMENTS Certain items in this presentation and in today’s discussion, including matters relating to revenue, net income, Cash earnings and Cash earnings per diluted share (both including and excluding management agreement buyout, net of tax), acquisitions, capital struc

Slide 3: Related to Non-GAAP Financial Information
RELATED TO NON-GAAP FINANCIAL INFORMATION The historical and forward-looking financial information in this presentation includes non-GAAP performance measures called Cash earnings and Cash earnings per diluted share (both including and excluding management agreement buyout, net of tax). The Company

Slide 4: Reconciliation: Net Income to Cash Earnings
RECONCILIATION NET INCOME TO CASH EARNINGS Note: The sum of the per-share components of Cash EPS may not agree with Cash EPS due to rounding. (dollars in thousands, except per share data) GAAP Net income $10,005 $8,493 $54,232 $57,578 $56,182 $40,142 $23,501 Amortization of intangibles 9,751 8,006 3

Slide 5: Independent Financial Services Distributor: Agenda
• Background • First Quarter 2008 Performance • Acquisition Strategy • Growth Markets • Unlike Typical Consolidator • Historical Performance • Long-term Execution INDEPENDENT FINANCIAL SERVICES DISTRIBUTOR

Slide 6: Independent Financial Services Distributor
• National network of independent financial advisors consisting of over 180 owned firms • Specialize in providing best-of-class financial services products to high net worth and corporate markets: Life insurance & wealth transfer Corporate & executive benefits Financial planning & investment advisor
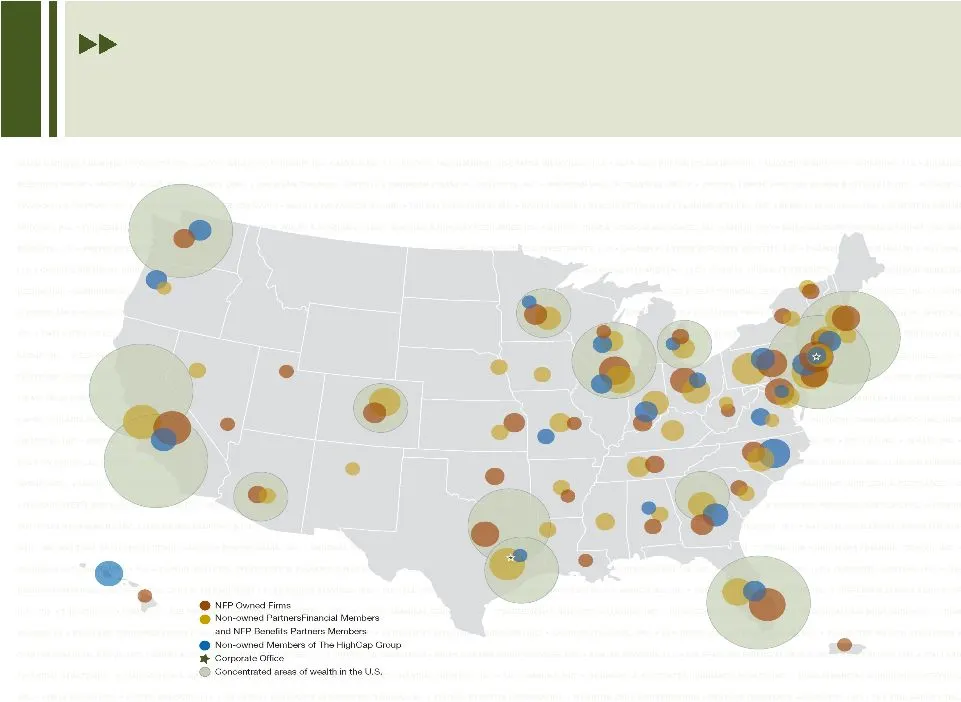
Slide 7: Leader in Distribution: Our Footprint
LEADER IN DISTRIBUTION: OUR FOOTPRINT

Slide 8: First Quarter 2008: Strong Growth
FIRST QUARTER 2008: STRONG GROWTH Long-term Trends Remain Solid 5.9% same store revenue growth 17.3% revenue growth 22.2% gross margin growth 15.1% cash EPS Growth Generally a positive long-term environment Toward the end of quarter, broad economic and credit market conditions impacted portion of bu
Slide 9: Valuation of Acquisitions: Focus on Earnings
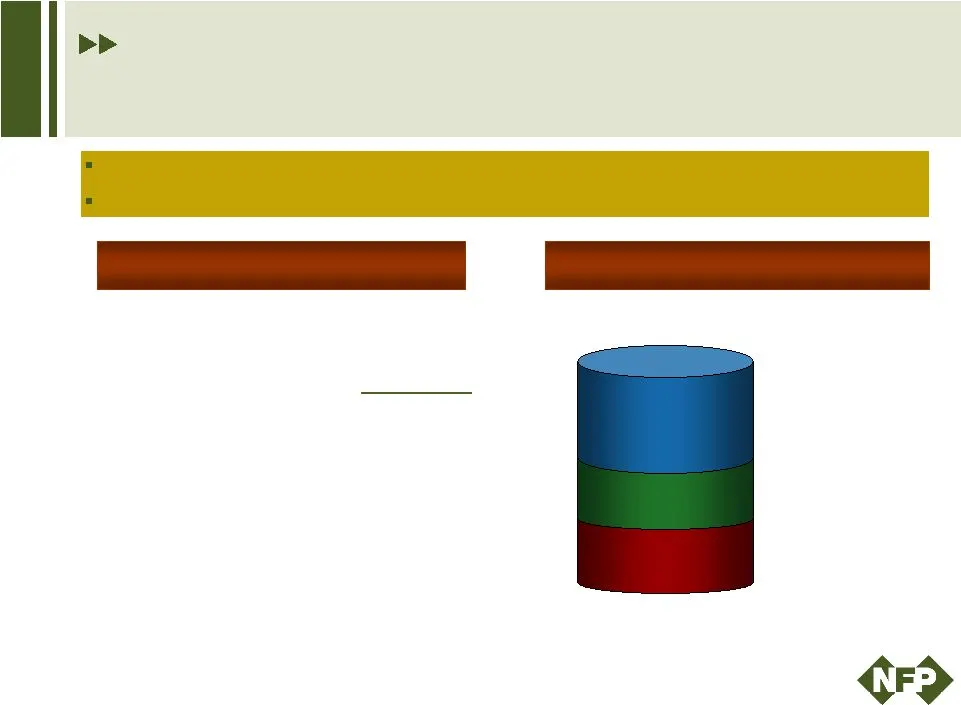
Typical Acquisition Earnings Split Subsequent to Acquisition Split between Principal & NFP NFP’s Portion Principal’s Portion Total revenue $ 4,000,000 Operating expenses $ (2,000,000) Target Earnings $ 2,000,000 Margin 50% Percent of earnings capitalized 50% Base Earnings $ 1,000,000 Initial acquisi
Slide 10
Slide 11: Acquisitions: Strong Track Record
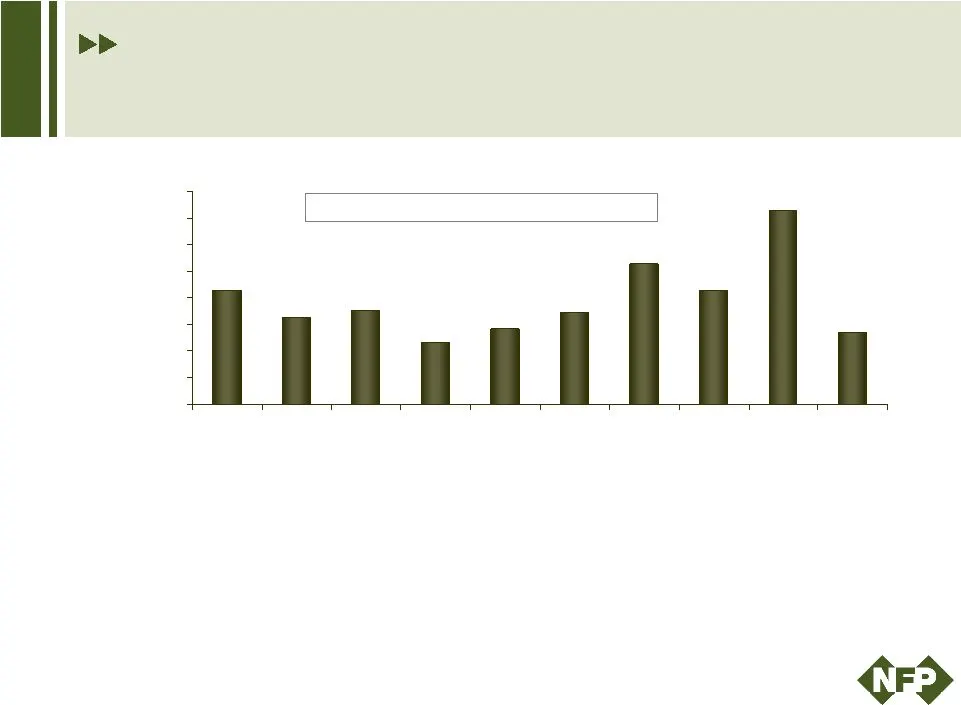
ACQUISITIONS: STRONG TRACK RECORD $13.4 $36.3 $21.4 $26.3 $21.3 $16.4 $17.6 $11.6 $14.2 $17.3 $0.0 $5.0 $10.0 $15.0 $20.0 $25.0 $30.0 $35.0 $40.0 YTD Notes: Reflects gross base earnings acquired for each period and does not reflect restructurings and/or dispositions. 2007 base earnings includes $3.2

Slide 12: Acquisition Incentives: Create Long-Term Alignment
Initial Earnout Principals are typically paid a multiple of base earnings if the 3-year average growth rate of target earnings is above 10% Earnout payment is capitalized as part of the purchase price Ongoing Incentive Plan Typically pays an increasing proportion of NFP’s share of earnings based on

Slide 13: Acquisition Model: Creates Long-Term Alignment
• For those committed to growing business • Selling only a portion of the economic interest • Motivation to grow earnings of business Lucrative incentives Grow value of management contract for second stage capitalization Typically, 30% of consideration in NFP’s stock, subject to 5-year lock-up • NFP

Slide 14: Growth Markets: Key Products & Characteristics
• Life Insurance & Wealth Transfer: Strong Demographics Fixed & Variable Life Fixed & Variable Annuities Life Settlements • Corporate & Executive Benefits: Underserved Market Group Medical Disability Group Life, Disability, Dental, LTC Retirement Services Voluntary Benefits Executive Benefits, BOLI/
Slide 15: Growth Markets: First Quarter 2008 Business Mix
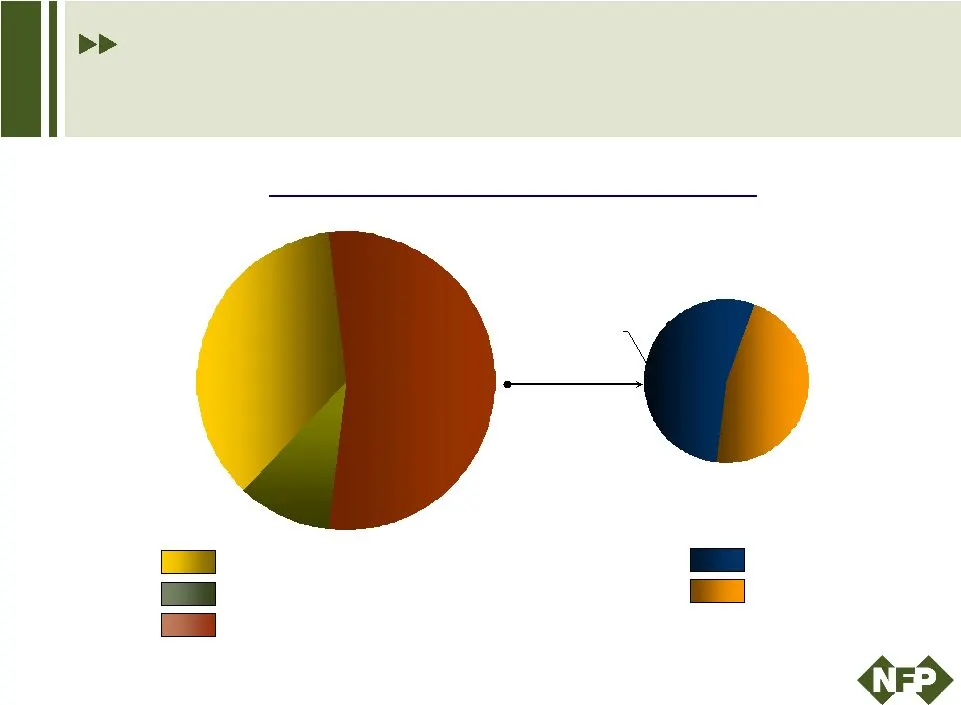
GROWTH MARKETS: FIRST QUARTER 2008 BUSINESS MIX 10% 36% 29% 54% 25% Life Insurance & Wealth Transfer Corporate & Executive Benefits Fee-Based Planning & Investment Advisory Life Brokerage Retail Life Pie chart represents percentage of Q1 2008 business of acquired firms and excludes NFP’s Austin-base

Slide 16: Unlike Typical Consolidator: Helping Firms Grow Earnings
UNLIKE TYPICAL CONSOLIDATOR: HELPING FIRMS GROW EARNINGS • Access to multiple carriers • Underwriting resources • Leadership in product design • Diversification • Differentiation from other independents • Compliance and infrastructure Life Insurance: Growth Enablers

Slide 17: Benefits Firms: Increased Opportunity with NFP
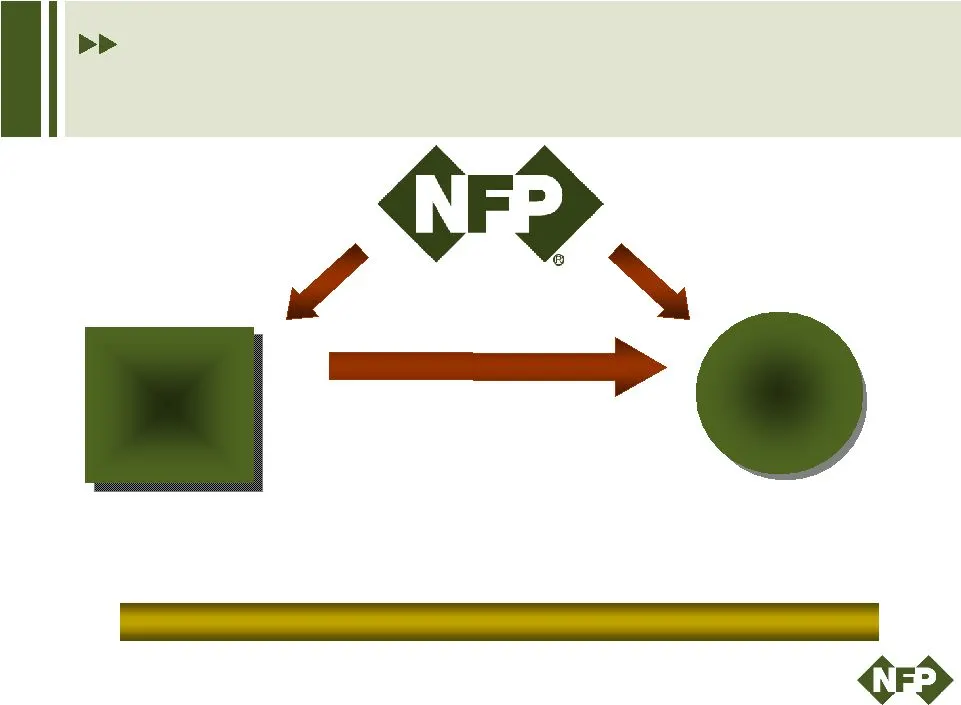
• Business generally not diversified • High service, limited market reach • Professionalism BENEFITS FIRMS: INCREASED OPPORTUNITY WITH NFP Before NFP Transaction After NFP Transaction • Increased product support • High service, national reach • Professionalism backed by compliance and infrastructure
Slide 18: Open Architecture Access
OPEN ARCHITECTURE ACCESS is a registered trademark of National Financial Partners Corp. All other trademarks used herein are the property of their respective owners .

Slide 19: Unlike Typical Consolidator: Company-Wide Resources
• Access to capital to grow business • Strong balance sheet • Technology • Business development and marketing resources • Collaboration with like minded producers • Succession UNLIKE TYPICAL CONSOLIDATOR: COMPANY-WIDE RESOURCES Resources to Drive Growth
Slide 20: Strong Long-Term Organic Growth
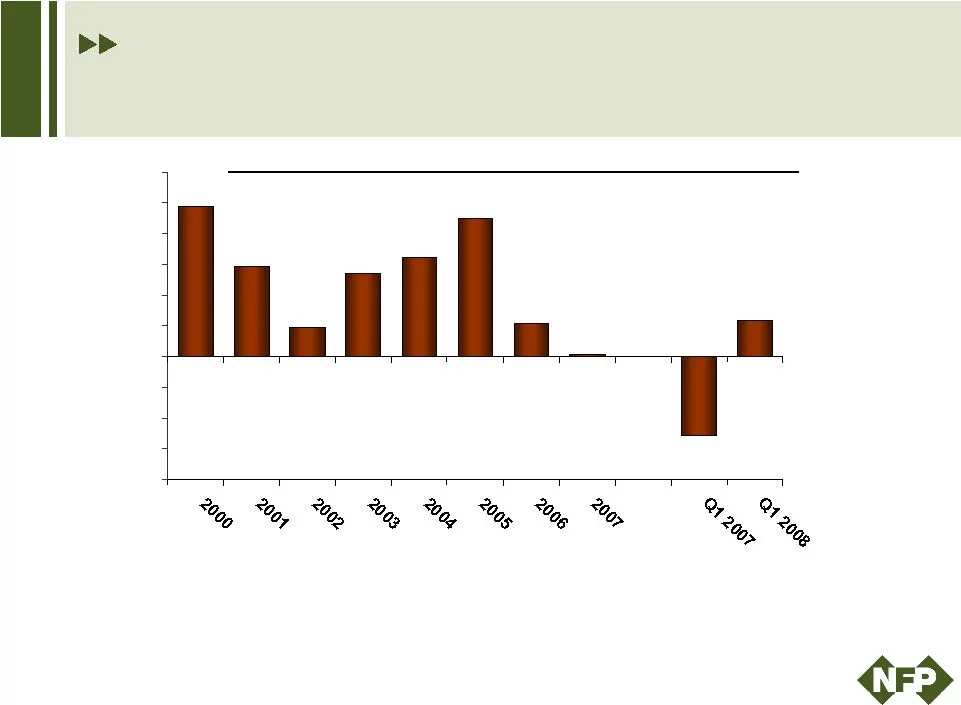
24.5% 14.6% 4.8% 13.5% 16.2% 22.4% 5.4% 0.3% -12.7% 5.9% -20% -15% -10% -5% 0% 5% 10% 15% 20% 25% 30% STRONG LONG-TERM ORGANIC GROWTH • Despite instances of market volatility and life insurance cycles, NFP has not had a year of negative same store revenue growth in its over 9-year history • Weighted
Slide 21: Organic Growth & Acquisitions Drive Success
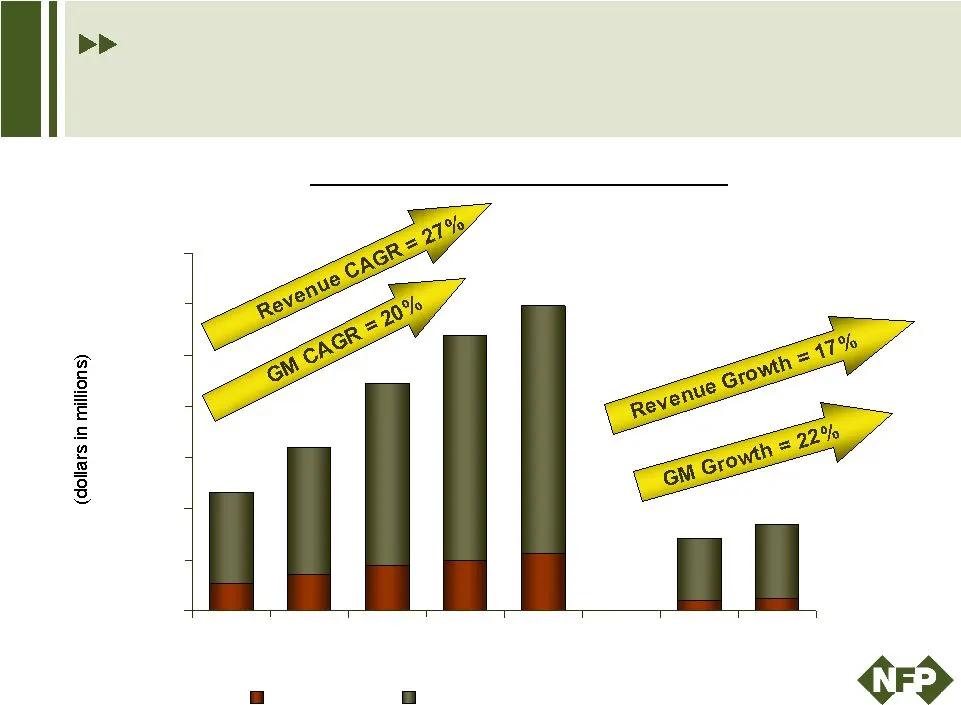
$49.5 $108.1 $140.4 $175.1 $199.2 $224.4 $40.5 Revenue & Gross Margin Growth $464.4 $639.5 $891.4 $1,077.1 $1,194.3 $244.2 $286.4 $0 $200 $400 $600 $800 $1,000 $1,200 $1,400 Q1 Q1 Gross Margin Revenue ORGANIC GROWTH & ACQUISITIONS DRIVE SUCCESS
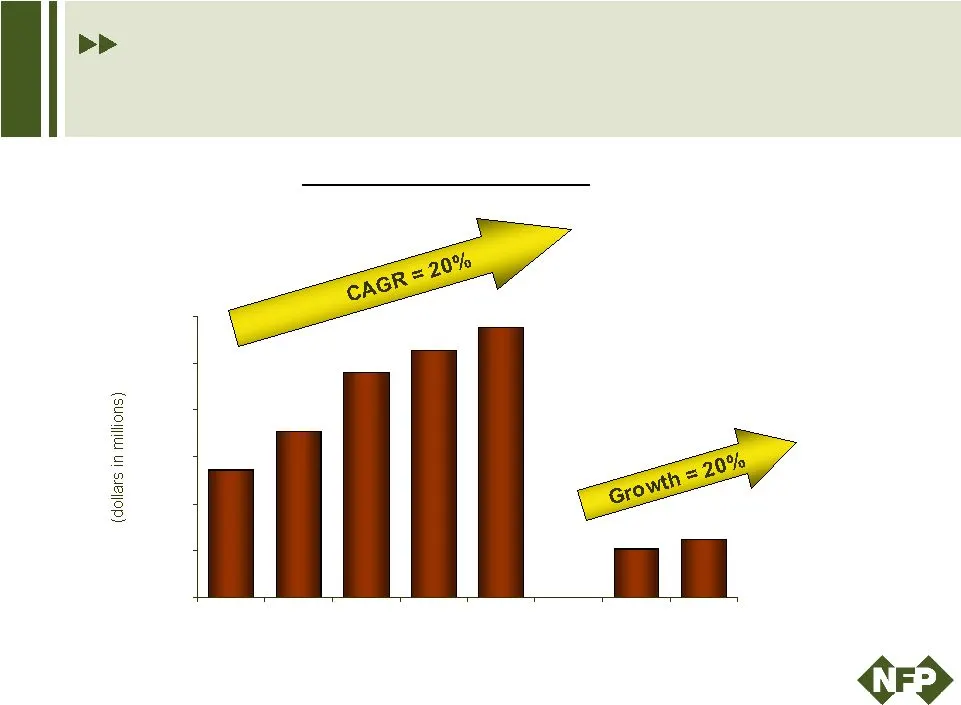
Slide 22: Organic Growth & Acquisitions Drive Earnings
ORGANIC GROWTH & ACQUISITIONS DRIVE EARNINGS Notes: cash earnings excludes $7.7 million, net of tax, related to a management agreement buyout. See NFP’s Quarterly Financial Supplement for the period ended March 31, 2008, available on the Company’s Web site, for more information. Cash Earnings Growth
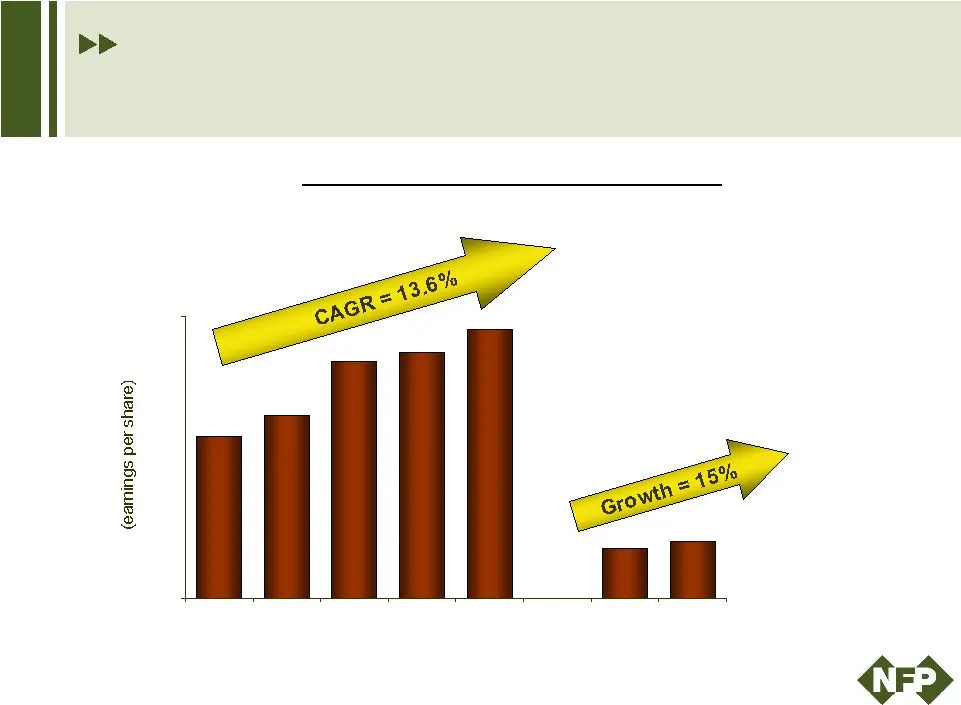
Slide 23: Organic Growth & Acquisitions Drive Earnings
ORGANIC GROWTH & ACQUISITIONS DRIVE EARNINGS $1.72 $1.94 $2.52 $2.61 $2.86 $0.53 $0.61 $0 $3 Q1 Q1 Notes: cash earnings excludes $7.7 million, net of tax, related to a management agreement buyout. See NFP’s Quarterly Financial Supplement for the period ended March 31, 2008, available on the Company’

Slide 24: Conservative Capital Structure and Strong Cash Flow
• Conservative capital structure 34.0% debt to total capitalization as of 3/31/08 Credit facility due in 2011 and convertible notes due in 2012 Exercised accordion feature of credit facility, increasing amount available by $25 million to $250 million • Strong cash flow 2007 net cash provided by oper

Slide 25: 2008: Balanced Approach to Capital Management
• Acquisitions 2008 goal of $20 million in acquired base earnings Focus on strategic acquisitions with recurring revenue Pipeline remains healthy • Share repurchases and dividends $45.0 million share repurchase authorization, $33.8 million remaining Current dividend of $0.21 per quarter 2008: BALANC

Slide 26: Long-Term Execution to Drive Continued Growth
THE NFP MODEL IS STRONG & BUILT FOR LONG-TERM GROWTH LONG-TERM EXECUTION TO DRIVE CONTINUED GROWTH • High single-digit same store revenue growth over the long-term • Alignment between principals & shareholders • Focus on delivering best products and services to client • Continue to build premier ind

Slide 27: National Financial Partners
Cr> NATIONAL FINANCIAL PARTNERS
Source: SEC EDGAR · 8-K filed May 13, 2008
More decks from National Financial Partners Corp
 Q4 2012 Earnings Presentation19 slides · Feb 15, 2013
 Q3 2012 Earnings Presentation18 slides · Oct 31, 2012
 Q2 2012 Earnings Presentation19 slides · Jul 31, 2012
 Q1 2012 Earnings Presentation19 slides · Apr 27, 2012
 Q4 2011 Earnings Presentation18 slides · Feb 8, 2012
 Q3 2011 Earnings Presentation19 slides · Oct 28, 2011