National Financial Partners Corp
National Financial Partners — Sandler O'Neill Financial Services Conference 2006
29 slides from National Financial Partners's conference presentation, Jun 8, 2006
Slide 1: National Financial Partners Sandler O'Neill Financial Services Conference
National Financial Partners Sandler O’Neill Financial Services Conference June 8, 2006
Slide 2: Related to Forward-Looking Statements
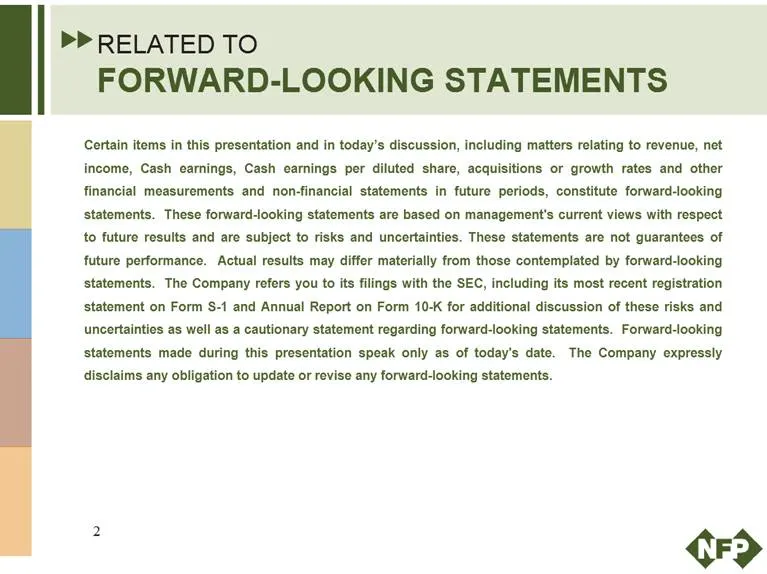
Related to Forward-Looking Statements Certain items in this presentation and in today’s discussion, including matters relating to revenue, net income, Cash earnings, Cash earnings per diluted share, acquisitions or growth rates and other financial measurements and non-financial statements in future
Slide 3: Related to Non-GAAP Financial Information
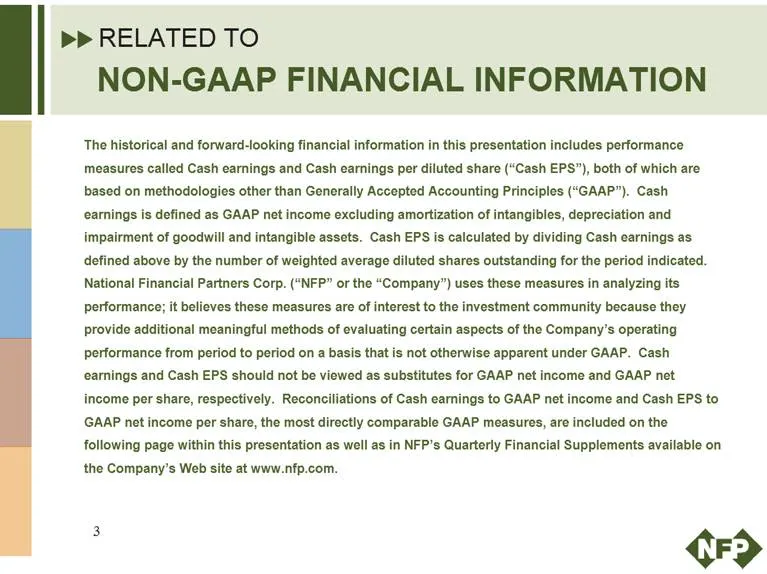
Related to NON-GAAP FINANCIAL INFORMATION The historical and forward-looking financial information in this presentation includes performance measures called Cash earnings and Cash earnings per diluted share (“Cash EPS”), both of which are based on methodologies other than Generally Accepted Accounti
Slide 4: Reconciliation net income to cash earnings
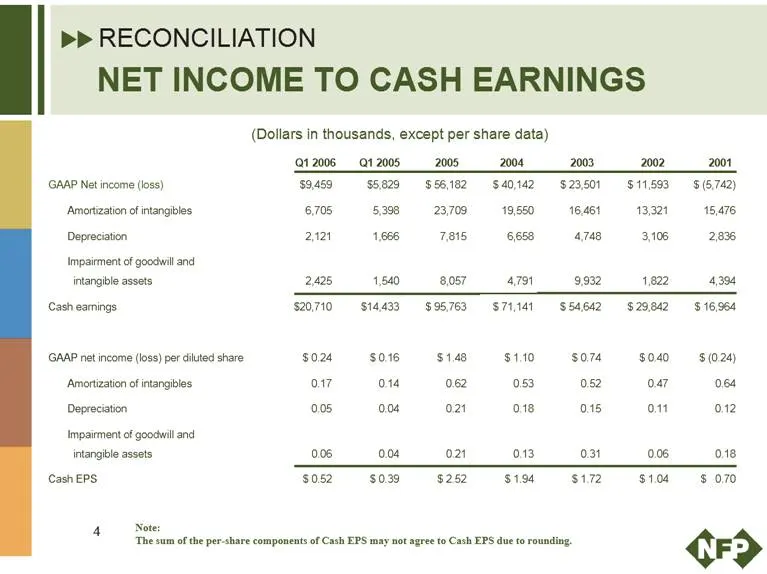
Reconciliation net income to cash earnings (dollars in thousands, except per share data) Q1 2006 Q1 2005 2005 2004 2003 2002 2001 GAAP Net income (loss) $9,459 $5,829$ 56,182 $ 40,142 $ 23,501 $ 11,593 $ (5,742) Amortization of intangibles 6,705 5,398 23,709 19,550 16,461 13,321 15,476 Depreciation
Slide 5: Background: premier distribution company
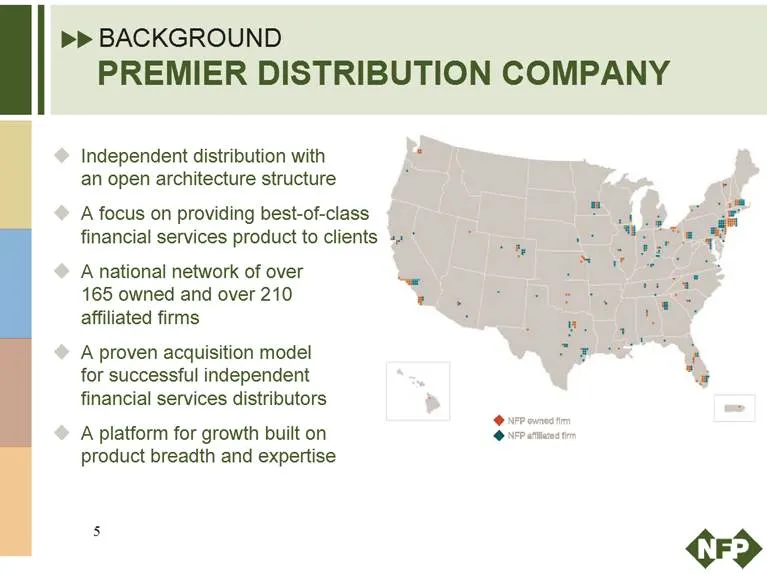
Background premier distribution company Independent distribution with an open architecture structure A focus on providing best-of-class financial services product to clients A national network of over 165 owned and over 210 affiliated firms A proven acquisition model for successful independent finan
Slide 6: Agenda & Overview
Agenda & Overview Accomplishments Positive earnings growth Organic growth and successful acquisition strategy Who we are A national independent financial services distribution company A leading independent channel for the life insurance industry How we build our company A proven and unique acquisiti
Slide 7: Strong Financial Results: Cash Earnings Growth
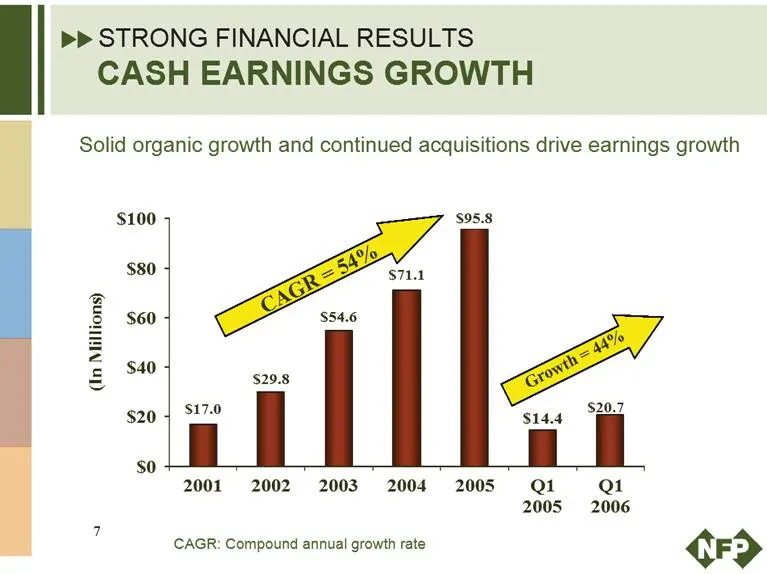
Strong Financial Results Cash Earnings Growth Solid organic growth and continued acquisitions drive earnings growth (In Millions $100 $80 $60 $40 $20 $0 $17.0 $29.8 $54.6 $71.1 $95.8 CAGR=54% Growth=44% $17.0 $29.8 $54.6 $71.1 $95.8 $14.4 $20.7 2001 2002 2003 2004 2005 Q1 2005 Q1 2006 CAGR= Compound
Slide 8: Acquisition strategy overview
Acquisition strategy overview Due Diligence Exhaustive due diligence process Perpetuity Management agreement becomes a potential future asset and a tool for succession and includes strict non-compete and non-solicit requirements Alignment Principals are shareholders Incentive Ongoing incentive bonus
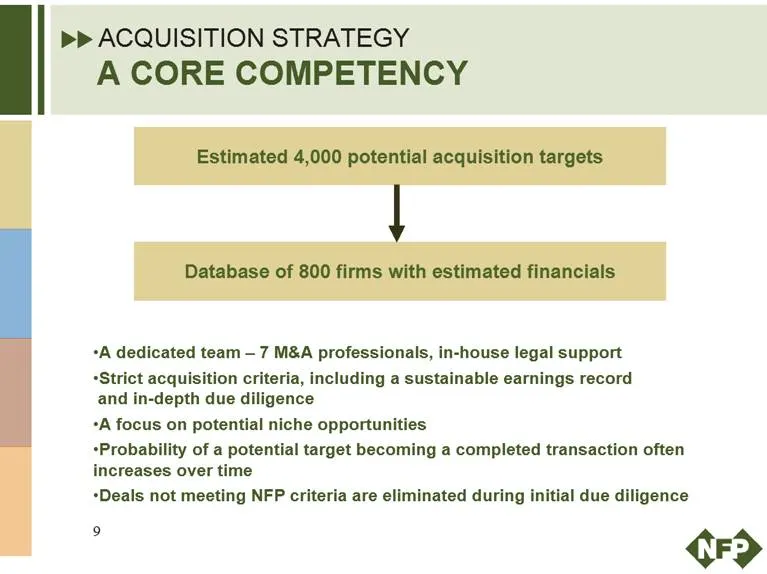
Slide 9: Acquisition strategy a core competency
Acquisition strategy a core competency estimated 4,000 potential acquisition targets Database of 800 firms with estimated financials A dedicated team – 7 M&A professionals, in-house legal support Strict acquisition criteria, including a sustainable earnings record and in-depth due diligence A focus
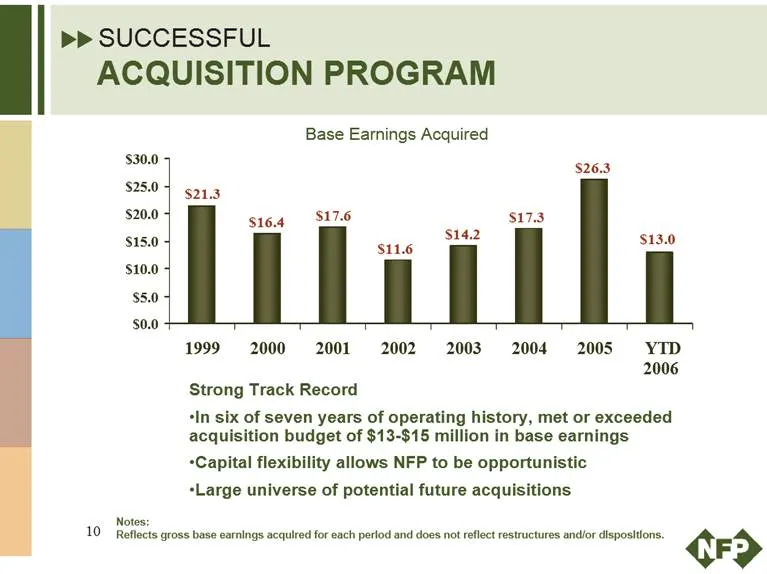
Slide 10: Successful Acquisition program: base earnings acquired
Successful Acquisition program base earnings acquired $30.0 $25.0 $20.0 $15.0 $10.0 $5.0 $0.0 $21.3 $16.4 $11.6 $14.2 $17.3 $26.3 $13.0 1999 2000 2001 2002 2003 2004 2005 YTD 2006 Strong Track Record In six of seven years of operating history, met or exceeded acquisition budget of $13-$15 million in
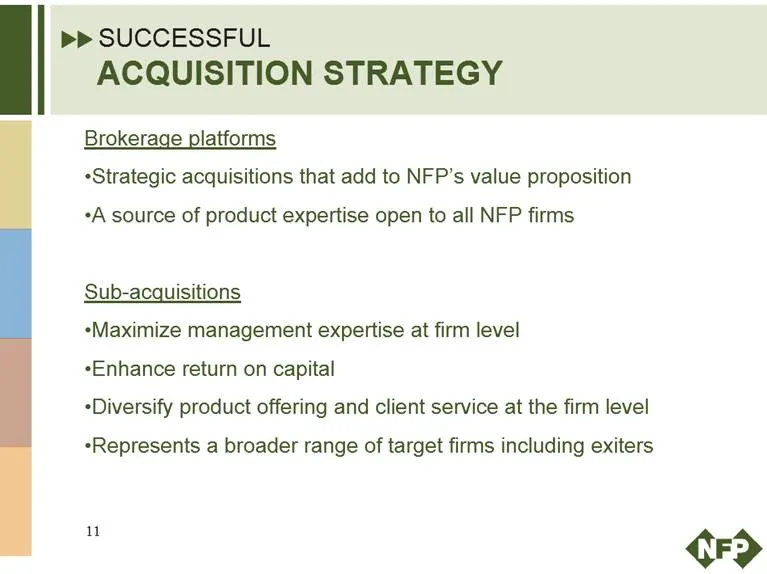
Slide 11: Successful acquisition strategy
Successful acquisition strategy Brokerage platforms Strategic acquisitions that add to NFP’s value proposition A source of product expertise open to all NFP firms Sub-acquisitions Maximize management expertise at firm level Enhance return on capital Diversify product offering and client service at t
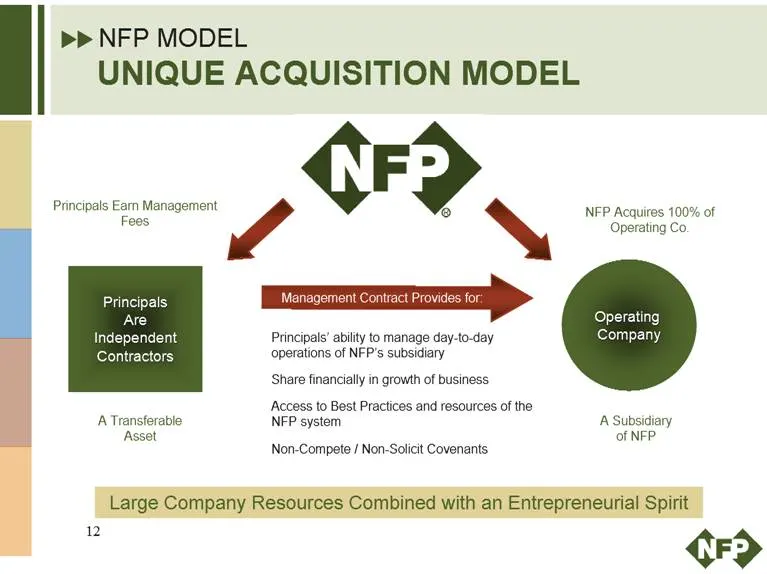
Slide 12: NFP Model: Unique Acquisition Model
NFP Model Unique Acquisition Model Principals Earn Management fees NFP acquires 100% of operating Co. Principals are independent contractors management contract provides for: Operating Company Principals’ ability to manage day to day operations of NFP’s subsidiary Share financially in growth of busi
Slide 13: NFP Model: Transaction Example
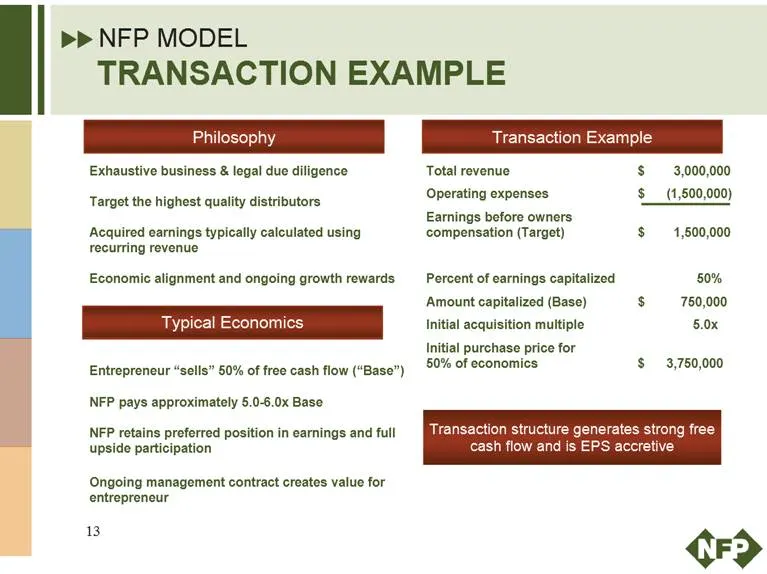
NFP Model Transaction Example Philosophy Transaction Example Typical Economics Transaction structure generates strong free cash flow and is EPS accretive Exhaustive business & legal due diligence Target the highest quality distributors Acquired earnings typically calculated using recurring revenue E
Slide 14: NFP Model: Typical Initial Earnout
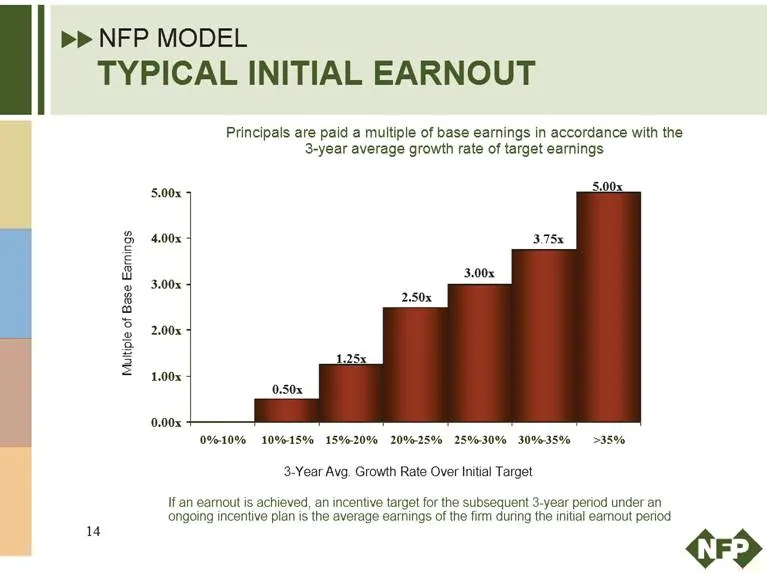
NFP Model Typical Initial Earnout Principals are paid a multiple of base earnings in accordance with the 3-year average growth rate of target earnings Multiple of Base earnings 0.00x 1.00x 2.00x 3.00x 4.00x 5.00x 0.50x 1.25x 2.50x 3.00x 3.75x 5.00x 0%-10% 10%-15% 15%-20% 20%-25% 25%-30% 30%-35% >35%
Slide 15: NFP Model Incentives: Ongoing plan
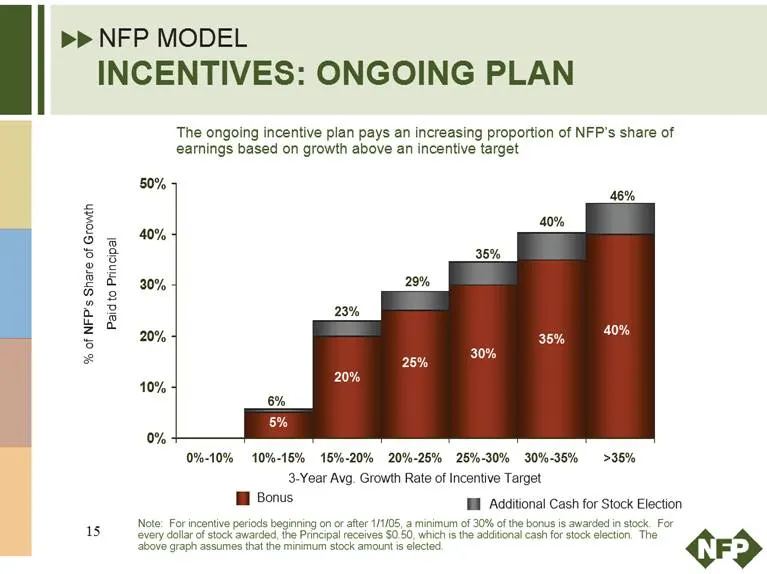
NFP Model Incentives: Ongoing plan The ongoing incentive plan pays an increasing proportion of NFP’s share of earnings based on growth above an incentive target 0% 10% 20% 30% 40% 50% 0%-10% 10%-15% 15%-20% 20%-25% 25%-30% 30%-35% >35% 3-year avg. growth rate of incentive target 6% 5% 23% 29% 35% 40
Slide 16: The Future of NFP: Current Diversification
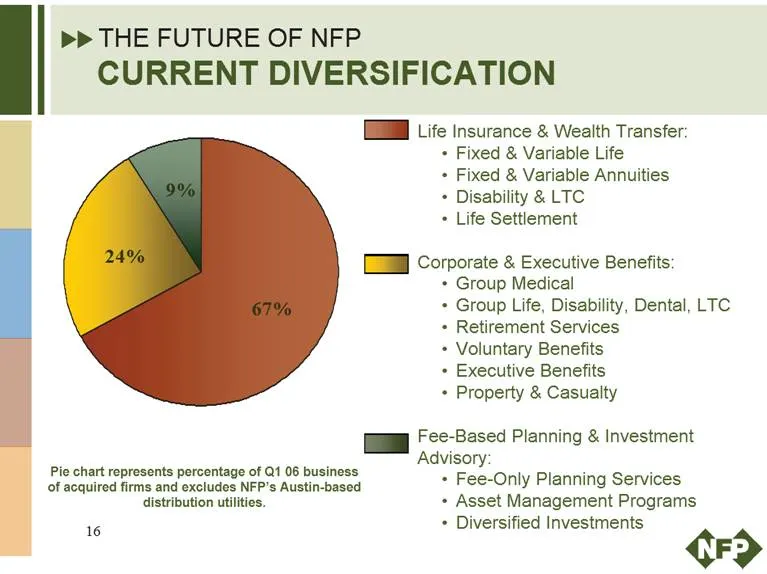
THE FUTURE OF NFP CURRENT DIVERSIFICATION Life Insurance & Wealth Transfer: Fixed & Variable Life Fixed & Variable Annuities Disability & LTC Life Settlement Corporate & Executive Benefits: Group Medical Group Life, Disability, Dental, LTC Retirement Services Voluntary Benefits Executive Benefits Pr
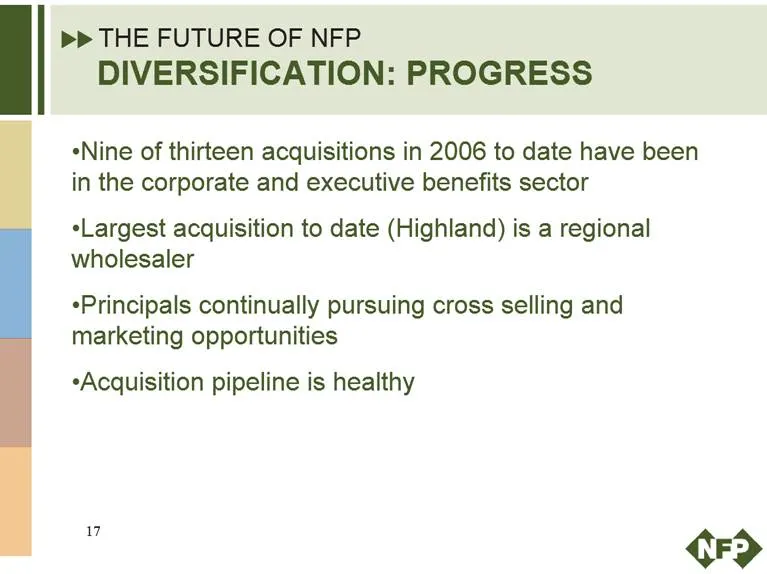
Slide 17: The Future of NFP: Diversification Progress
The Future of NFP Diversification: Progress Nine of thirteen acquisitions in 2006 to date have been in the corporate and executive benefits sector Largest acquisition to date (Highland) is a regional wholesaler Principals continually pursuing cross selling and marketing opportunities Acquisition pip
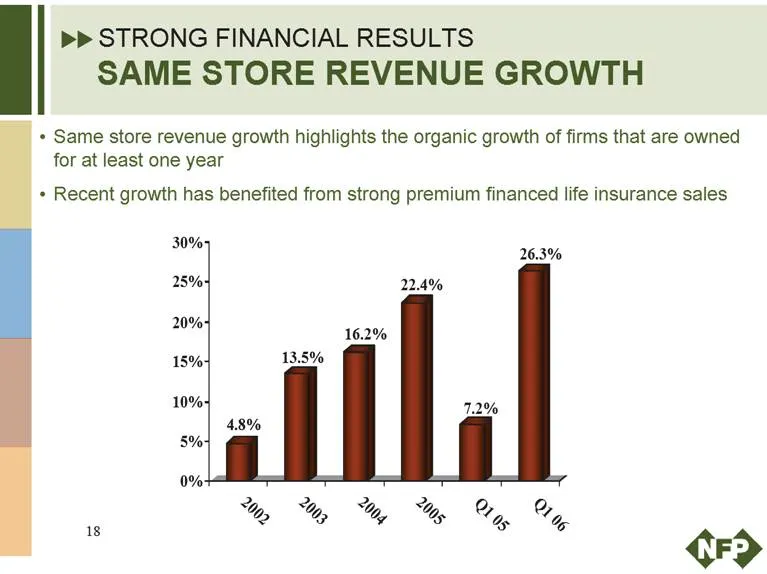
Slide 18: Strong Financial Results: Same Store Revenue Growth
Strong Financial Results Same Store Revenue Growth Same store revenue growth highlights the organic growth of firms that are owned for at least one year Recent growth has benefited from strong premium financed life insurance sales 0% 5% 10% 15% 20% 25% 30% 4.8% 13.5% 16.2% 22.4% 7.2% 26.3% 2002 2003
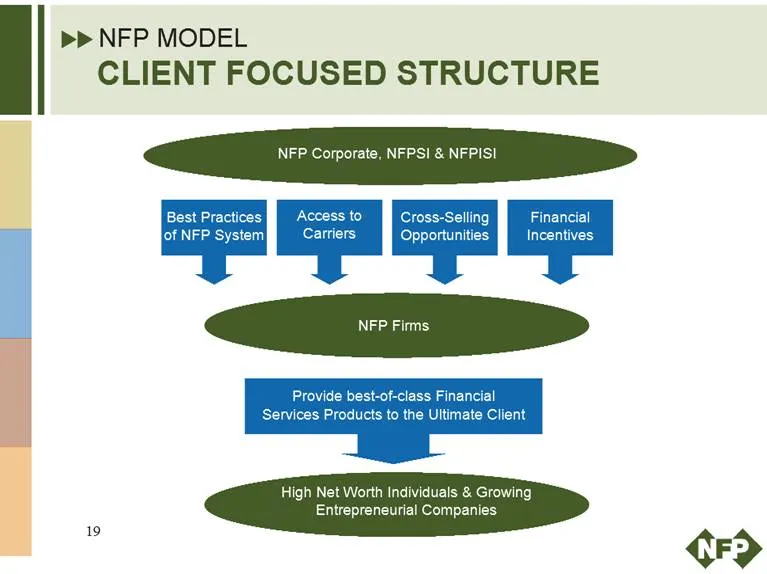
Slide 19: NFP Model: Client Focused Structure
NFP Model Client Focused Structure NFP Corporate, NFPSI & NFPISI Best Practices of NFP System Access to Carriers Cross-Selling Opportunities Financial Incentives NFP Firms Provide best-of-class Financial Services Products to the Ultimate Client High Net Worth Individuals & Growing Entrepreneurial Co
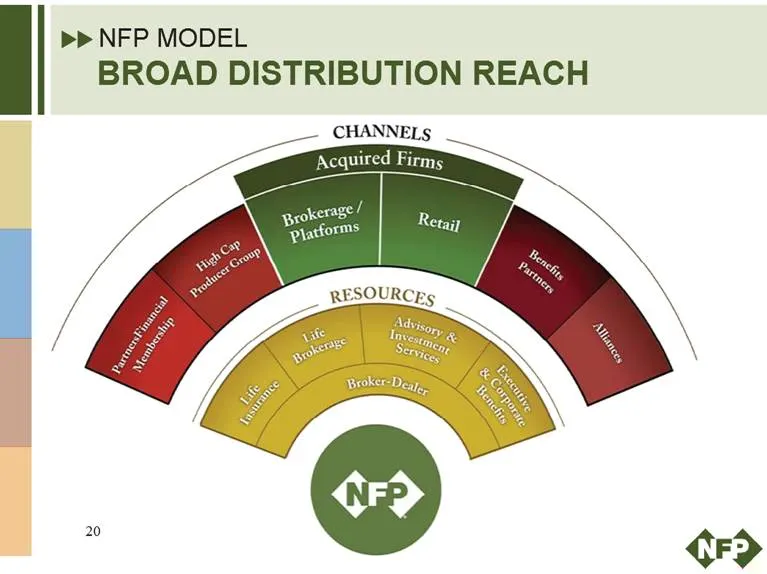
Slide 20: NFP Model: Broad Distribution Reach
NFP Model Broad Distribution reach channels acquired firms PartnersFinancial Membership High Cap Producer Group Brokerage/Platforms Retail Benefits Partners Alliances Resources Life Insurance Life Brokerage Advisory & Investment Services Executive & Corporate Benefits Broker-Dealer 20
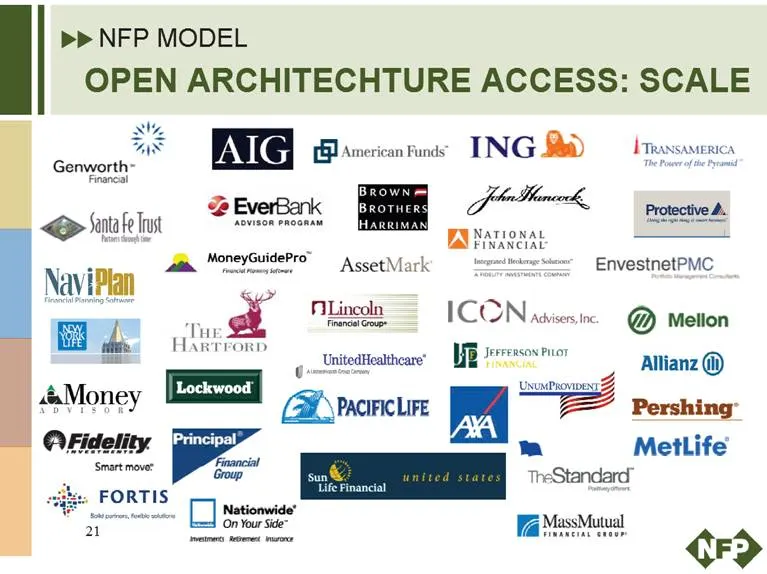
Slide 21: NFP Model: Open Architectural Access, Scale
NFP Model Open Architectural access: scale 21
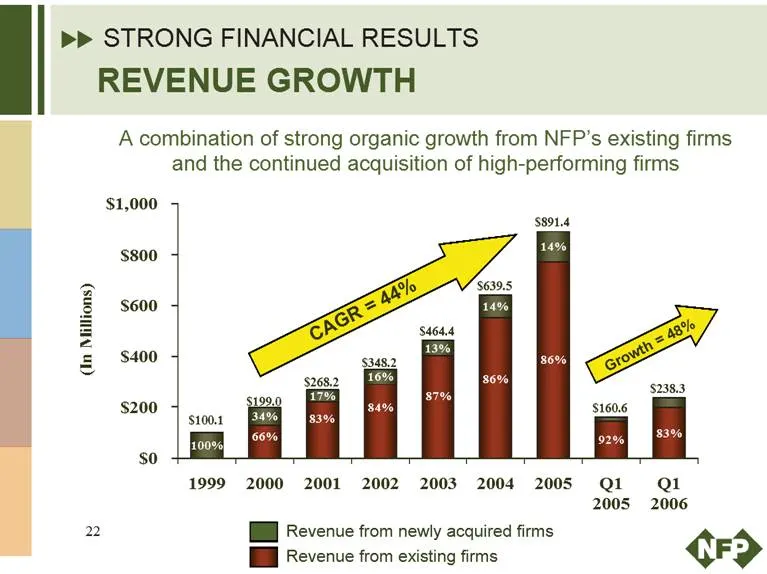
Slide 22: Strong financial results: revenue growth
Strong financial results revenue growth a combination of strong organic growth from NFP’s existing firms and the continued acquisition of high-performing firms (In Millions) $0 $200 $400 $600 $800 $1,000 CAGR= 44% Growth= 48% $100.1 100% $199.0 34% 66% $268.2 17% 83% $348.2 13% 87% $639.5 14% 86% $8
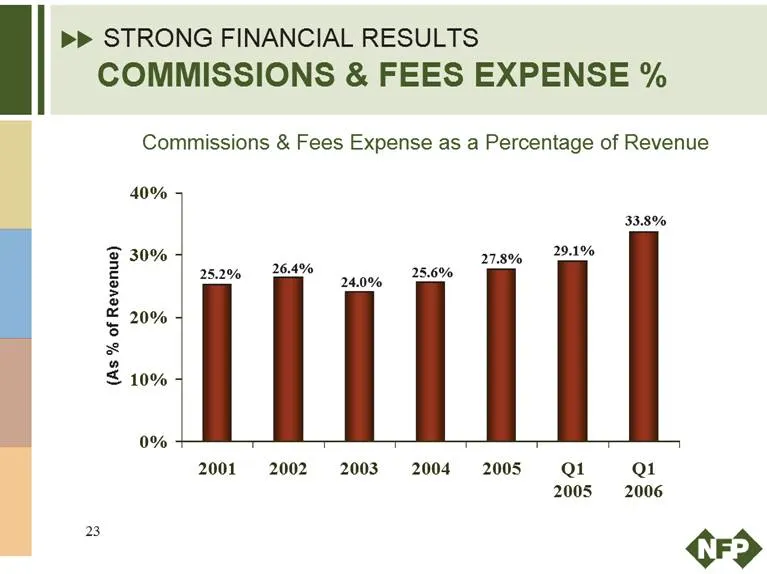
Slide 23: Commissions and Fees Expense
Strong financial results Commissions and Fees Expense % Commissions and Fees Expense as a percentage of revenue (As % of Revenue) 0% 10% 20% 30% 40% 2001 25.2% 2002 26.4% 2003 24% 2004 25.6% 2005 27.8% Q1 2005 29.1% Q1 2006 33.8% 23
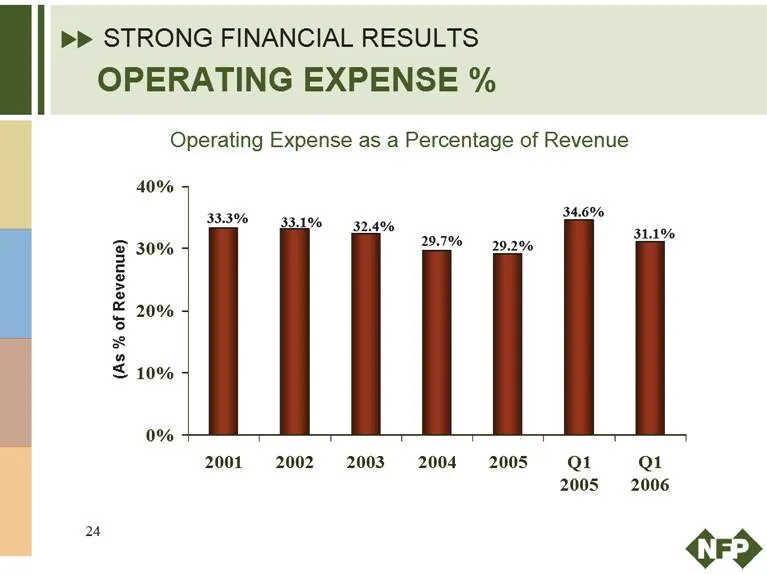
Slide 24: Operating Expense
Strong financial results Operating Expense Operating Expense as a Percentage of Revenue (As % of Revenue) 0% 10% 20% 30% 40% 2001 33.3% 2002 33.1% 2003 32.4% 2004 29.7% 2005 29.2% Q1 2005 34.6% Q1 2006 31.1% 24
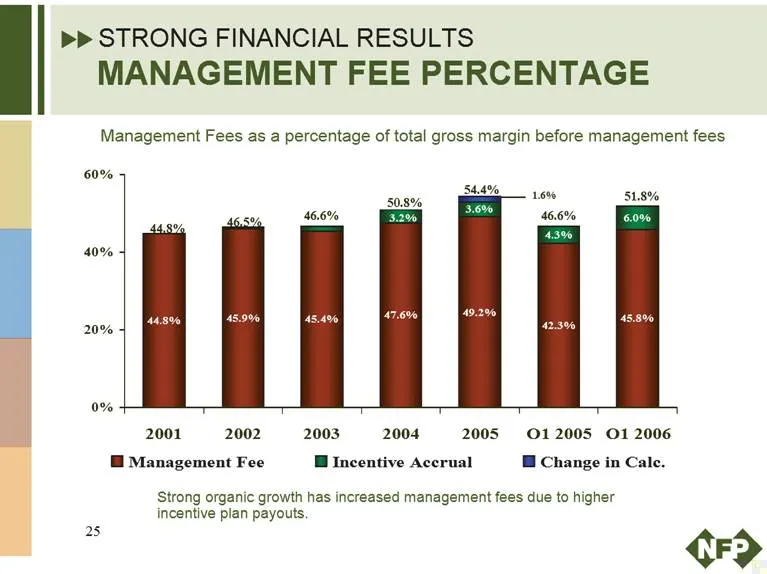
Slide 25: Management Fee Percentage
Strong financial results Management Fee Percentage Management Fees as a percentage of total gross margin before management fees 2001 2002 2003 2004 2005 Q1 2005 Q1 2006 45.4% 47.6% 3.2% 50.8% 49.2% 3.6% 54.4% 1.6% 42.3% 4.3% 46.6% 45.8% 6.0% 51.8% 0% 20% 40% 60% Management Fee Incentive Accrual Chan
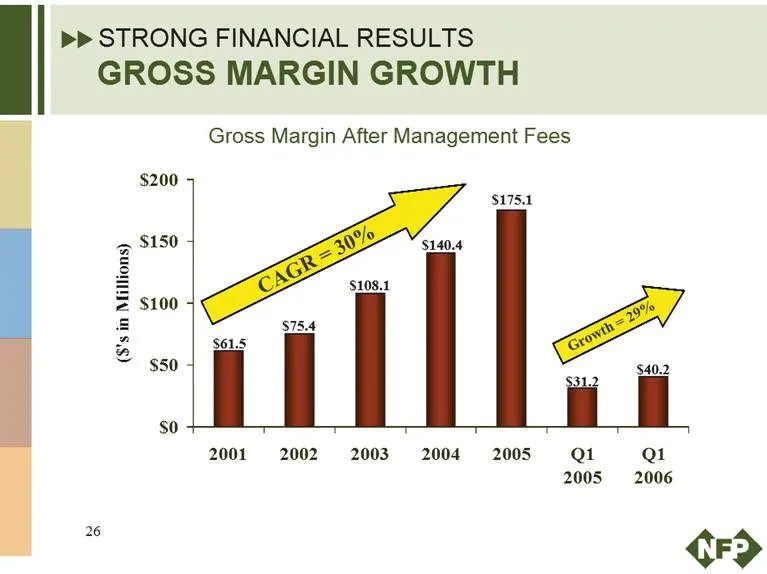
Slide 26: Gross Margin Growth
Strong Financial Results Gross Margin Growth Gross Margin After Management Fees ($’s in Millions) $0 $50 $100 $150 $200 2001 2002 2003 2004 2005 Q1 2005 Q1 2006 CAGR=30% $61.5 $75.4 $108.1 $140.4 $175.1 $31.2 $40.2 26
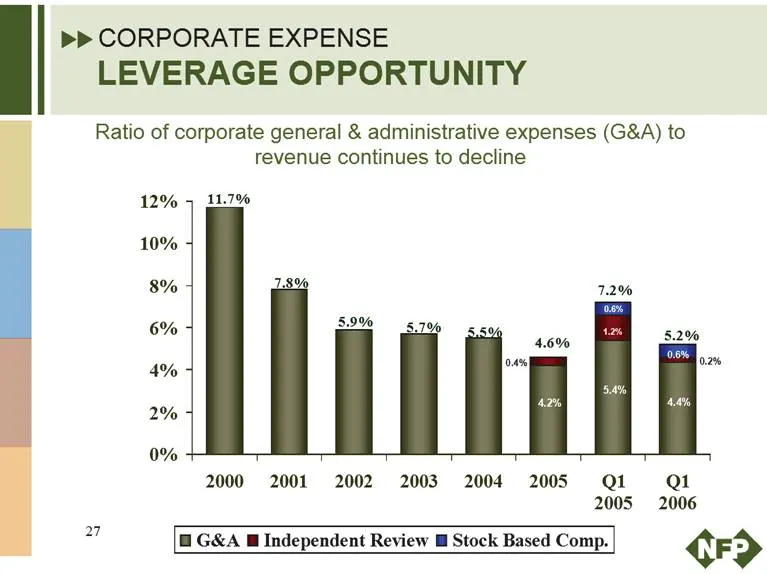
Slide 27: Corporate Expense Leverage Opportunity
CORPORATE EXPENSE LEVERAGE OPPORTUNITY Ratio of corporate general & administrative expenses (G&A) to revenue continues to decline 12% 10% 8% 6% 4% 2% 0% 11.7% 7.8% 5.9% 5.7% 5.5% 0.4% 4.6% 4.2% 7.2% 0.6% 1.2% 5.4% 5.2% 0.6% 0.2% 4.4% 2000 2001 2002 2003 2004 2005 Q1 2005 Q1 2006 G&A Independent Revi
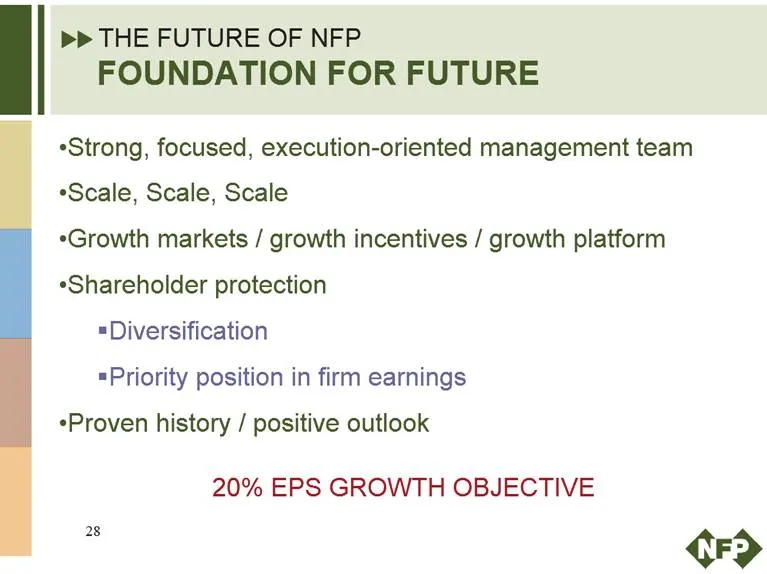
Slide 28: The Future of NFP: Foundation for Future
THE FUTURE OF NFP FOUNDATION FOR FUTURE Strong, focused, execution-oriented management team Scale, Scale, Scale Growth markets / growth incentives / growth platform Shareholder protection Diversification Priority position in firm earnings Proven history / positive outlook 20% EPS GROWTH OBJECTIVE 28

Slide 29: National Financial Partners
National Financial Partners
Source: SEC EDGAR · 8-K filed Jun 8, 2006
More decks from National Financial Partners Corp
 Q4 2012 Earnings Presentation19 slides · Feb 15, 2013
 Q3 2012 Earnings Presentation18 slides · Oct 31, 2012
 Q2 2012 Earnings Presentation19 slides · Jul 31, 2012
 Q1 2012 Earnings Presentation19 slides · Apr 27, 2012
 Q4 2011 Earnings Presentation18 slides · Feb 8, 2012
 Q3 2011 Earnings Presentation19 slides · Oct 28, 2011