Pacific Drilling — Scotia Howard Weil 43rd Annual Energy Conference 2015
34 slides from Pacific Drilling's conference presentation, Mar 24, 2015
Slide 1: Scotia Howard Weil 43rd Annual Energy Conference
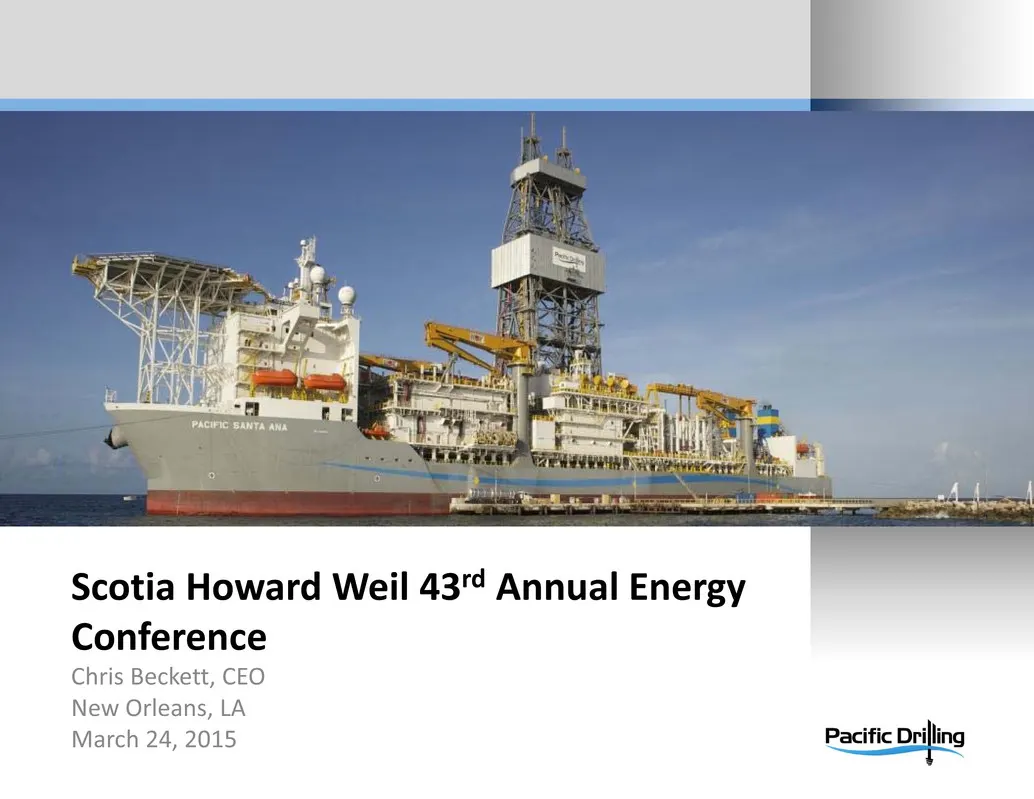
Scotia Howard Weil 43rd Annual Energy Conference Chris Beckett, CEO New Orleans, LA March 24, 2015
Slide 2: Forward-looking statements
Certain statements and information contained in this presentation (and oral statements made regarding the subjects of this presentation) constitute “forward‐looking statements” within the meaning of the Private Securities Litigation Reform Act of 1995. Where any forward‐looking statement includes a
Slide 3: Committed to being the preferred high-specification floating-rig drilling contractor
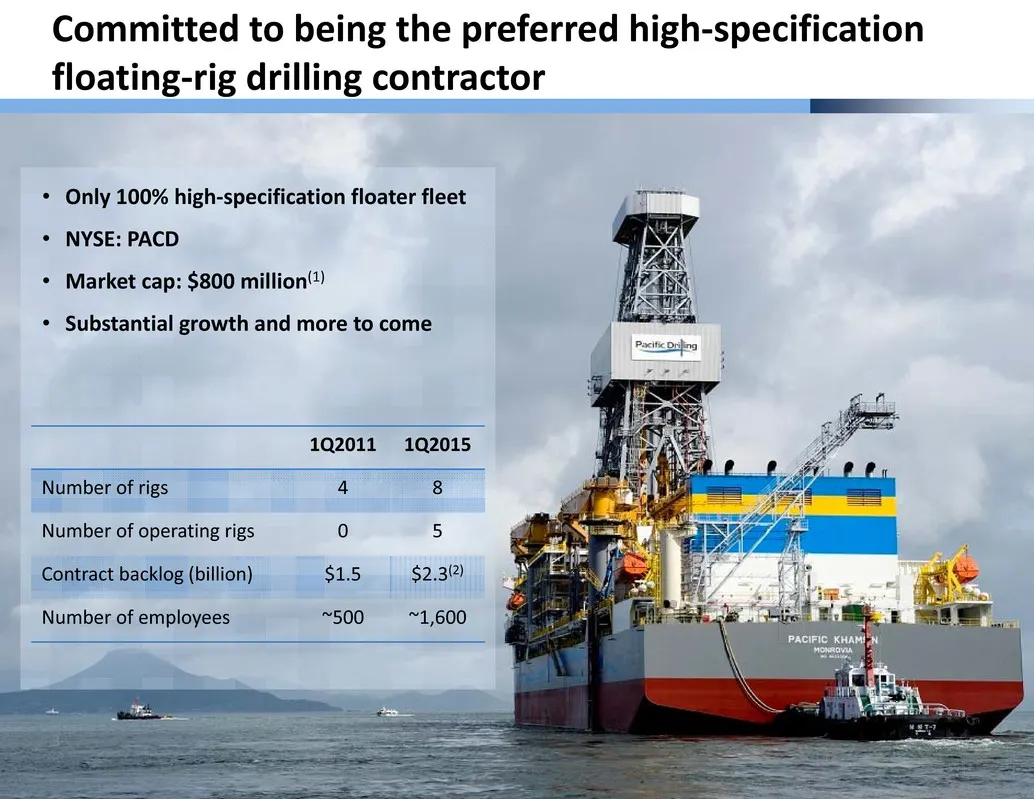
3 Committed to being the preferred high‐specification floating‐rig drilling contractor • Only 100% high‐specification floater fleet • NYSE: PACD • Market cap: $800 million(1) • Substantial growth and more to come 1Q2011 1Q2015 Number of rigs 4 8 Number of operating rigs 0 5 Contract backlog (billion
Slide 4: Financial performance highlights
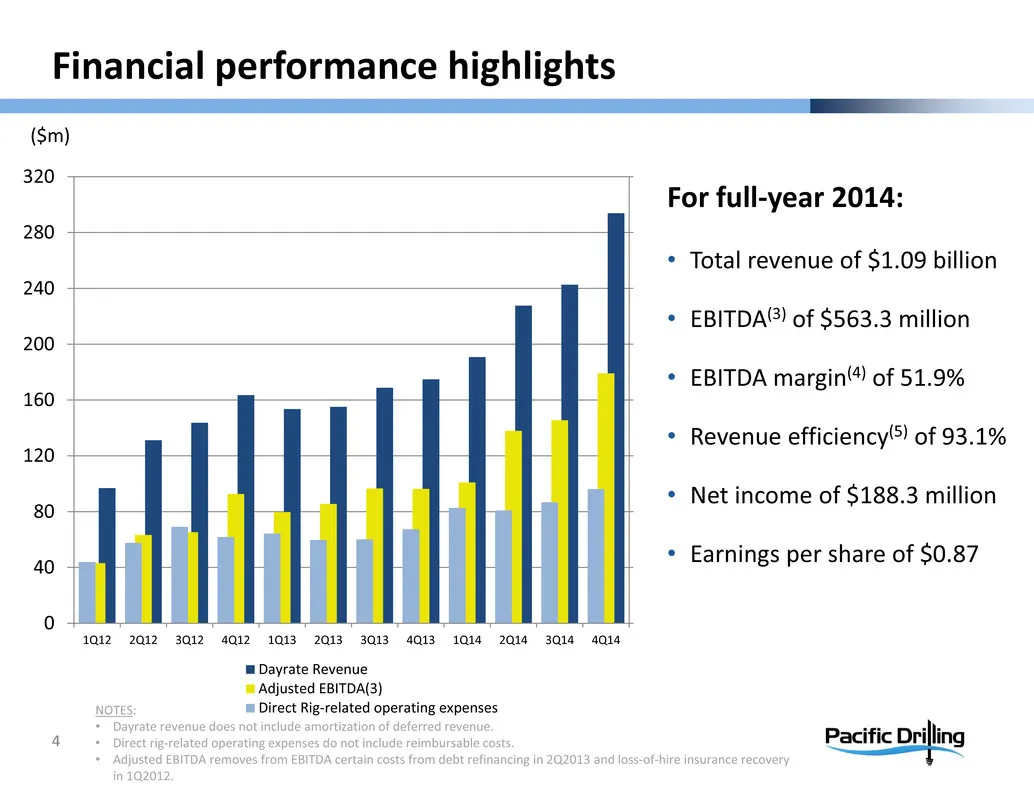
Financial performance highlights 4 For full‐year 2014: • Total revenue of $1.09 billion • EBITDA(3) of $563.3 million • EBITDA margin(4) of 51.9% • Revenue efficiency(5) of 93.1% • Net income of $188.3 million • Earnings per share of $0.87 ($m) NOTES: • Dayrate revenue does not include amortization
Slide 5: Strategically positioned for long-term success
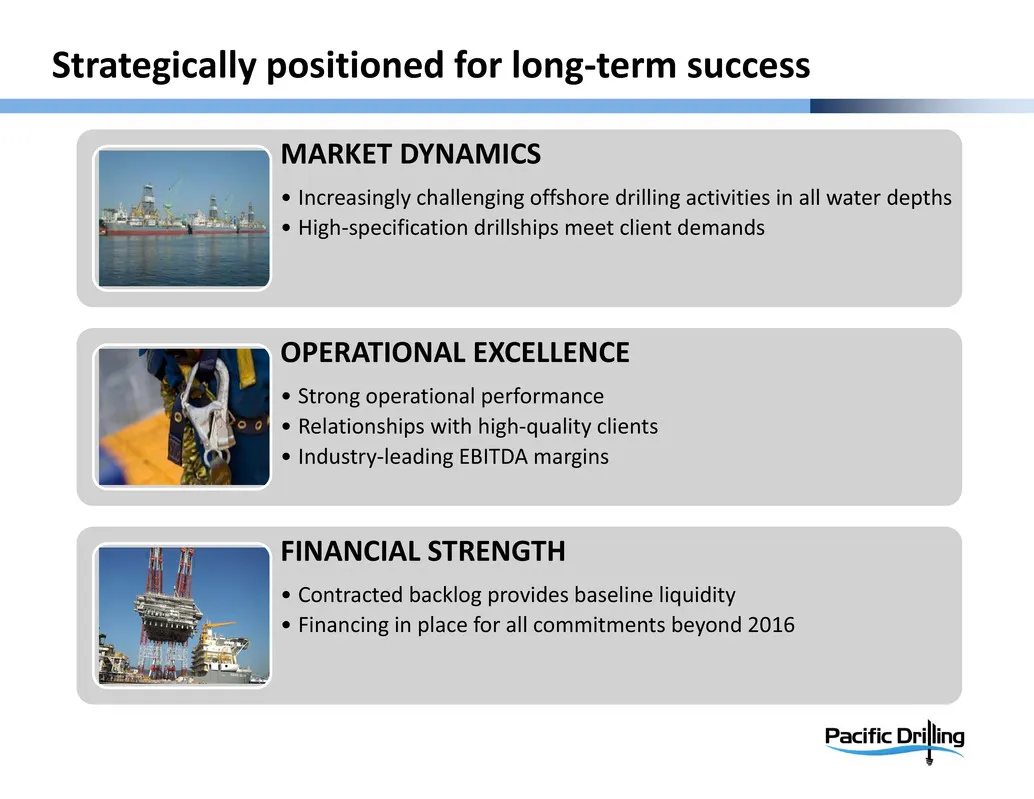
Strategically positioned for long‐term success MARKET DYNAMICS • Increasingly challenging offshore drilling activities in all water depths • High‐specification drillships meet client demands OPERATIONAL EXCELLENCE • Strong operational performance • Relationships with high‐quality clients • Industry‐
Slide 6: The only 100% high-specification floater fleet
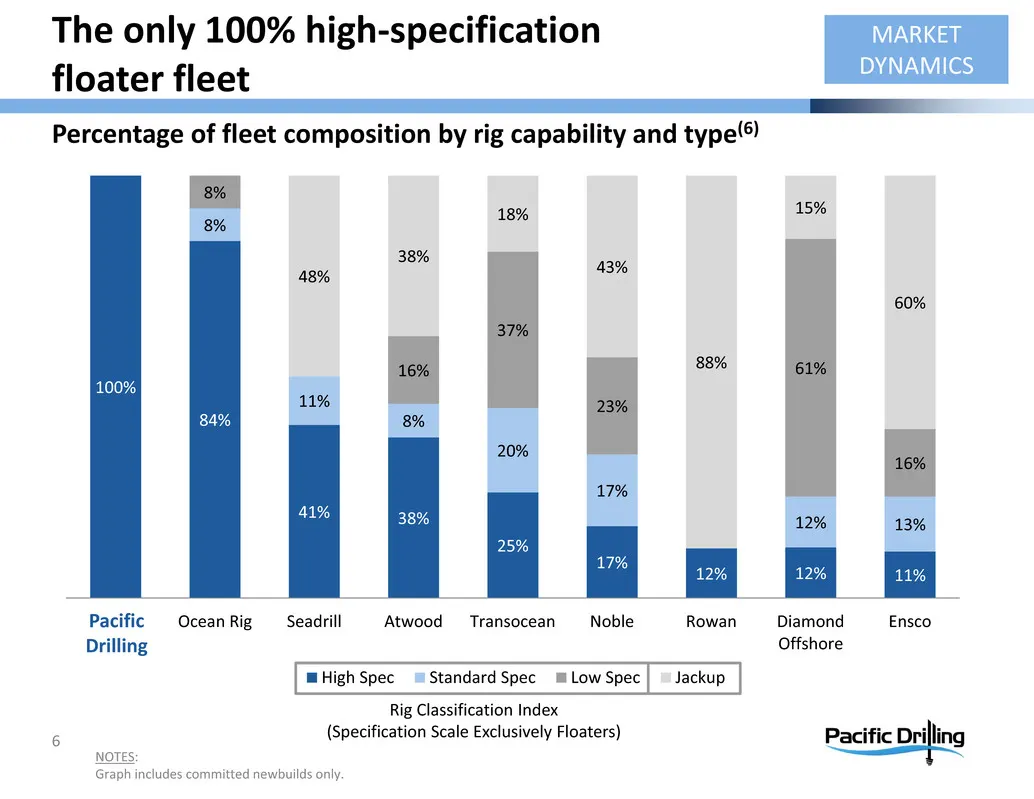
100% 84% 41% 38% 25% 17% 12% 12% 11% 8% 11% 8% 20% 17% 12% 13% 8% 16% 37% 23% 61% 16% 48% 38% 18% 43% 88% 15% 60% Pacific Drilling Ocean Rig Seadrill Atwood Transocean Noble Rowan Diamond Offshore Ensco High Spec Standard Spec Low Spec Jackup The only 100% high‐specification floater fleet NOTES: Gra
Slide 7: What is a high-specification floating rig?
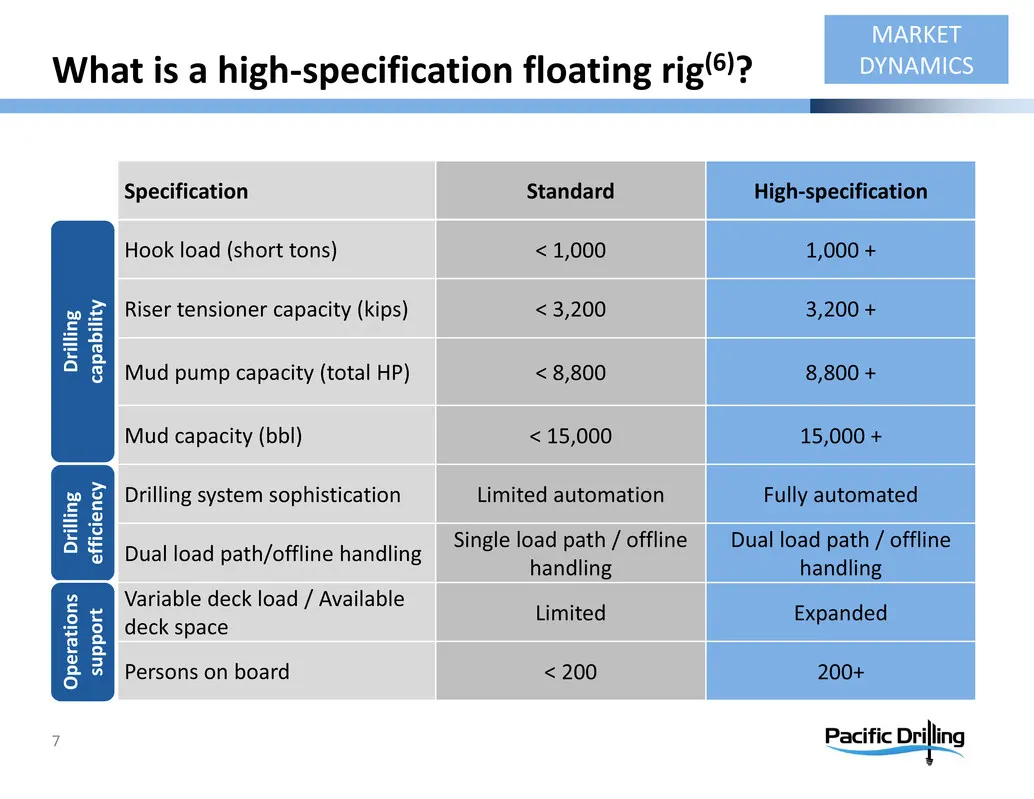
7 What is a high‐specification floating rig(6)? MARKET DYNAMICS Specification Standard High‐specification Hook load (short tons) < 1,000 1,000 + Riser tensioner capacity (kips) < 3,200 3,200 + Mud pump capacity (total HP) < 8,800 8,800 + Mud capacity (bbl) < 15,000 15,000 + Drilling system sophistic
Slide 8: Newest drillships in demand for all water depths
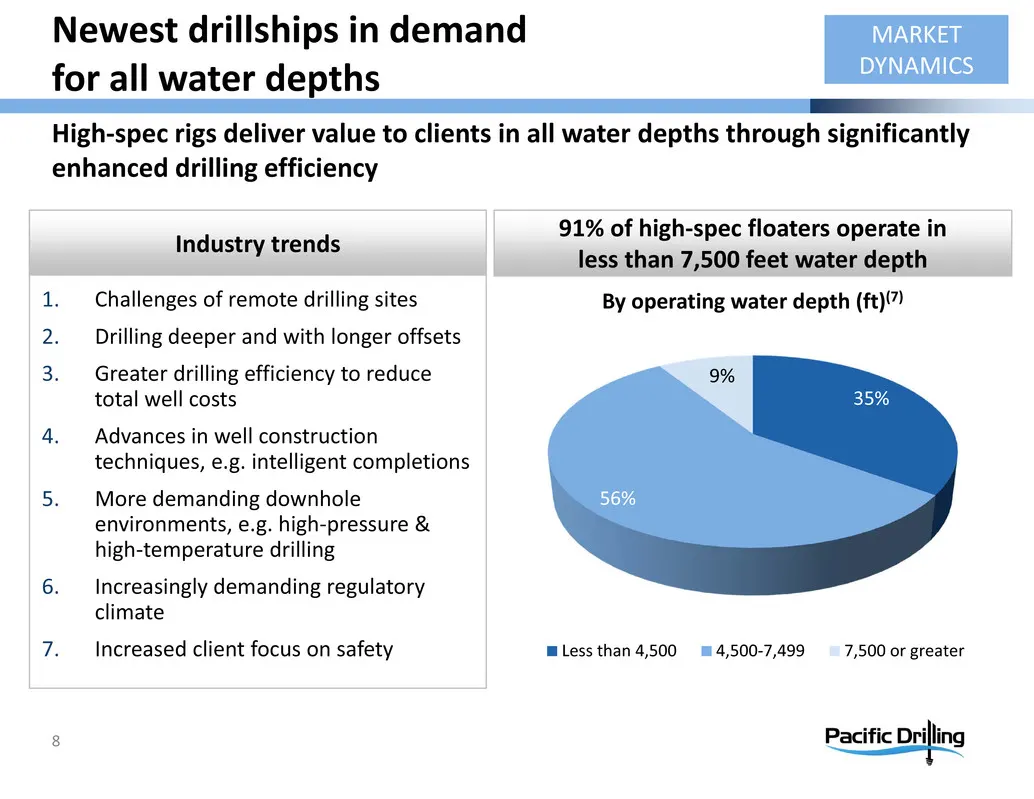
Newest drillships in demand for all water depths Industry trends 91% of high‐spec floaters operate in less than 7,500 feet water depth 8 1. Challenges of remote drilling sites 2. Drilling deeper and with longer offsets 3. Greater drilling efficiency to reduce total well costs 4. Advances in well con
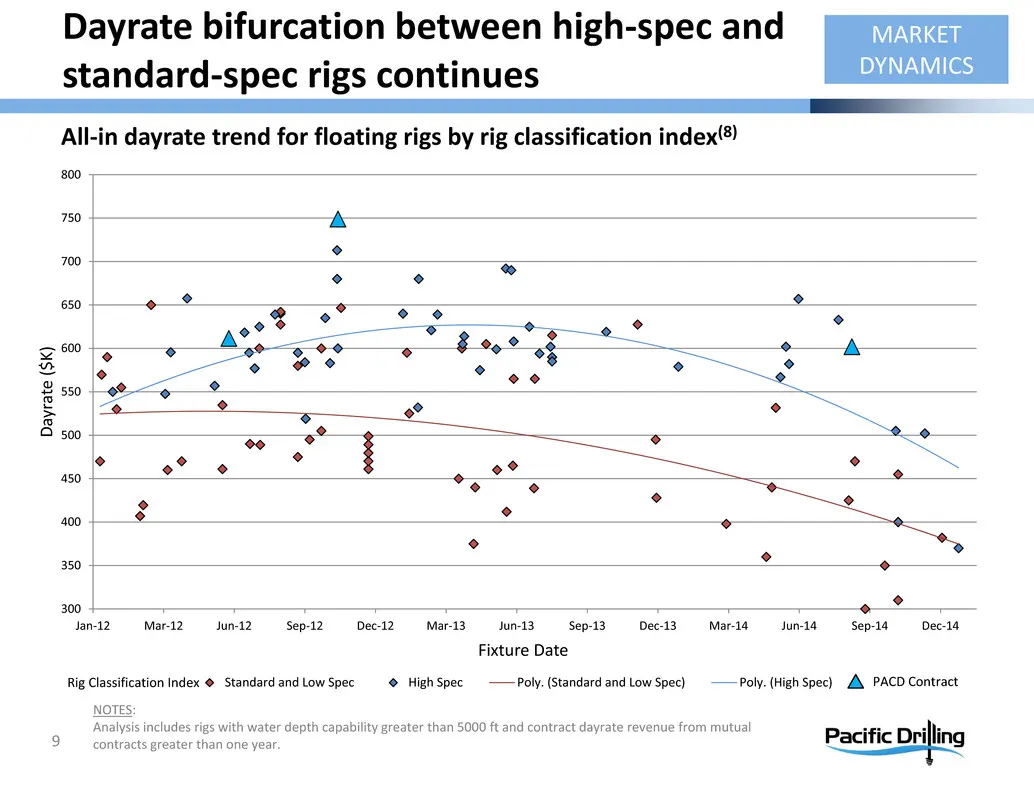
Slide 9: Dayrate bifurcation between high-spec and standard-spec rigs continues
300 350 400 450 500 550 600 650 700 750 800 Jan‐12 Mar‐12 Jun‐12 Sep‐12 Dec‐12 Mar‐13 Jun‐13 Sep‐13 Dec‐13 Mar‐14 Jun‐14 Sep‐14 Dec‐14 D a y r a t e ( $ K ) Fixture Date Standard and Low Spec High Spec Poly. (Standard and Low Spec) Poly. (High Spec) All‐in dayrate trend for floating rigs by rig clas
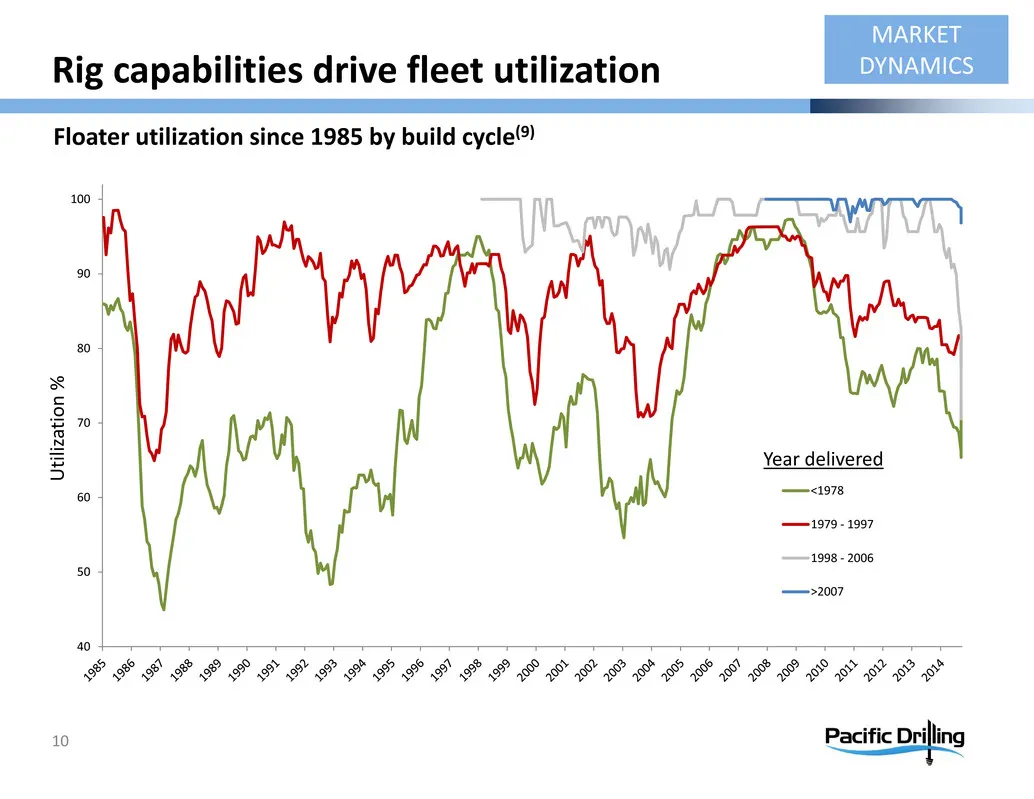
Slide 10: Rig capabilities drive fleet utilization
Rig capabilities drive fleet utilization 10 40 50 60 70 80 90 100 <1978 1979 ‐ 1997 1998 ‐ 2006 >2007 U t i l i z a t i o n % MARKET DYNAMICS Year delivered Floater utilization since 1985 by build cycle(9)
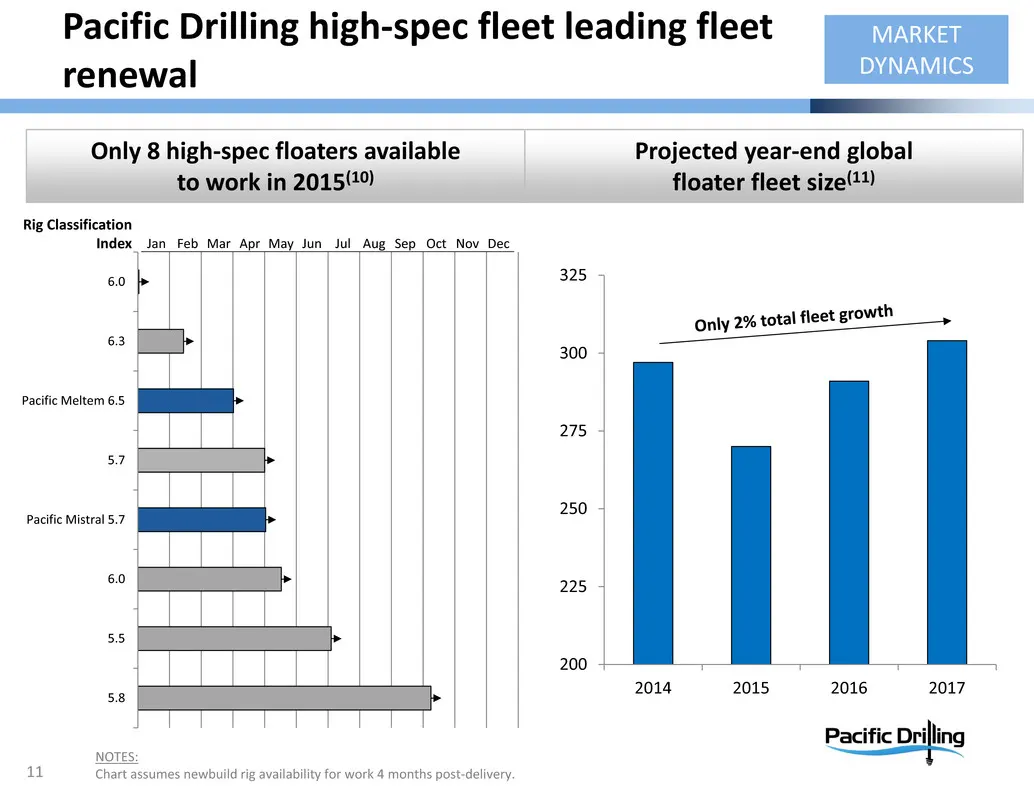
Slide 11: Pacific Drilling high-spec fleet leading fleet renewal
Pacific Drilling high‐spec fleet leading fleet renewal Only 8 high‐spec floaters available to work in 2015(10) 11 Rig Classification Index MARKET DYNAMICS 5.8 5.5 6.0 Pacific Mistral 5.7 5.7 Pacific Meltem 6.5 6.3 6.0 Jan Feb Mar Apr May Jun Jul Aug Sep Oct Nov Dec 200 225 250 275 300 325 2014 2015
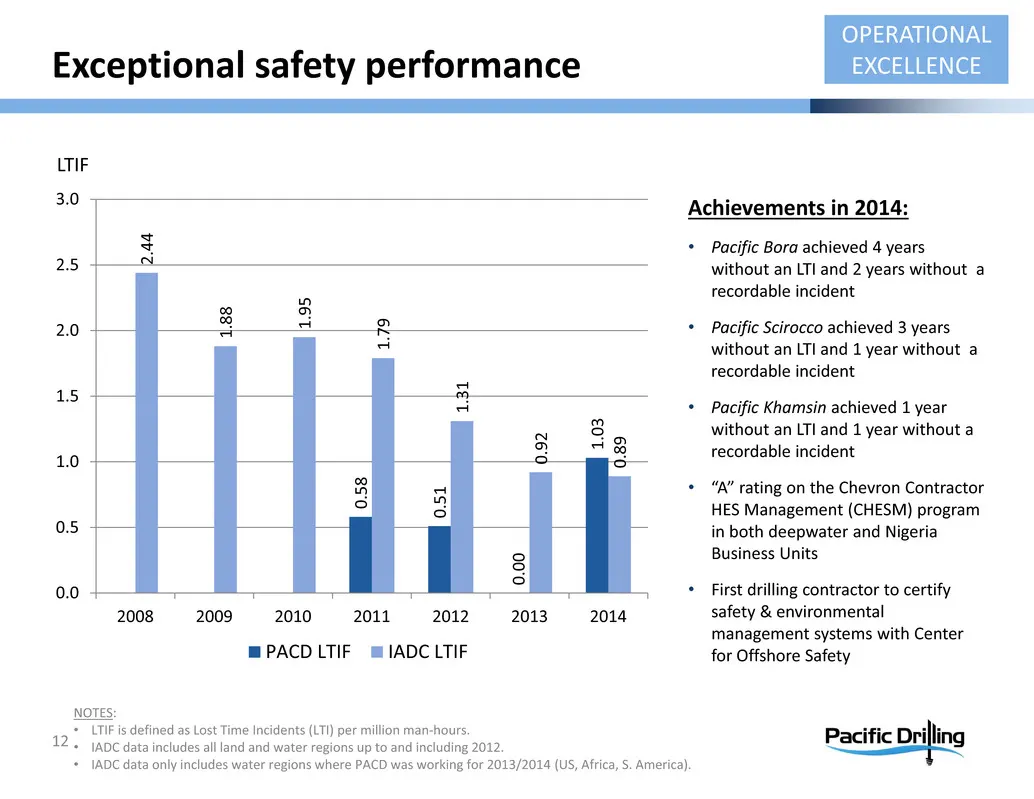
Slide 12: Exceptional safety performance
OPERATIONAL EXCELLENCE 0 . 5 8 0 . 5 1 0 . 0 0 1 . 0 3 2 . 4 4 1 . 8 8 1 . 9 5 1 . 7 9 1 . 3 1 0 . 9 2 0 . 8 9 0.0 0.5 1.0 1.5 2.0 2.5 3.0 2008 2009 2010 2011 2012 2013 2014 PACD LTIF IADC LTIF Exceptional safety performance NOTES: • LTIF is defined as Lost Time Incidents (LTI) per million man‐hours
Slide 13: Strong revenue efficiency drives financial results
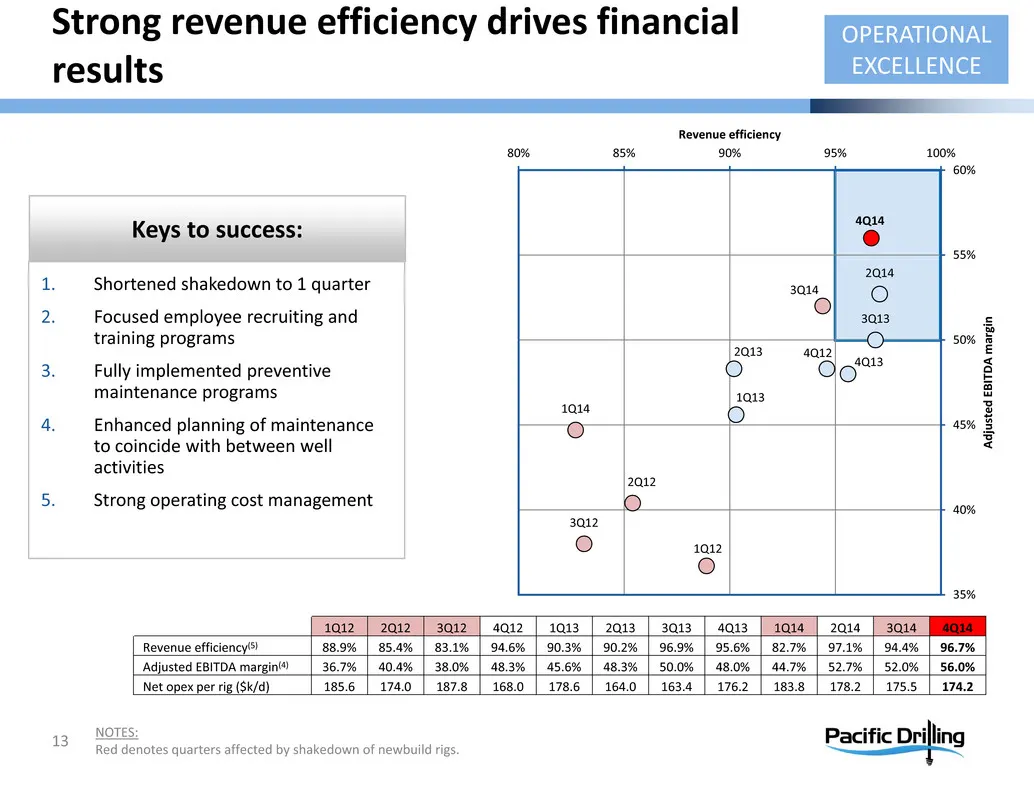
1Q12 2Q12 3Q12 4Q12 1Q13 2Q13 3Q13 4Q13 1Q14 2Q14 3Q14 4Q14 35% 40% 45% 50% 55% 60% 80% 85% 90% 95% 100% A d j u s t e d E B I T D A m a r g i n Revenue efficiency Strong revenue efficiency drives financial results 13 OPERATIONAL EXCELLENCE 1. Shortened shakedown to 1 quarter 2. Focused employee rec
Slide 14: Industry-leading adjusted EBITDA margins
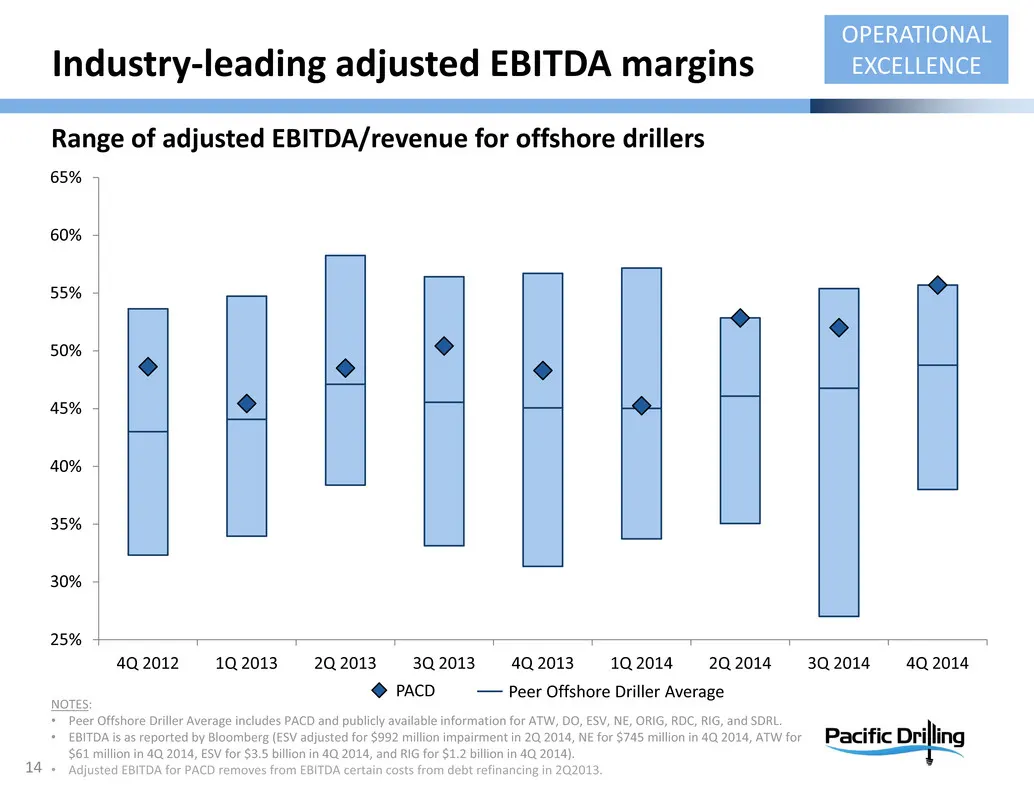
14 Industry‐leading adjusted EBITDA margins OPERATIONAL EXCELLENCE Range of adjusted EBITDA/revenue for offshore drillers 25% 30% 35% 40% 45% 50% 55% 60% 65% 4Q 2012 1Q 2013 2Q 2013 3Q 2013 4Q 2013 1Q 2014 2Q 2014 3Q 2014 4Q 2014 PACD Peer Offshore Driller Average NOTES: • Peer Offshore Driller Aver
Slide 15: Stock performance disconnected from financial performance
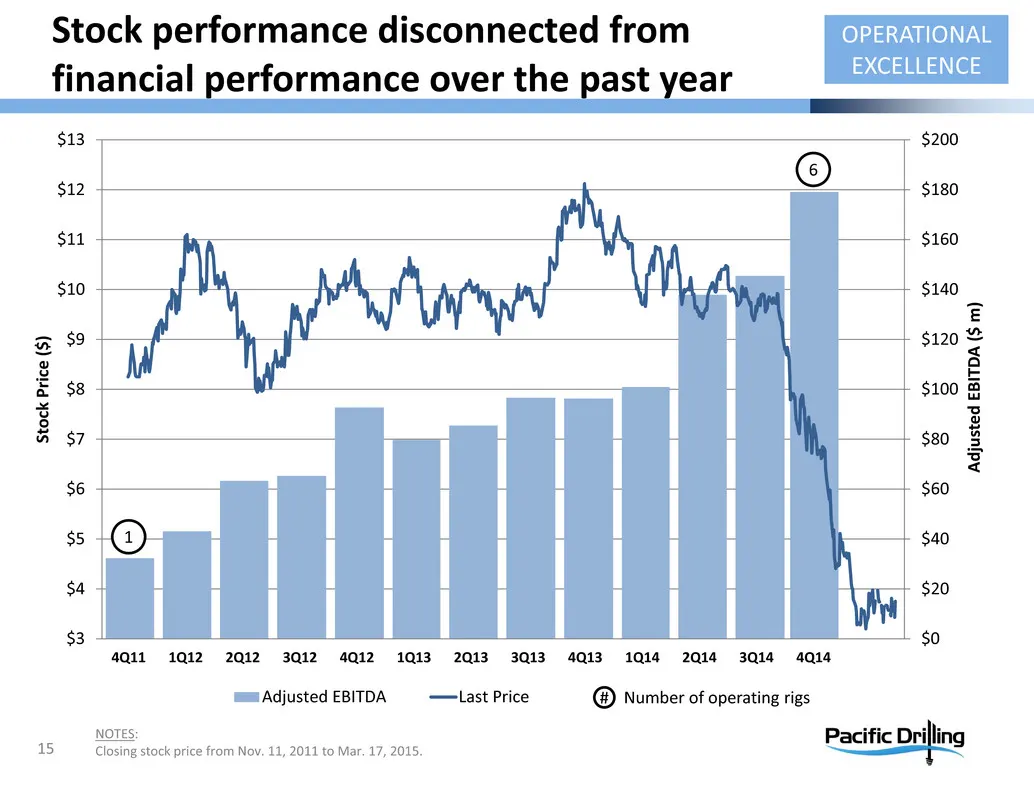
$0 $20 $40 $60 $80 $100 $120 $140 $160 $180 $200 $3 $4 $5 $6 $7 $8 $9 $10 $11 $12 $13 A d j u s t e d E B I T D A ( $ m ) S t o c k P r i c e ( $ ) Adjusted EBITDA Last Price 15 NOTES: Closing stock price from Nov. 11, 2011 to Mar. 17, 2015. OPERATIONAL EXCELLENCE Stock performance disconnected from
Slide 16: Fleet currently valued below replacement cost
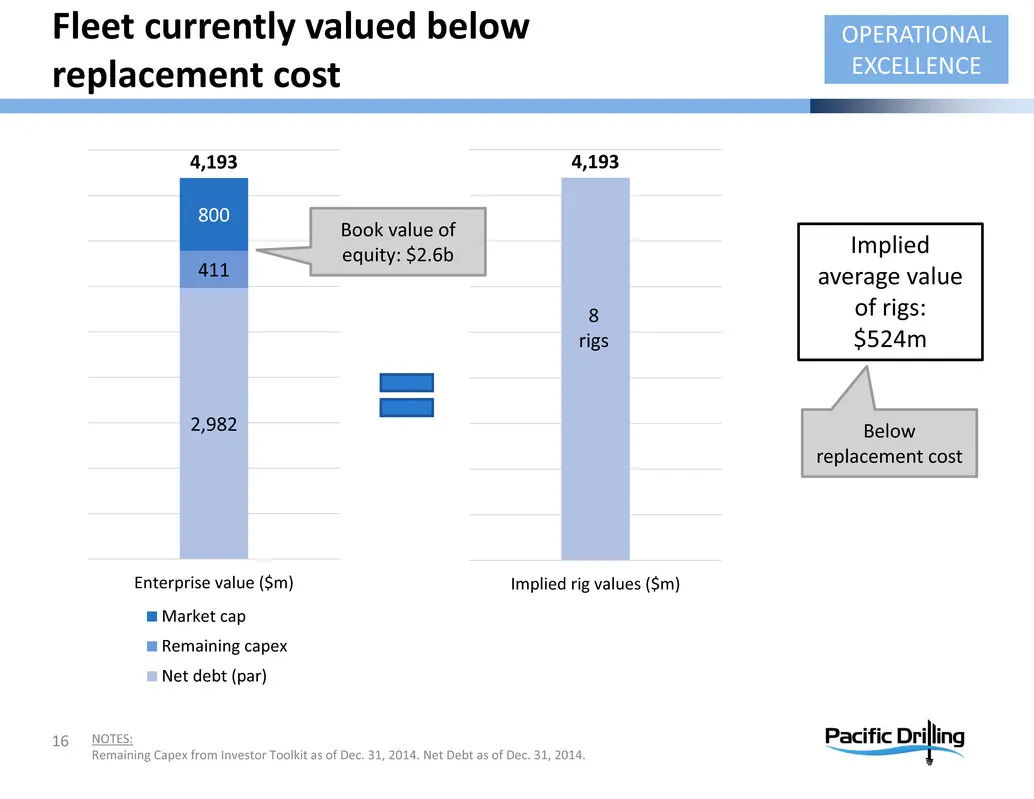
16 Fleet currently valued below replacement cost OPERATIONAL EXCELLENCE 2,982 411 800 4,193 Enterprise value ($m) Market cap Remaining capex Net debt (par) 4,193 Implied rig values ($m) Implied average value of rigs: $524m Below replacement cost NOTES: Remaining Capex from Investor Toolkit as of Dec
Slide 17: Contract coverage provides stability
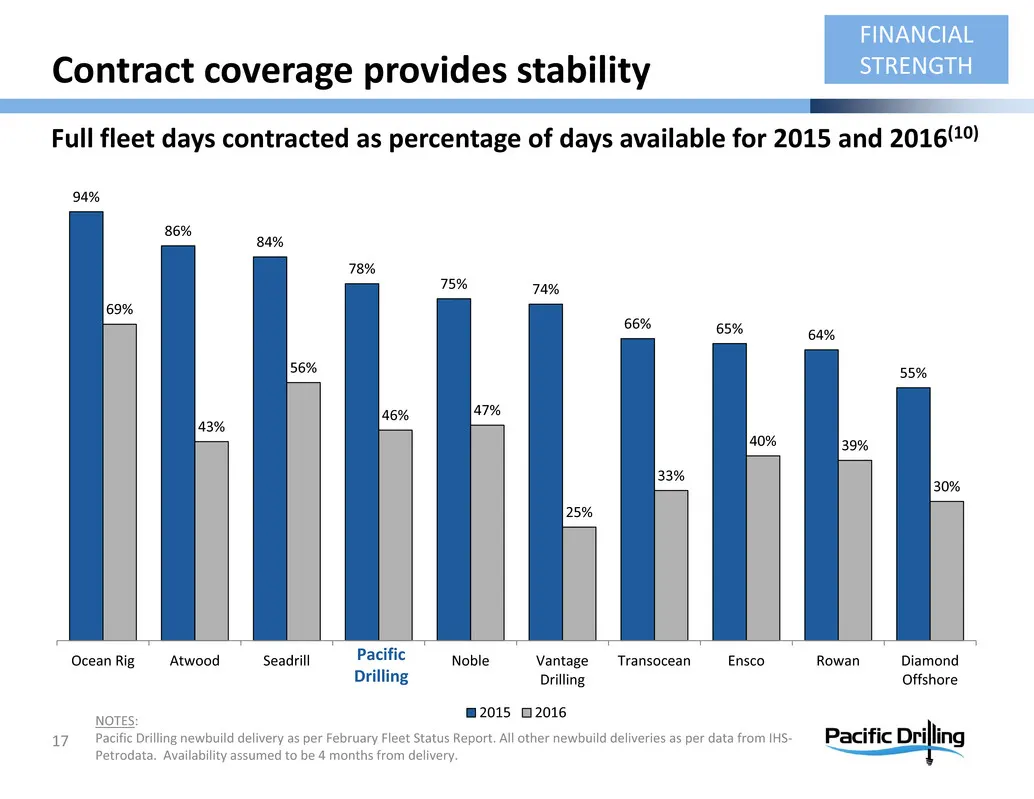
17 NOTES: Pacific Drilling newbuild delivery as per February Fleet Status Report. All other newbuild deliveries as per data from IHS‐ Petrodata. Availability assumed to be 4 months from delivery. Full fleet days contracted as percentage of days available for 2015 and 2016(10) FINANCIAL STRENGTHContr
Slide 18: Only company with exclusively high-spec floater availability
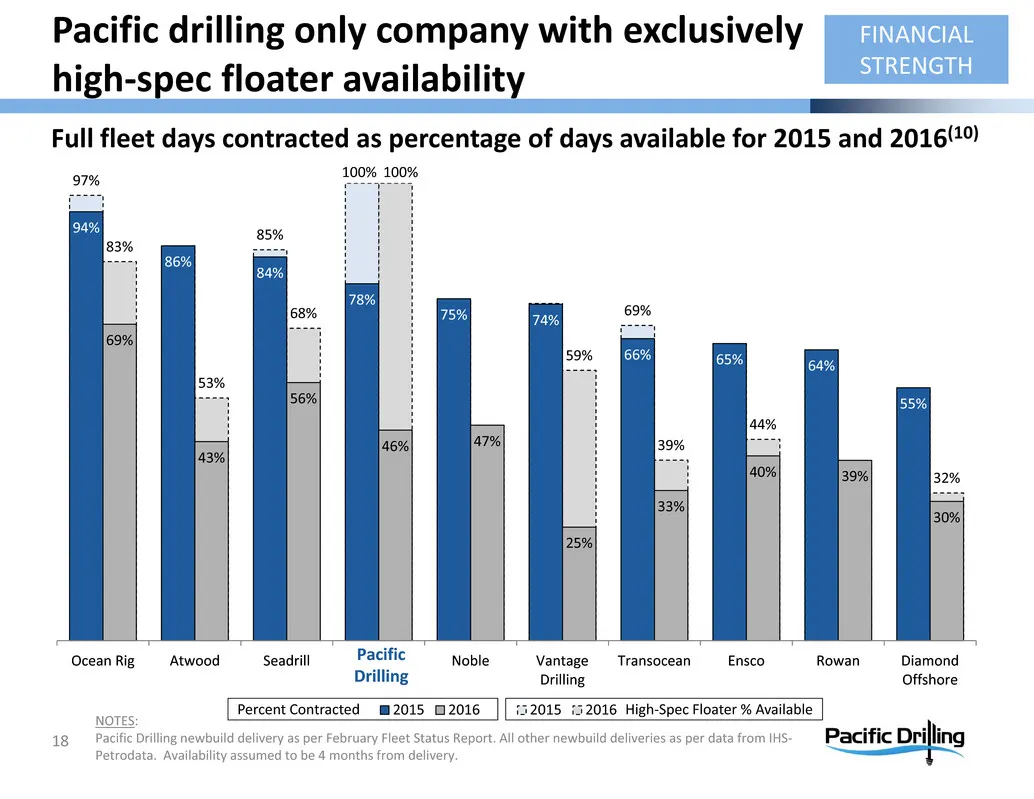
Percent Contracted High‐Spec Floater % Available 97% 85% 100% 69% 83% 53% 68% 100% 59% 39% 44% 32% Ocean Rig Atwood Seadrill Noble Vantage Drilling Transocean Ensco Rowan Diamond Offshore 2015 2016 Pacific Drilling 94% 86% 84% 78% 75% 74% 66% 65% 64% 55% 69% 43% 56% 46% 47% 25% 33% 40% 39% 30% 2015
Slide 19: $2.3 billion contract backlog
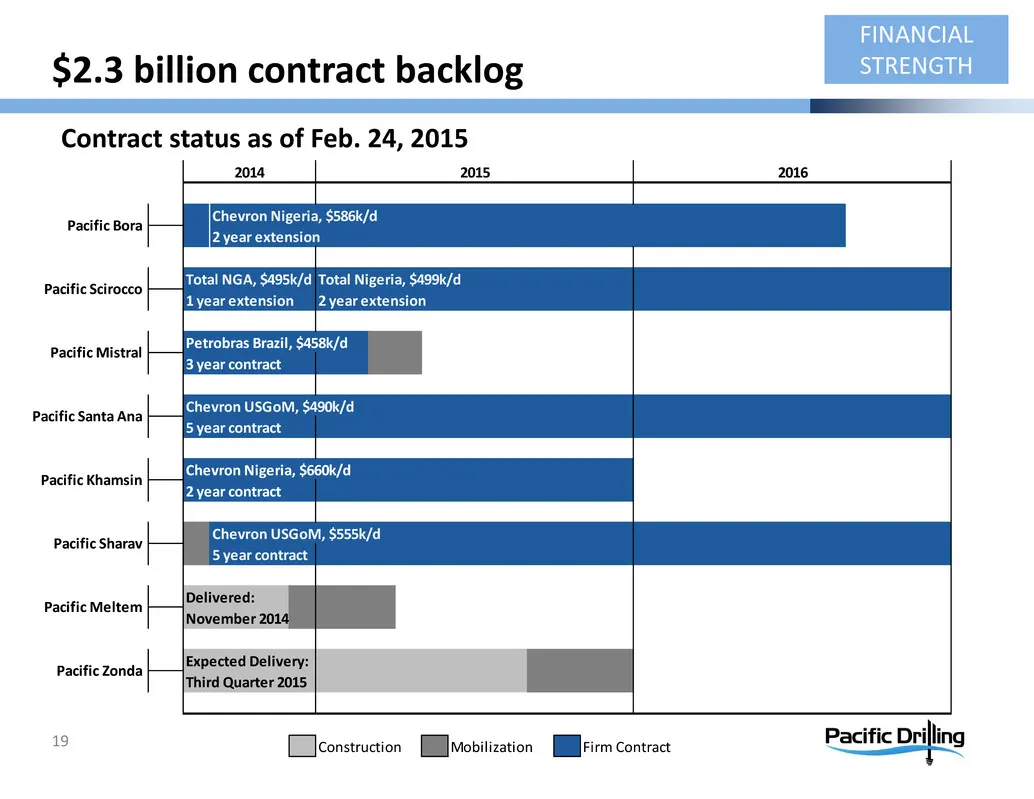
$2.3 billion contract backlog 19 Contract status as of Feb. 24, 2015 FINANCIAL STRENGTH Total NGA, $495k/d 1 year extension Petrobras Brazil, $458k/d 3 year contract Chevron USGoM, $490k/d 5 year contract Chevron Nigeria, $660k/d 2 year contract Chevron USGoM, $555k/d 5 year contract Delivered: Nove
Slide 20: Cash requirements through end of 2016 covered
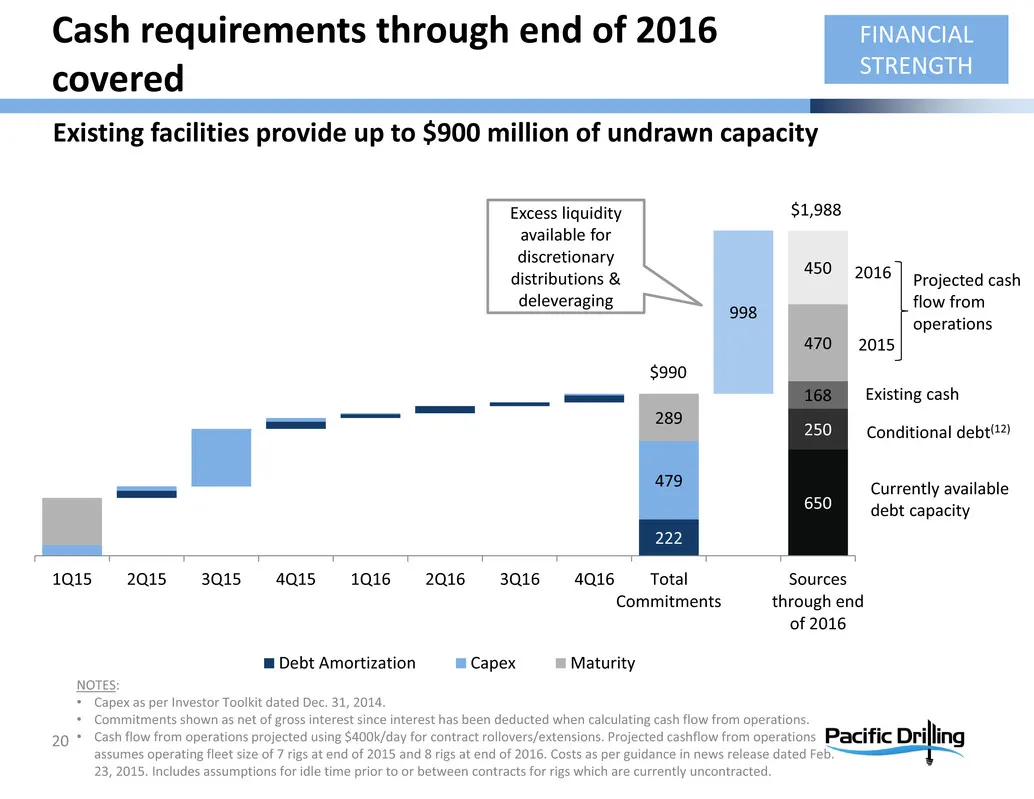
Cash requirements through end of 2016 covered 20 650 222 250 479 168 289 470 998 450 1Q15 2Q15 3Q15 4Q15 1Q16 2Q16 3Q16 4Q16 Total Commitments Sources through end of 2016 Debt Amortization Capex Maturity FINANCIAL STRENGTH NOTES: • Capex as per Investor Toolkit dated Dec. 31, 2014. • Commitments sho
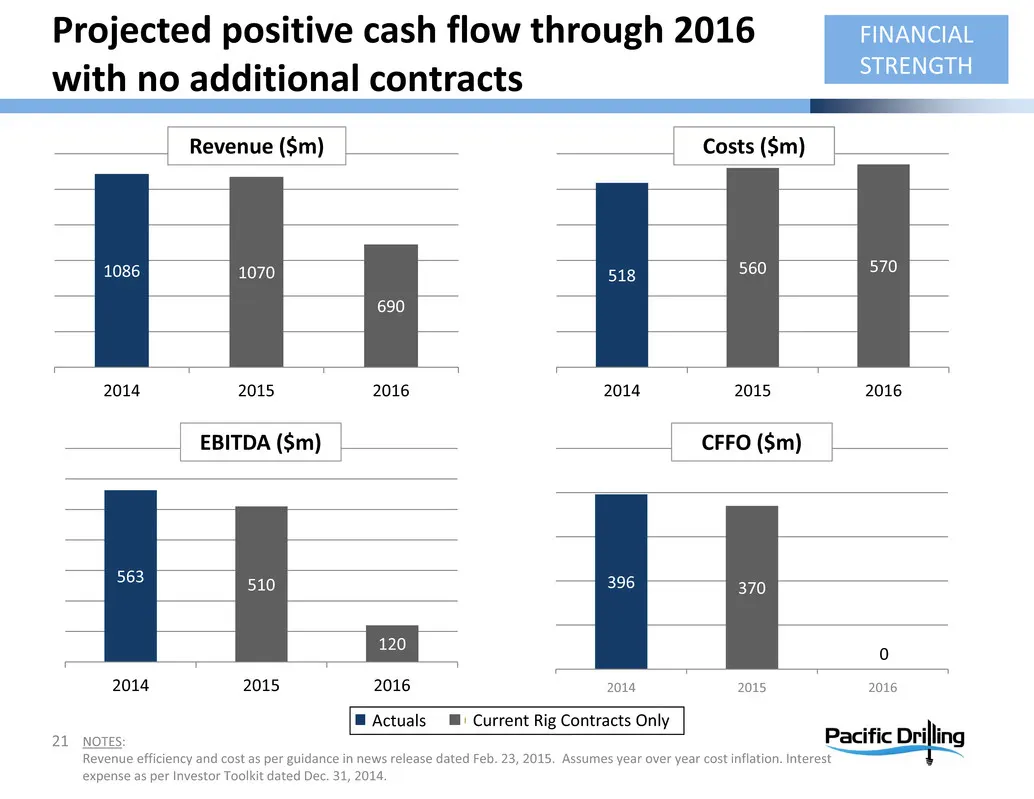
Slide 21: Projected positive cash flow through 2016 with no additional contracts
21 Projected positive cash flow through 2016 with no additional contracts FINANCIAL STRENGTH 1086 1070 690 2014 2015 2016 518 560 570 2014 2015 2016 563 510 120 2014 2015 2016 EBITDA ($m) 396 370 0 2014 2015 2016 CFFO ($m) Costs ($m)Revenue ($m) Actuals Current Rig Contracts Only NOTES: Revenue effi
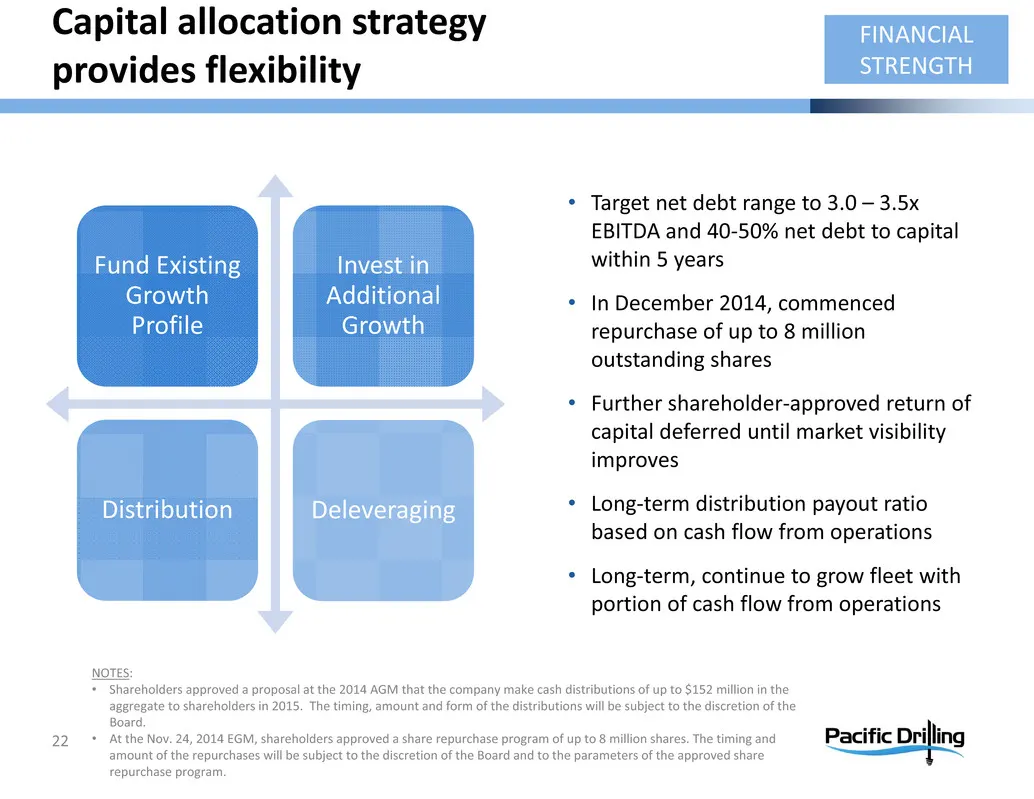
Slide 22: Capital allocation strategy provides flexibility
Capital allocation strategy provides flexibility 22 Fund Existing Growth Profile Invest in Additional Growth Distribution Deleveraging • Target net debt range to 3.0 – 3.5x EBITDA and 40‐50% net debt to capital within 5 years • In December 2014, commenced repurchase of up to 8 million outstanding sh
Slide 23: Questions
23 Questions
Slide 24: Investor contact
Investor contact Pacific Drilling Amy Roddy VP Investor Relations & Communications 11700 Katy Freeway Suite 175 Houston, Texas 77079 USA Phone: +1 832‐255‐0502 Email: [email protected] www.pacificdrilling.com 24
Slide 25: Footnotes
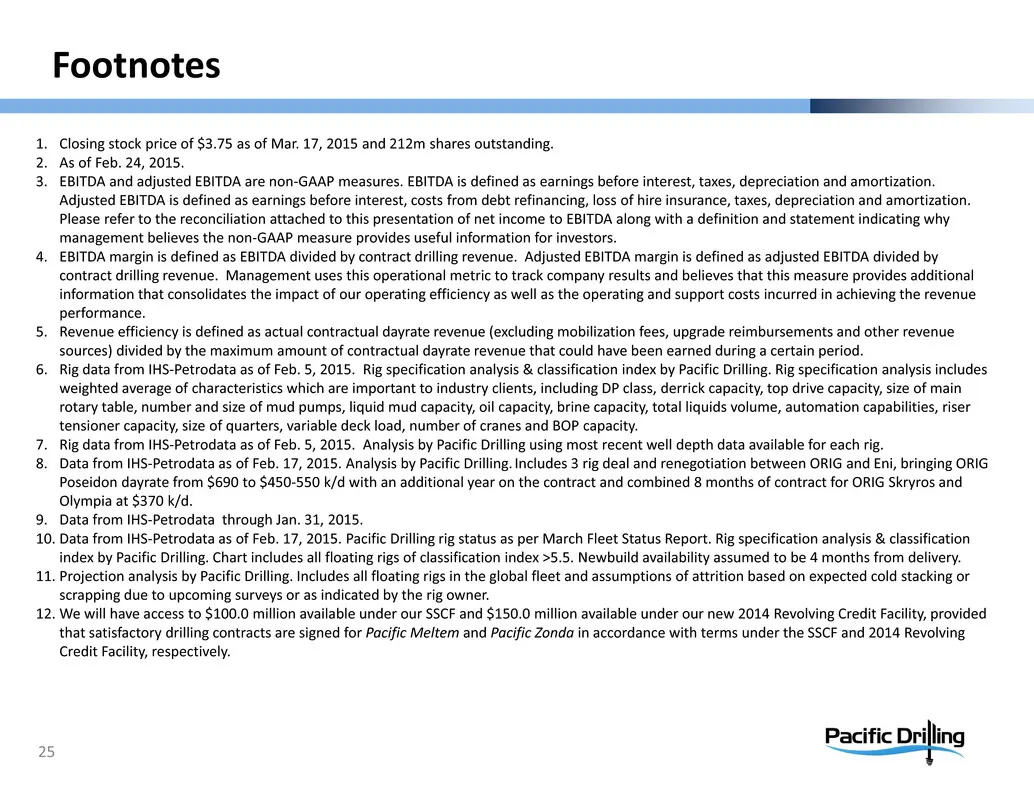
Footnotes 25 1. Closing stock price of $3.75 as of Mar. 17, 2015 and 212m shares outstanding. 2. As of Feb. 24, 2015. 3. EBITDA and adjusted EBITDA are non‐GAAP measures. EBITDA is defined as earnings before interest, taxes, depreciation and amortization. Adjusted EBITDA is defined as earnings befor
Slide 26: Income Statement
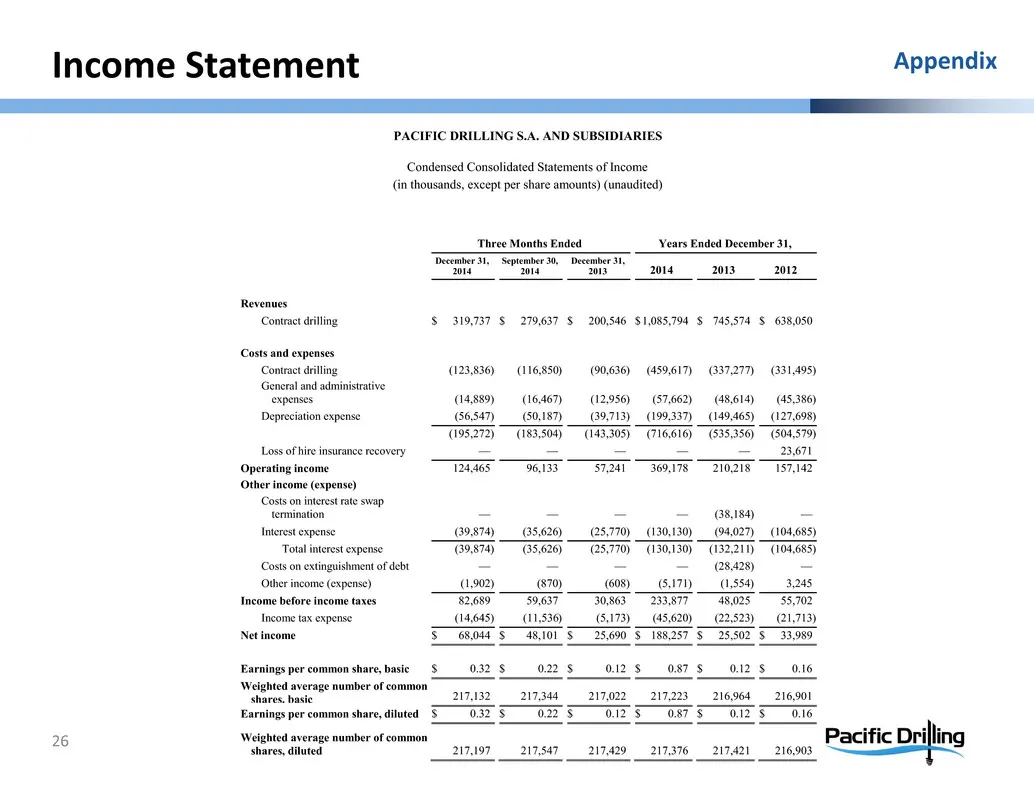
Income Statement 26 Appendix PACIFIC DRILLING S.A. AND SUBSIDIARIES Condensed Consolidated Statements of Income (in thousands, except per share amounts) (unaudited) Three Months Ended Years Ended December 31, December 31, 2014 September 30, 2014 December 31, 2013 2014 2013 2012 Revenues Contract dri
Slide 27: Balance sheet
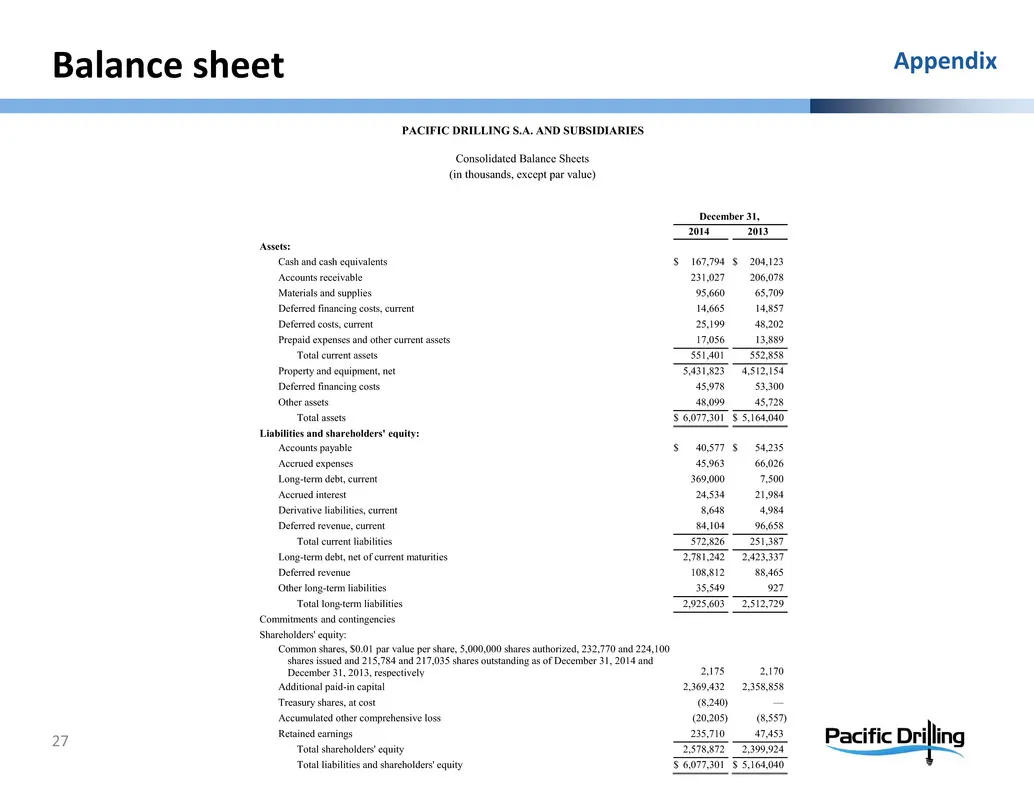
Balance sheet 27 Appendix PACIFIC DRILLING S.A. AND SUBSIDIARIES Consolidated Balance Sheets (in thousands, except par value) December 31, 2014 2013 Assets: Cash and cash equivalents $ 167,794 $ 204,123 Accounts receivable 231,027 206,078 Materials and supplies 95,660 65,709 Deferred financing costs
Slide 28: Cash flow statement
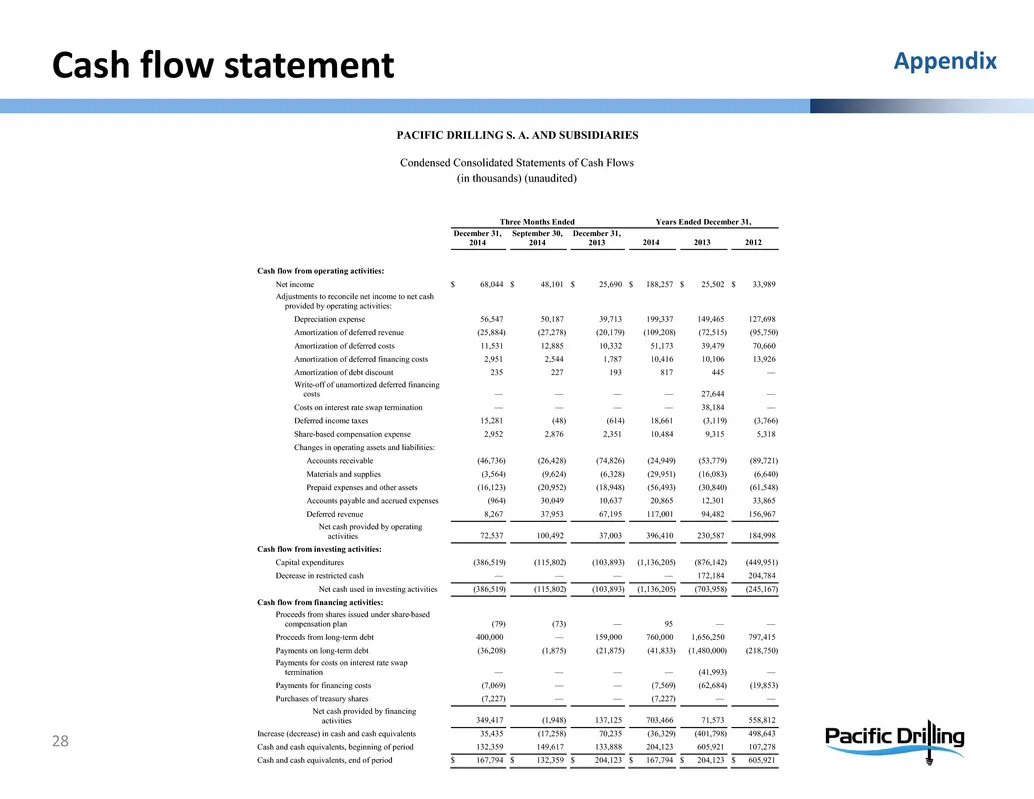
Cash flow statement 28 Appendix PACIFIC DRILLING S. A. AND SUBSIDIARIES Condensed Consolidated Statements of Cash Flows (in thousands) (unaudited) Three Months Ended Years Ended December 31, December 31, 2014 September 30, 2014 December 31, 2013 2014 2013 2012 Cash flow from operating activities: Ne
Slide 29: EBITDA reconciliation
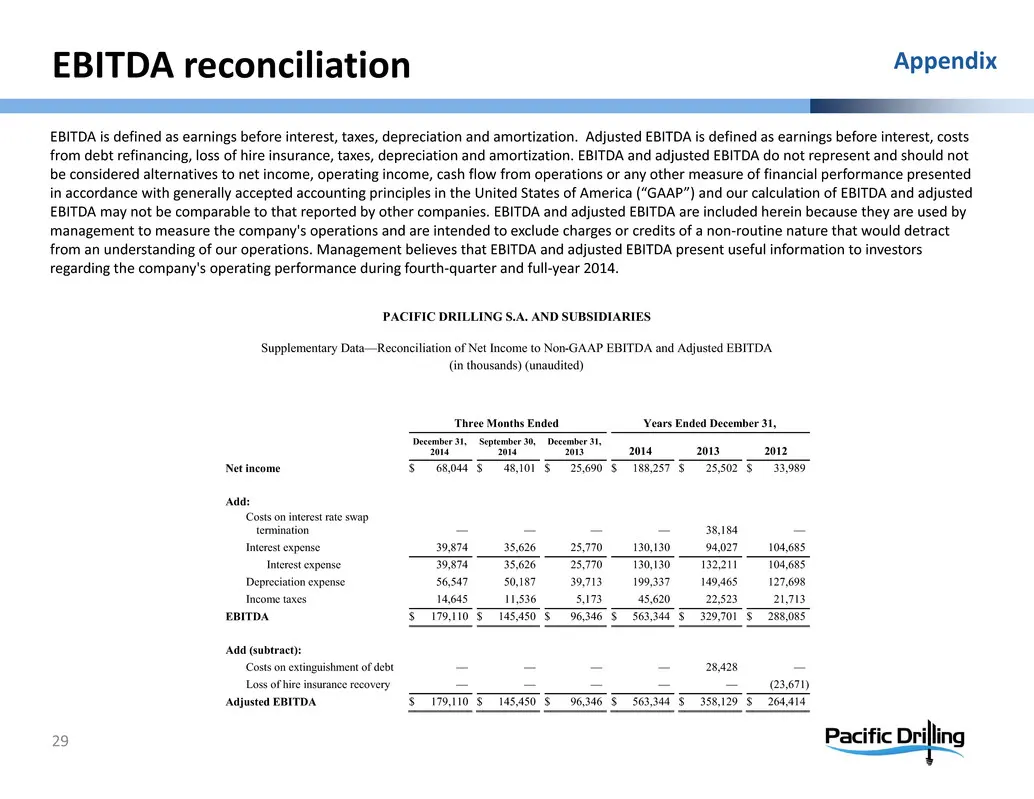
EBITDA reconciliation 29 Appendix EBITDA is defined as earnings before interest, taxes, depreciation and amortization. Adjusted EBITDA is defined as earnings before interest, costs from debt refinancing, loss of hire insurance, taxes, depreciation and amortization. EBITDA and adjusted EBITDA do not
Slide 30: Net income excluding charges reconciliation
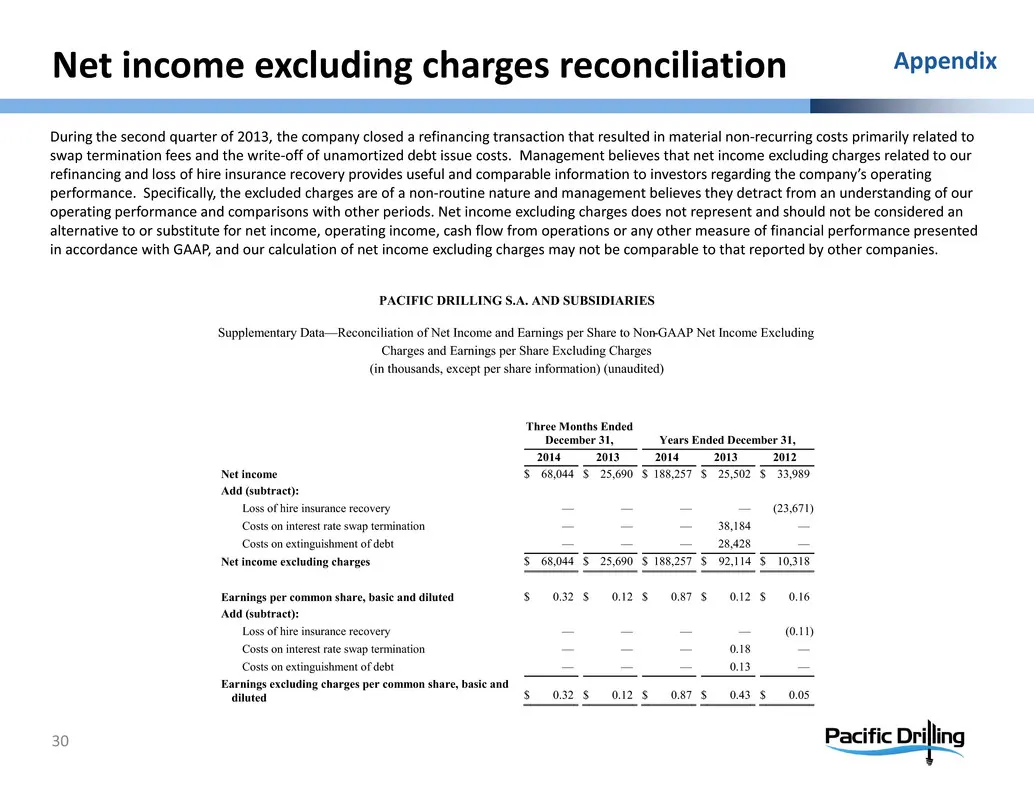
Net income excluding charges reconciliation 30 Appendix During the second quarter of 2013, the company closed a refinancing transaction that resulted in material non‐recurring costs primarily related to swap termination fees and the write‐off of unamortized debt issue costs. Management believes that
Slide 31: Financial covenants in our credit facilities post-amendment
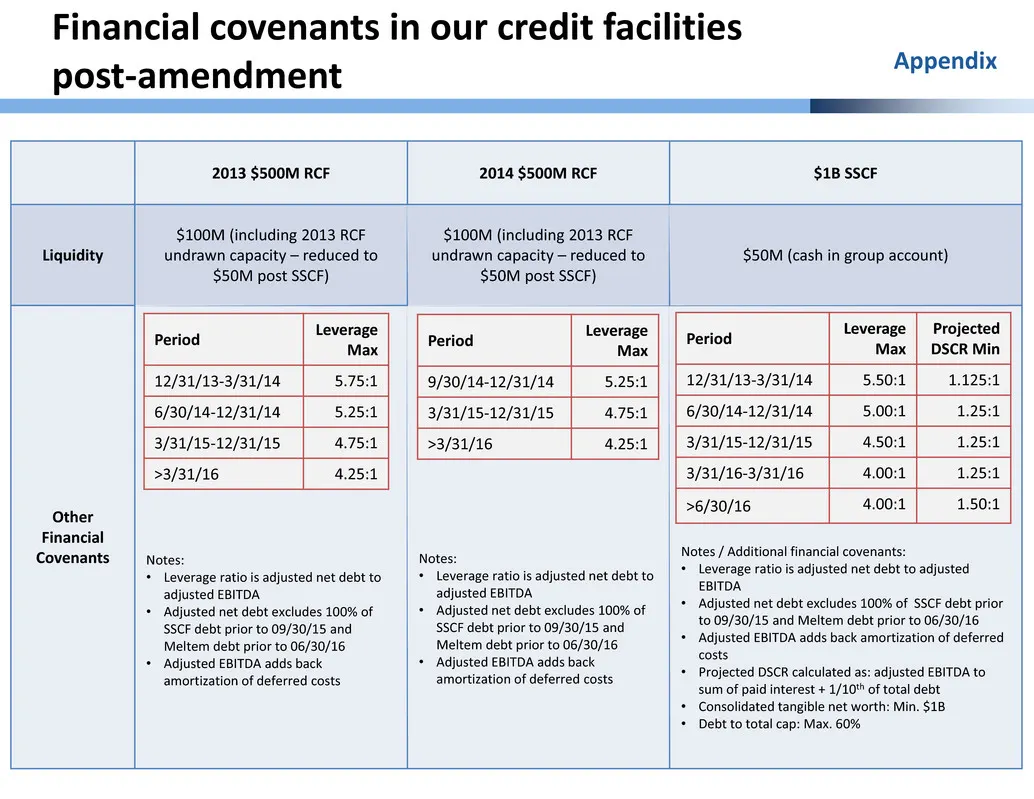
Financial covenants in our credit facilities post‐amendment 31 2013 $500M RCF 2014 $500M RCF $1B SSCF Liquidity $100M (including 2013 RCF undrawn capacity – reduced to $50M post SSCF) $100M (including 2013 RCF undrawn capacity – reduced to $50M post SSCF) $50M (cash in group account) Other Financial
Slide 32: Historical financial covenant calculation: net debt/adjusted EBITDA
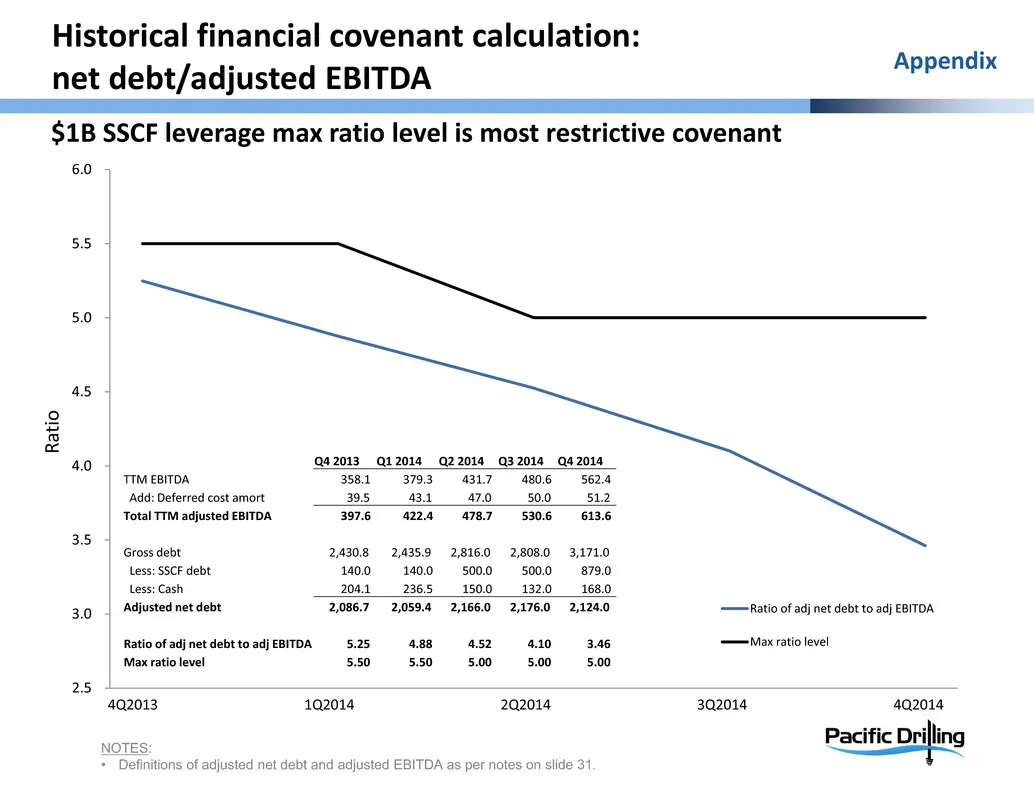
Historical financial covenant calculation: net debt/adjusted EBITDA 2.5 3.0 3.5 4.0 4.5 5.0 5.5 6.0 Ratio of adj net debt to adj EBITDA Max ratio level Q4 2013 Q1 2014 Q2 2014 Q3 2014 Q4 2014 TTM EBITDA 358.1 379.3 431.7 480.6 562.4 Add: Deferred cost amort 39.5 43.1 47.0 50.0 51.2 Total TTM adjuste
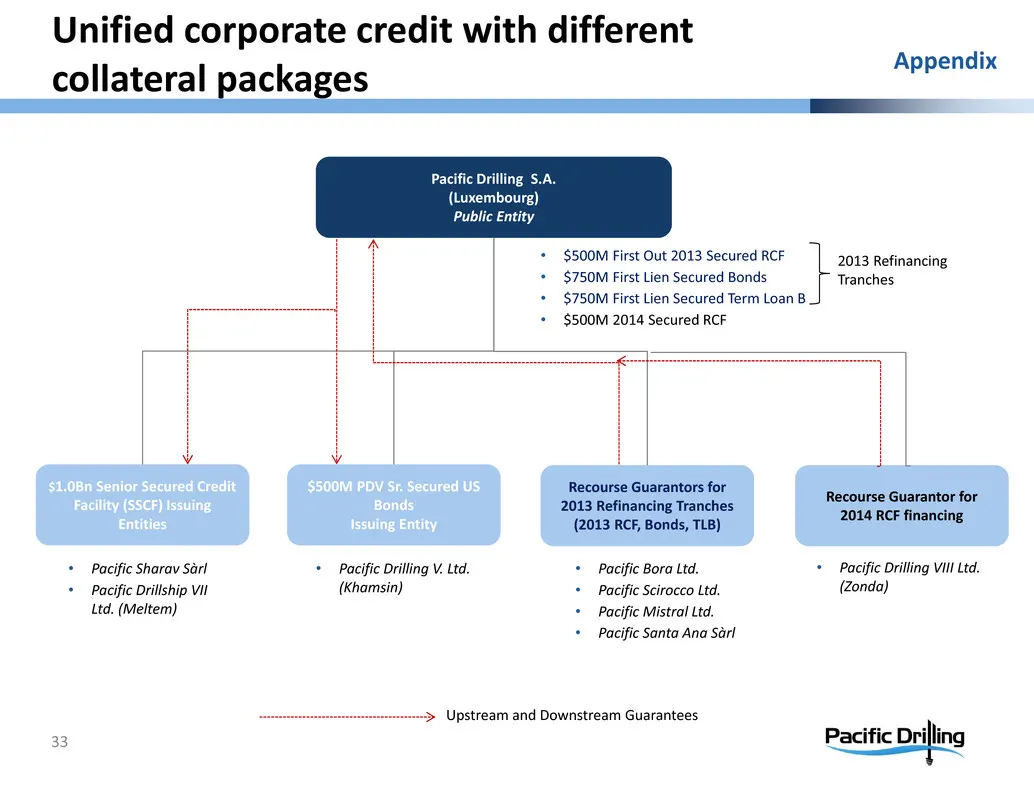
Slide 33: Upstream and Downstream Guarantees
Upstream and Downstream Guarantees Pacific Drilling S.A. (Luxembourg) Public Entity $1.0Bn Senior Secured Credit Facility (SSCF) Issuing Entities $500M PDV Sr. Secured US Bonds Issuing Entity Recourse Guarantors for 2013 Refinancing Tranches (2013 RCF, Bonds, TLB) • Pacific Sharav Sàrl • Pacific Dri
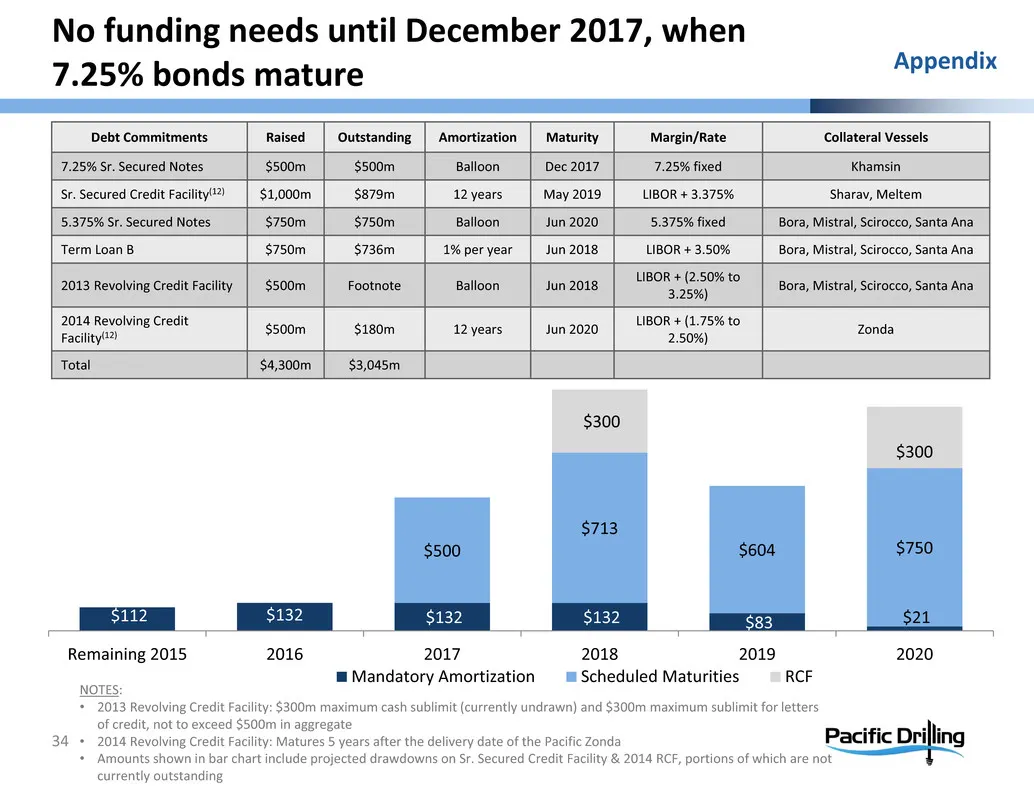
Slide 34: Debt maturity and facilities overview
$112 $132 $132 $132 $83 $21 $500 $713 $604 $750 $300 $300 Remaining 2015 2016 2017 2018 2019 2020 Mandatory Amortization Scheduled Maturities RCF Debt Commitments Raised Outstanding Amortization Maturity Margin/Rate Collateral Vessels 7.25% Sr. Secured Notes $500m $500m Balloon Dec 2017 7.25% fixed
Source: SEC EDGAR · 6-K filed Mar 24, 2015
More decks from Pacific Drilling S.A.
 Investor Presentation (November 2020)38 slides · Nov 2, 2020
 Corporate Update (November 2020)10 slides · Nov 2, 2020
 Presentation (July 2018)19 slides · Jul 17, 2018
 Merger or Acquisition (June 2018)8 slides · Jun 25, 2018
 IPO Roadshow (June 2018)6 slides · Jun 18, 2018
 Presentation (June 2018)15 slides · Jun 18, 2018