Gold Banc — Howe Barnes 7th Annual Community Bank Conference 2002
7 slides from Gold Banc's conference presentation, Jun 19, 2002
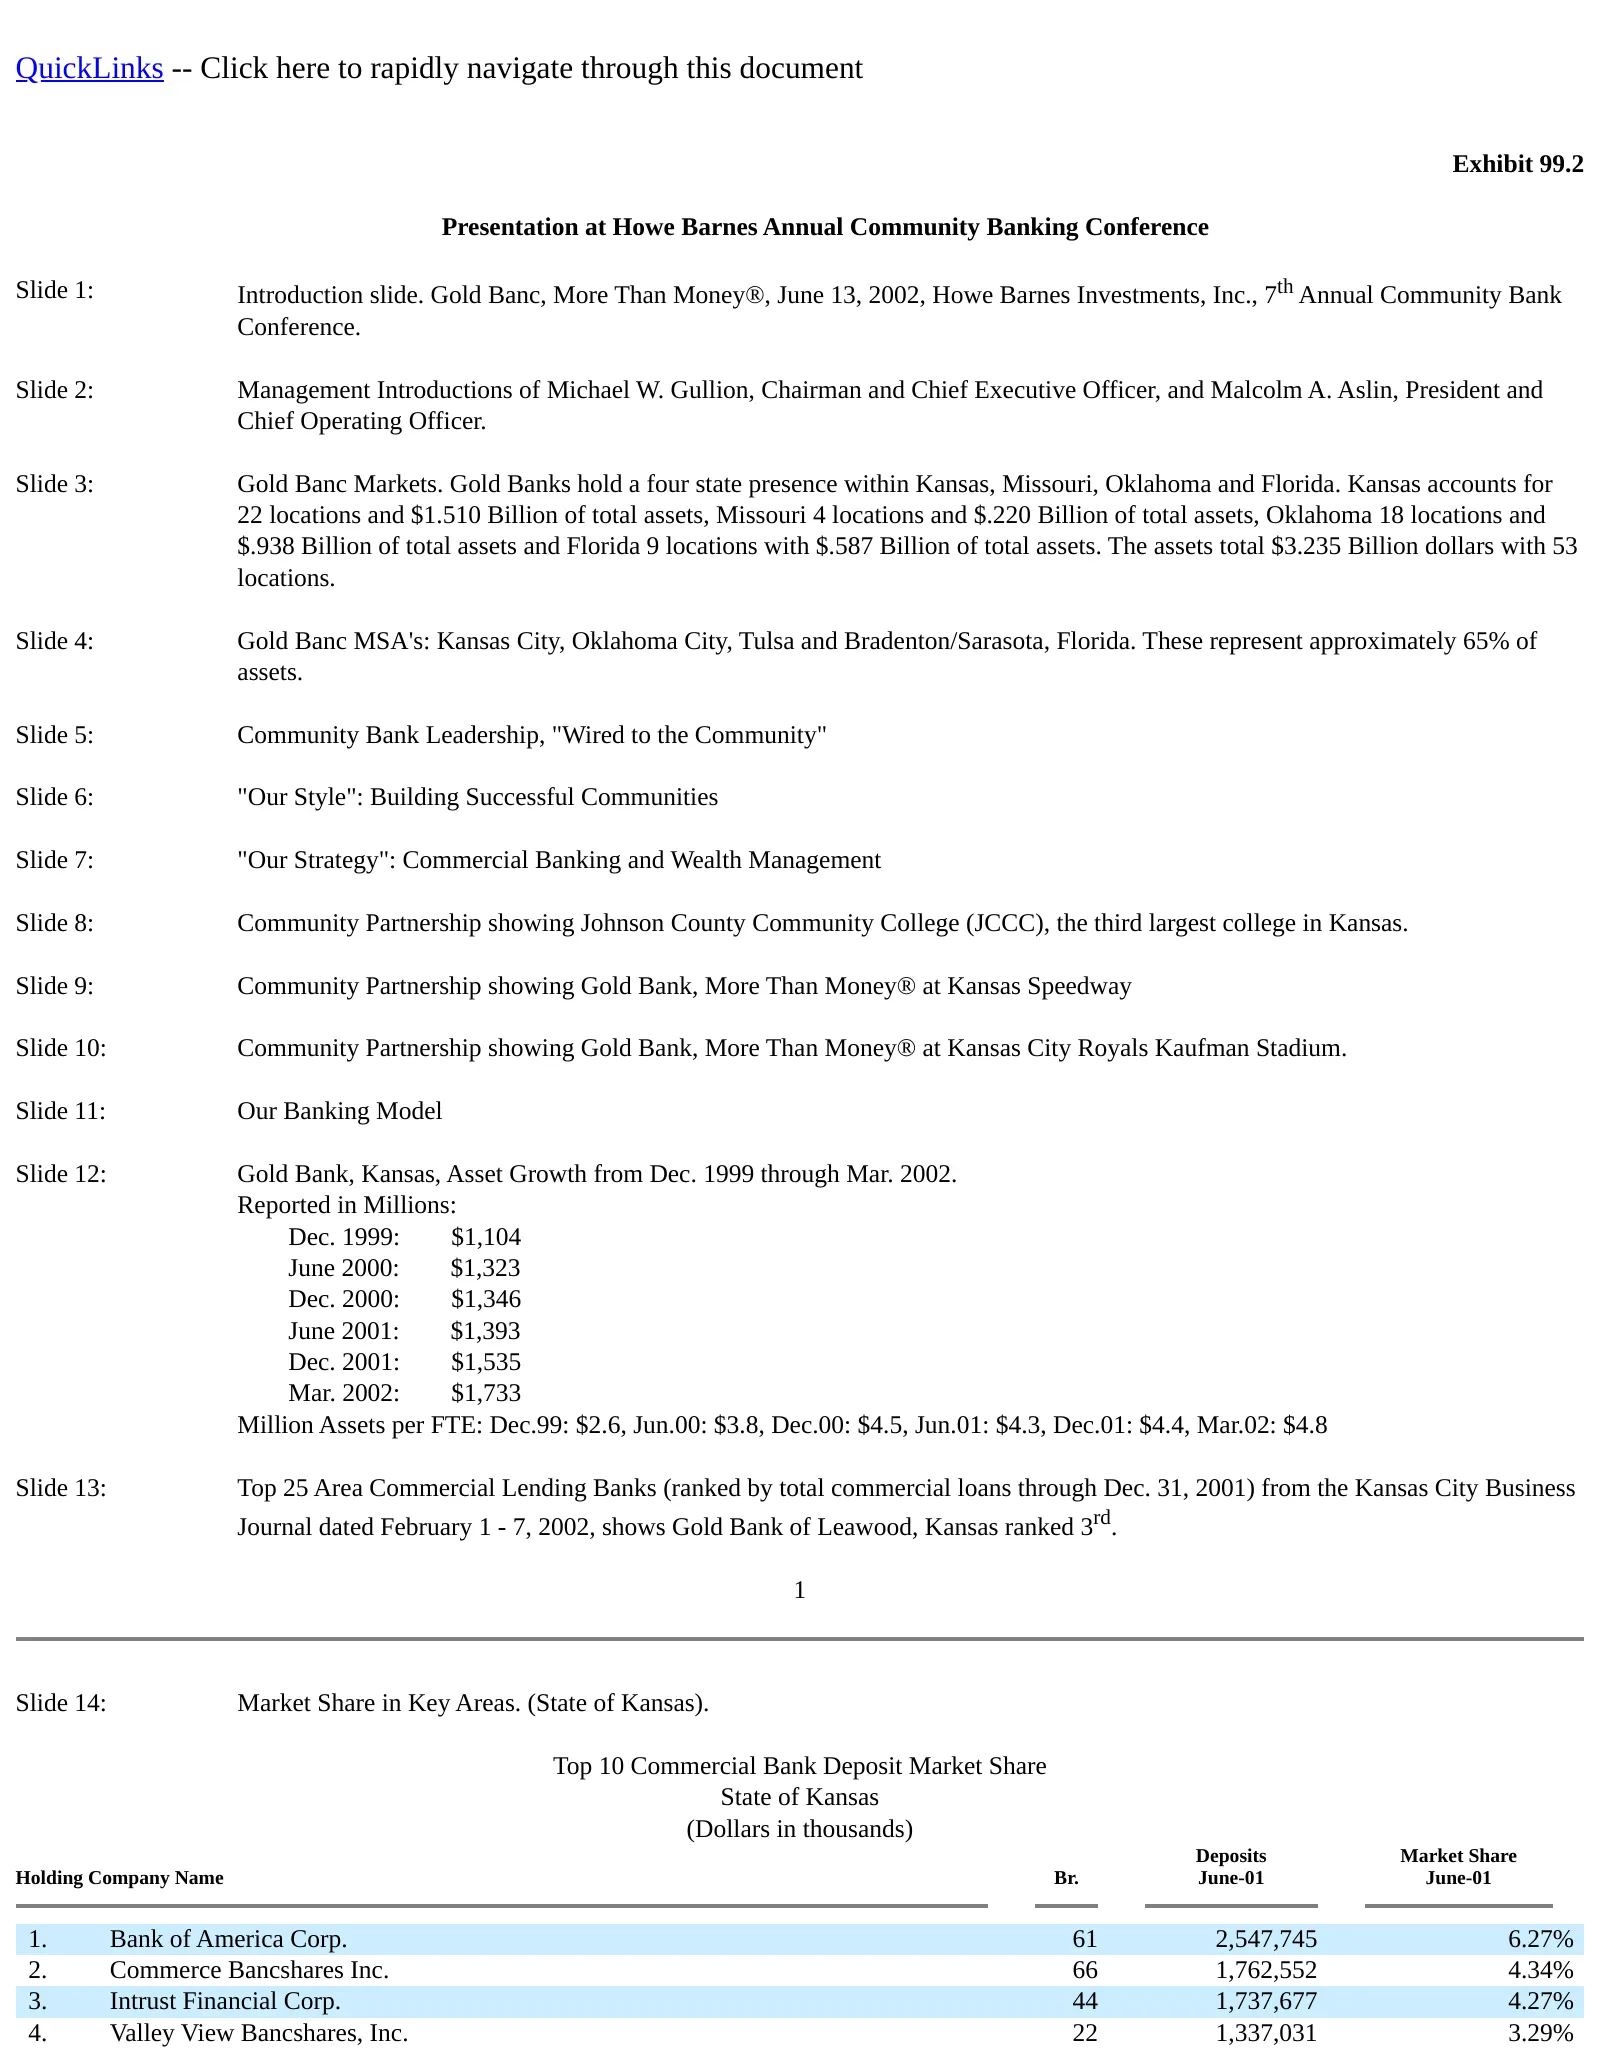
Slide 1: Presentation at Howe Barnes Annual Community Banking Conference
QuickLinks -- Click here to rapidly navigate through this document Exhibit 99.2 Presentation at Howe Barnes Annual Community Banking Conference Slide 1: Introduction slide. Gold Banc, More Than Money®, June 13, 2002, Howe Barnes Investments, Inc., 7th Annual Community Bank Conference. Slide 2: Manag
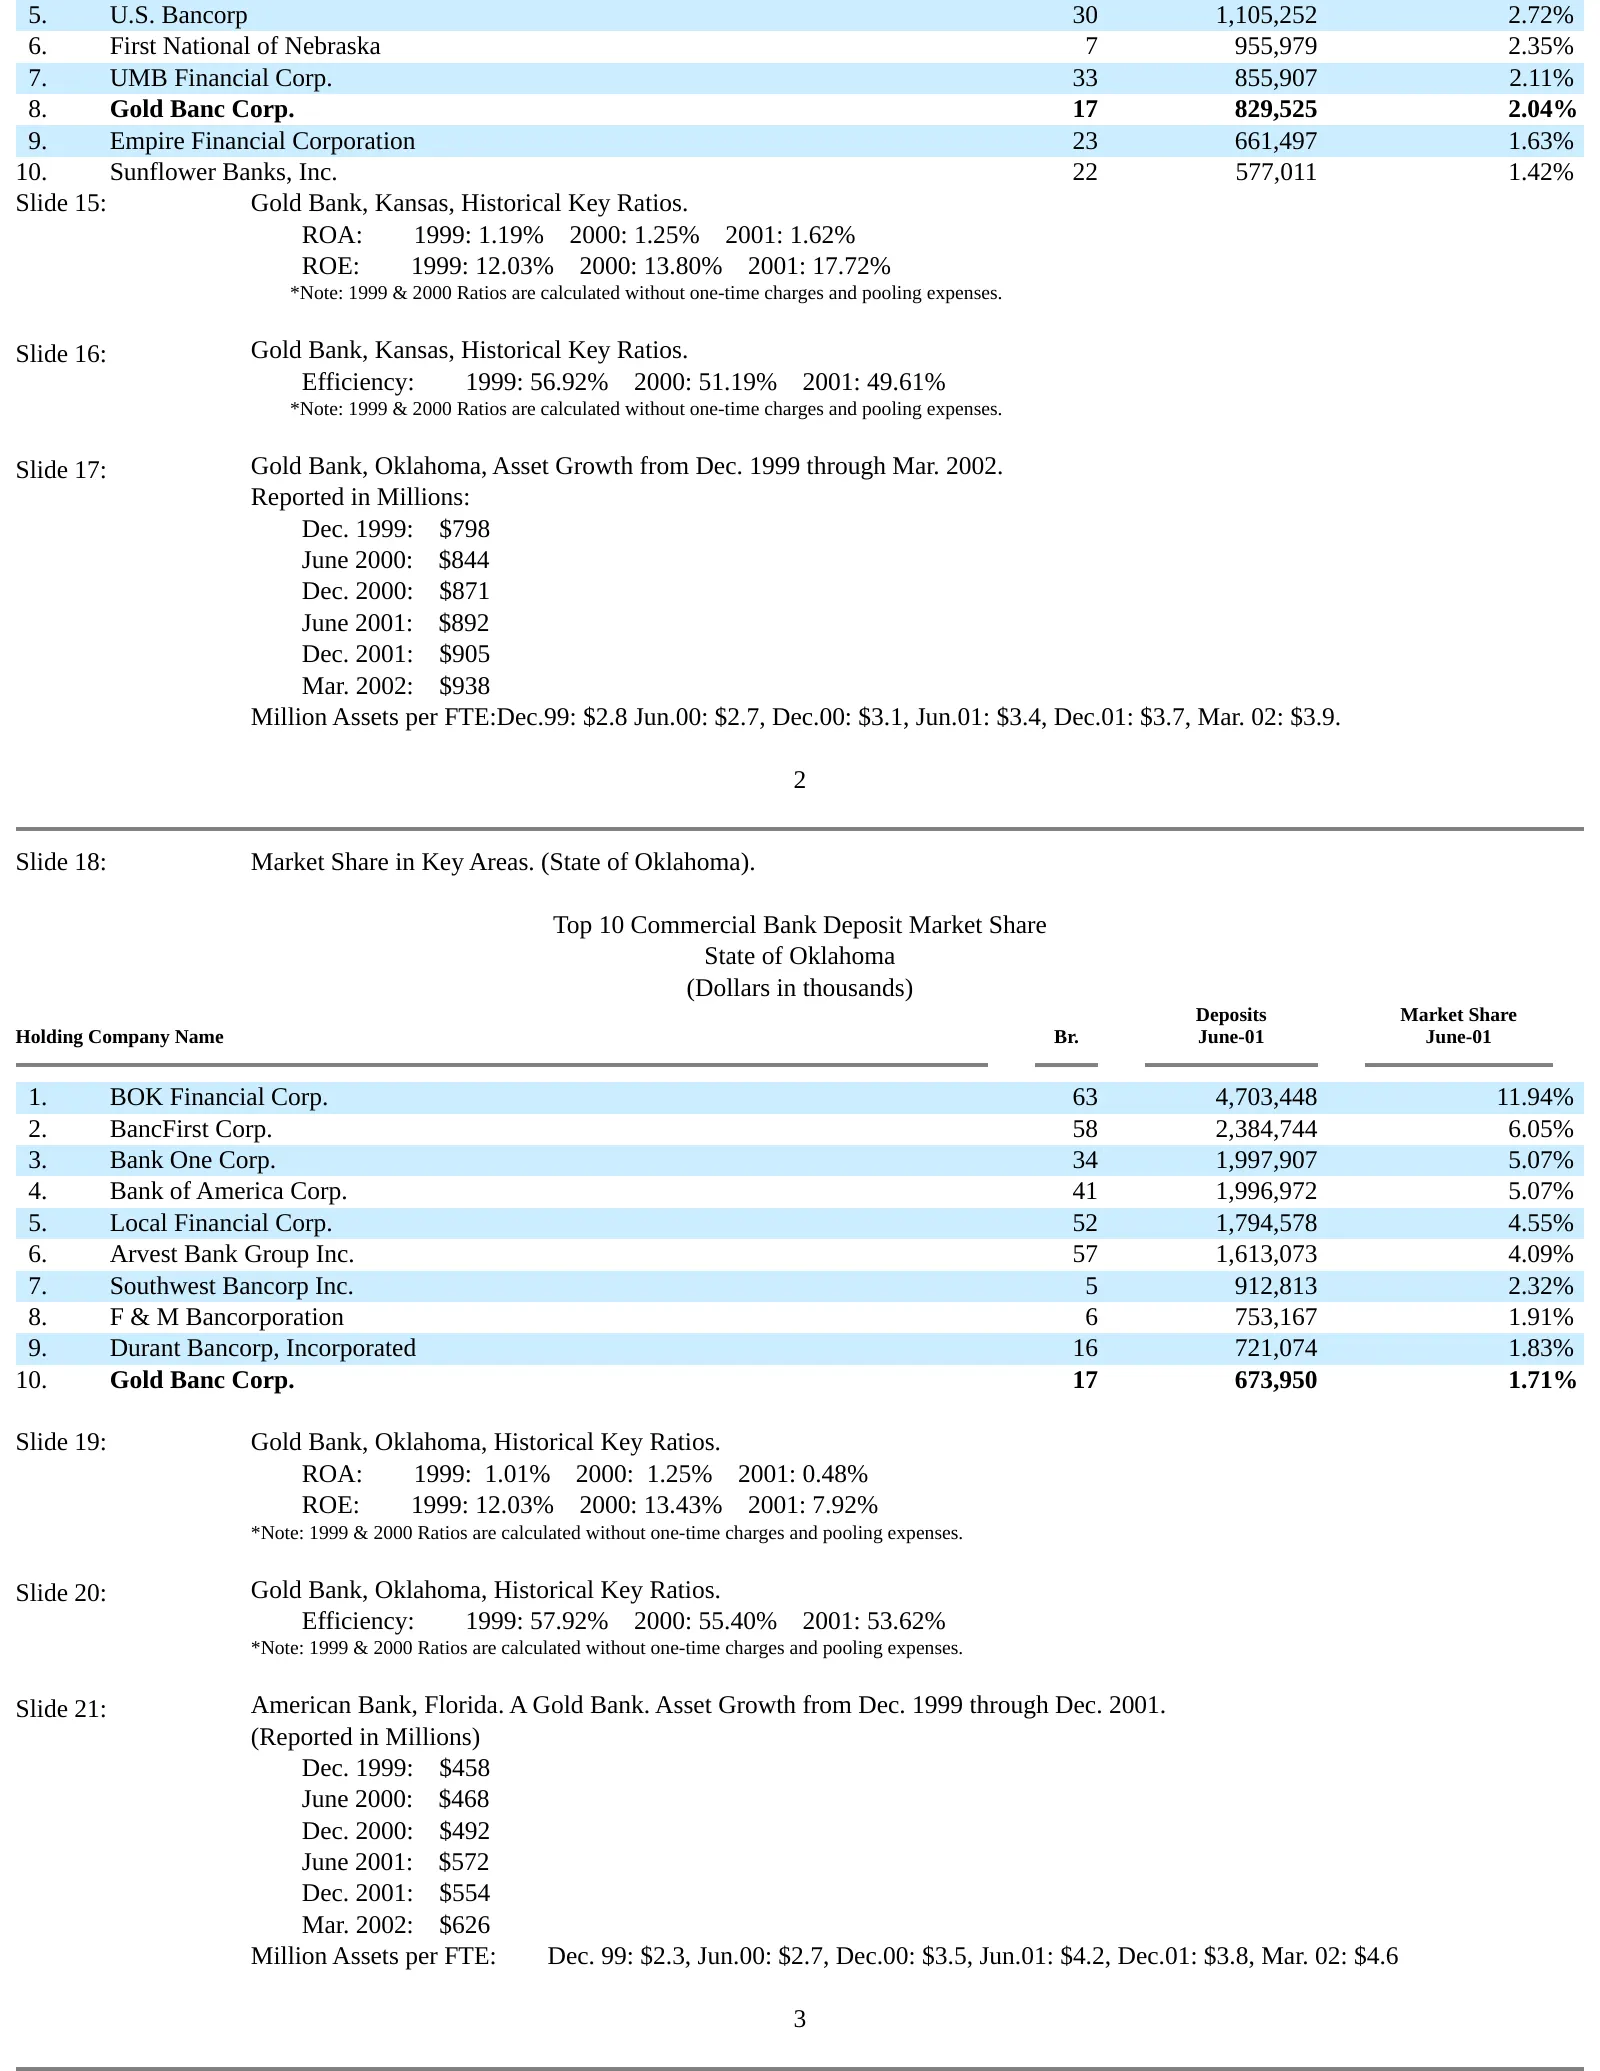
Slide 2: Market share and key ratios: Kansas and Oklahoma
5. U.S. Bancorp 30 1,105,252 2.72% 6. First National of Nebraska 7 955,979 2.35% 7. UMB Financial Corp. 33 855,907 2.11% 8. Gold Banc Corp. 17 829,525 2.04% 9. Empire Financial Corporation 23 661,497 1.63% 10. Sunflower Banks, Inc. 22 577,011 1.42% Slide 15: Gold Bank, Kansas, Historical Key Ratios.
Slide 3: Florida market share and American Bank key ratios
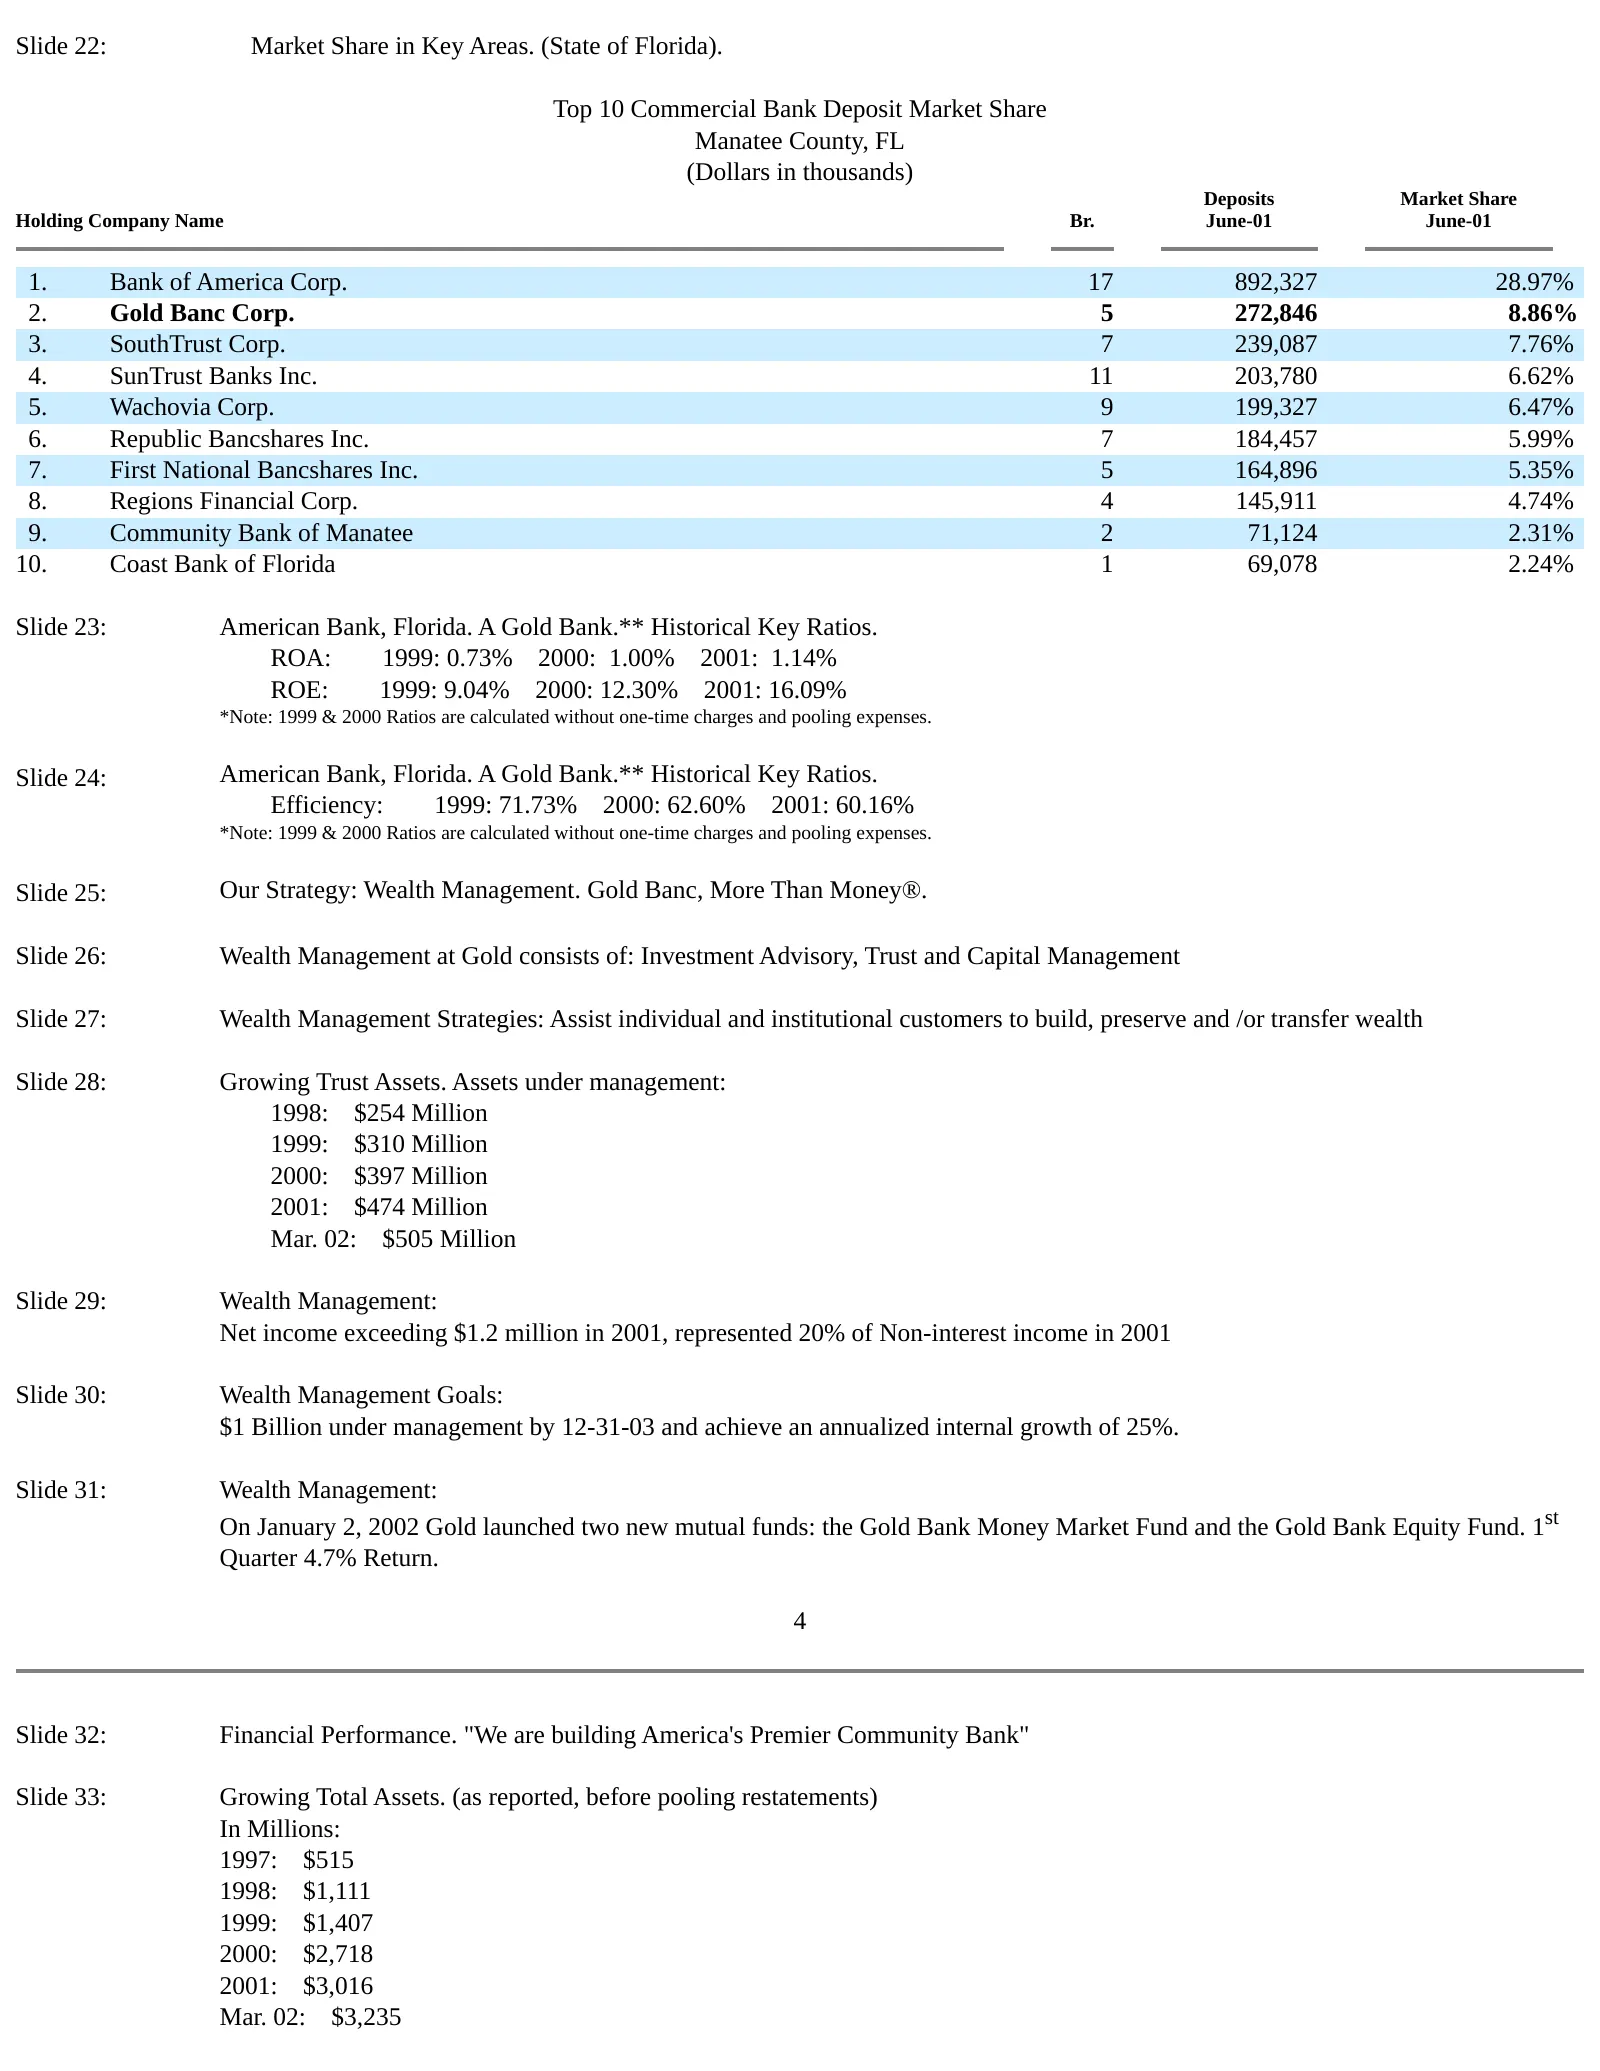
Slide 22: Market Share in Key Areas. (State of Florida). Top 10 Commercial Bank Deposit Market Share Manatee County, FL (Dollars in thousands) Deposits Market Share Holding Company Name Br. June-01 June-01 1. Bank of America Corp. 17 892,327 28.97% 2. Gold Banc Corp. 5 272,846 8.86% 3. SouthTrust Co
Slide 4: Financial performance: growth, EPS, return on equity and peer comparison
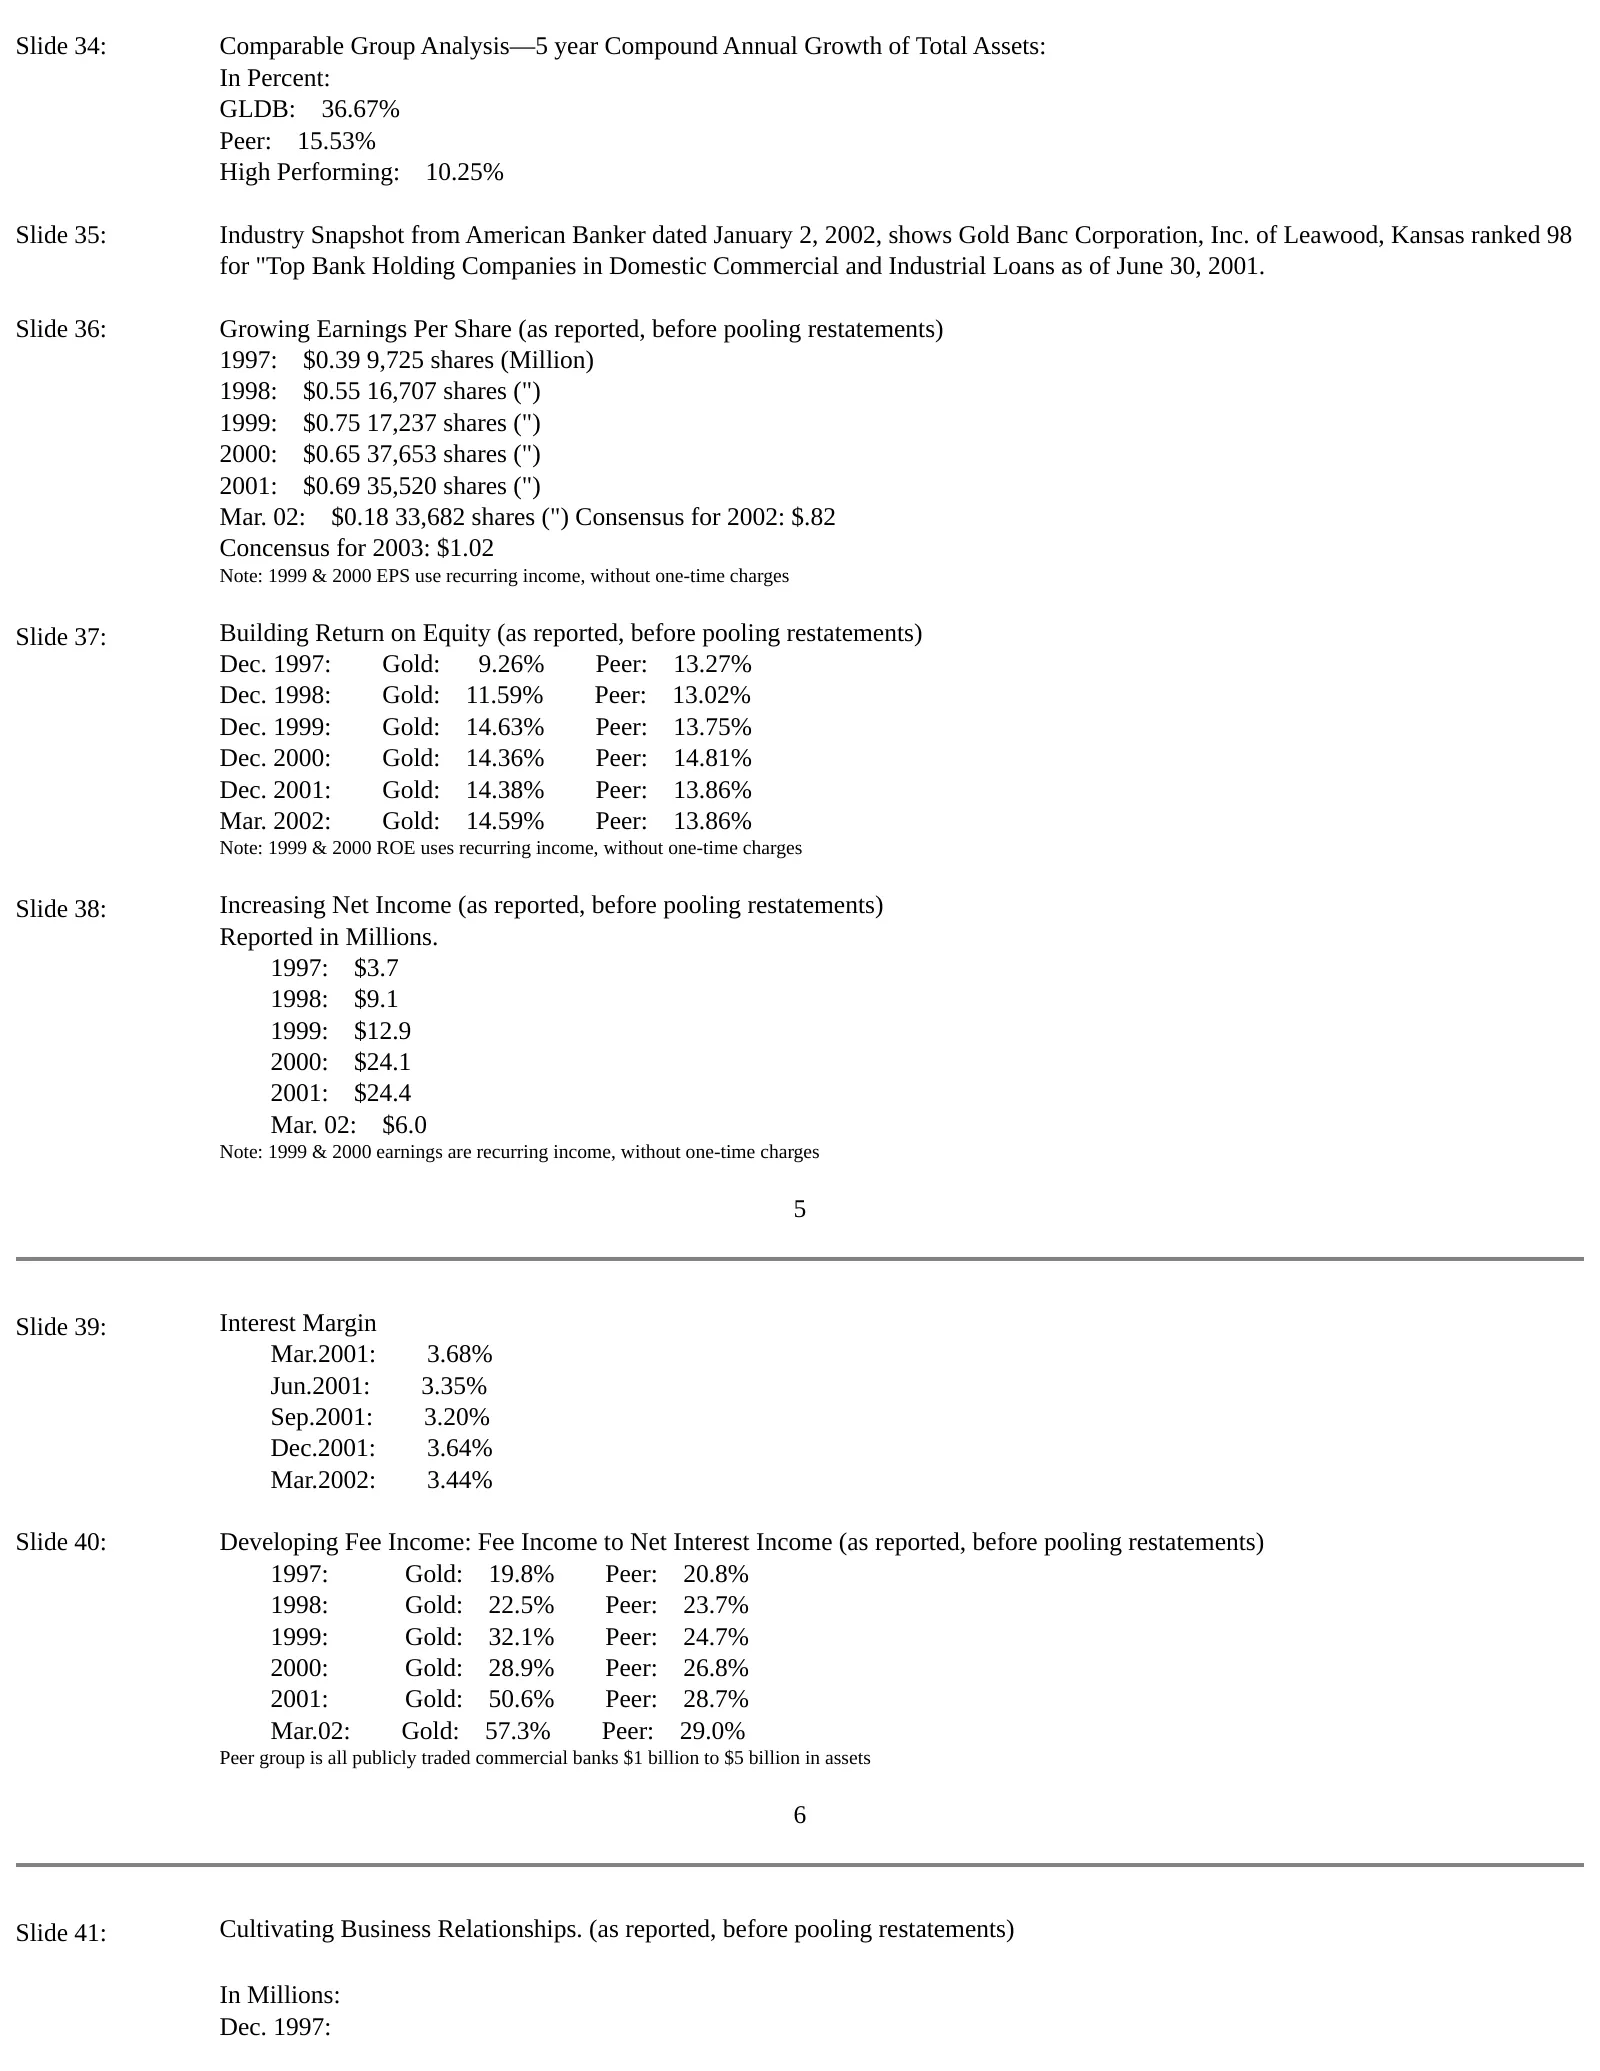
Slide 34: Comparable Group Analysis—5 year Compound Annual Growth of Total Assets: In Percent: GLDB: 36.67% Peer: 15.53% High Performing: 10.25% Slide 35: Industry Snapshot from American Banker dated January 2, 2002, shows Gold Banc Corporation, Inc. of Leawood, Kansas ranked 98 for "Top Bank Holdin
Slide 5: Loan portfolio composition
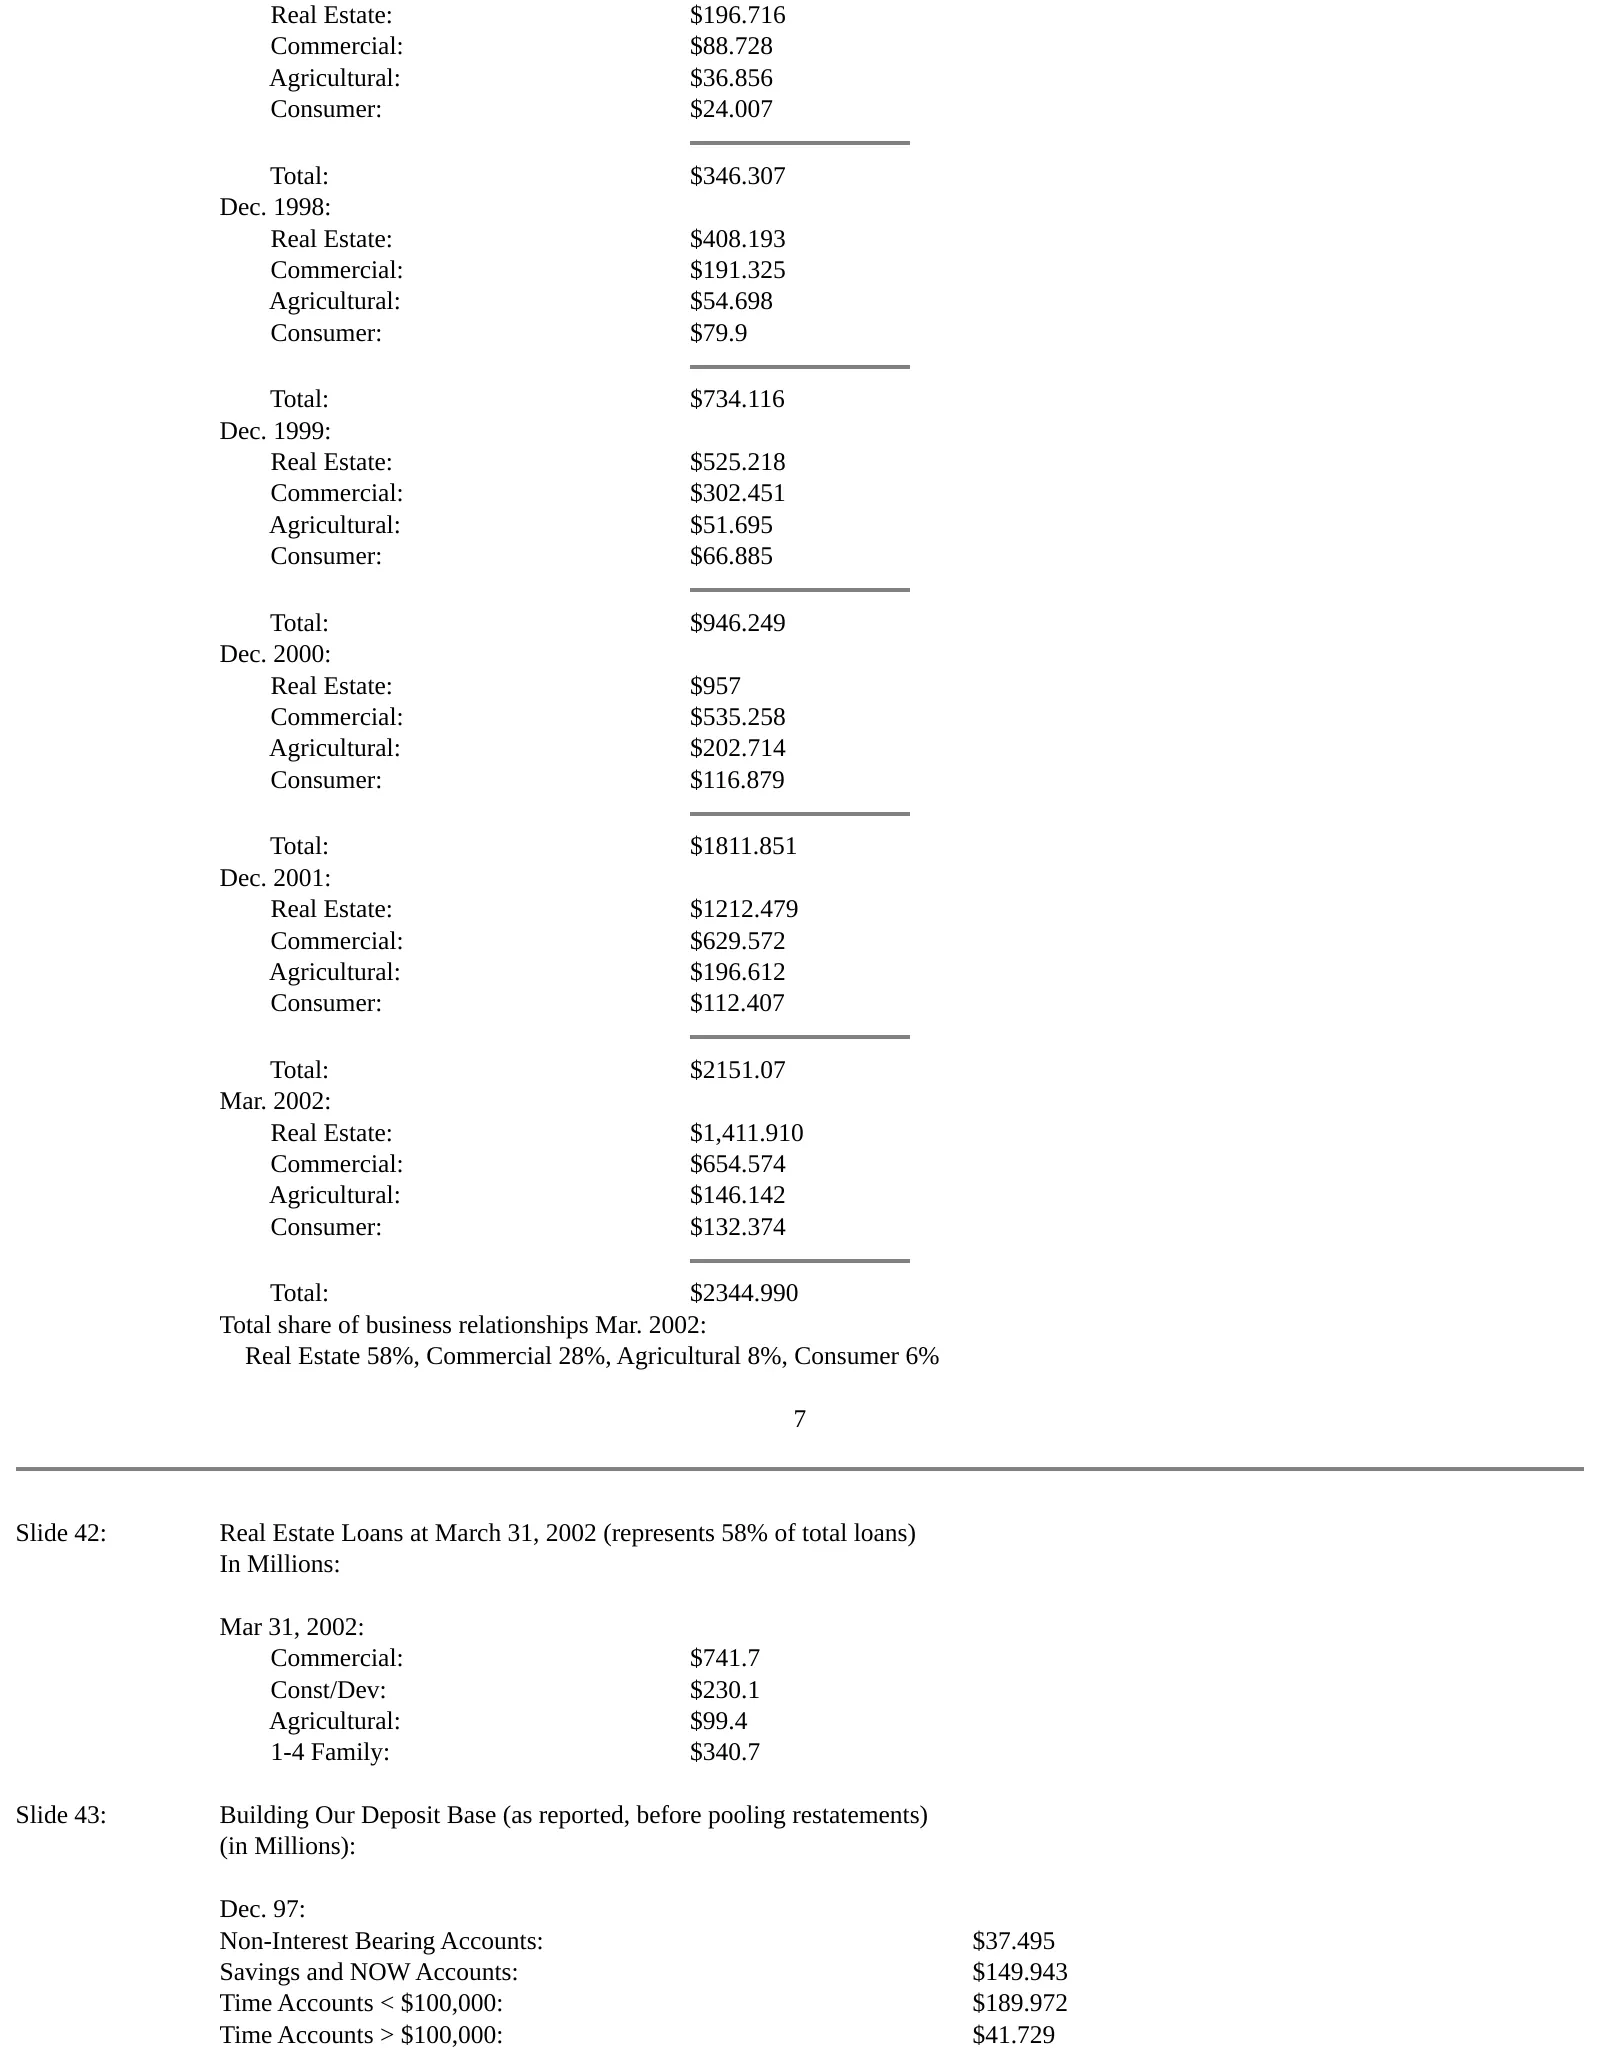
Real Estate: $196.716 Commercial: $88.728 Agricultural: $36.856 Consumer: $24.007 Total: $346.307 Dec. 1998: Real Estate: $408.193 Commercial: $191.325 Agricultural: $54.698 Consumer: $79.9 Total: $734.116 Dec. 1999: Real Estate: $525.218 Commercial: $302.451 Agricultural: $51.695 Consumer: $66.885
Slide 6: Deposit composition
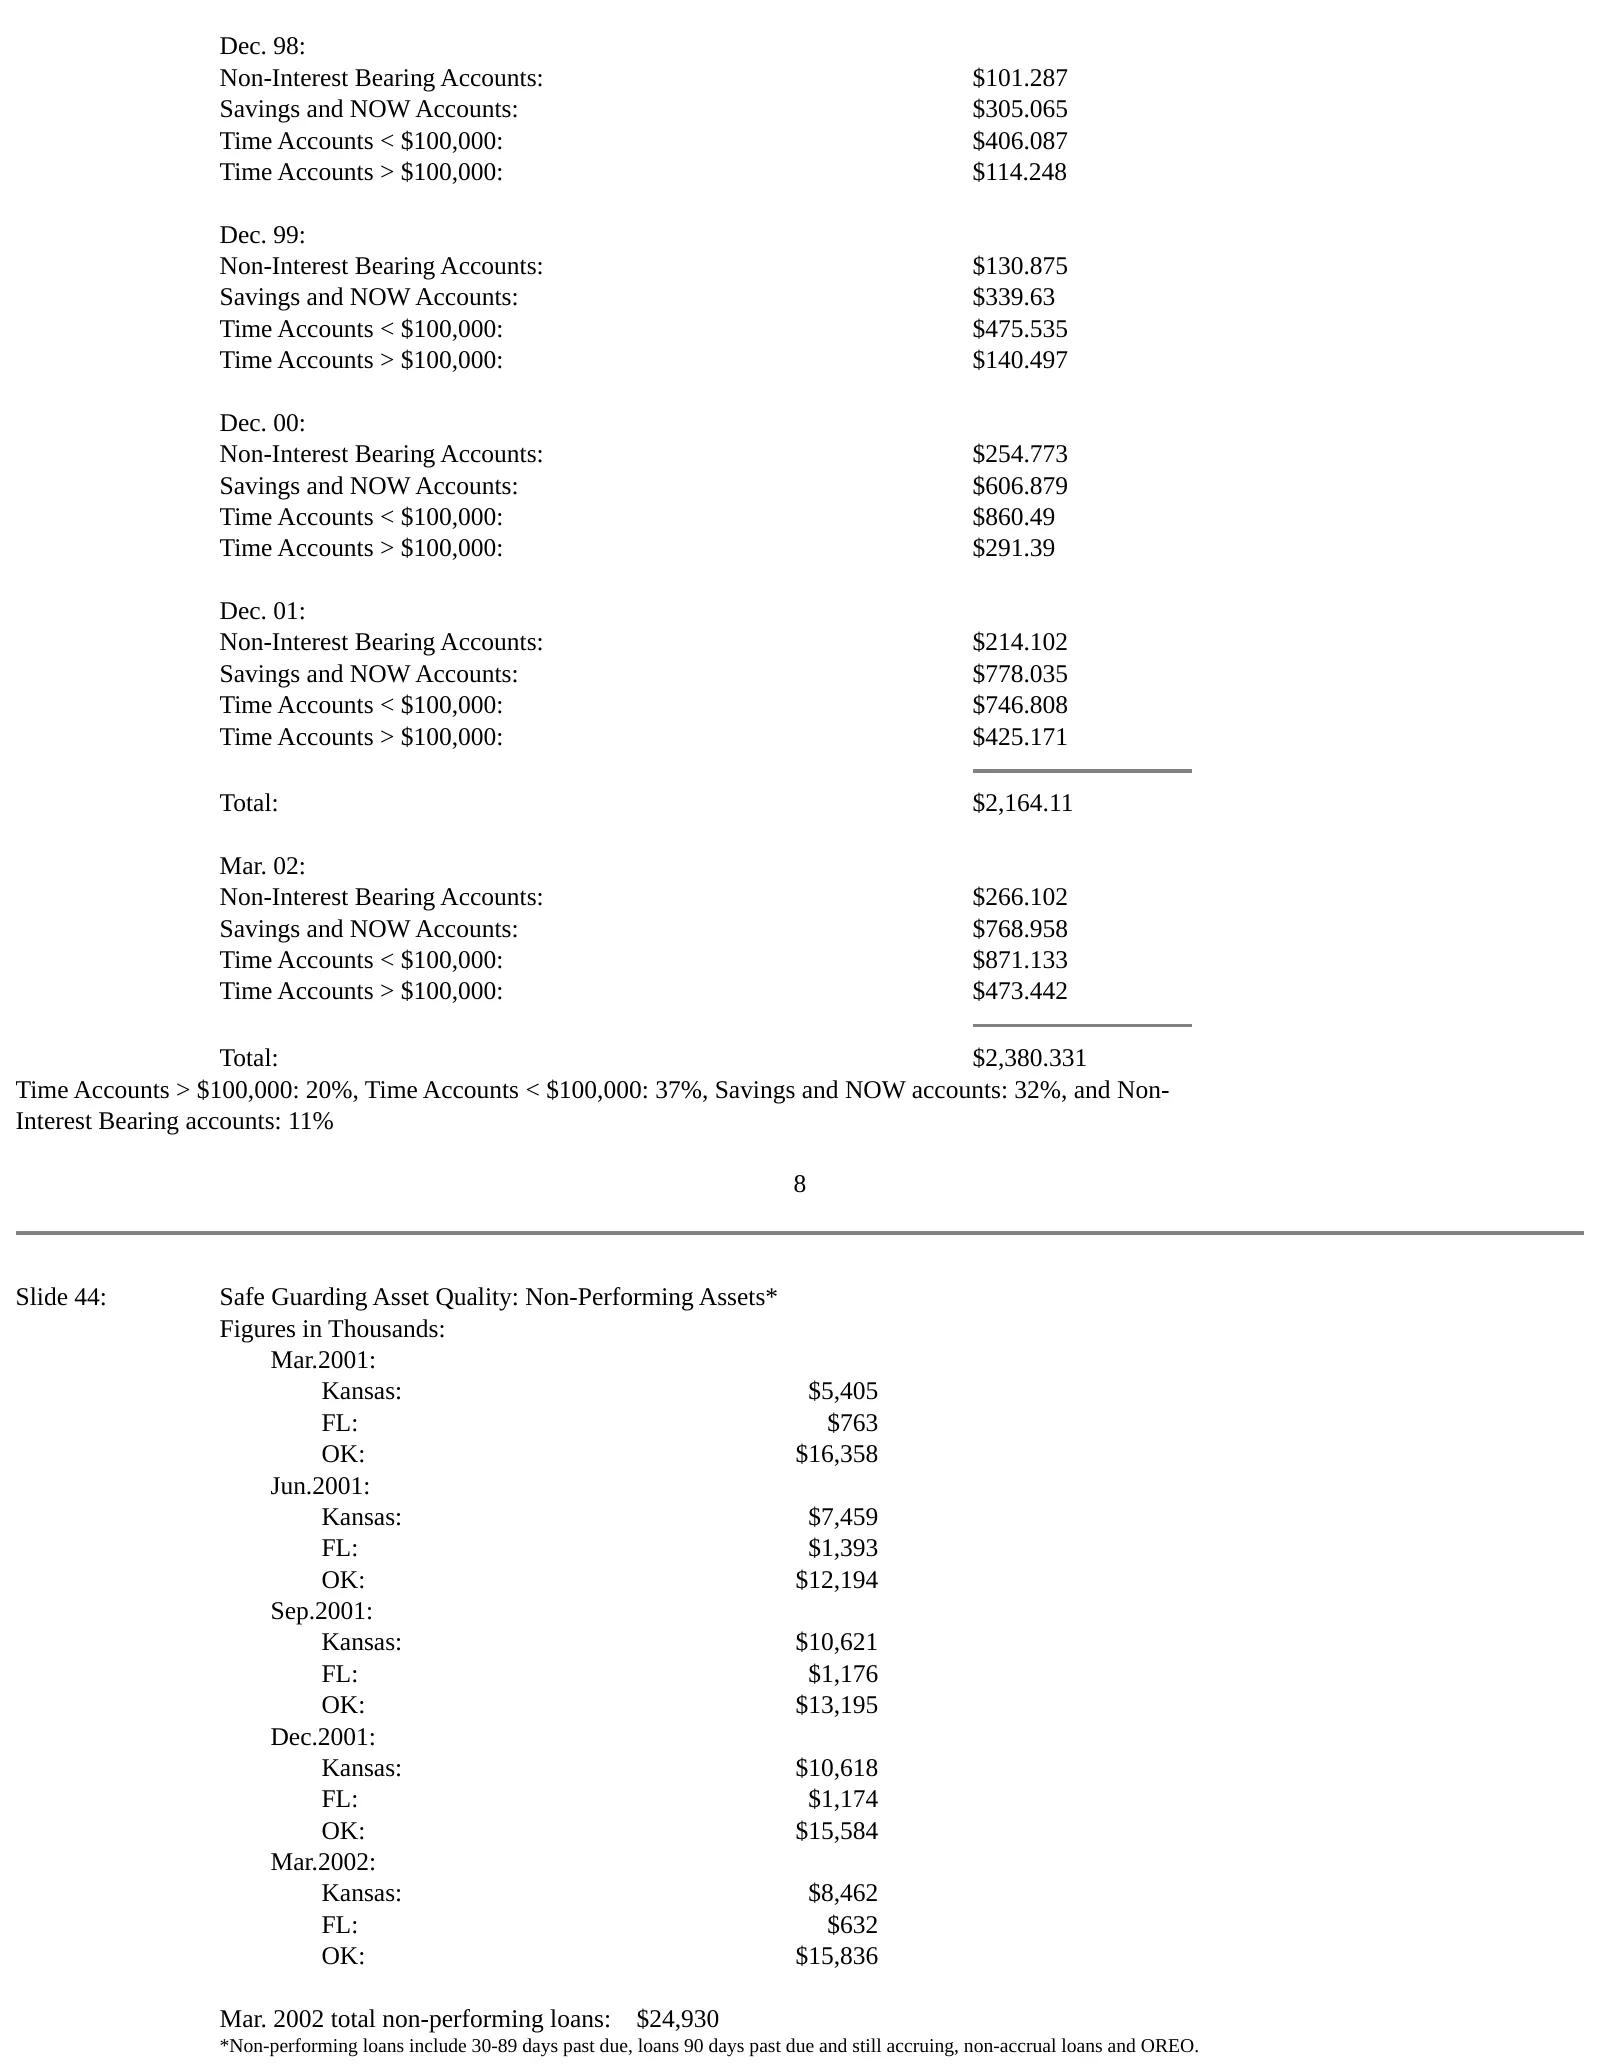
Dec. 98: Non-Interest Bearing Accounts: $101.287 Savings and NOW Accounts: $305.065 Time Accounts < $100,000: $406.087 Time Accounts > $100,000: $114.248 Dec. 99: Non-Interest Bearing Accounts: $130.875 Savings and NOW Accounts: $339.63 Time Accounts < $100,000: $475.535 Time Accounts > $100,000: $1
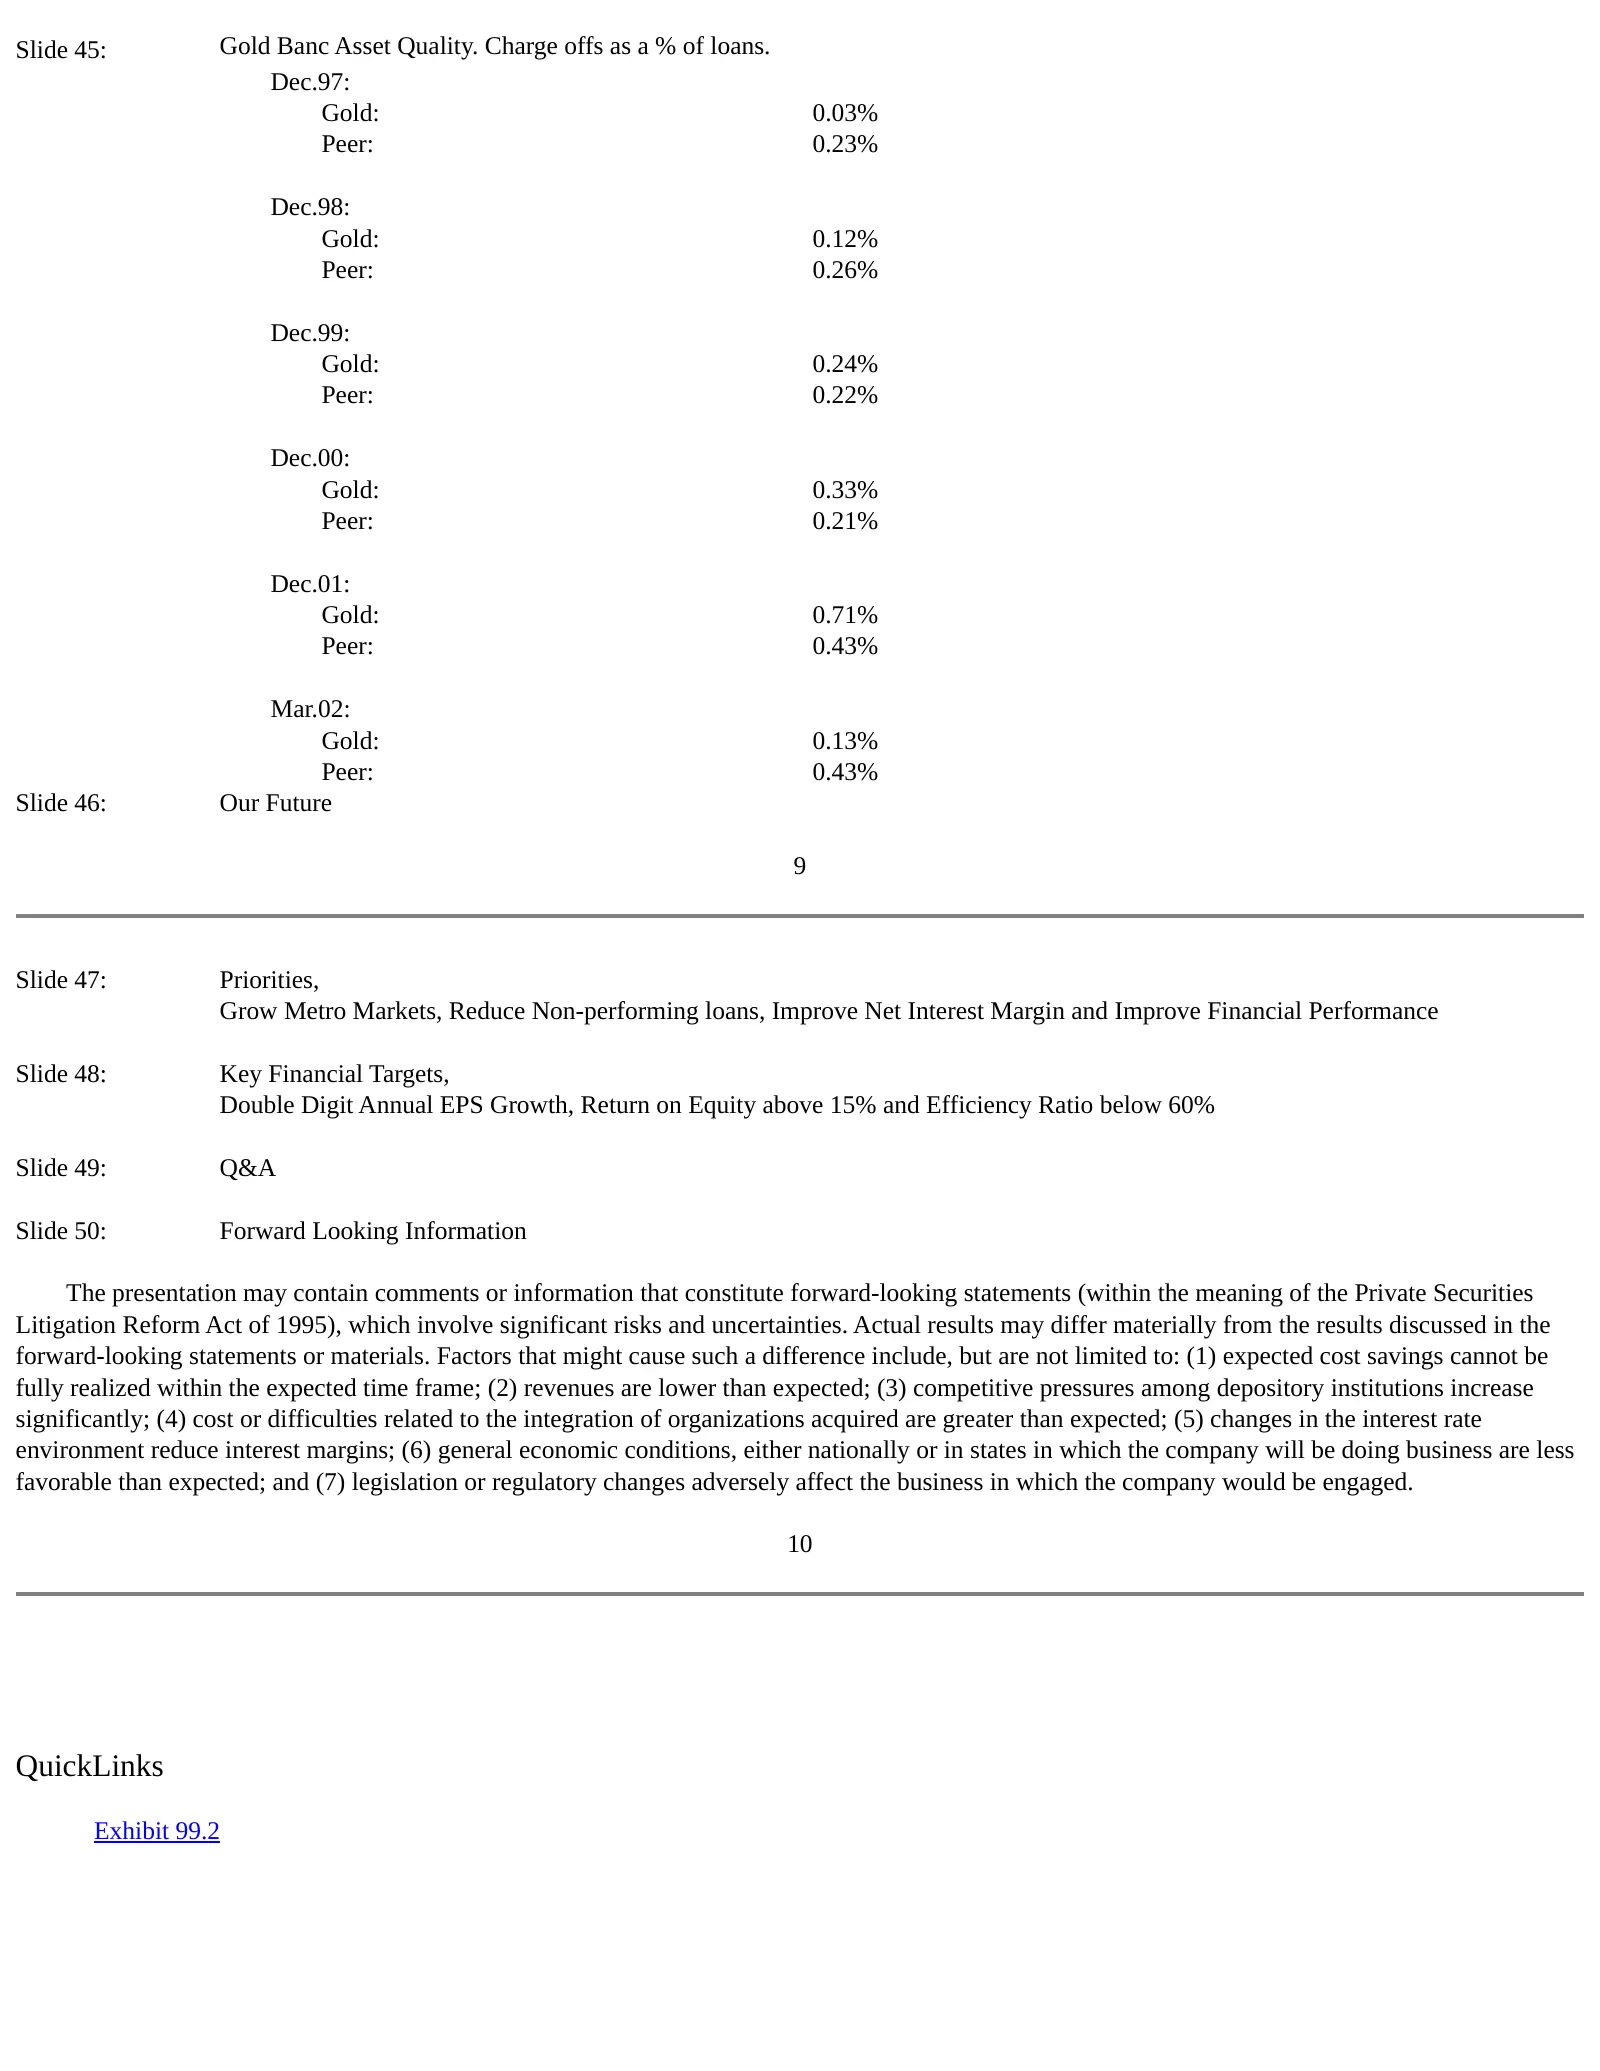
Slide 7: Asset quality, our future, priorities, targets and Q&A
Slide 45: Gold Banc Asset Quality. Charge offs as a % of loans. Dec.97: Gold: 0.03% Peer: 0.23% Dec.98: Gold: 0.12% Peer: 0.26% Dec.99: Gold: 0.24% Peer: 0.22% Dec.00: Gold: 0.33% Peer: 0.21% Dec.01: Gold: 0.71% Peer: 0.43% Mar.02: Gold: 0.13% Peer: 0.43% Slide 46: Our Future 9 Slide 47: Priorities,
Source: SEC EDGAR · 8-K filed Jun 19, 2002