Houston Exploration — Bear Stearns 16th Annual Global Credit Conference 2007
33 slides from Houston Exploration's conference presentation, May 16, 2007

Slide 1: Bear Stearns 16th Annual Global Credit Conference
Bear Stearns 16th Annual Global Credit Conference May 16, 2007
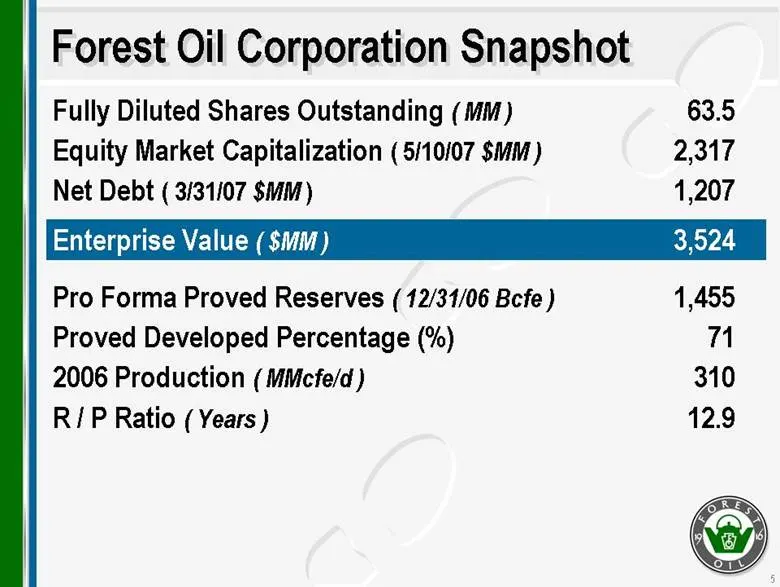
Slide 2: Forest Oil Corporation Snapshot
Forest Oil Corporation Snapshot Fully Diluted Shares Outstanding ( MM ) 63.5 Equity Market Capitalization ( 5/10/07 $MM ) 2,317 Net Debt ( 3/31/07 $MM ) 1,207 Enterprise Value ( $MM ) 3,524 Pro Forma Proved Reserves ( 12/31/06 Bcfe ) 1,455 Proved Developed Percentage (%) 71 2006 Production ( MMcfe/d
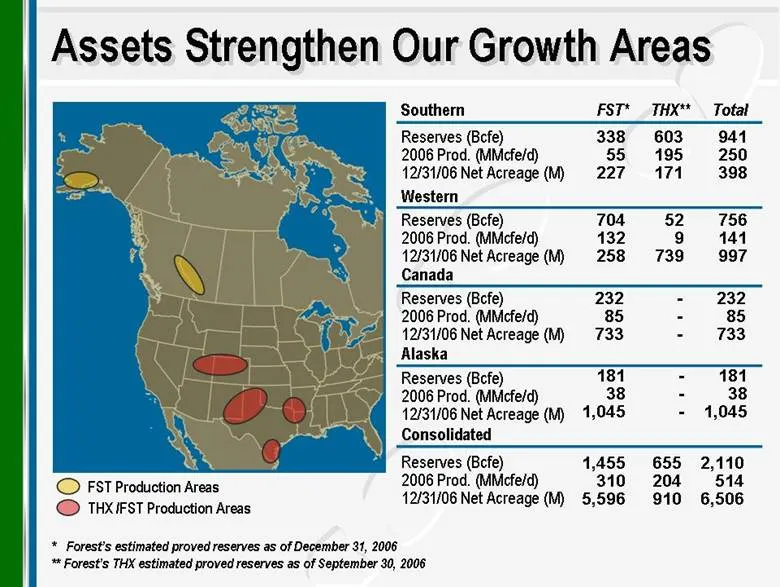
Slide 3: Assets Strengthen Our Growth Areas
THX /FST Production Areas FST Production Areas Assets Strengthen Our Growth Areas * Forest’s estimated proved reserves as of December 31, 2006 ** Forest’s THX estimated proved reserves as of September 30, 2006 Canada Reserves (Bcfe) 2006 Prod. (MMcfe/d) 12/31/06 Net Acreage (M) - - - 232 85 733 232
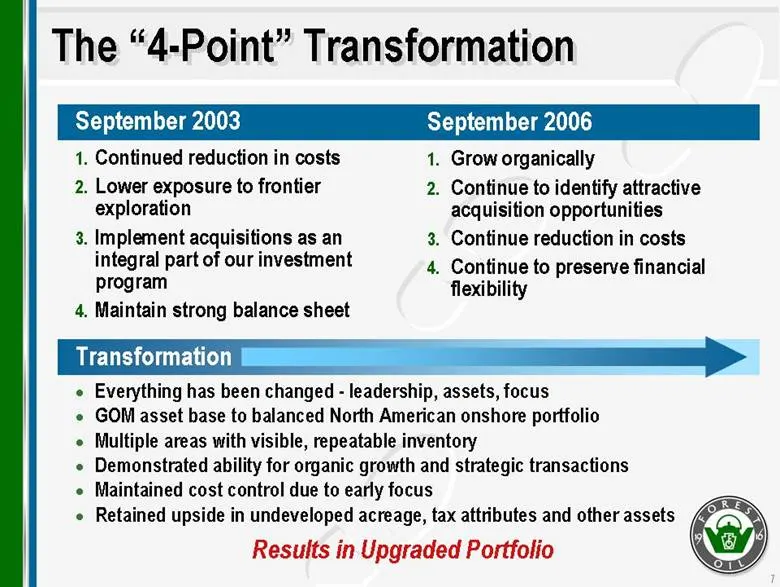
Slide 4: The "4-Point" Transformation
The “4-Point” Transformation September 2003 1. Continued reduction in costs 2. Lower exposure to frontier exploration 3. Implement acquisitions as an integral part of our investment program 4. Maintain strong balance sheet September 2006 1. Grow organically 2. Continue to identify attractive acquisi
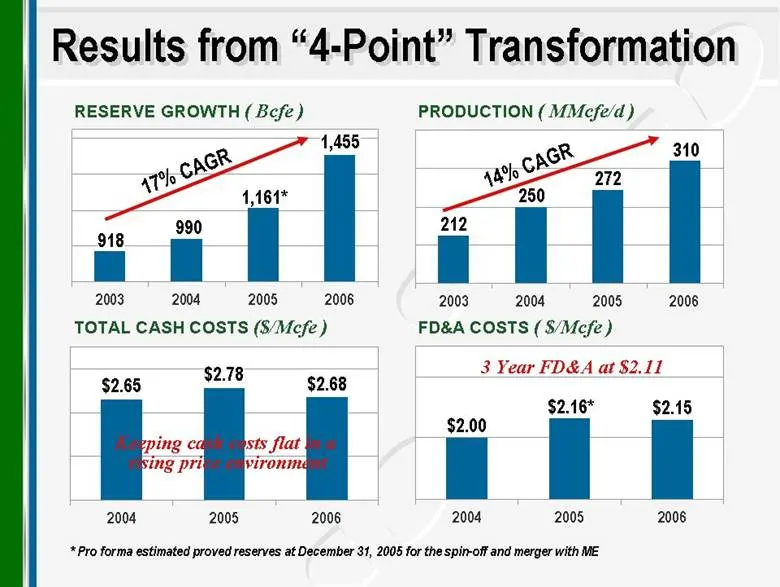
Slide 5: Results from "4-Point" Transformation
Results from “4-Point” Transformation 990 272 1,161* 250 $2.16* 918 212 $2.00 310 17% CAGR 14% CAGR * Pro forma estimated proved reserves at December 31, 2005 for the spin-off and merger with ME 1,455 $2.15 3 Year FD&A at $2.11 RESERVE GROWTH ( Bcfe ) PRODUCTION ( MMcfe/d ) TOTAL CASH COSTS ($/Mcfe
Slide 6: Targeted Acquisition Strategy
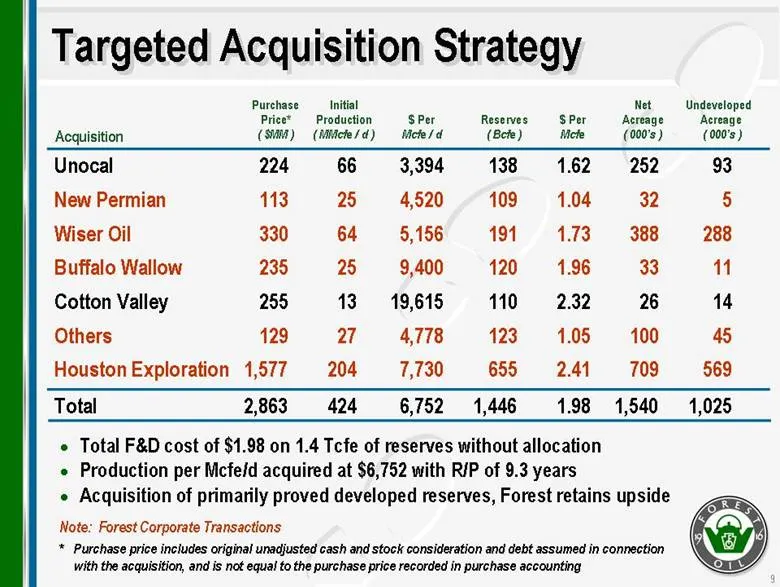
Targeted Acquisition Strategy Unocal 224 66 3,394 138 1.62 252 93 New Permian 113 25 4,520 109 1.04 32 5 Wiser Oil 330 64 5,156 191 1.73 388 288 Buffalo Wallow 235 25 9,400 120 1.96 33 11 Cotton Valley 255 13 19,615 110 2.32 26 14 Others 129 27 4,778 123 1.05 100 45 Houston Exploration 1,577 204 7,7
Slide 7: Successful Acquire & Exploit Results
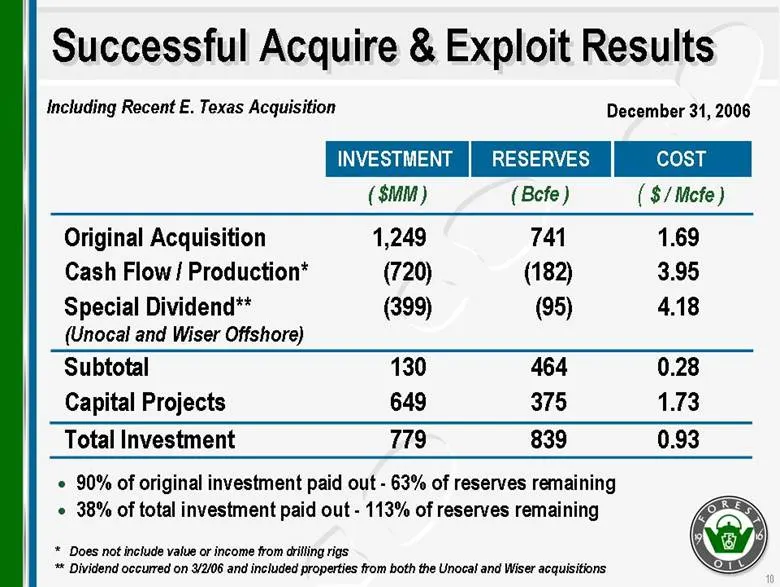
Successful Acquire & Exploit Results Original Acquisition 1,249 741 1.69 Cash Flow / Production* (720) (182) 3.95 Special Dividend** (399) (95) 4.18 (Unocal and Wiser Offshore) Subtotal 130 464 0.28 Capital Projects 649 375 1.73 Total Investment 779 839 0.93 90% of original investment paid out - 63%
Slide 8: Houston Exploration Transaction
Houston Exploration Transaction
Slide 9: Key Transaction Terms
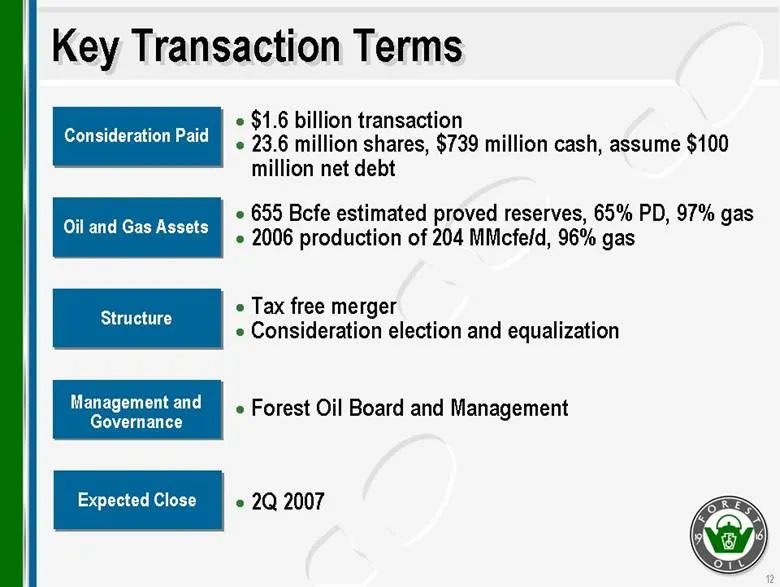
Key Transaction Terms 655 Bcfe estimated proved reserves, 65% PD, 97% gas 2006 production of 204 MMcfe/d, 96% gas Oil and Gas Assets Forest Oil Board and Management Management and Governance 2Q 2007 Expected Close Consideration Paid $1.6 billion transaction 23.6 million shares, $739 million cash, as
Slide 10: Transaction Rationale
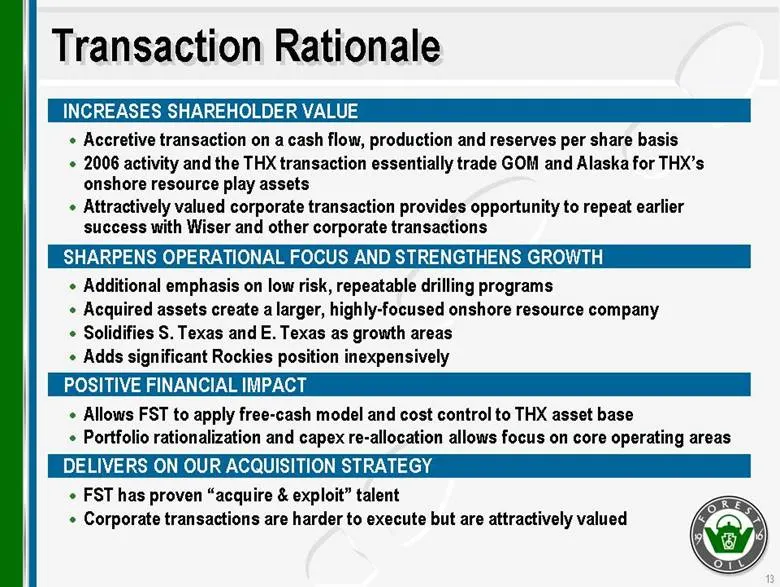
Transaction Rationale Accretive transaction on a cash flow, production and reserves per share basis 2006 activity and the THX transaction essentially trade GOM and Alaska for THX’s onshore resource play assets Attractively valued corporate transaction provides opportunity to repeat earlier success w
Slide 11: 2007 Growth Areas
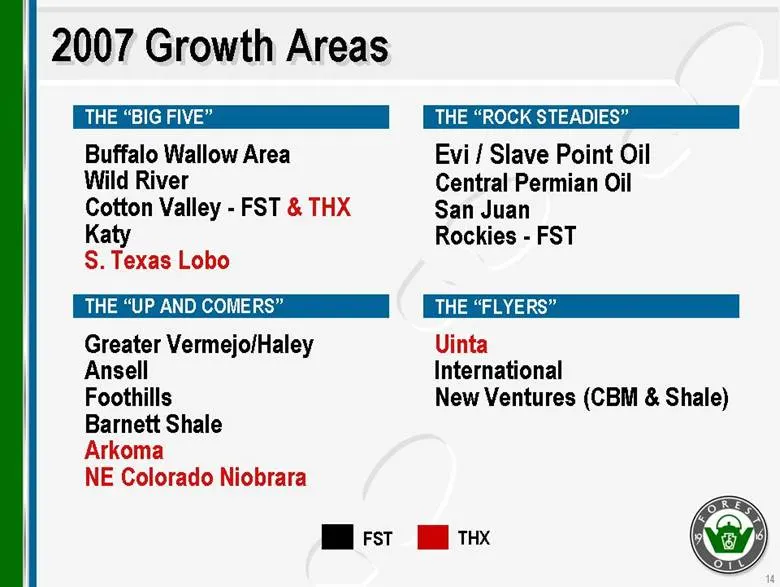
2007 Growth Areas THX THE “BIG FIVE” THE “UP AND COMERS” THE “ROCK STEADIES” THE “FLYERS” Buffalo Wallow Area Wild River Cotton Valley - FST & THX Katy S. Texas Lobo Greater Vermejo/Haley Ansell Foothills Barnett Shale Arkoma NE Colorado Niobrara Evi / Slave Point Oil Central Permian Oil San Juan Ro
Slide 12: Multiple Platforms Provide "Next Step" in Growth
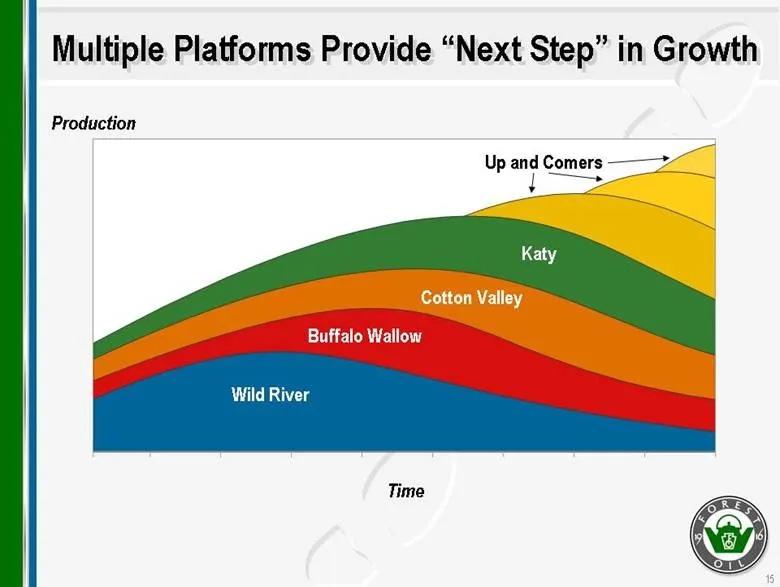
Multiple Platforms Provide “Next Step” in Growth Production Buffalo Wallow Katy Wild River Cotton Valley Up and Comers Time
Slide 13: Prospect Inventory Has Expanded
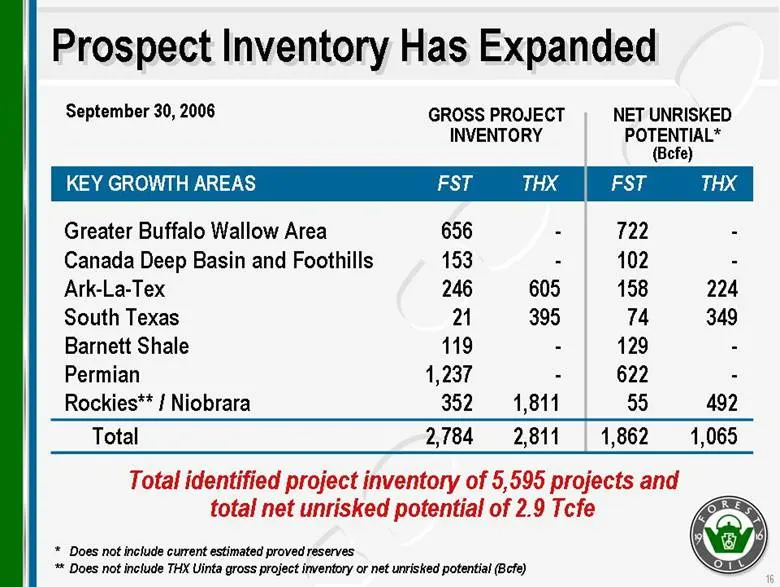
Prospect Inventory Has Expanded Greater Buffalo Wallow Area 656 - 722 - Canada Deep Basin and Foothills 153 - 102 - Ark-La-Tex 246 605 158 224 South Texas 21 395 74 349 Barnett Shale 119 - 129 - Permian 1,237 - 622 - Rockies** / Niobrara 352 1,811 55 492 Total 2,784 2,811 1,862 1,065 KEY GROWTH AREA
Slide 14: Forest Oil Assets
Forest Oil Assets
Slide 15: Greater Buffalo Wallow - Texas Panhandle
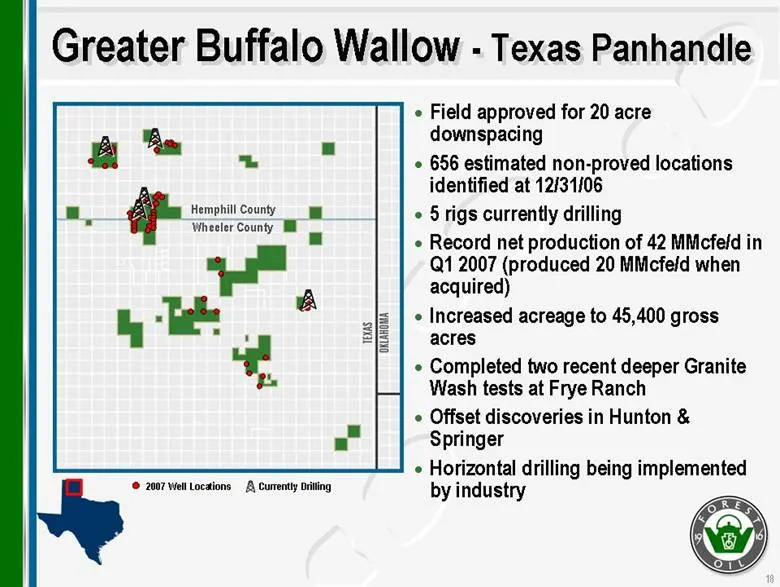
Greater Buffalo Wallow - Texas Panhandle Field approved for 20 acre downspacing 656 estimated non-proved locations identified at 12/31/06 5 rigs currently drilling Record net production of 42 MMcfe/d in Q1 2007 (produced 20 MMcfe/d when acquired) Increased acreage to 45,400 gross acres Completed two
Slide 16: Canadian Deep Basin - Cretaceous Play
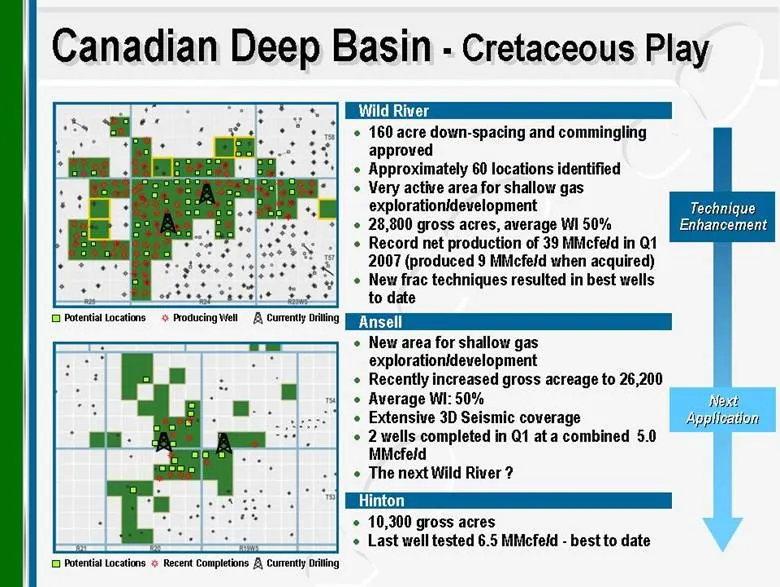
Canadian Deep Basin - Cretaceous Play Wild River Ansell Hinton 160 acre down-spacing and commingling approved Approximately 60 locations identified Very active area for shallow gas exploration/development 28,800 gross acres, average WI 50% Record net production of 39 MMcfe/d in Q1 2007 (produced 9 M
Slide 17: Cotton Valley Summary
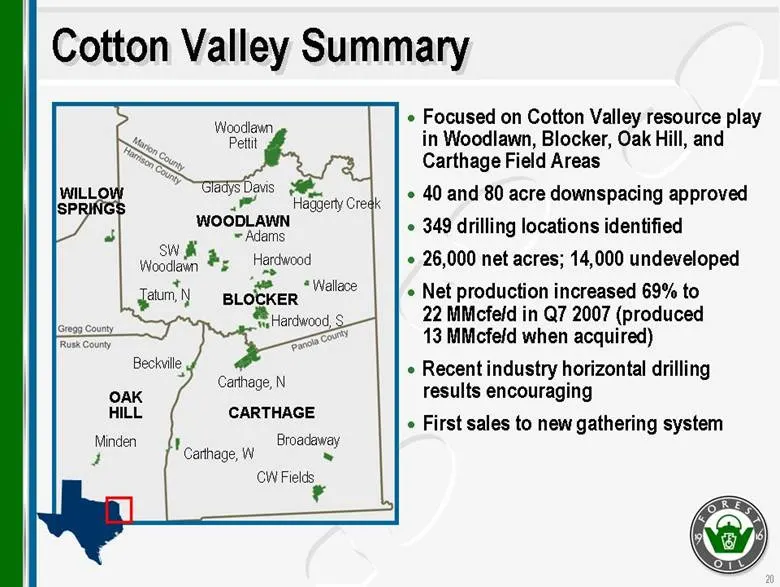
Cotton Valley Summary Focused on Cotton Valley resource play in Woodlawn, Blocker, Oak Hill, and Carthage Field Areas 40 and 80 acre downspacing approved 349 drilling locations identified 26,000 net acres; 14,000 undeveloped Net production increased 69% to 22 MMcfe/d in Q7 2007 (produced 13 MMcfe/d
Slide 18: Katy Field
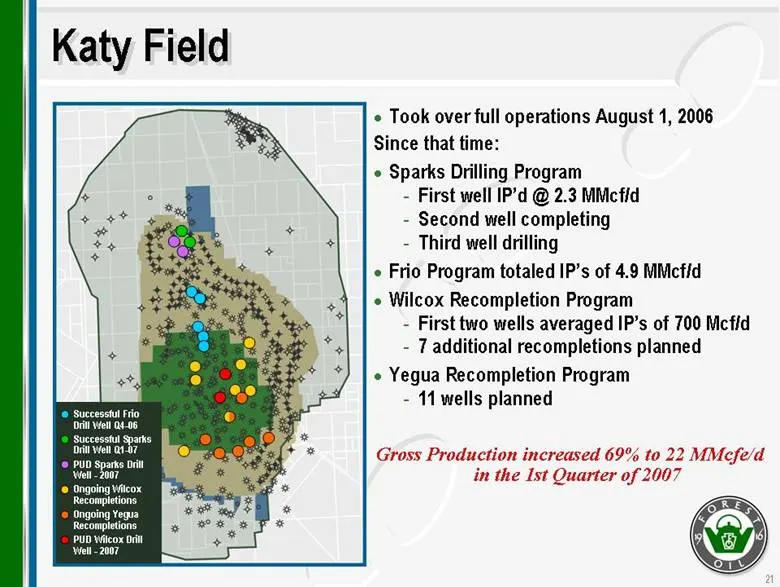
Katy Field Took over full operations August 1, 2006 Since that time: Sparks Drilling Program First well IP’d @ 2.3 MMcf/d Second well completing Third well drilling Frio Program totaled IP’s of 4.9 MMcf/d Wilcox Recompletion Program First two wells averaged IP’s of 700 Mcf/d 7 additional recompletio
Slide 19: Barnett Shale - Fort Worth Basin
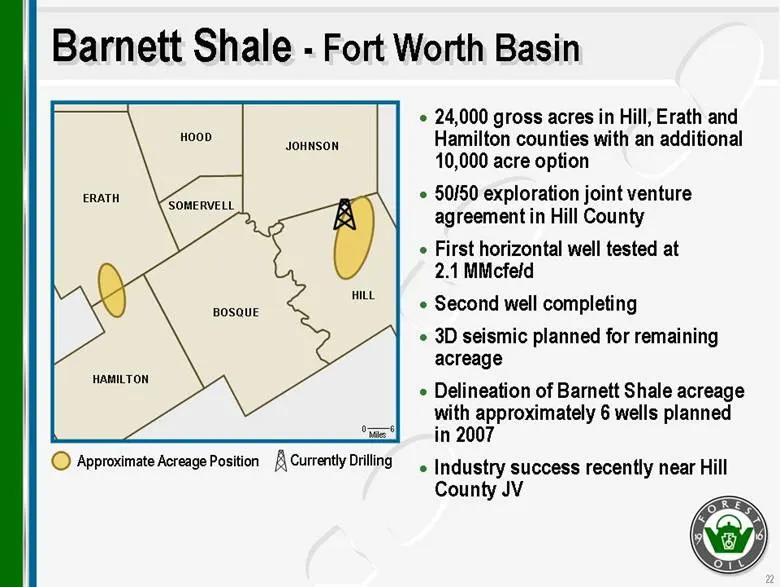
0 6 Miles HILL SOMERVELL JOHNSON HOOD ERATH BOSQUE HAMILTON Barnett Shale - Fort Worth Basin 24,000 gross acres in Hill, Erath and Hamilton counties with an additional 10,000 acre option 50/50 exploration joint venture agreement in Hill County First horizontal well tested at 2.1 MMcfe/d Second well
Slide 20: Houston Exploration Assets
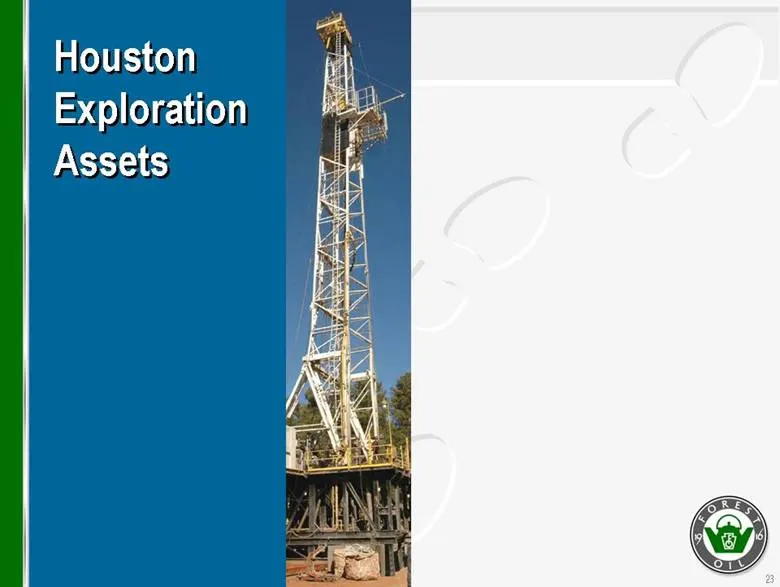
Houston Exploration Assets
Slide 21: Plan For These Assets - 4-Point Strategy
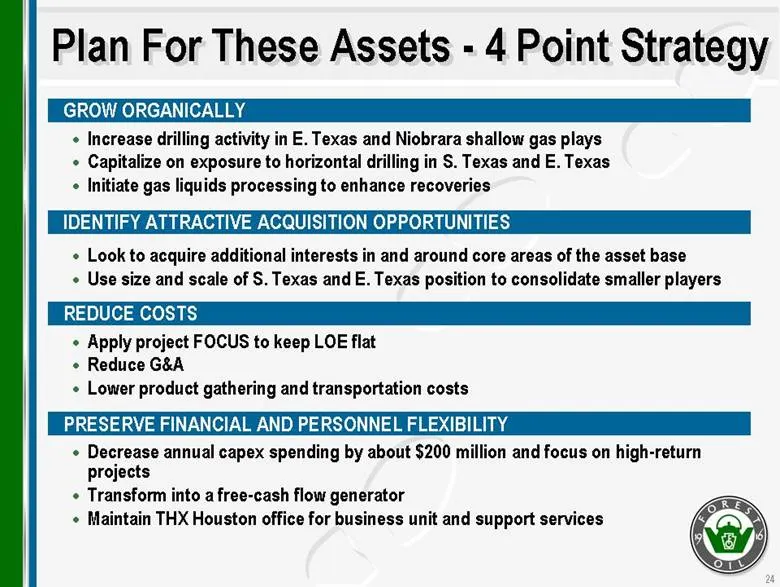
Plan For These Assets - 4 Point Strategy GROW ORGANICALLY Increase drilling activity in E. Texas and Niobrara shallow gas plays Capitalize on exposure to horizontal drilling in S. Texas and E. Texas Initiate gas liquids processing to enhance recoveries IDENTIFY ATTRACTIVE ACQUISITION OPPORTUNITIES R
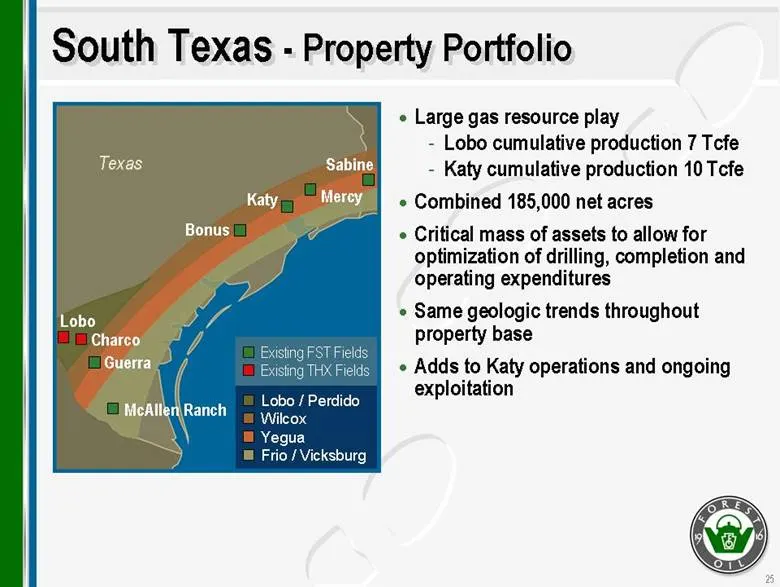
Slide 22: South Texas - Property Portfolio
South Texas - Property Portfolio Large gas resource play Lobo cumulative production 7 Tcfe Katy cumulative production 10 Tcfe Combined 185,000 net acres Critical mass of assets to allow for optimization of drilling, completion and operating expenditures Same geologic trends throughout property base
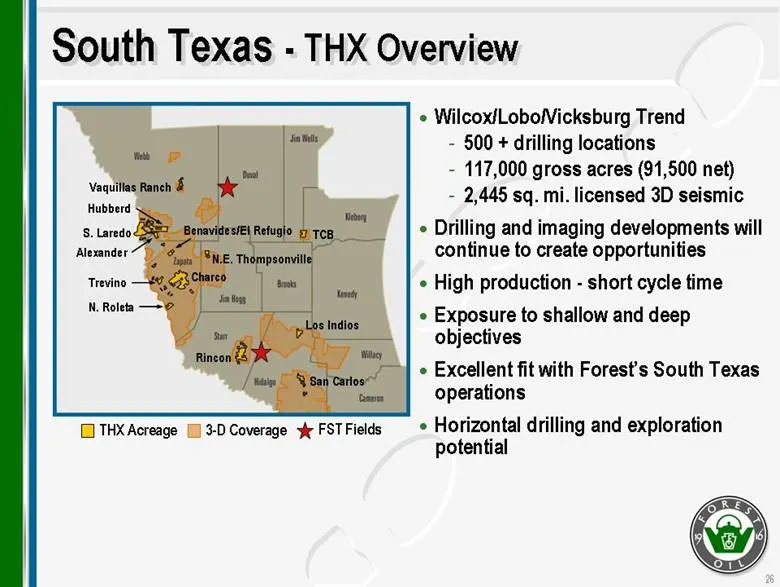
Slide 23: South Texas - THX Overview
South Texas - THX Overview Wilcox/Lobo/Vicksburg Trend 500 + drilling locations 117,000 gross acres (91,500 net) 2,445 sq. mi. licensed 3D seismic Drilling and imaging developments will continue to create opportunities High production - short cycle time Exposure to shallow and deep objectives Excell
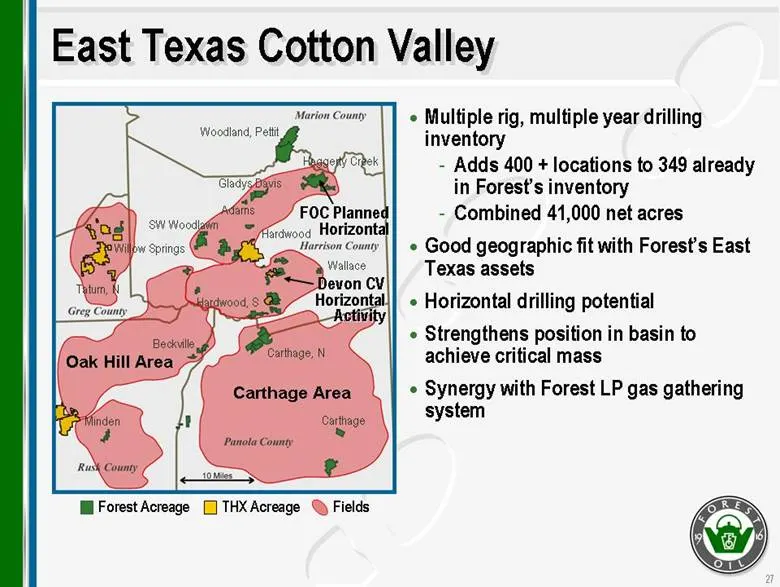
Slide 24: East Texas Cotton Valley
East Texas Cotton Valley Multiple rig, multiple year drilling inventory Adds 400 + locations to 349 already in Forest’s inventory Combined 41,000 net acres Good geographic fit with Forest’s East Texas assets Horizontal drilling potential Strengthens position in basin to achieve critical mass Synergy
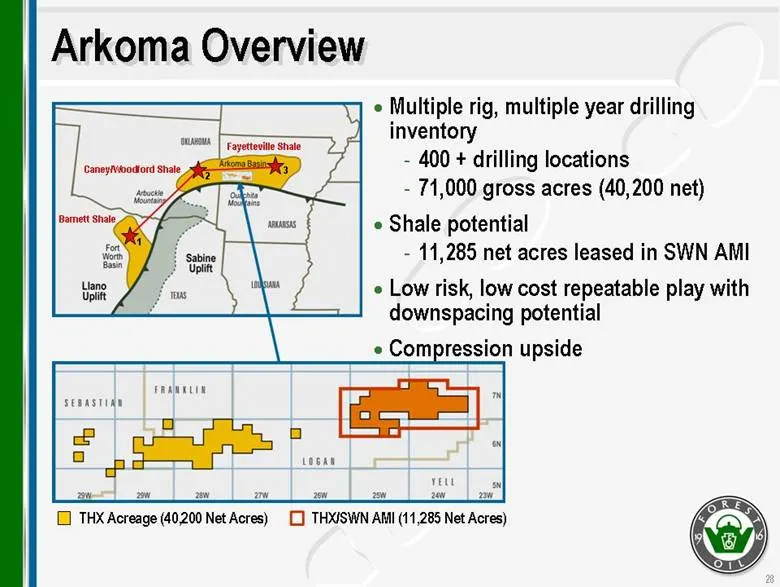
Slide 25: Arkoma Overview
Arkoma Overview Caney/Woodford Shale Barnett Shale Fayetteville Shale 1 2 3 Multiple rig, multiple year drilling inventory 400 + drilling locations 71,000 gross acres (40,200 net) Shale potential 11,285 net acres leased in SWN AMI Low risk, low cost repeatable play with downspacing potential Compres
Slide 26: Rockies Overview - Colorado Niobrara Play
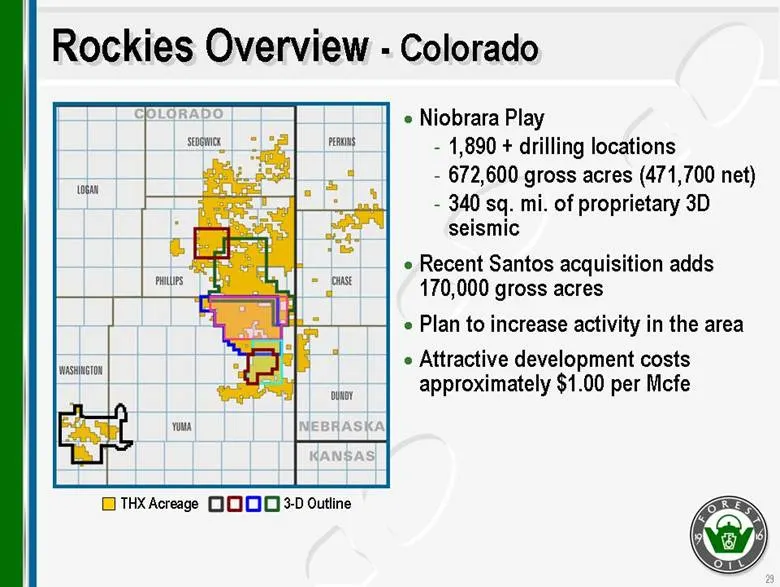
Rockies Overview - Colorado Niobrara Play 1,890 + drilling locations 672,600 gross acres (471,700 net) 340 sq. mi. of proprietary 3D seismic Recent Santos acquisition adds 170,000 gross acres Plan to increase activity in the area Attractive development costs approximately $1.00 per Mcfe THX Acreage
Slide 27: Rockies Overview - Utah Natural Buttes Area
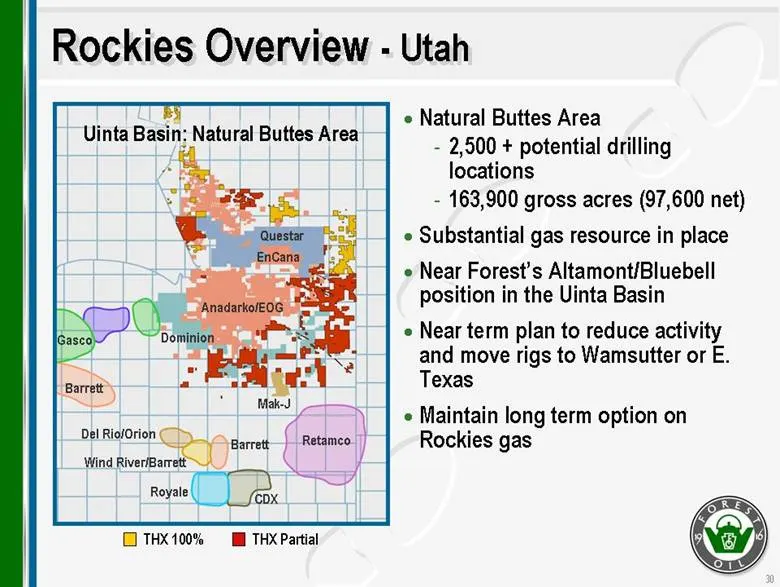
Natural Buttes Area 2,500 + potential drilling locations 163,900 gross acres (97,600 net) Substantial gas resource in place Near Forest’s Altamont/Bluebell position in the Uinta Basin Near term plan to reduce activity and move rigs to Wamsutter or E. Texas Maintain long term option on Rockies gas Ro
Slide 28: Business Plan
| 2007 Business Plan | 1
Slide 29: Forest Production Profile
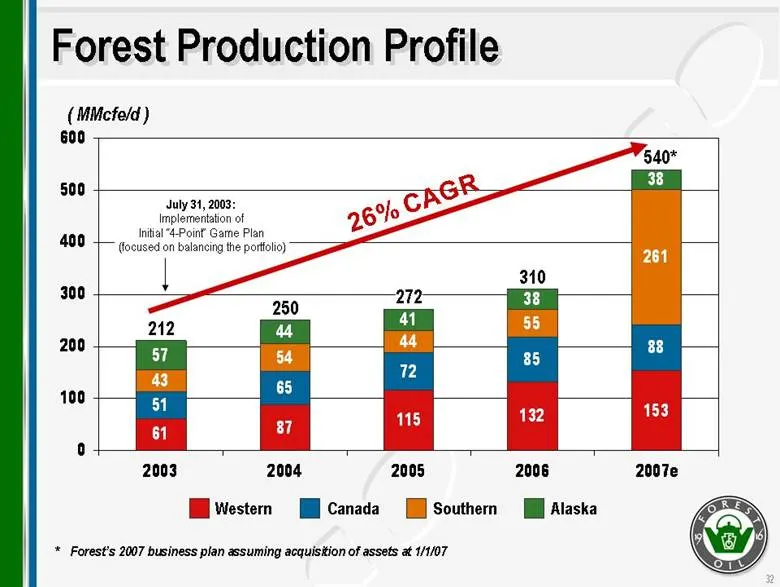
Forest Production Profile Western Canada Southern ( MMcfe/d ) 26% CAGR 212 250 272 310 540* July 31, 2003: Implementation of Initial “4-Point” Game Plan (focused on balancing the portfolio) * Forest’s 2007 business plan assuming acquisition of assets at 1/1/07 61 87 115 132 153 51 65 72 85 88 43 54
Slide 30: Pro Forma Combined 2007 (e) E&D Capex
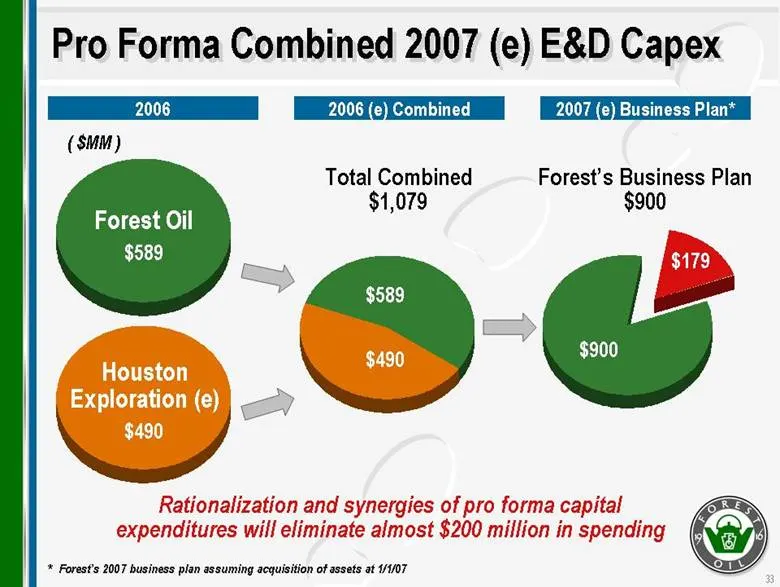
Pro Forma Combined 2007 (e) E&D Capex $589 $490 Total Combined $1,079 Rationalization and synergies of pro forma capital expenditures will eliminate almost $200 million in spending 2006 Forest Oil $589 Houston Exploration (e) $490 2006 (e) Combined 2007 (e) Business Plan* $900 $179 Forest’s Business
Slide 31: Compelling Investor Appeal
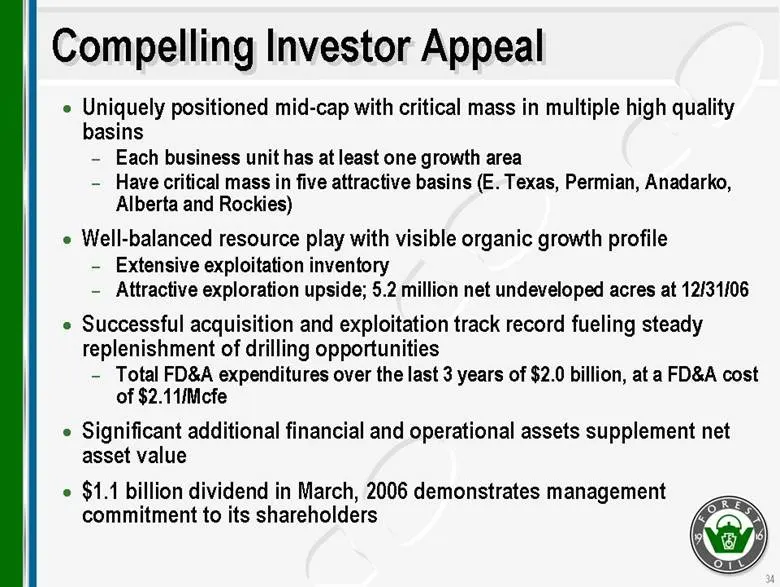
Compelling Investor Appeal Uniquely positioned mid-cap with critical mass in multiple high quality basins Each business unit has at least one growth area Have critical mass in five attractive basins (E. Texas, Permian, Anadarko, Alberta and Rockies) Well-balanced resource play with visible organic g
Slide 32: Cautionary Statements
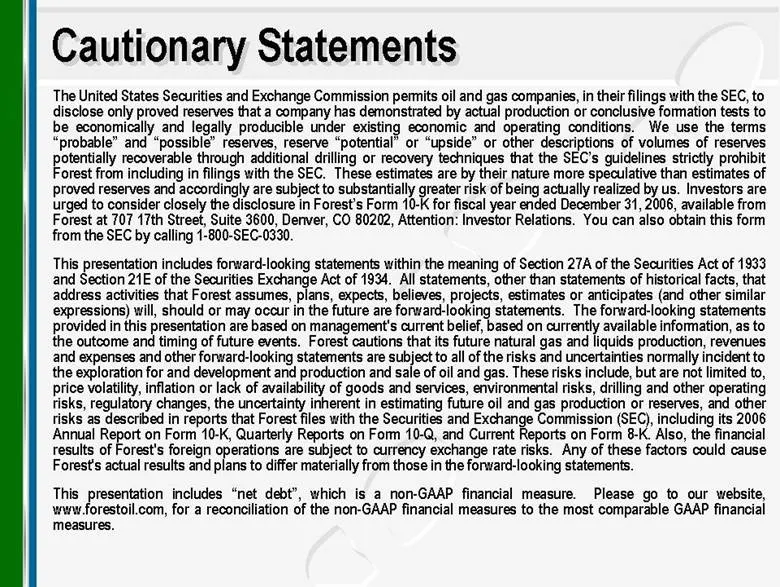
Cautionary Statements The United States Securities and Exchange Commission permits oil and gas companies, in their filings with the SEC, to disclose only proved reserves that a company has demonstrated by actual production or conclusive formation tests to be economically and legally producible under
Slide 33: Cautionary Statements (cont.)
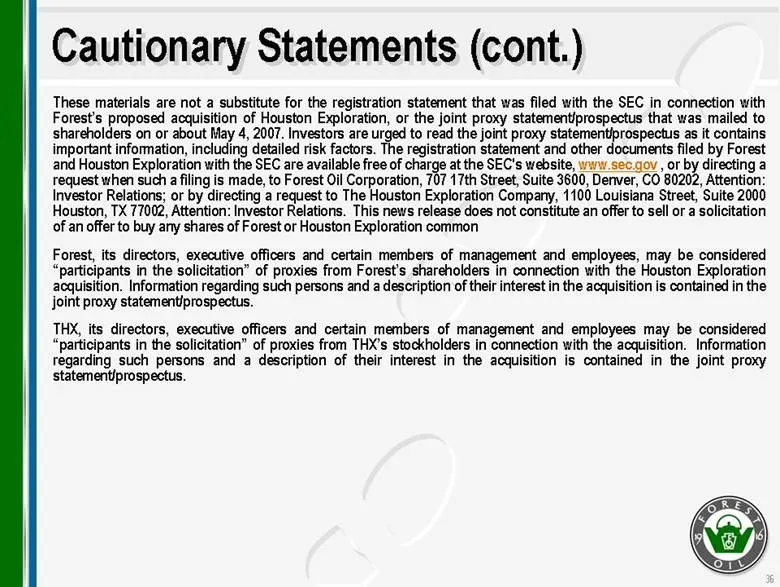
Cautionary Statements (cont.) These materials are not a substitute for the registration statement that was filed with the SEC in connection with Forest’s proposed acquisition of Houston Exploration, or the joint proxy statement/prospectus that was mailed to shareholders on or about May 4, 2007. Inve
Source: SEC EDGAR · 425 filed May 16, 2007
More decks from Houston Exploration Co
 Houston Exploration — Merger or Acquisition (May 2007)47 slides · May 21, 2007
 UBS 2007 Leveraged Finance Conference34 slides · May 9, 2007
 Howard Weil 35th Annual Energy Conference 200734 slides · Apr 2, 2007
 Citigroup Small & Mid-Cap Conference 200736 slides · Mar 13, 2007
 Simmons & Company 7th Annual International Energy Conference 200734 slides · Mar 1, 2007
 Credit Suisse 2007 Energy Summit35 slides · Feb 6, 2007