Novelis — Q1 FY2015 Earnings Presentation
25 slides from Novelis's earnings presentation, Aug 7, 2014
Slide 1: Novelis Q1 Fiscal Year 2015 Earnings Conference Call
©2014Novelis Inc. 1 August 7, 2014 Philip Martens President and Chief Executive Officer Steve Fisher Senior Vice President and Chief Financial Officer Novelis Q1 Fiscal Year 2015 Earnings Conference Call Exhibit 99.2
Slide 2: Safe Harbor Statement
©2014Novelis Inc. 2 Safe Harbor Statement Forward-Looking Statements Statements made in this presentation which describe Novelis' intentions, expectations, beliefs or predictions may be forward-looking statements within the meaning of securities laws. Forward-looking statements include statements pr
Slide 3: Agenda
©2014Novelis Inc. 3 Agenda Business Review Strategy Q1FY15 Detailed Financial Review Summary
Slide 4: Business Review
©2014Novelis Inc. 4 Business Review
Slide 5: First Quarter Highlights
©2014Novelis Inc. 5 First Quarter Highlights Highest Quarterly Shipments Since FY11 EBITDA Grew 15% YoY to $235 Million Portfolio Transformation to High-Recycled Content Premium Products Continues Rolling Expansions Ramp Up in Brazil and Korea Commissioned New Recycling Center in Germany a
Slide 6: Regional Dynamics: North America
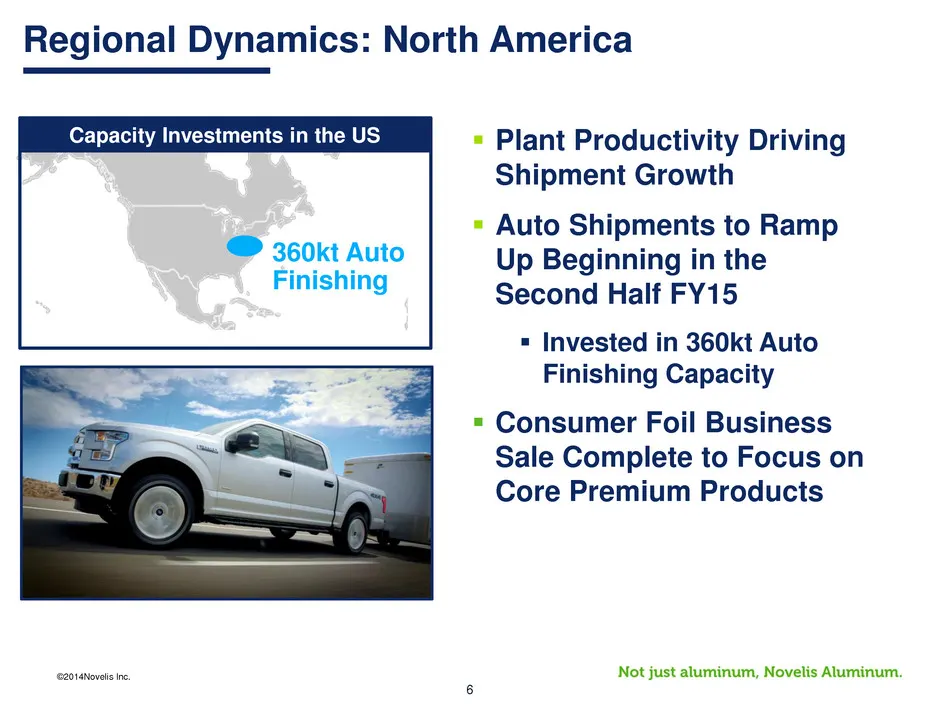
©2014Novelis Inc. 6 Regional Dynamics: North America 360kt Auto Finishing Plant Productivity Driving Shipment Growth Auto Shipments to Ramp Up Beginning in the Second Half FY15 Invested in 360kt Auto Finishing Capacity Consumer Foil Business Sale Complete to Focus on Core Premium Products Ca
Slide 7: Regional Dynamics: Europe
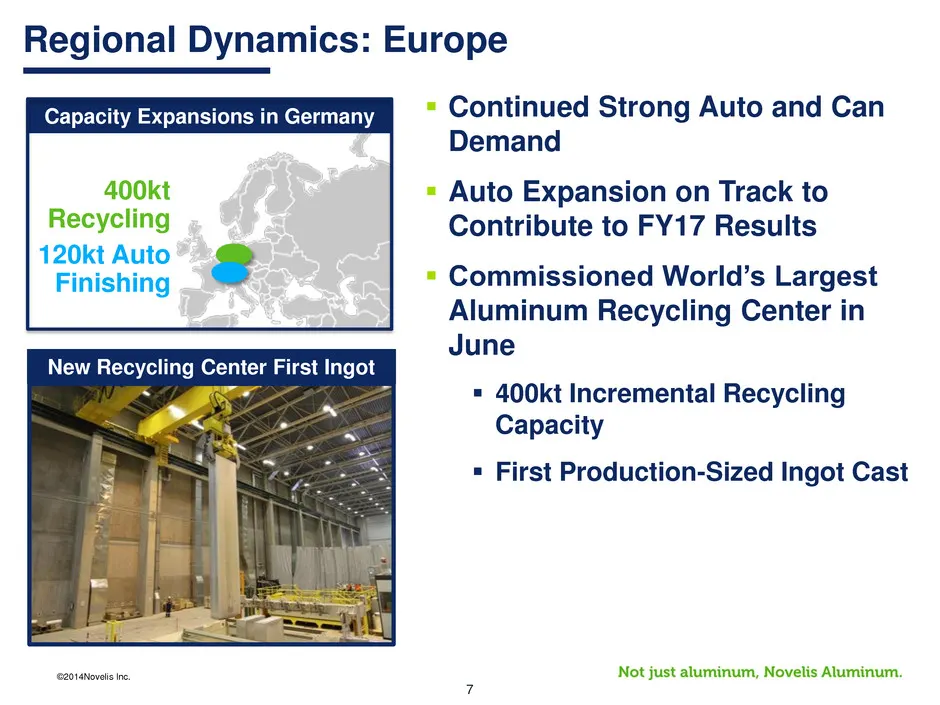
©2014Novelis Inc. 7 Regional Dynamics: Europe Continued Strong Auto and Can Demand Auto Expansion on Track to Contribute to FY17 Results Commissioned World’s Largest Aluminum Recycling Center in June 400kt Incremental Recycling Capacity First Production-Sized Ingot Cast 400kt Recycling 120
Slide 8: Regional Dynamics: Asia
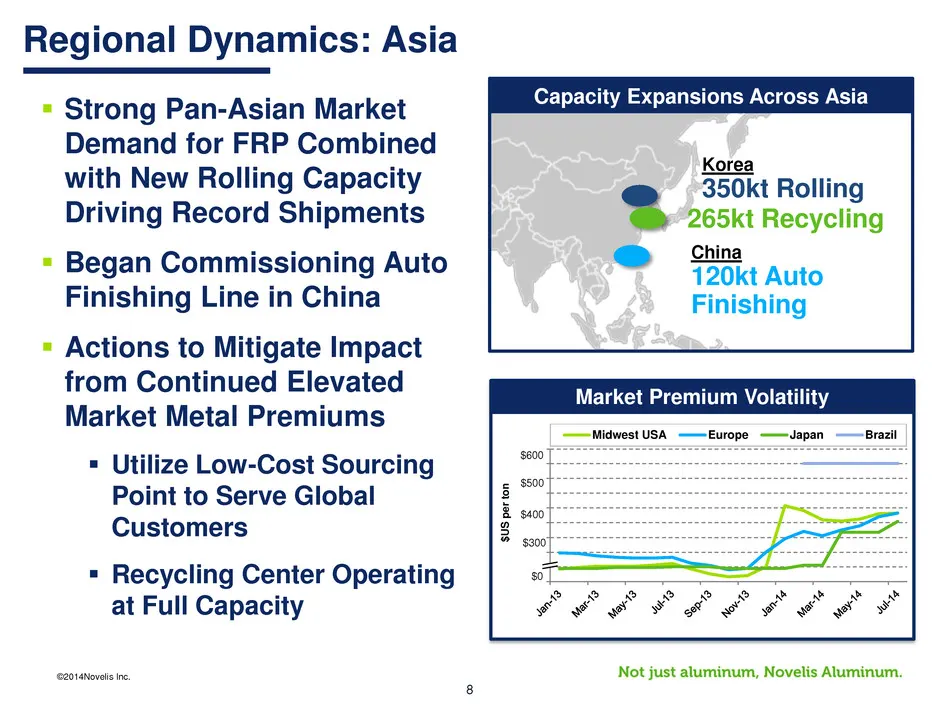
©2014Novelis Inc. 8 Regional Dynamics: Asia Market Premium Volatility - 50 100 150 200 250 300 350 400 450 Midwest USA Europe Japan Brazil $ U S pe r to n 265kt Recycling Korea 350kt Rolling China 120kt Auto Finishing Strong Pan-Asian Market Demand for FRP Combined with New Rolling Capacity Drivin
Slide 9: Regional Dynamics: South America
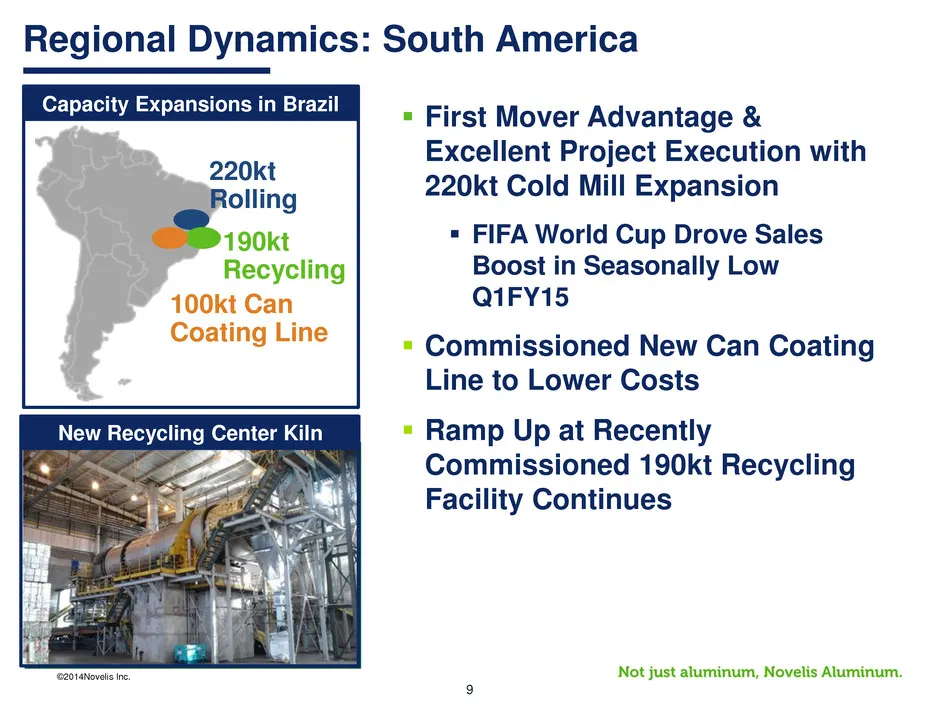
©2014Novelis Inc. 9 Regional Dynamics: South America First Mover Advantage & Excellent Project Execution with 220kt Cold Mill Expansion FIFA World Cup Drove Sales Boost in Seasonally Low Q1FY15 Commissioned New Can Coating Line to Lower Costs Ramp Up at Recently Commissioned 190kt Recycling
Slide 10: Strategy
©2014Novelis Inc. 10 Strategy
Slide 11: Novelis' Strategy: Grow High-Recycled Content Premium Product Portfolio
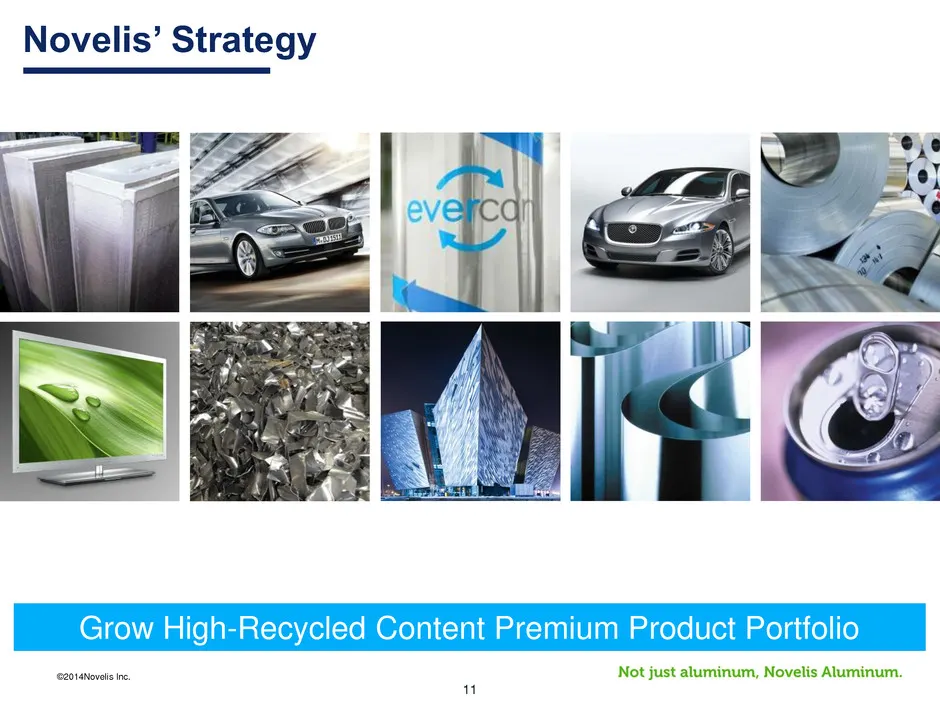
©2014Novelis Inc. 11 Novelis’ Strategy Grow High-Recycled Content Premium Product Portfolio
Slide 12: Explosive Growth in North American Auto
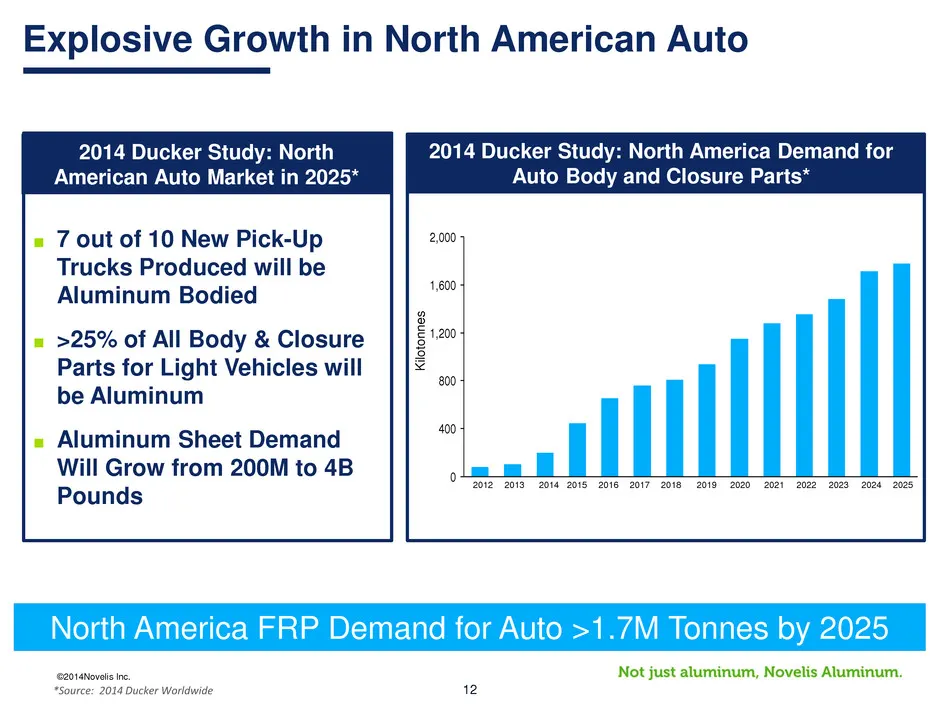
©2014Novelis Inc. 12 Explosive Growth in North American Auto *Source: 2014 Ducker Worldwide 2014 Ducker Study: North American Auto Market in 2025* ■ 7 out of 10 New Pick-Up Trucks Produced will be Aluminum Bodied ■ >25% of All Body & Closure Parts for Light Vehicles will be Aluminum ■ Aluminum Sheet
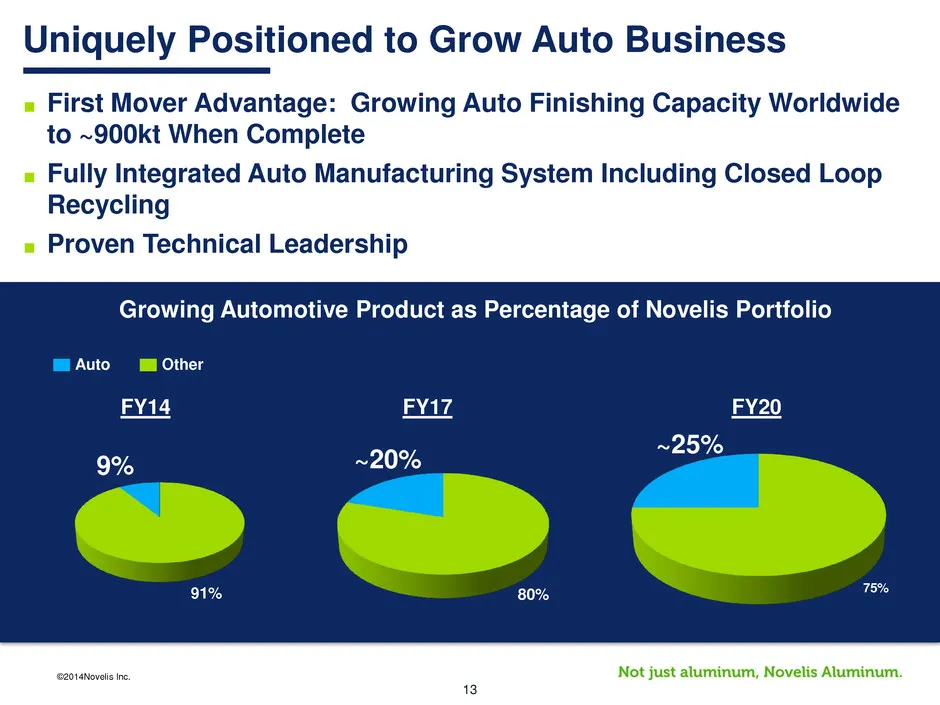
Slide 13: Uniquely Positioned to Grow Auto Business
©2014Novelis Inc. 13 Uniquely Positioned to Grow Auto Business 80% 75% Other Auto FY14 FY17 FY20 91% 9% ~25% ■ First Mover Advantage: Growing Auto Finishing Capacity Worldwide to ~900kt When Complete ■ Fully Integrated Auto Manufacturing System Including Closed Loop Recycling ■ Proven Technical Lead
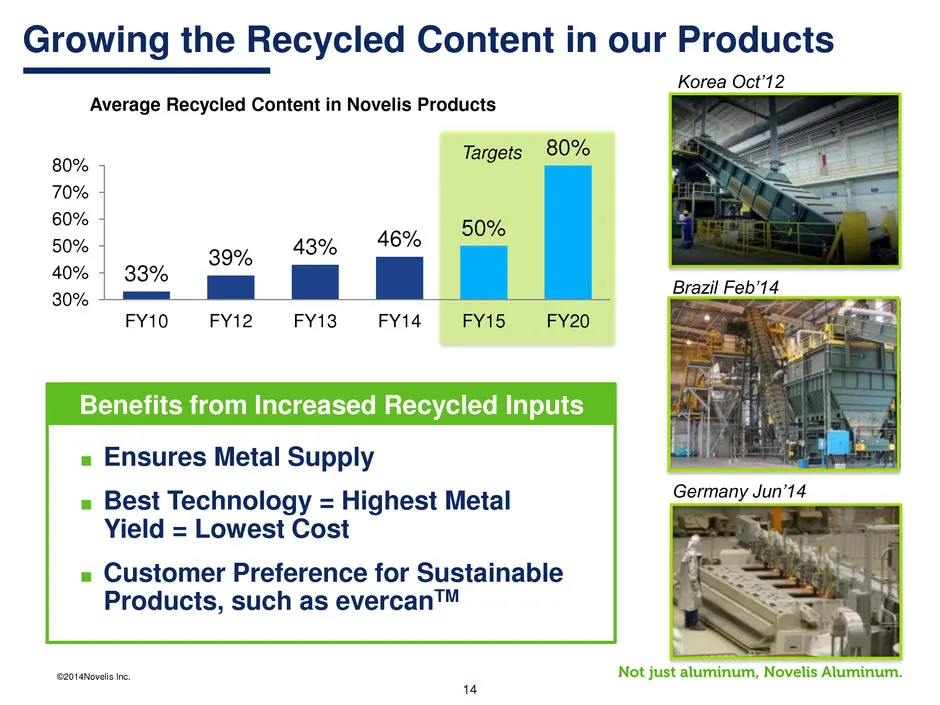
Slide 14: Growing the Recycled Content in our Products
©2014Novelis Inc. 14 Growing the Recycled Content in our Products ■ Ensures Metal Supply ■ Best Technology = Highest Metal Yield = Lowest Cost ■ Customer Preference for Sustainable Products, such as evercanTM Korea Oct’12 33% 39% 43% 46% 50% 80% 30% 40% 50% 60% 70% 80% FY10 FY12 FY13 FY14 FY15 FY20
Slide 15: Q1FY15 Detailed Financial Review
©2014Novelis Inc. 15 Q1FY15 Detailed Financial Review
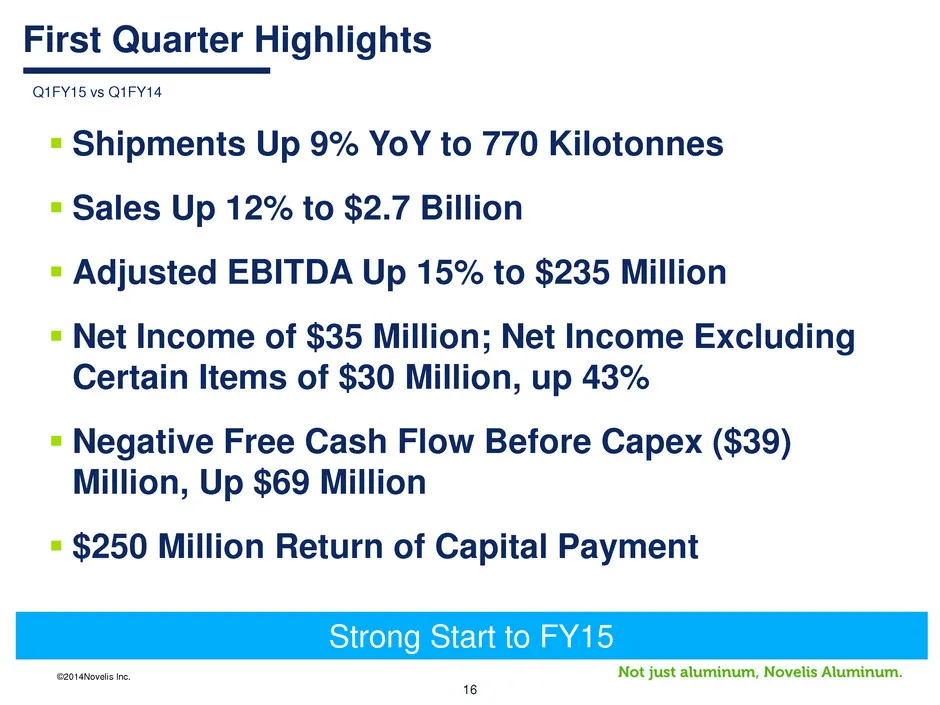
Slide 16: First Quarter Highlights
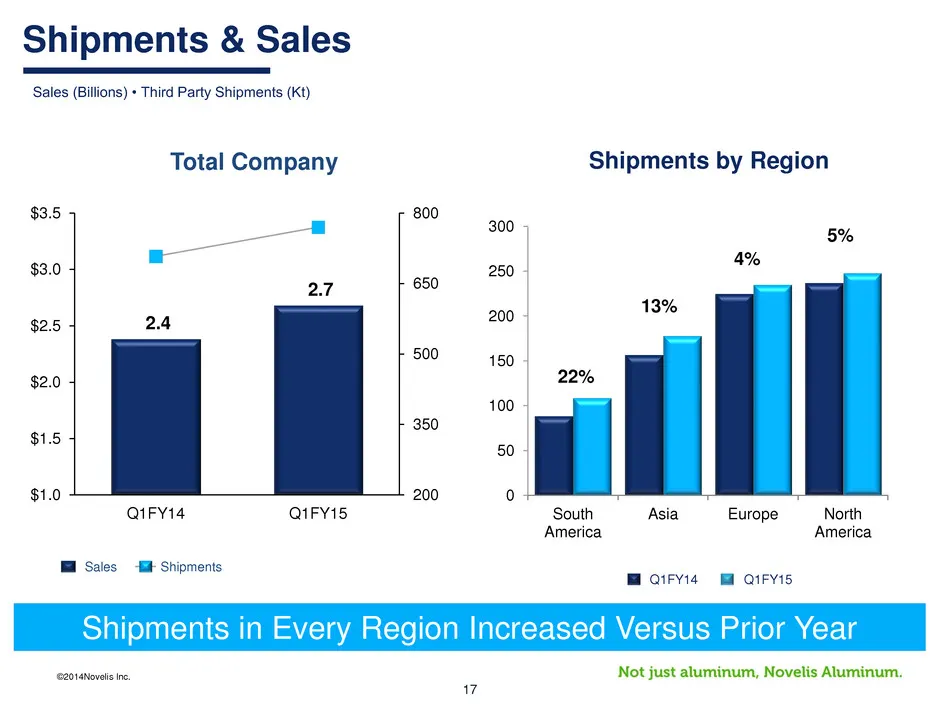
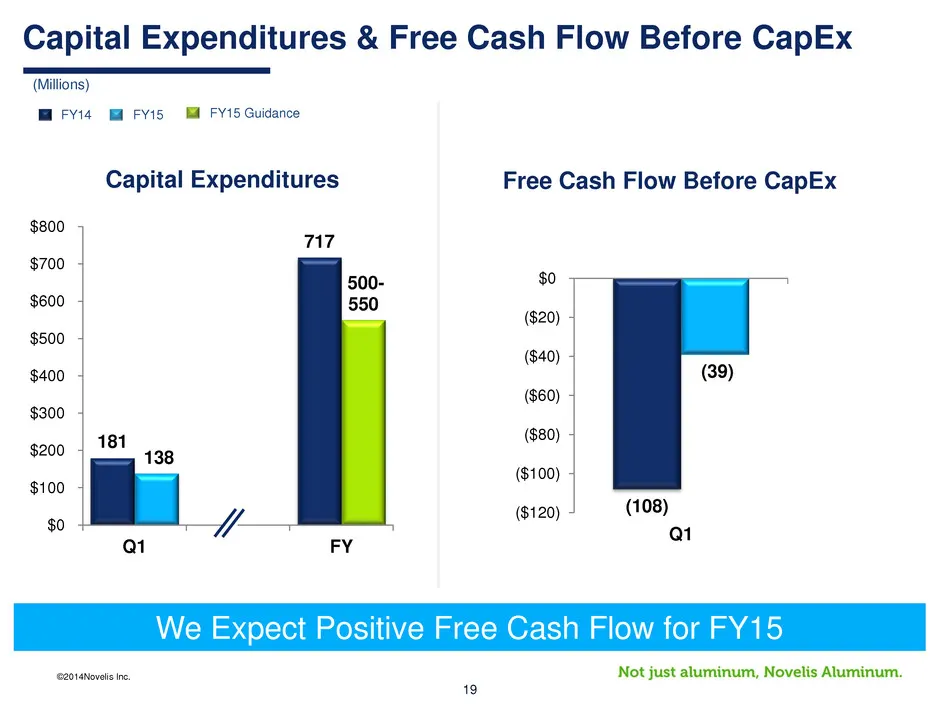
©2014Novelis Inc. 16 First Quarter Highlights Shipments Up 9% YoY to 770 Kilotonnes Sales Up 12% to $2.7 Billion Adjusted EBITDA Up 15% to $235 Million Net Income of $35 Million; Net Income Excluding Certain Items of $30 Million, up 43% Negative Free Cash Flow Before Capex ($39) Million, U
Slide 17: Shipments & Sales
©2014Novelis Inc. 17 2.4 2.7 200 350 500 650 800 $1.0 $1.5 $2.0 $2.5 $3.0 $3.5 Q1FY14 Q1FY15 Shipments Sales 0 50 100 150 200 250 300 South America Asia Europe North America 13% 4% 5% 22% Sales (Billions) • Third Party Shipments (Kt) Shipments & Sales Total Company Shipments by Region Q1FY15 Q1FY14
Slide 18: Q1FY15 Adjusted EBITDA Bridge
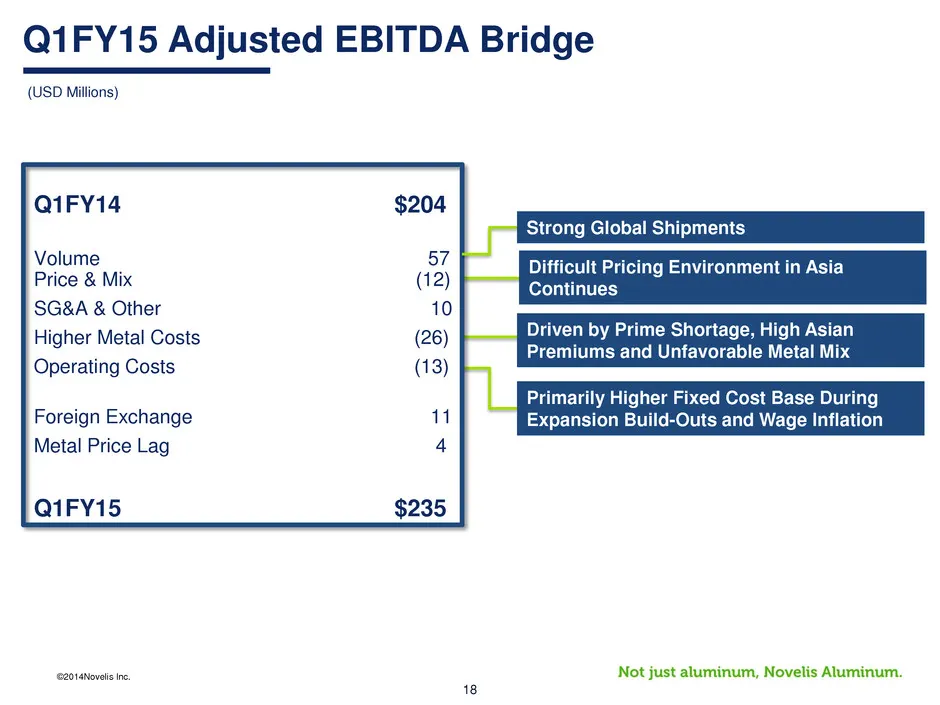
©2014Novelis Inc. 18 Q1FY15 Adjusted EBITDA Bridge (USD Millions) Q1FY14 $204 Volume 57 Price & Mix (12) SG&A & Other 10 Higher Metal Costs (26) Operating Costs (13) Foreign Exchange 11 Metal Price Lag 4 Q1FY15 $235 Difficult Pricing Environment in Asia Continues Primarily Higher Fixed Cost Base Dur
Slide 19: Capital Expenditures & Free Cash Flow Before CapEx
©2014Novelis Inc. 19 (Millions) Capital Expenditures & Free Cash Flow Before CapEx FY15 FY14 We Expect Positive Free Cash Flow for FY15 (108) (39) ($120) ($100) ($80) ($60) ($40) ($20) $0 Q1 Free Cash Flow Before CapEx Capital Expenditures 181 717 138 500- 550 $0 $100 $200 $300 $400 $500 $600 $700 $
Slide 20: Summary
©2014Novelis Inc. 20 Summary
Slide 21: Summary
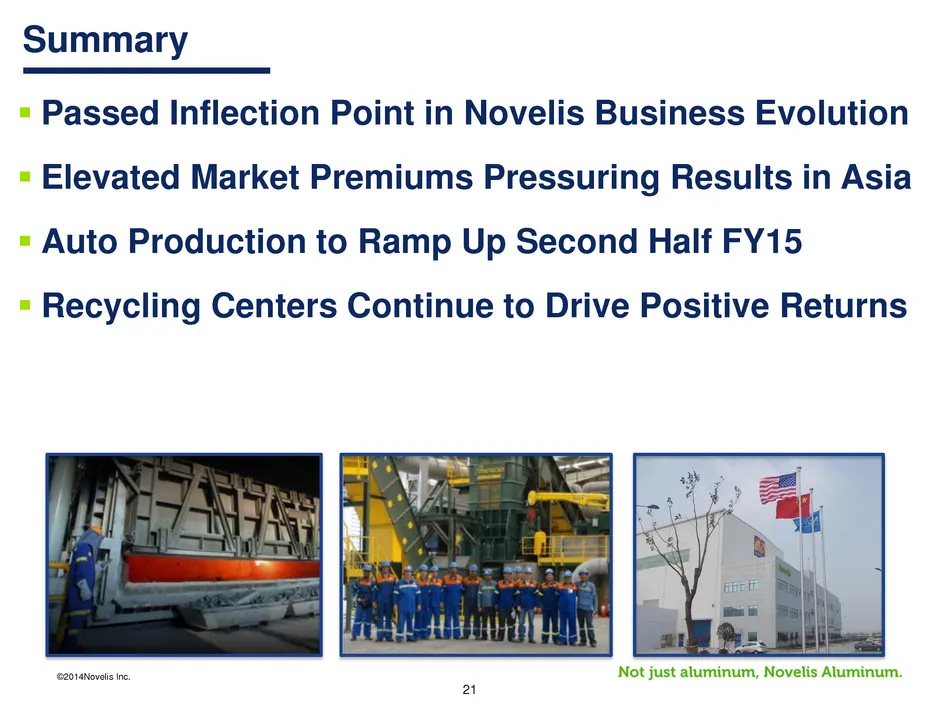
©2014Novelis Inc. 21 Passed Inflection Point in Novelis Business Evolution Elevated Market Premiums Pressuring Results in Asia Auto Production to Ramp Up Second Half FY15 Recycling Centers Continue to Drive Positive Returns Summary

Slide 22: Questions & Answers
©2014Novelis Inc. 22 Questions & Answers

Slide 23: Appendix
©2014Novelis Inc. 23 Appendix
Slide 24: Adjusted EBITDA Reconciliation
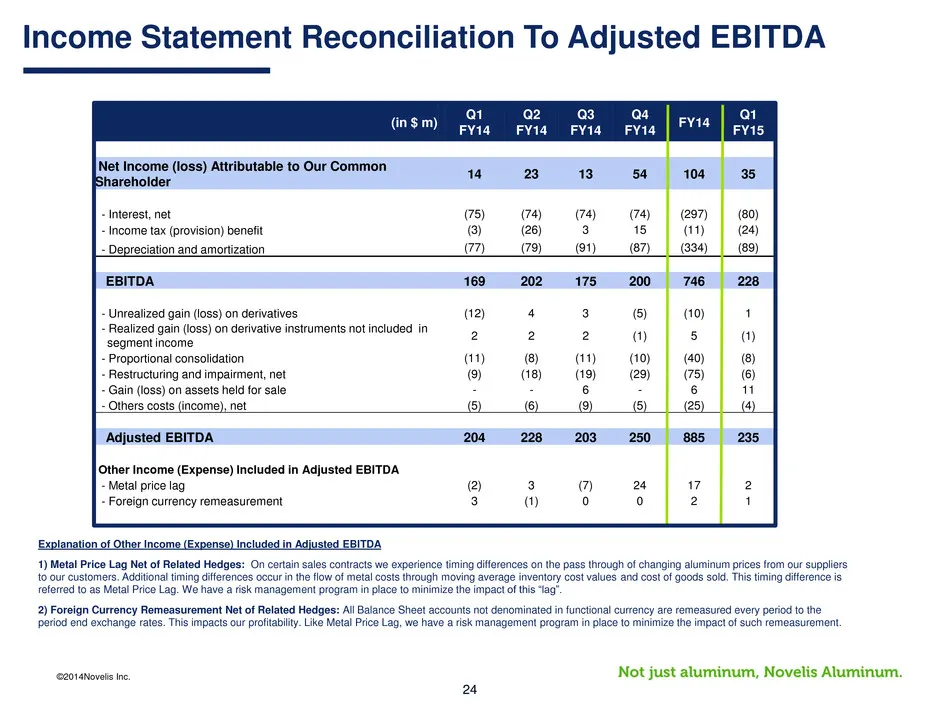
©2014Novelis Inc. 24 (in $ m) Q1 FY14 Q2 FY14 Q3 FY14 Q4 FY14 FY14 Q1 FY15 Net Income (loss) Attributable to Our Common Shareholder 14 23 13 54 104 35 - Interest, net (75) (74) (74) (74) (297) (80) - Income tax (provision) benefit (3) (26) 3 15 (11) (24) - Depreciation and amortization (77) (79) (91
Slide 25: Free Cash Flow Reconciliation
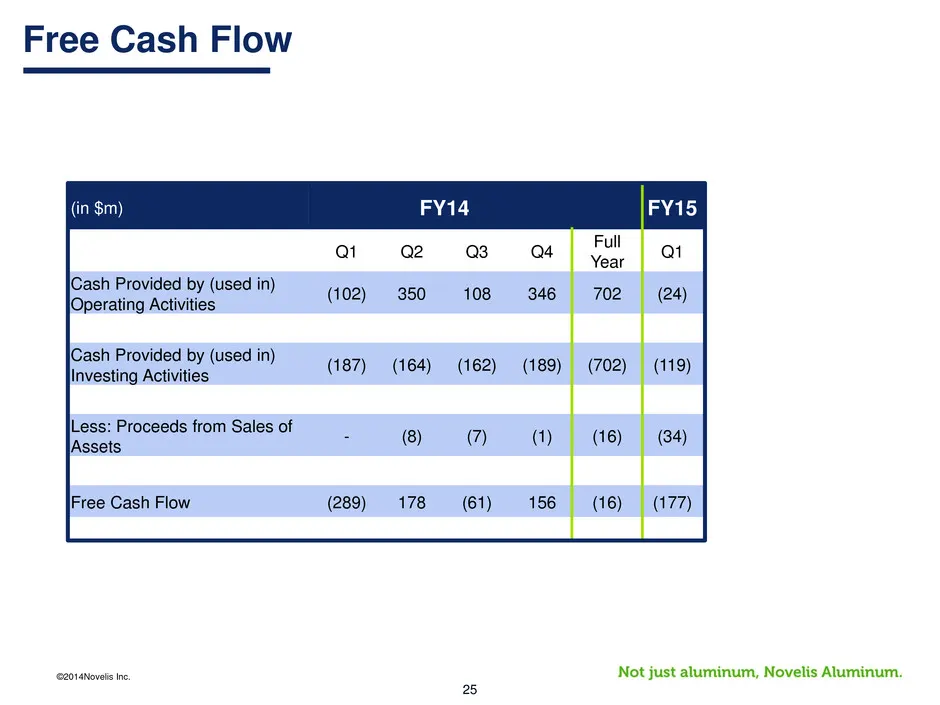
©2014Novelis Inc. 25 (in $m) FY14 FY15 Q1 Q2 Q3 Q4 Full Year Q1 Cash Provided by (used in) Operating Activities (102) 350 108 346 702 (24) Cash Provided by (used in) Investing Activities (187) (164) (162) (189) (702) (119) Less: Proceeds from Sales of Assets - (8) (7) (1) (16) (34) Free Cash Flow (2
Source: SEC EDGAR · 8-K filed Aug 7, 2014
More decks from Novelis Inc.
 Q2 FY2027 Earnings Presentation20 slides · Nov 5, 2026
 Q2 FY2027 Earnings Presentation31 slides · Nov 5, 2026
 Q1 FY2027 Earnings Presentation21 slides · Aug 5, 2026
 Q1 FY2027 Earnings Presentation31 slides · Aug 5, 2026
 Q4 FY2026 Earnings Presentation33 slides · May 19, 2026
 Q3 FY2026 Earnings Presentation33 slides · Feb 11, 2026