Alpha Natural Resources — Foundation Coal Holdings — Howard Weil 33rd Annual Energy Conference 2005
19 slides from Alpha Natural Resources's conference presentation, Apr 8, 2005
Slide 1: Foundation Coal Holdings, Inc.
FOUNDATION COAL HOLDINGS, INC. NYSE.
Slide 2: Forward-Looking Statements
FORWARD-LOOKING STATEMENTS Statements in this presentation which are not statements of historical fact are “forward-looking statements” within the “safe harbor” provision of the Private Securities Litigation Reform Act of 1995. These forward-looking statements are based on the information available
Slide 3: Company Overview
COMPANY OVERVIEW 5 largest coal producer in the United States Operations in the four major coal regions: PRB, NAPP, CAPP, Illinois Basin 1.8 billion tons of proven and probable reserves Diverse coal qualities: compliance; low sulfur; high Btu, mid sulfur; and metallurgical coal Independent subsidiar
Slide 4: Strong, sustainable coal pricing environment
Strong, sustainable coal pricing environment Large, diversified producer with presence in key U.S. supply regions Highly productive operations Positioned for significant revenue growth Attractive internal and external growth prospects Strong earnings and cash flow profile Experienced management focu
Slide 5: Strong and Sustainable Pricing Environment
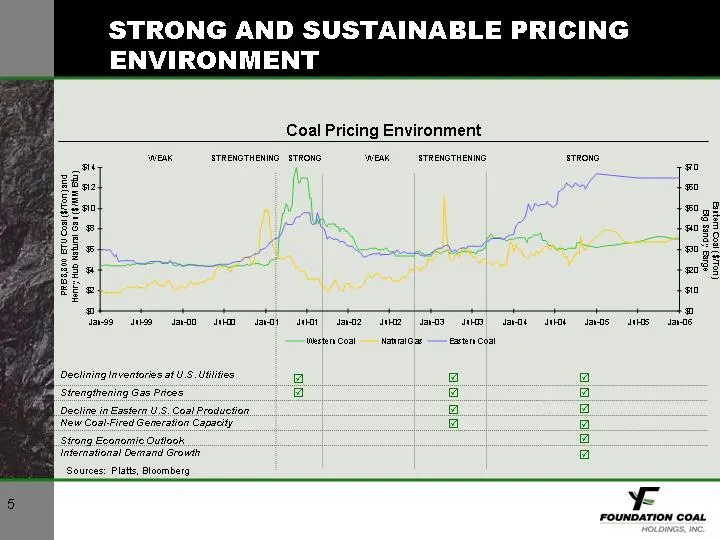
STRONG AND SUSTAINABLE PRICING ENVIRONMENT Coal Pricing Environment. Declining Inventories af U.S. Uttities ‘Strengitvening Gas Paces Decline in Eastern U.S. Coa! Production New Coal-Fired Generation Capacity Gols} ‘Strong Economic Outlook International Demand Growth 55588 Sources: Plate, Bloomberg
Slide 6: Sustainable U.S. Energy Demand Growth
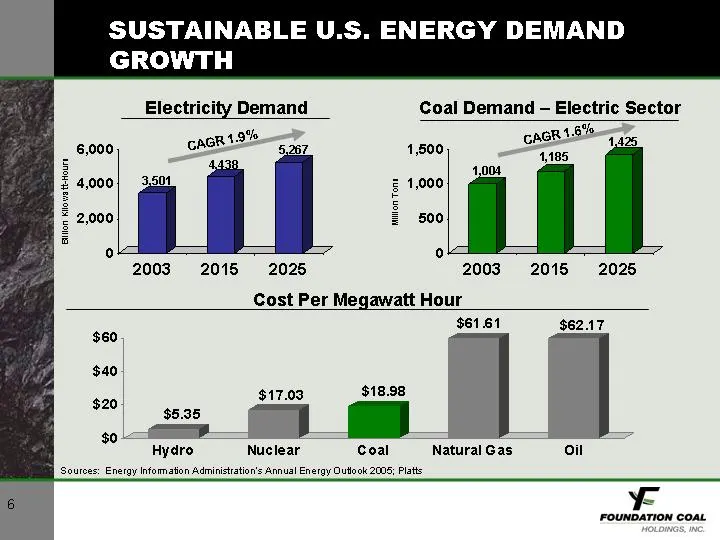
SUSTAINABLE U.S. ENERGY DEMAND GROWTH Electricity Demand Coal Demand - Electric Sector e ie GR 19% cach Sa © 5.267 1,500 4185 4,008 3.501 = 1,000 = 500 f ° 7 2003 «2015 =. 2025 2003 «2015 «=. 2025 Cost Per Megawatt Hour $6161 $62.17 $60 $40 $17.03 P| 98 $20 onep ~ $0: » ] Hydro Nuclear = Natural Gas
Slide 7: Changing Regional Coal Supply Dynamics
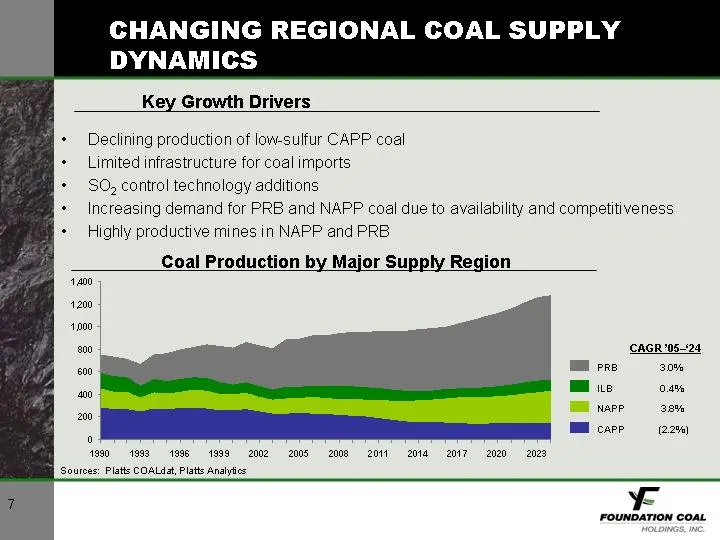
CHANGING REGIONAL COAL SUPPLY DYNAMICS Key Growth Drivers + Declining production of low-sulfur CAPP coal + Limited infrastructure for coal imports + $0, control technology additions + Increasing demand for PRB and NAPP coal due to availability and competitiveness + Highly productive mines in NAPP an
Slide 8: Diversified Operations
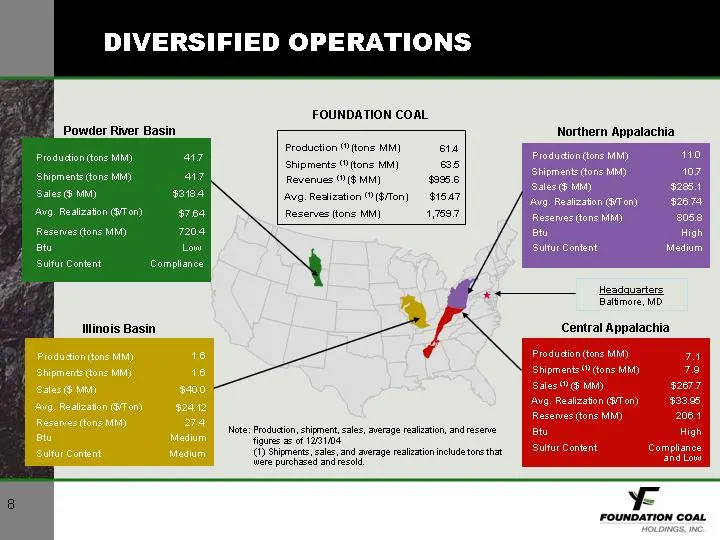
DIVERSIFIED OPERATIONS FOUNDATION COAL Northern Appalachia Production ‘tons MM} sta frocidant Shipments (tone MM) 635 Shipment Revenues (8 MM) $395.6 ales ‘Avg. Realization ($/Ton) $1547 Reserves tons MM] 41,7587 Compliance L = = L Headquarters Batimore, MD Minots Basin Central Appalachia Note: Prod
Slide 9: Balanced Presence in Key U.S. Regions
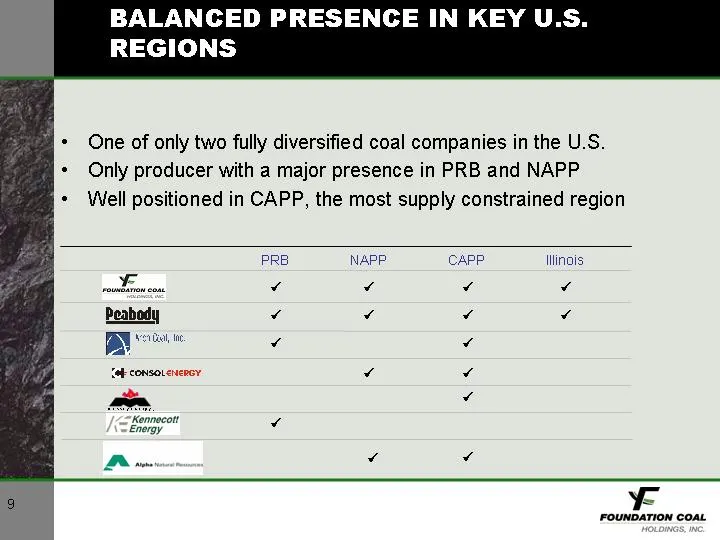
BALANCED PRESENCE IN KEY U.S. REGIONS - One of only two fully diversified coal companies in the U.S. + Only producer with a major presence in PRB and NAPP + Well positioned in CAPP, the most supply constrained region PRB NAPP CAPP Mhlinois: wEenene Z Z z Z Peabody g Zi g 7 Boe z z ooseae, y, ¥ a “ E
Slide 10: Highly Productive Operations
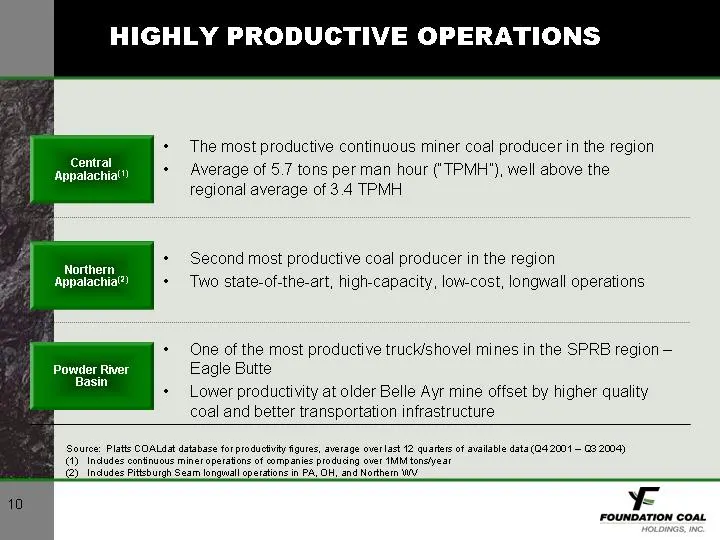
HIGHLY PRODUCTIVE OPERATIONS The most productive continuous miner coal producer in the region Central Freeuitenmml - Average of 5.7 tons perman hour (“TPMH"), well above the regional average of 3.4 TPMH en Second most productive coal producer in the region Appalachia?) Two state-of-the-art, high-cap
Slide 11: New Contracts at Favorable Pricing
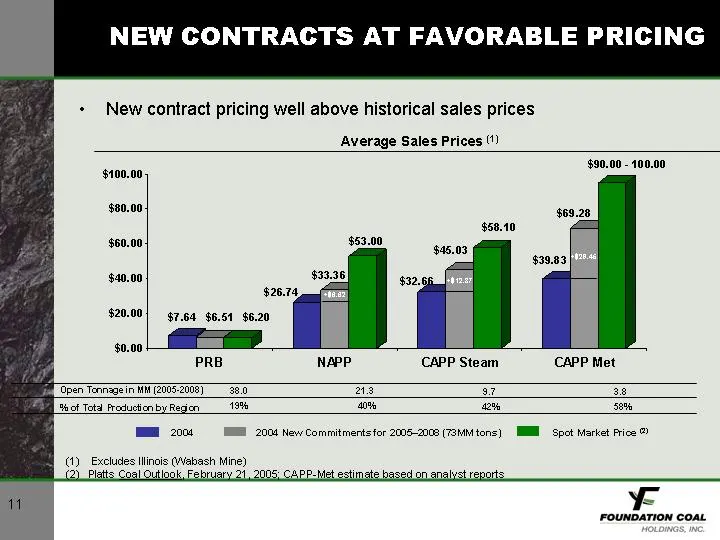
NEW CONTRACTS AT FAVORABLE PRICING + New contract pricing well above historical sales prices Average Sales Prices (1) $90.00 - 100.00 100,00 20,00 mae $0.10 53.00 $50.00 ‘ - sansa $0.00 s236] $2074 $20.00 —— 64 $6.51 $6.20 0.00 a CAPP Steam CAPP Met. FRAT a a7 a shot Told Roduaten by Regen 1% cm 2 s
Slide 12: Increasing Market Upside
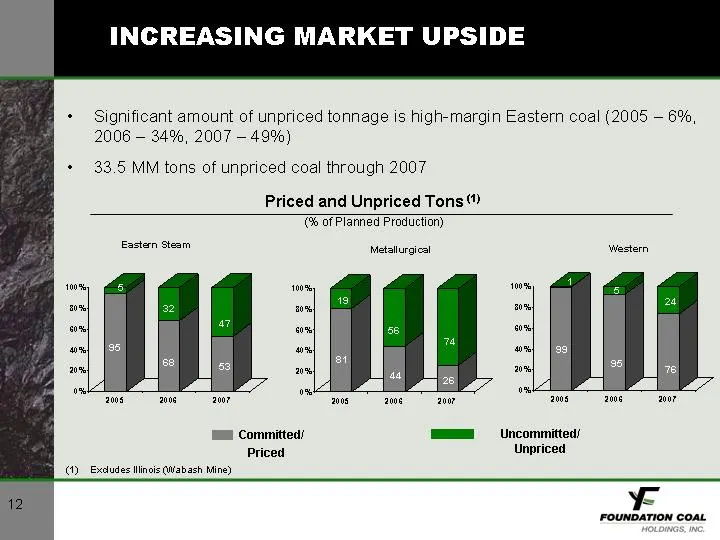
INCREASING MARKET UPSIDE + Significant amount of unpriced tonnage is high-margin Eastern coal (2005 — 6%, 2006 — 34%, 2007 — 49%) + 33.5 MM tons of unpriced coal through 2007 Priced and Unpriced Tons (Ge of Planned Production) Eastern Steam Metallurgical Western | 204 2094 Committed! Uncommitted Pri
Slide 13: Disciplined Approach to Growth
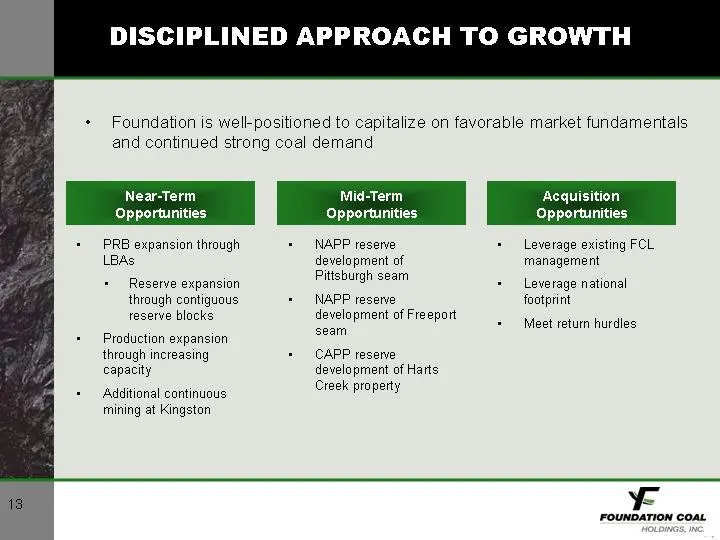
DISCIPLINED APPROACH TO GROWTH Foundation is well-positioned to capitalize on favorable market fundamentals and continued strong coal demand Near-Term Mid-Term Acquisition Opportunities Opportunities Opportunities PRB expansion thraugh LBAs + Reserve expansion through contiguous reserve blocks Produ
Slide 14: Significant Reserve Base in Northern Appalachia
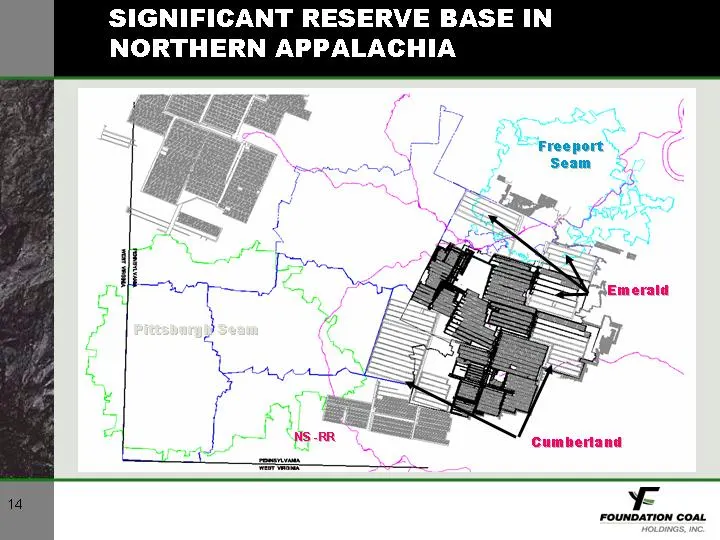
SIGNIFICANT RESERVE BASE IN NORTHERN APPALACHIA Cumbertand
Slide 15: Revenue and EBITDA History and Outlook
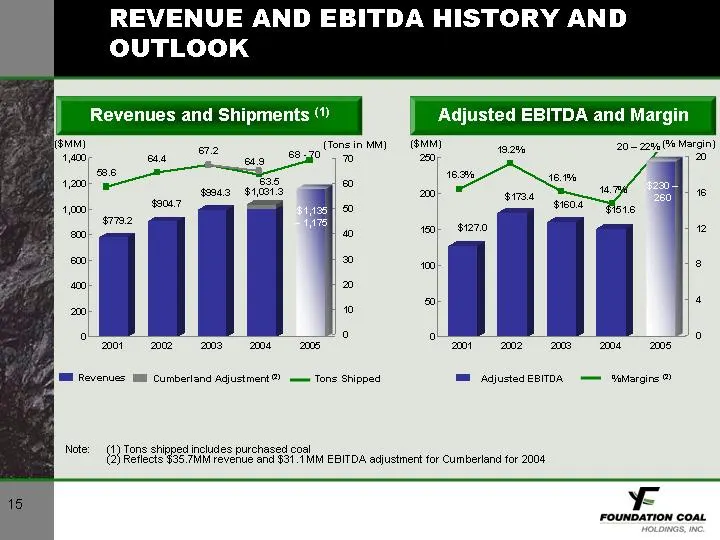
REVENUE AND EBITDA HISTORY AND OUTLOOK Z Revenues and Shipments “ Adjusted EBITDA and Margin tev Se 192% 20-246 Nargn) ws sg 10 oe S35 ie em seas $40st3 so, $1270 o § 6 8 8 4 fy eas 8 8 8 B mo aces, ant ze (me revenues lm Cumberland Adjustment® — Tons Shipped ME Adjusted EBITDA m= SeMargins Neto: Tn
Slide 16: Experienced Management Team
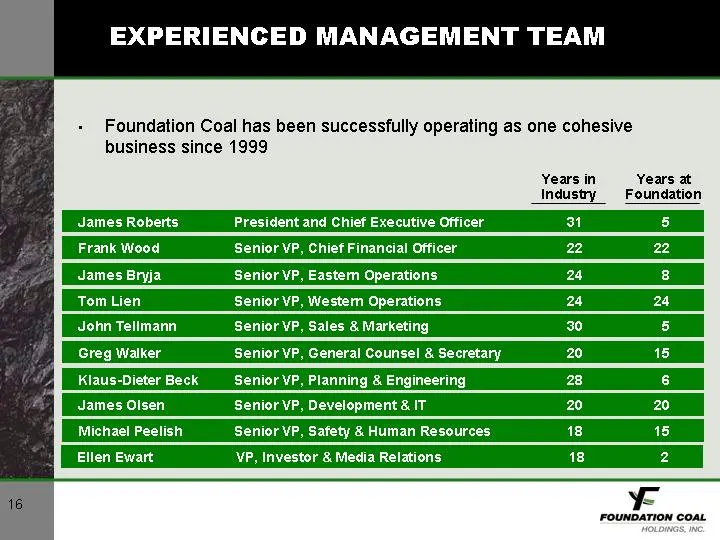
EXPERIENCED MANAGEMENT TEAM - Foundation Coal has been successfully operating as one cohesive business since 1999 Yearsin _ Years at Industry Foundation James Roberts President and Chief Executive Officer 31 Frank Wood Senior VP, Chief Financial Officer 22 James Bryja Senior VP, Eastem Operations 24
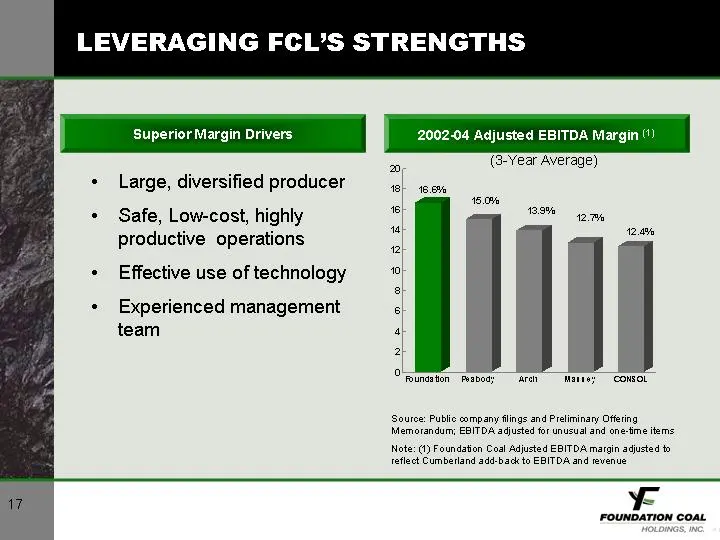
Slide 17: Leveraging FCL's Strengths
LEVERAGING FCL’S STRENGTHS ¢ Superior Margin Drivers 2002-04 Adjusted EBITDA Margin") (3Year Average) 2» + Large, diversified producer eee 180% + Safe, Low-cost, highly * P Bo om 2 = “4 2. productive operations | 5 + Effective use of technology o e + Experienced management | team 4 pf A ba 7 O'punas
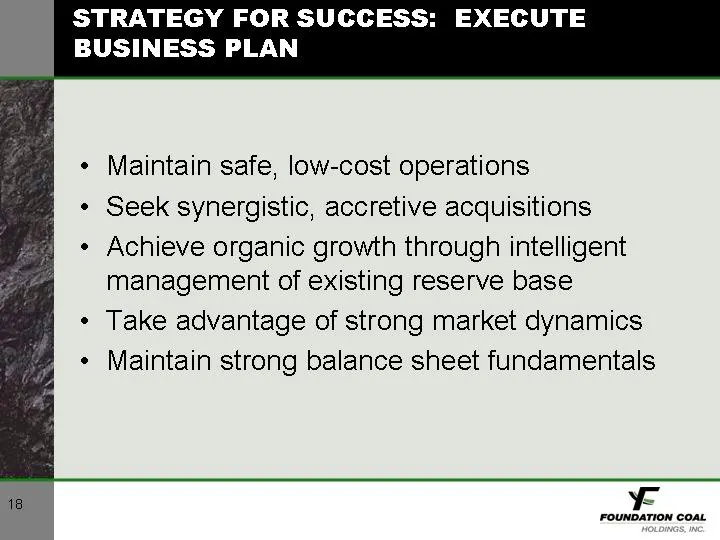
Slide 18: Strategy for Success: Execute Business Plan
STRATEGY FOR SUCCESS: EXECUTE BUSINESS PLAN Maintain safe, low-cost operations Seek synergistic, accretive acquisitions Achieve organic growth through intelligent management of existing reserve base Take advantage of strong market dynamics Maintain strong balance sheet fundamentals ral FOUNDATION CO
Slide 19: Searchable text section of graphics shown above
Searchable text section of graphics shown above [ LOG O] [LOGO] Howard Weil 33 rd Annual Energy Conference April 5, 2005 FOR WARD-LOOKING STATEMENTS Statements in this presentation which are not statements of historical fact are “forward-looking statements” within the “safe harbor” provision of the
Source: SEC EDGAR · 8-K filed Apr 8, 2005
More decks from Alpha Natural Resources Inc
 J.P. Morgan Global High Yield & Leveraged Finance Conference (February 2015)36 slides · Feb 23, 2015
 Barclays CEO Energy-Power Conference 201435 slides · Sep 2, 2014
 2014 BMO 23rd Global Metals and Mining Conference; Sterne Agee 2014 Boston Executive Summi33 slides · Jun 17, 2014
 2014 BMO 23rd Global Metals and Mining Conference / Brean Capital 2014 Global Resources &30 slides · May 28, 2014
 2014 BMO 23rd Global Metals and Mining Conference30 slides · Feb 24, 2014
 Tuohy Brothers' 4th Annual Energy Conference (August 2013)26 slides · Aug 5, 2013