Goodrich — Salomon Smith Barney 16th Annual Global Industrial Manufacturing Conference (March 2003)
12 slides from Goodrich's conference presentation, Mar 11, 2003

Slide 1: Excerpts from presentation materials, Salomon Smith Barney Industrial Manufacturing Conference
EXHIBIT 99.2 Excerpts from presentation materials dated March 11, 2003 to be presented by Marshall O. Larsen, President and Chief Operating Officer of Goodrich Corporation, at the Salomon Smith Barney 16th Annual Global Industrial Manufacturing Conference.

Slide 2: Forward Looking Statements
FORWARD LOOKING STATEMENTS Certain statements made in this presentation are forward-looking statements within the meaning of the Private Securities Litigation Reform Act of 1995 regarding the Company’s future plans, objectives, and expected performance. The Company cautions readers that any such for
Slide 3: Non-GAAP Financial Measures
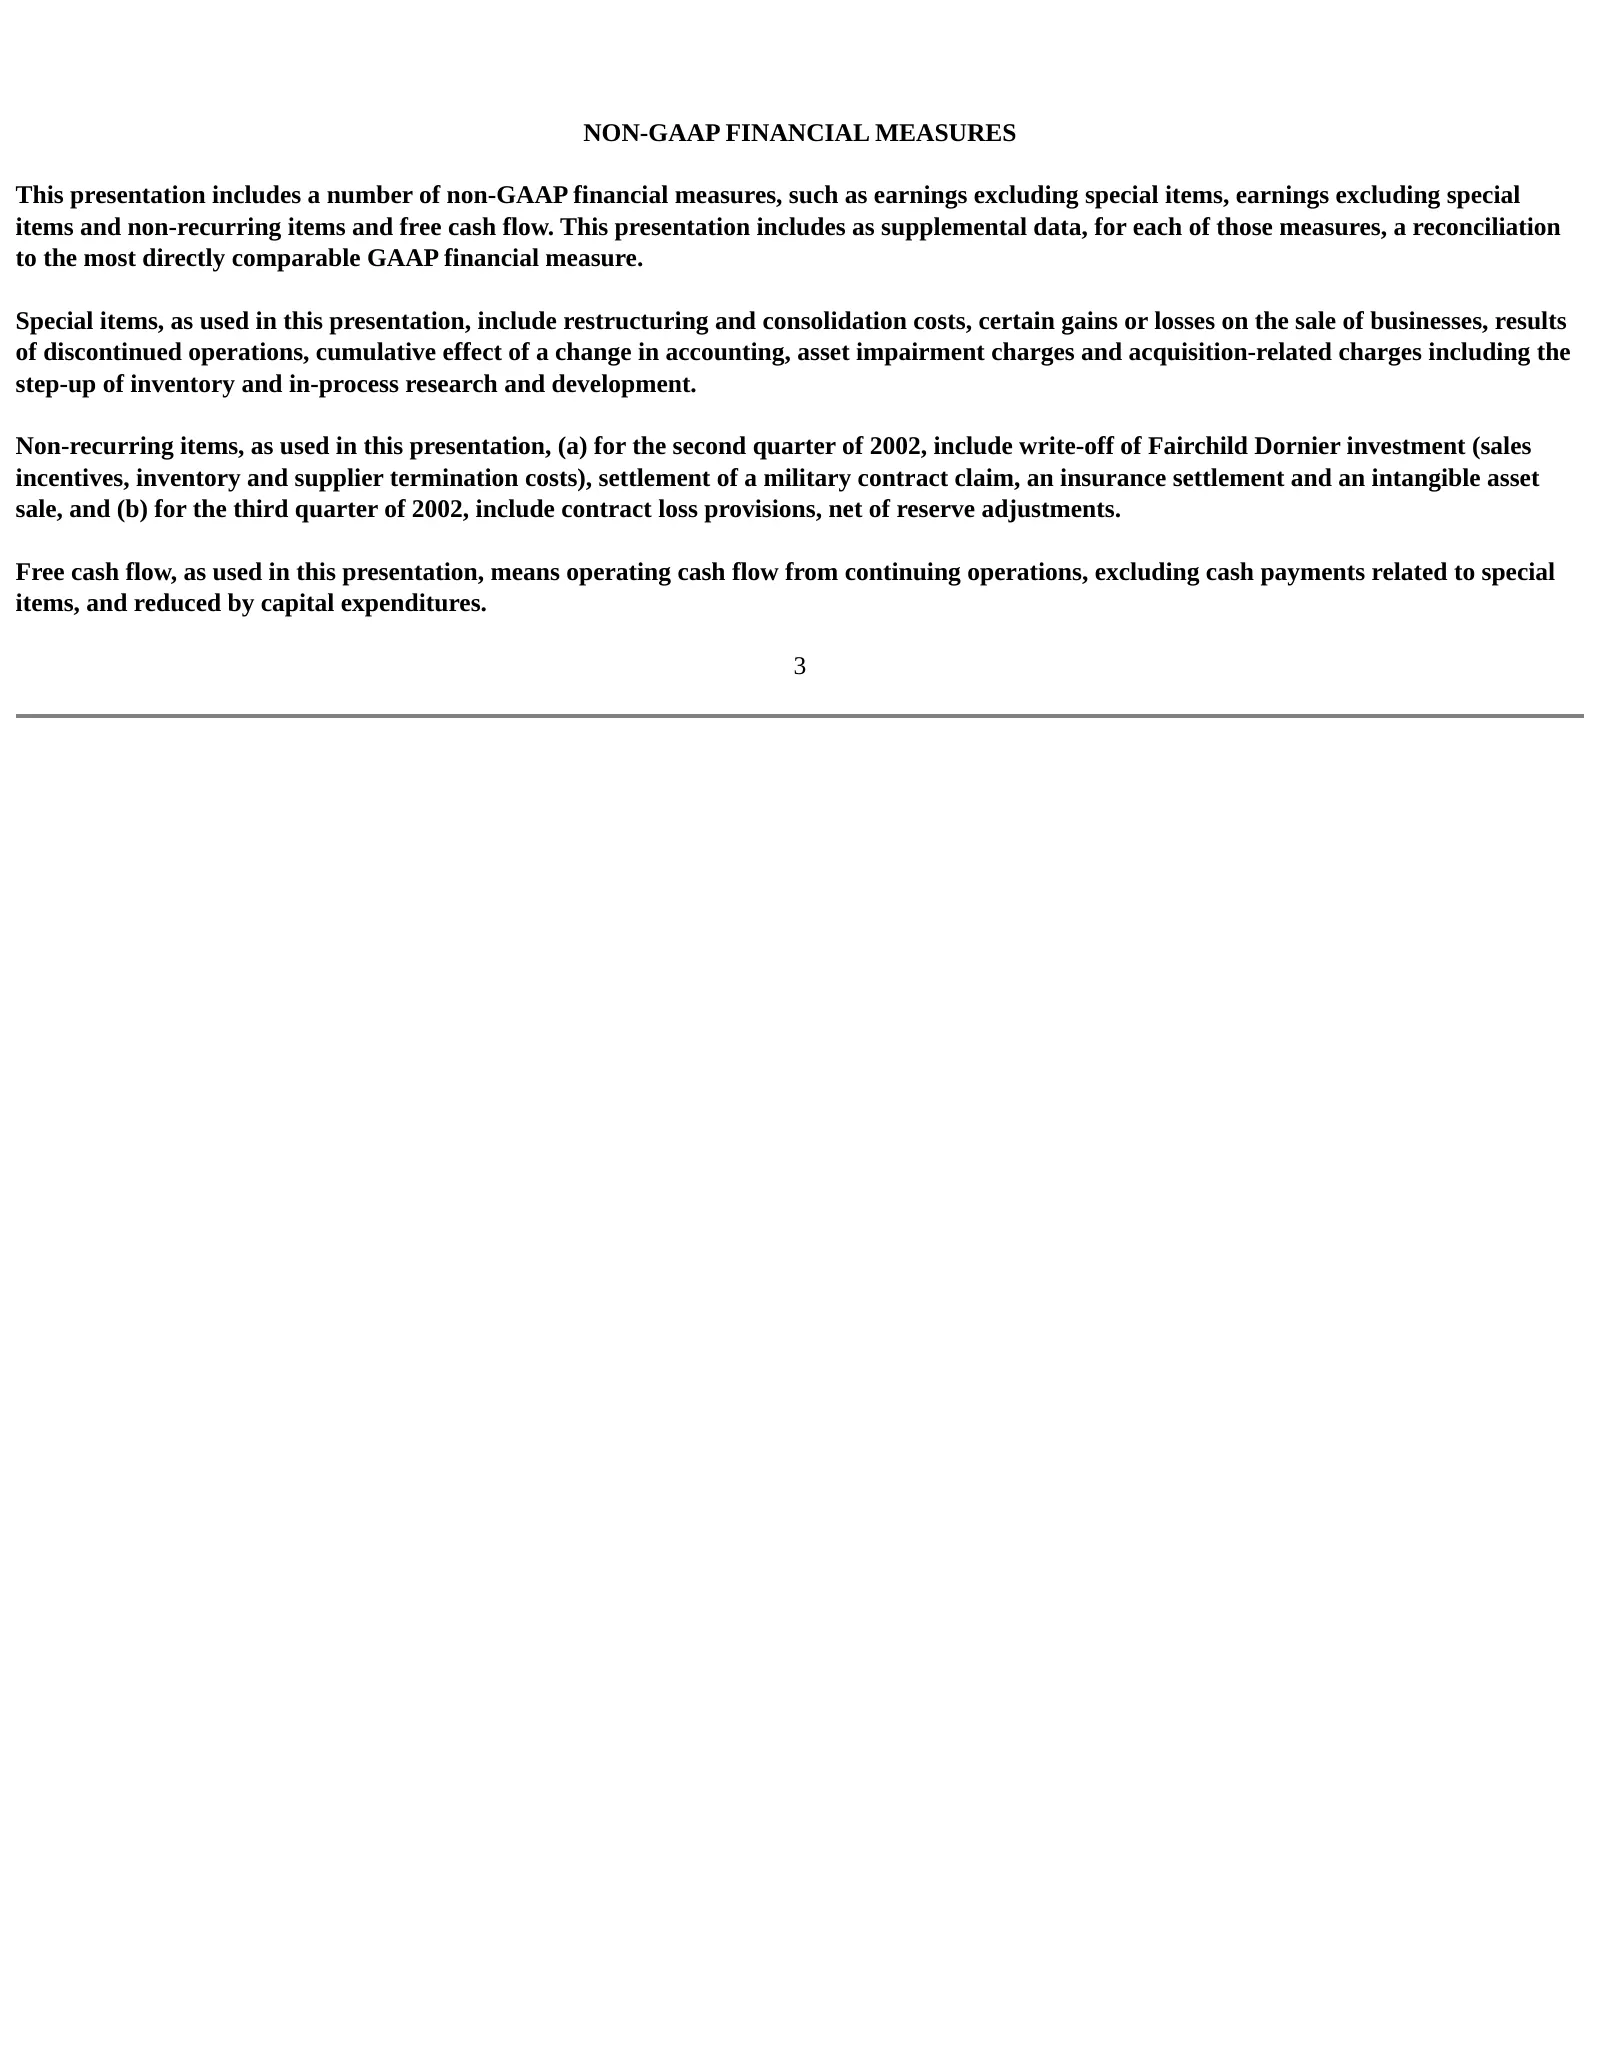
NON-GAAP FINANCIAL MEASURES This presentation includes a number of non-GAAP financial measures, such as earnings excluding special items, earnings excluding special items and non-recurring items and free cash flow. This presentation includes as supplemental data, for each of those measures, a reconc
Slide 4: Sales by Industry Channel – 1999 – 2003E
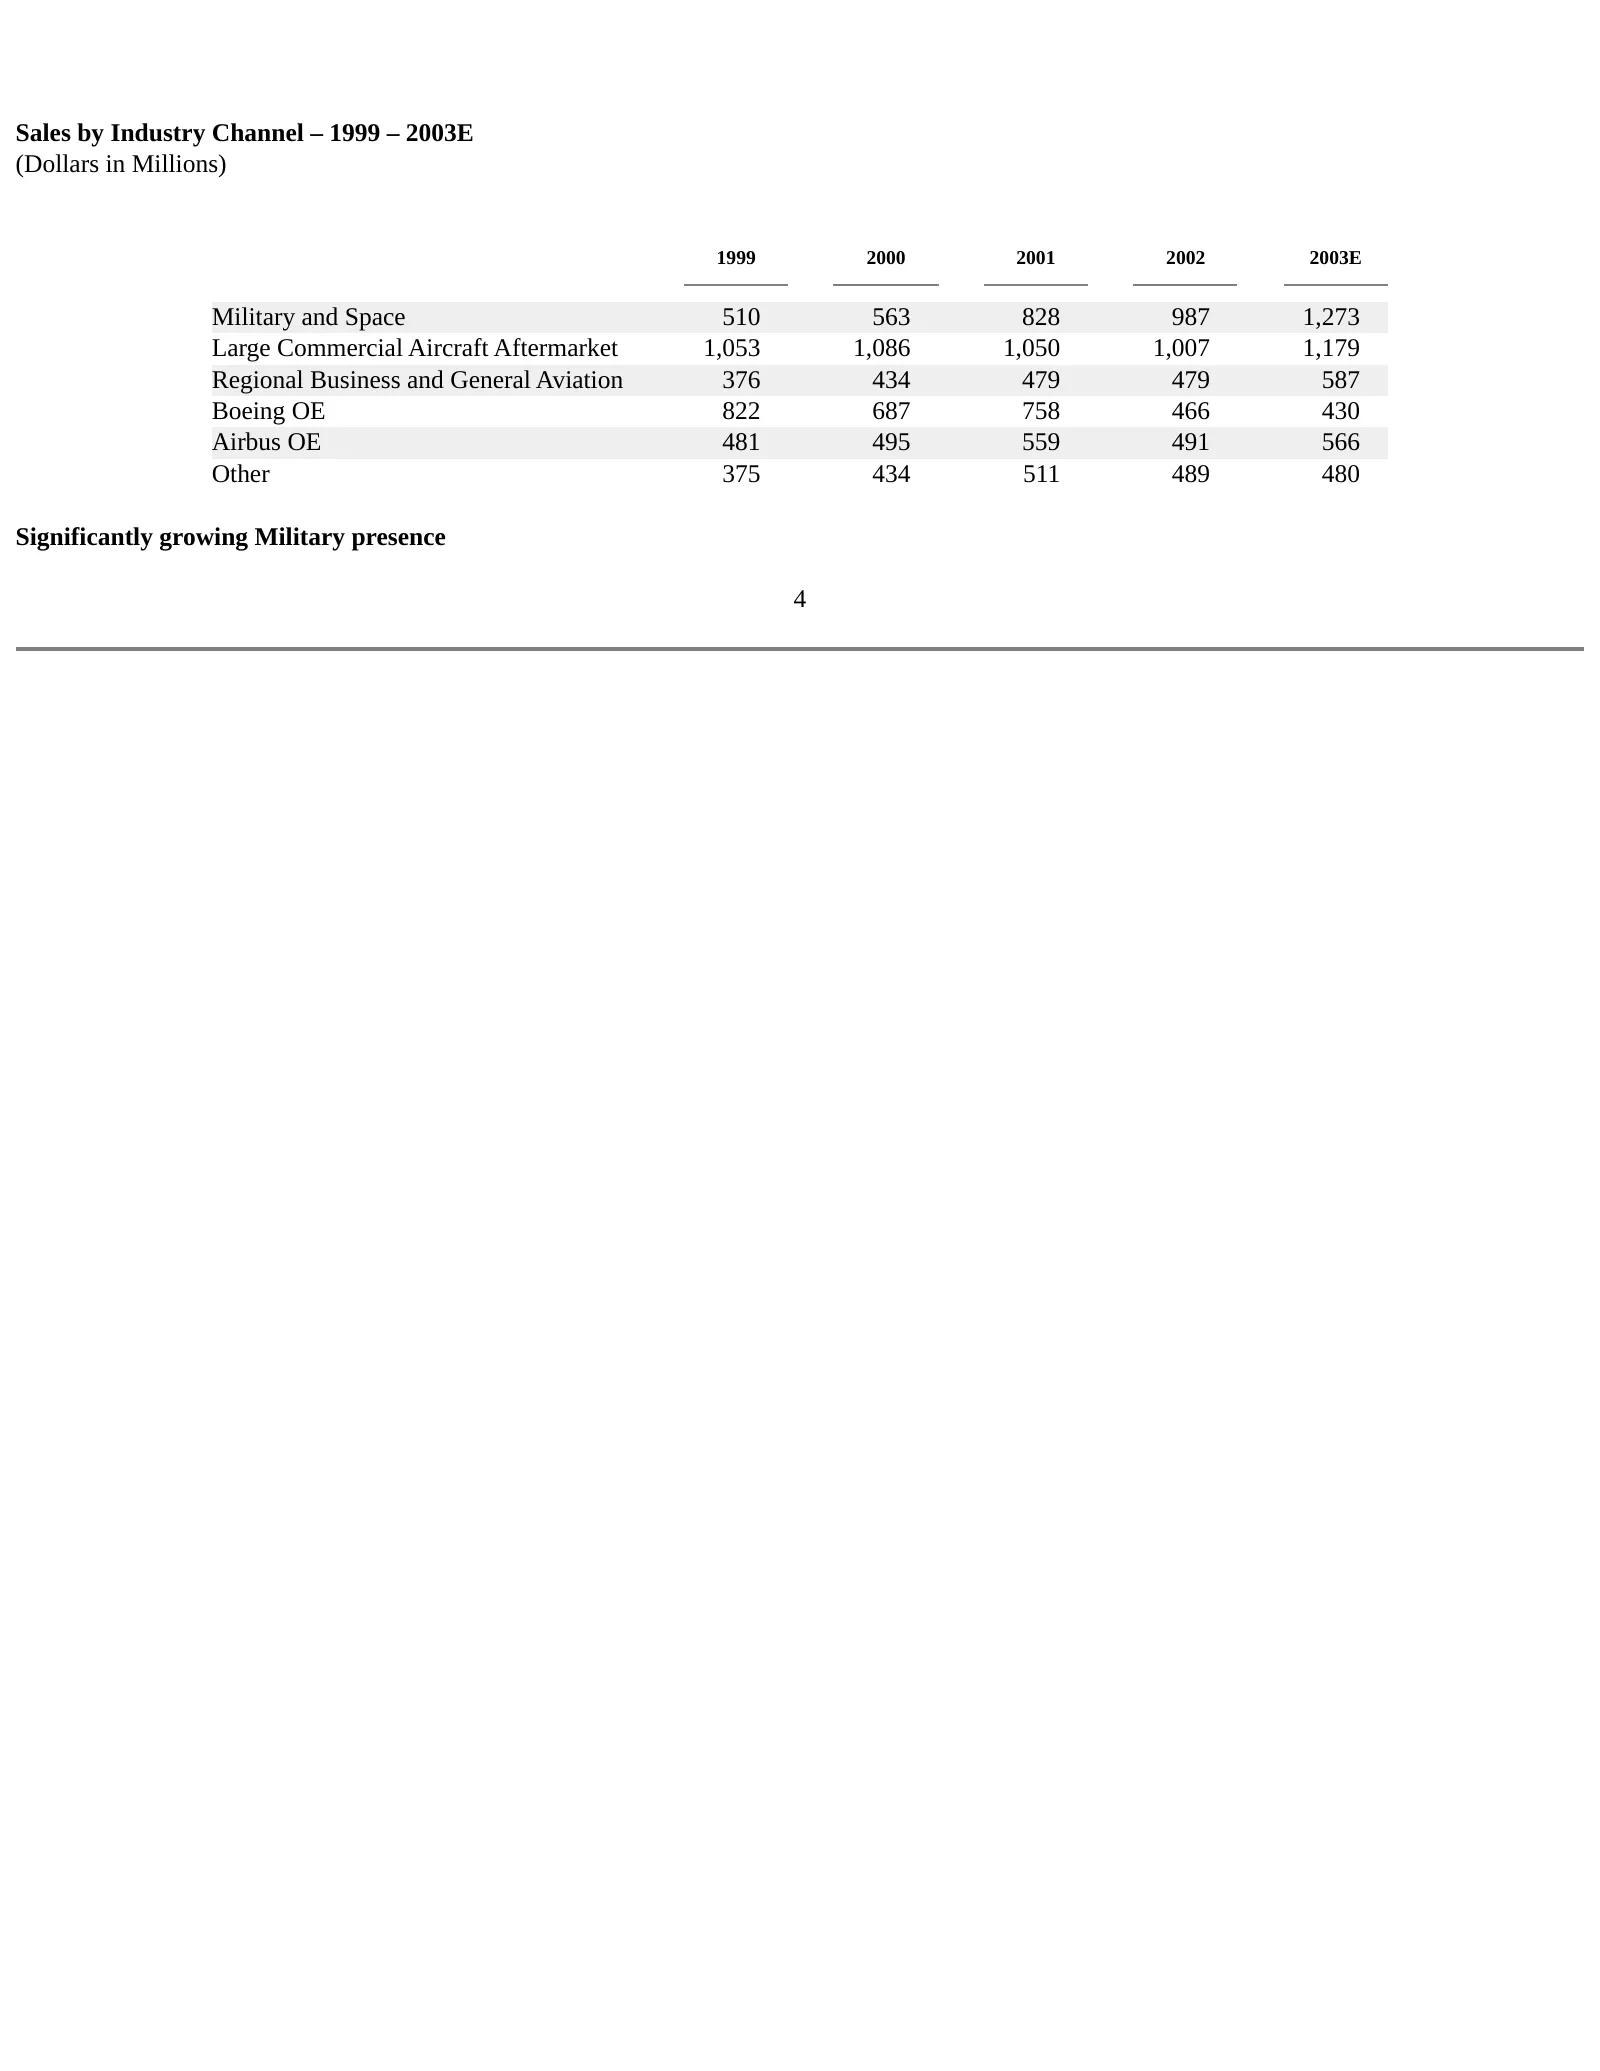
Sales by Industry Channel – 1999 – 2003E (Dollars in Millions) 1999 2000 2001 2002 2003E Military and Space 510 563 828 987 1,273 Large Commercial Aircraft Aftermarket 1,053 1,086 1,050 1,007 1,179 Regional Business and General Aviation 376 434 479 479 587 Boeing OE 822 687 758 466 430 Airbus OE 481
Slide 5: Development Programs Will Accelerate Future Growth
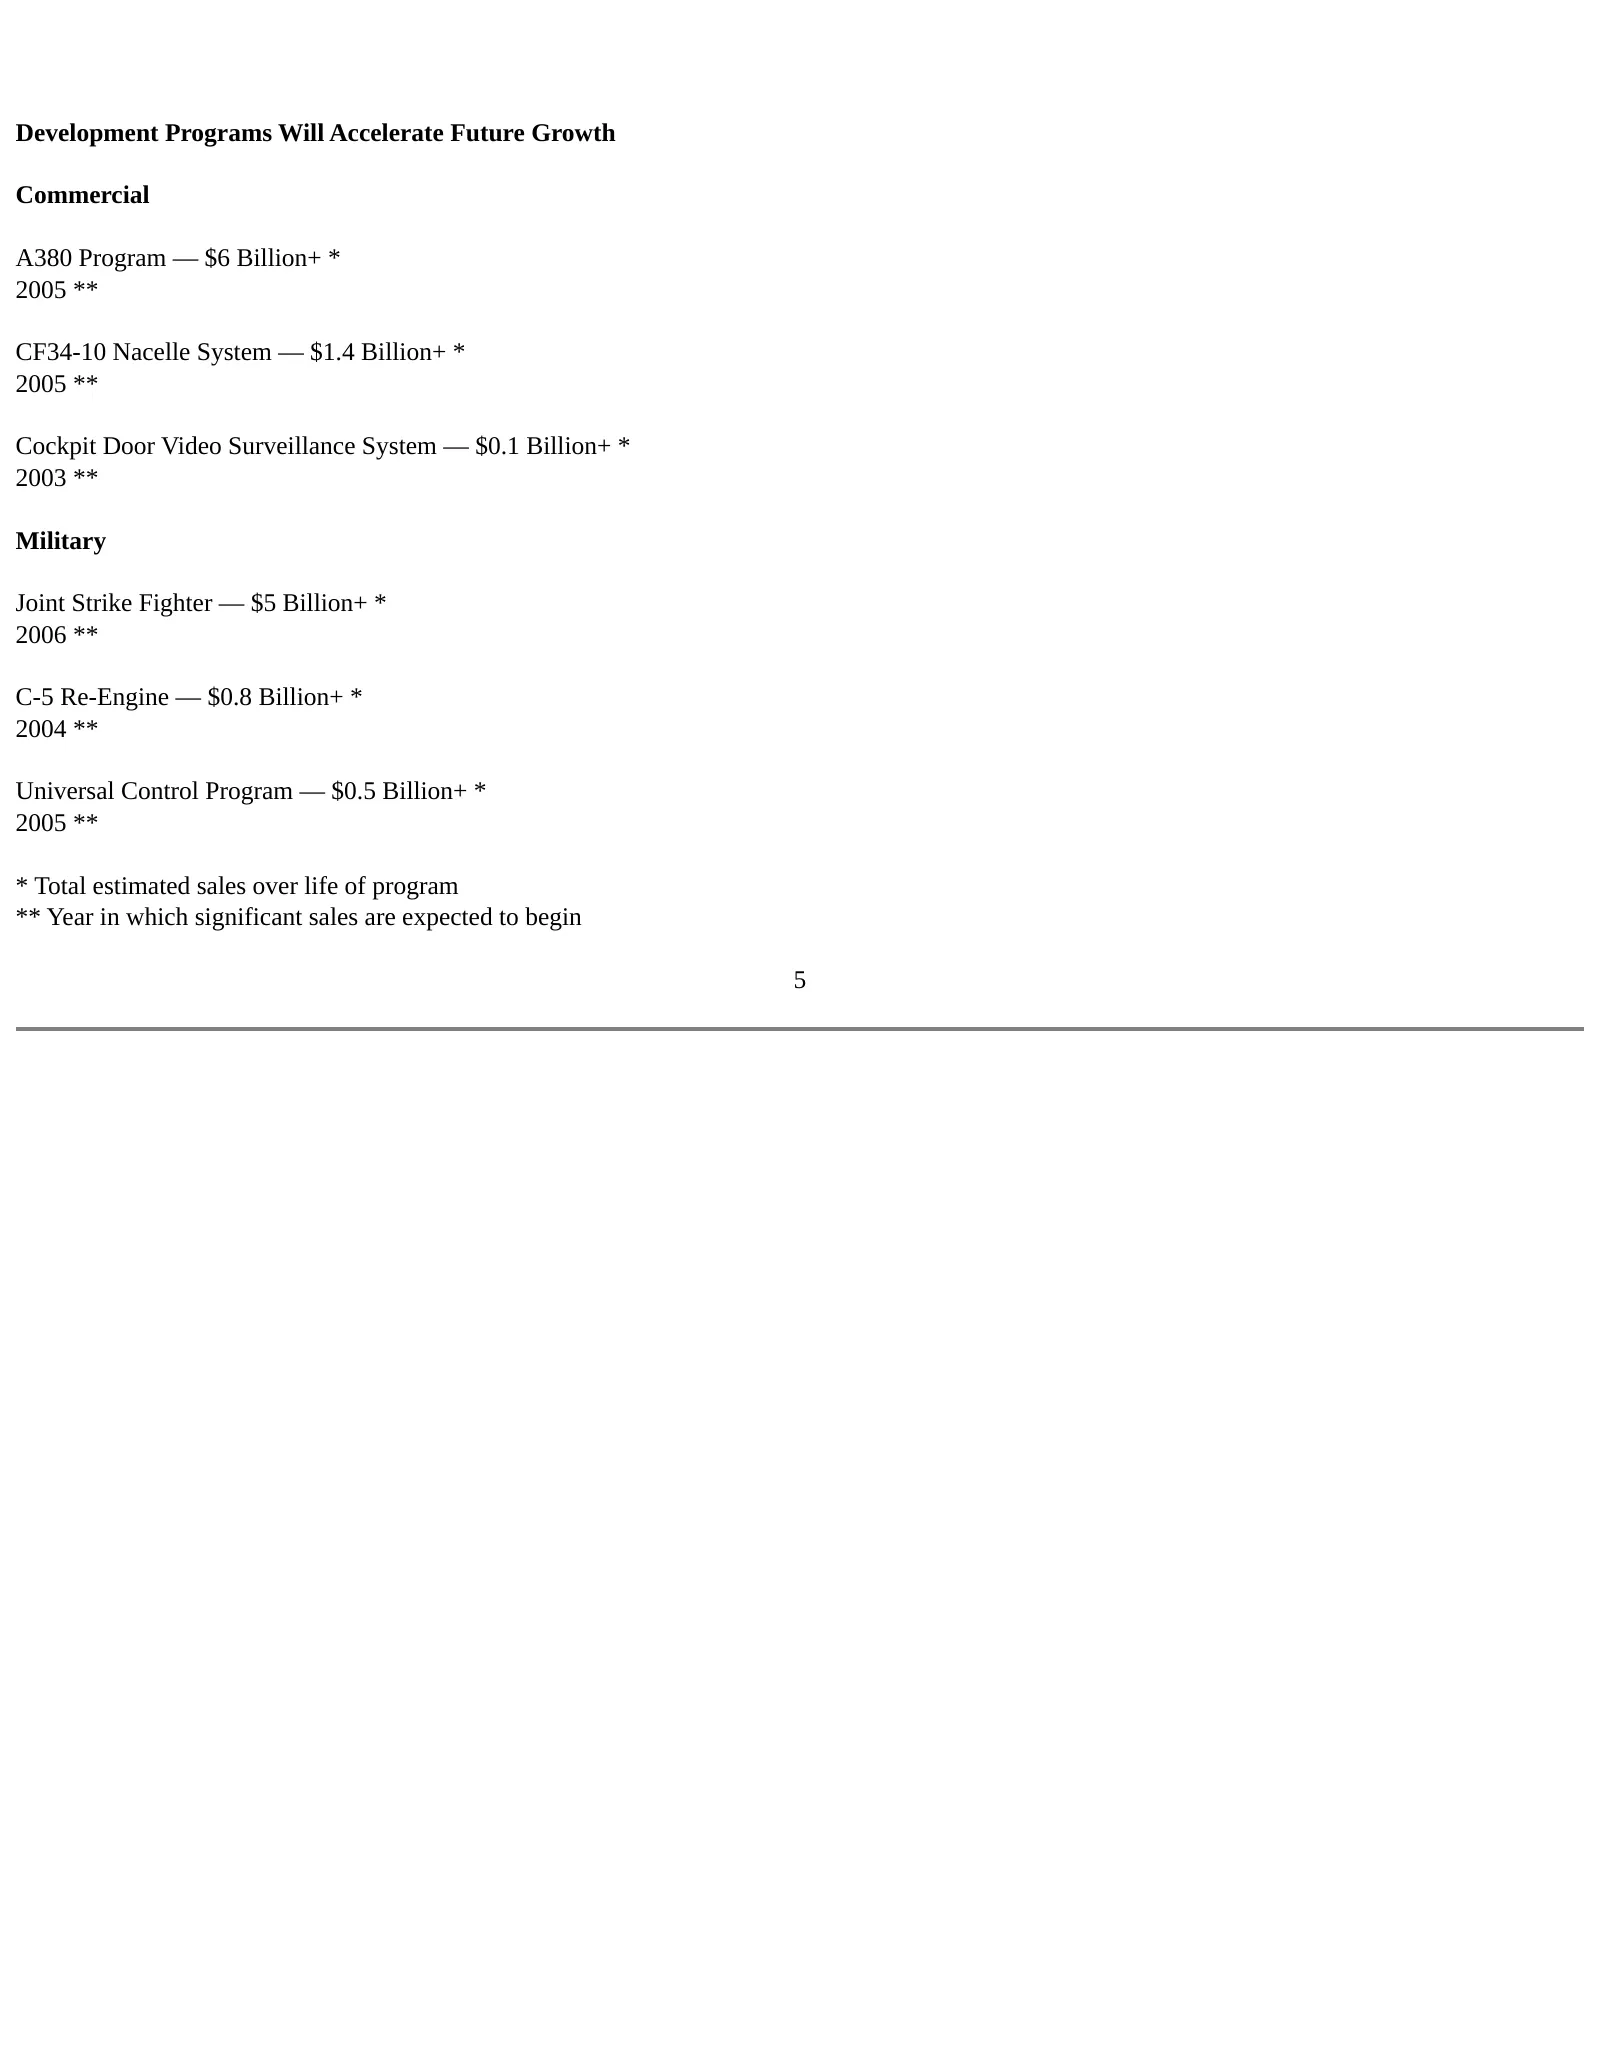
Development Programs Will Accelerate Future Growth Commercial A380 Program — $6 Billion+ * 2005 ** CF34-10 Nacelle System — $1.4 Billion+ * 2005 ** Cockpit Door Video Surveillance System — $0.1 Billion+ * 2003 ** Military Joint Strike Fighter — $5 Billion+ * 2006 ** C-5 Re-Engine — $0.8 Billion+ * 2
Slide 6: Expected Future Sales from New Programs
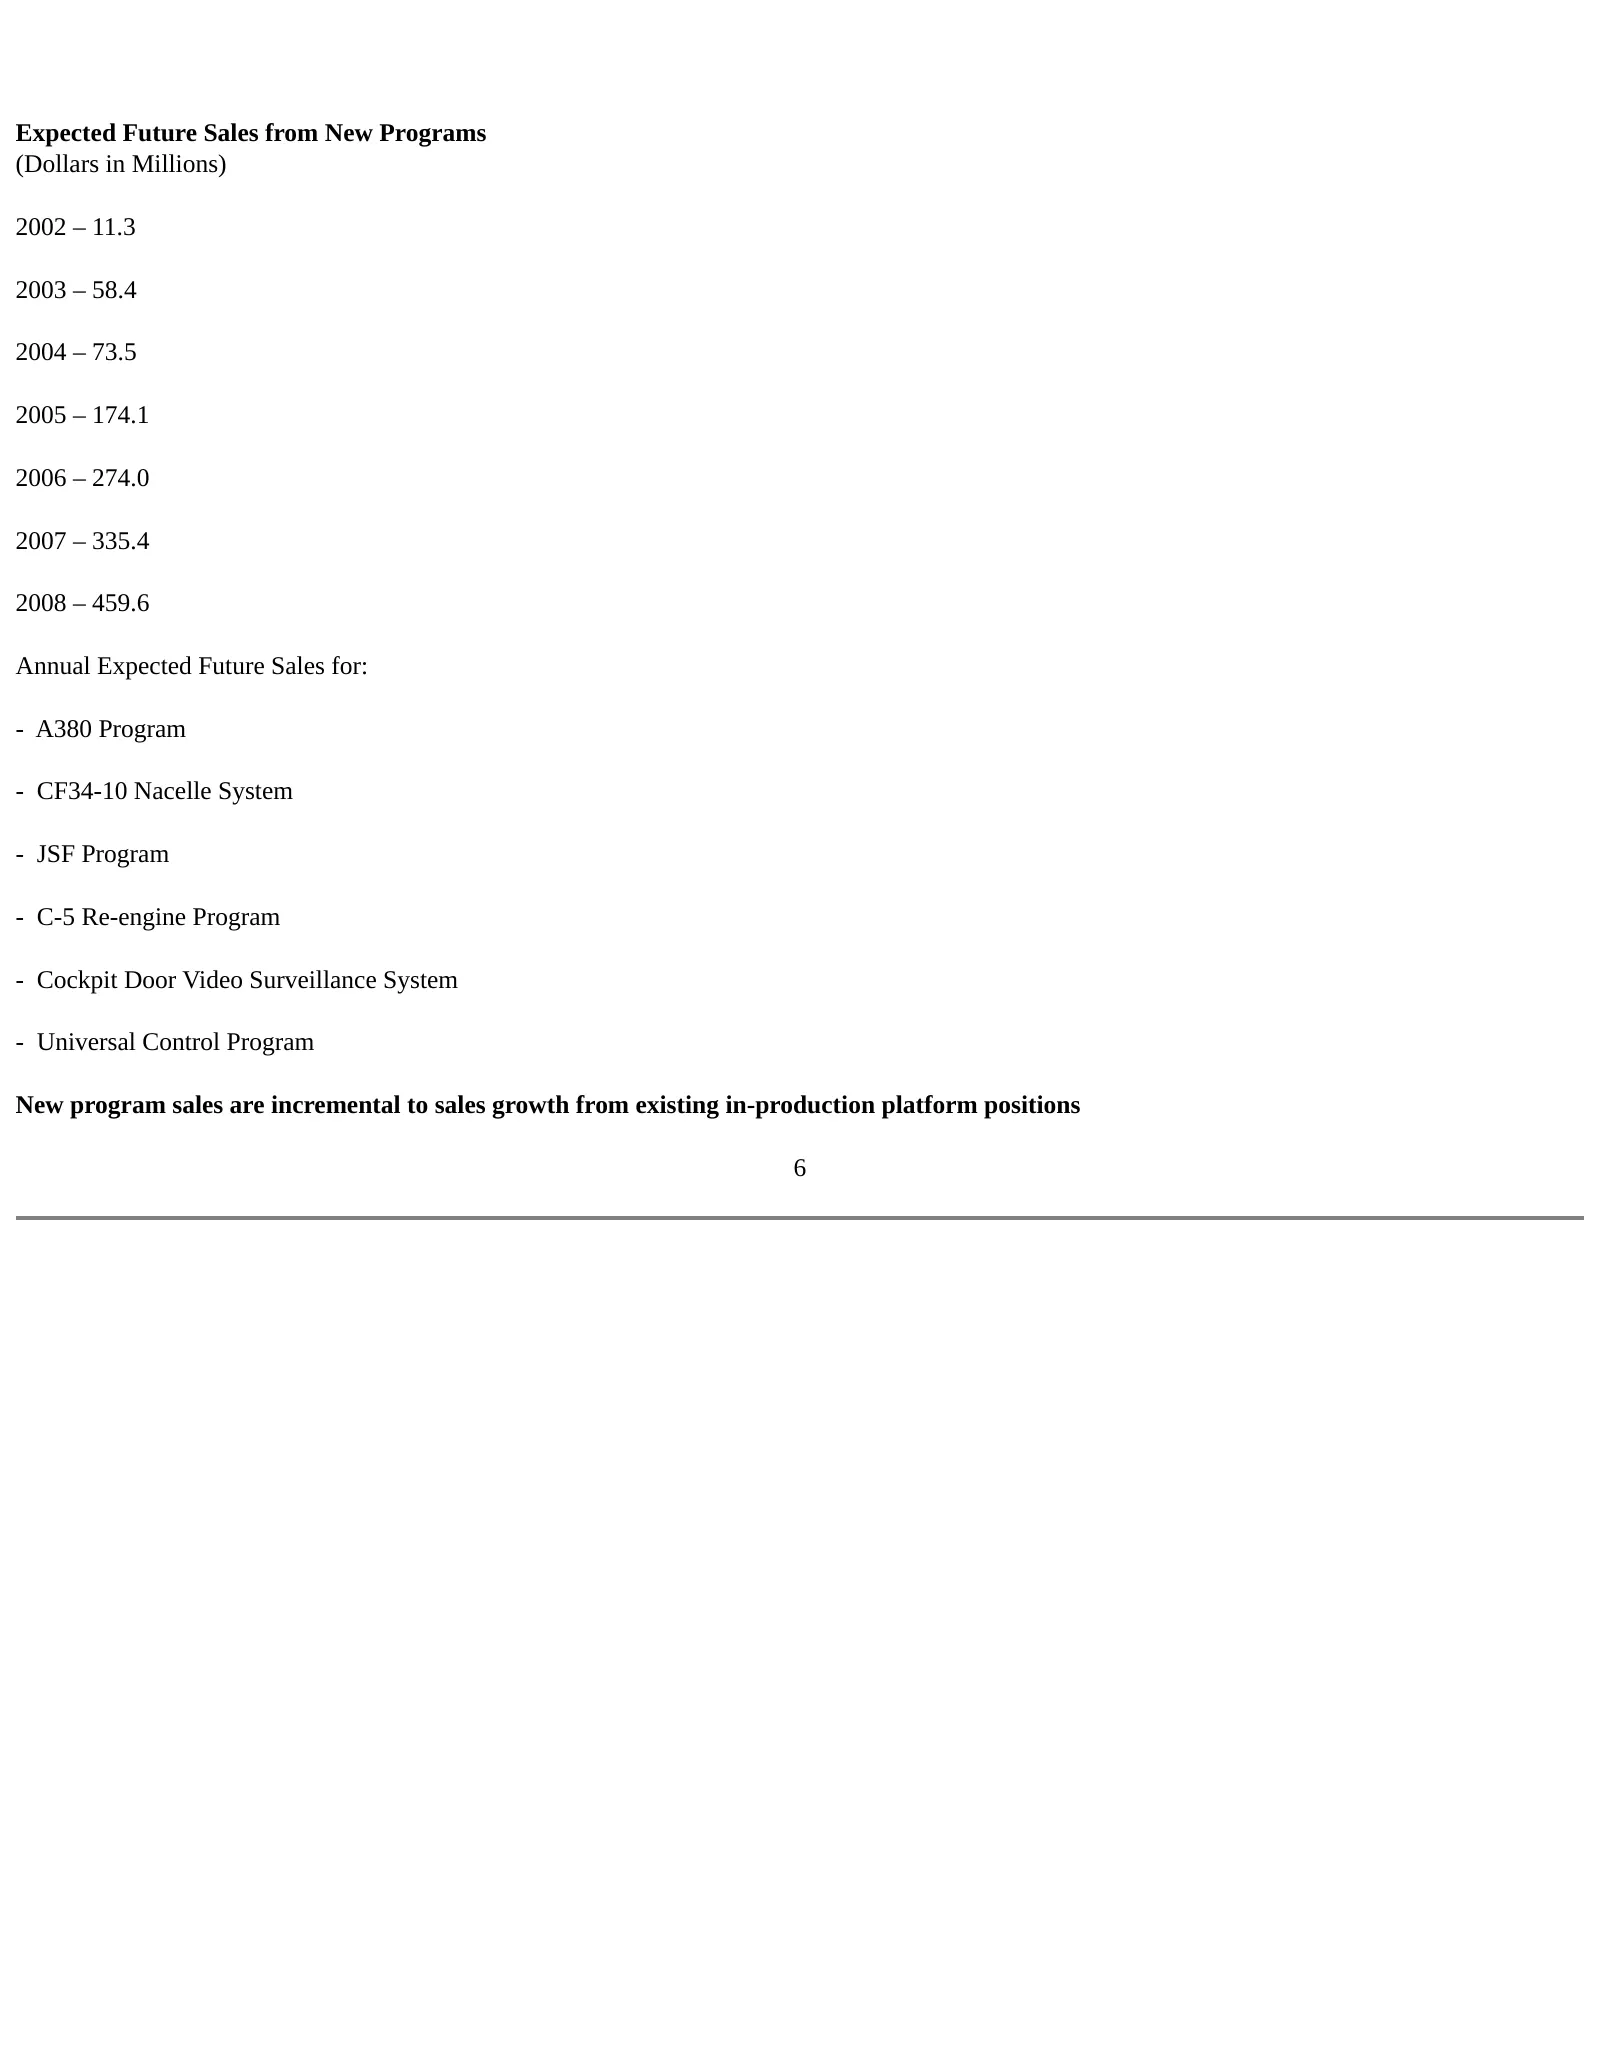
Expected Future Sales from New Programs (Dollars in Millions) 2002 – 11.3 2003 – 58.4 2004 – 73.5 2005 – 174.1 2006 – 274.0 2007 – 335.4 2008 – 459.6 Annual Expected Future Sales for: - A380 Program - CF34-10 Nacelle System - JSF Program - C-5 Re-engine Program - Cockpit Door Video Surveillance Syst
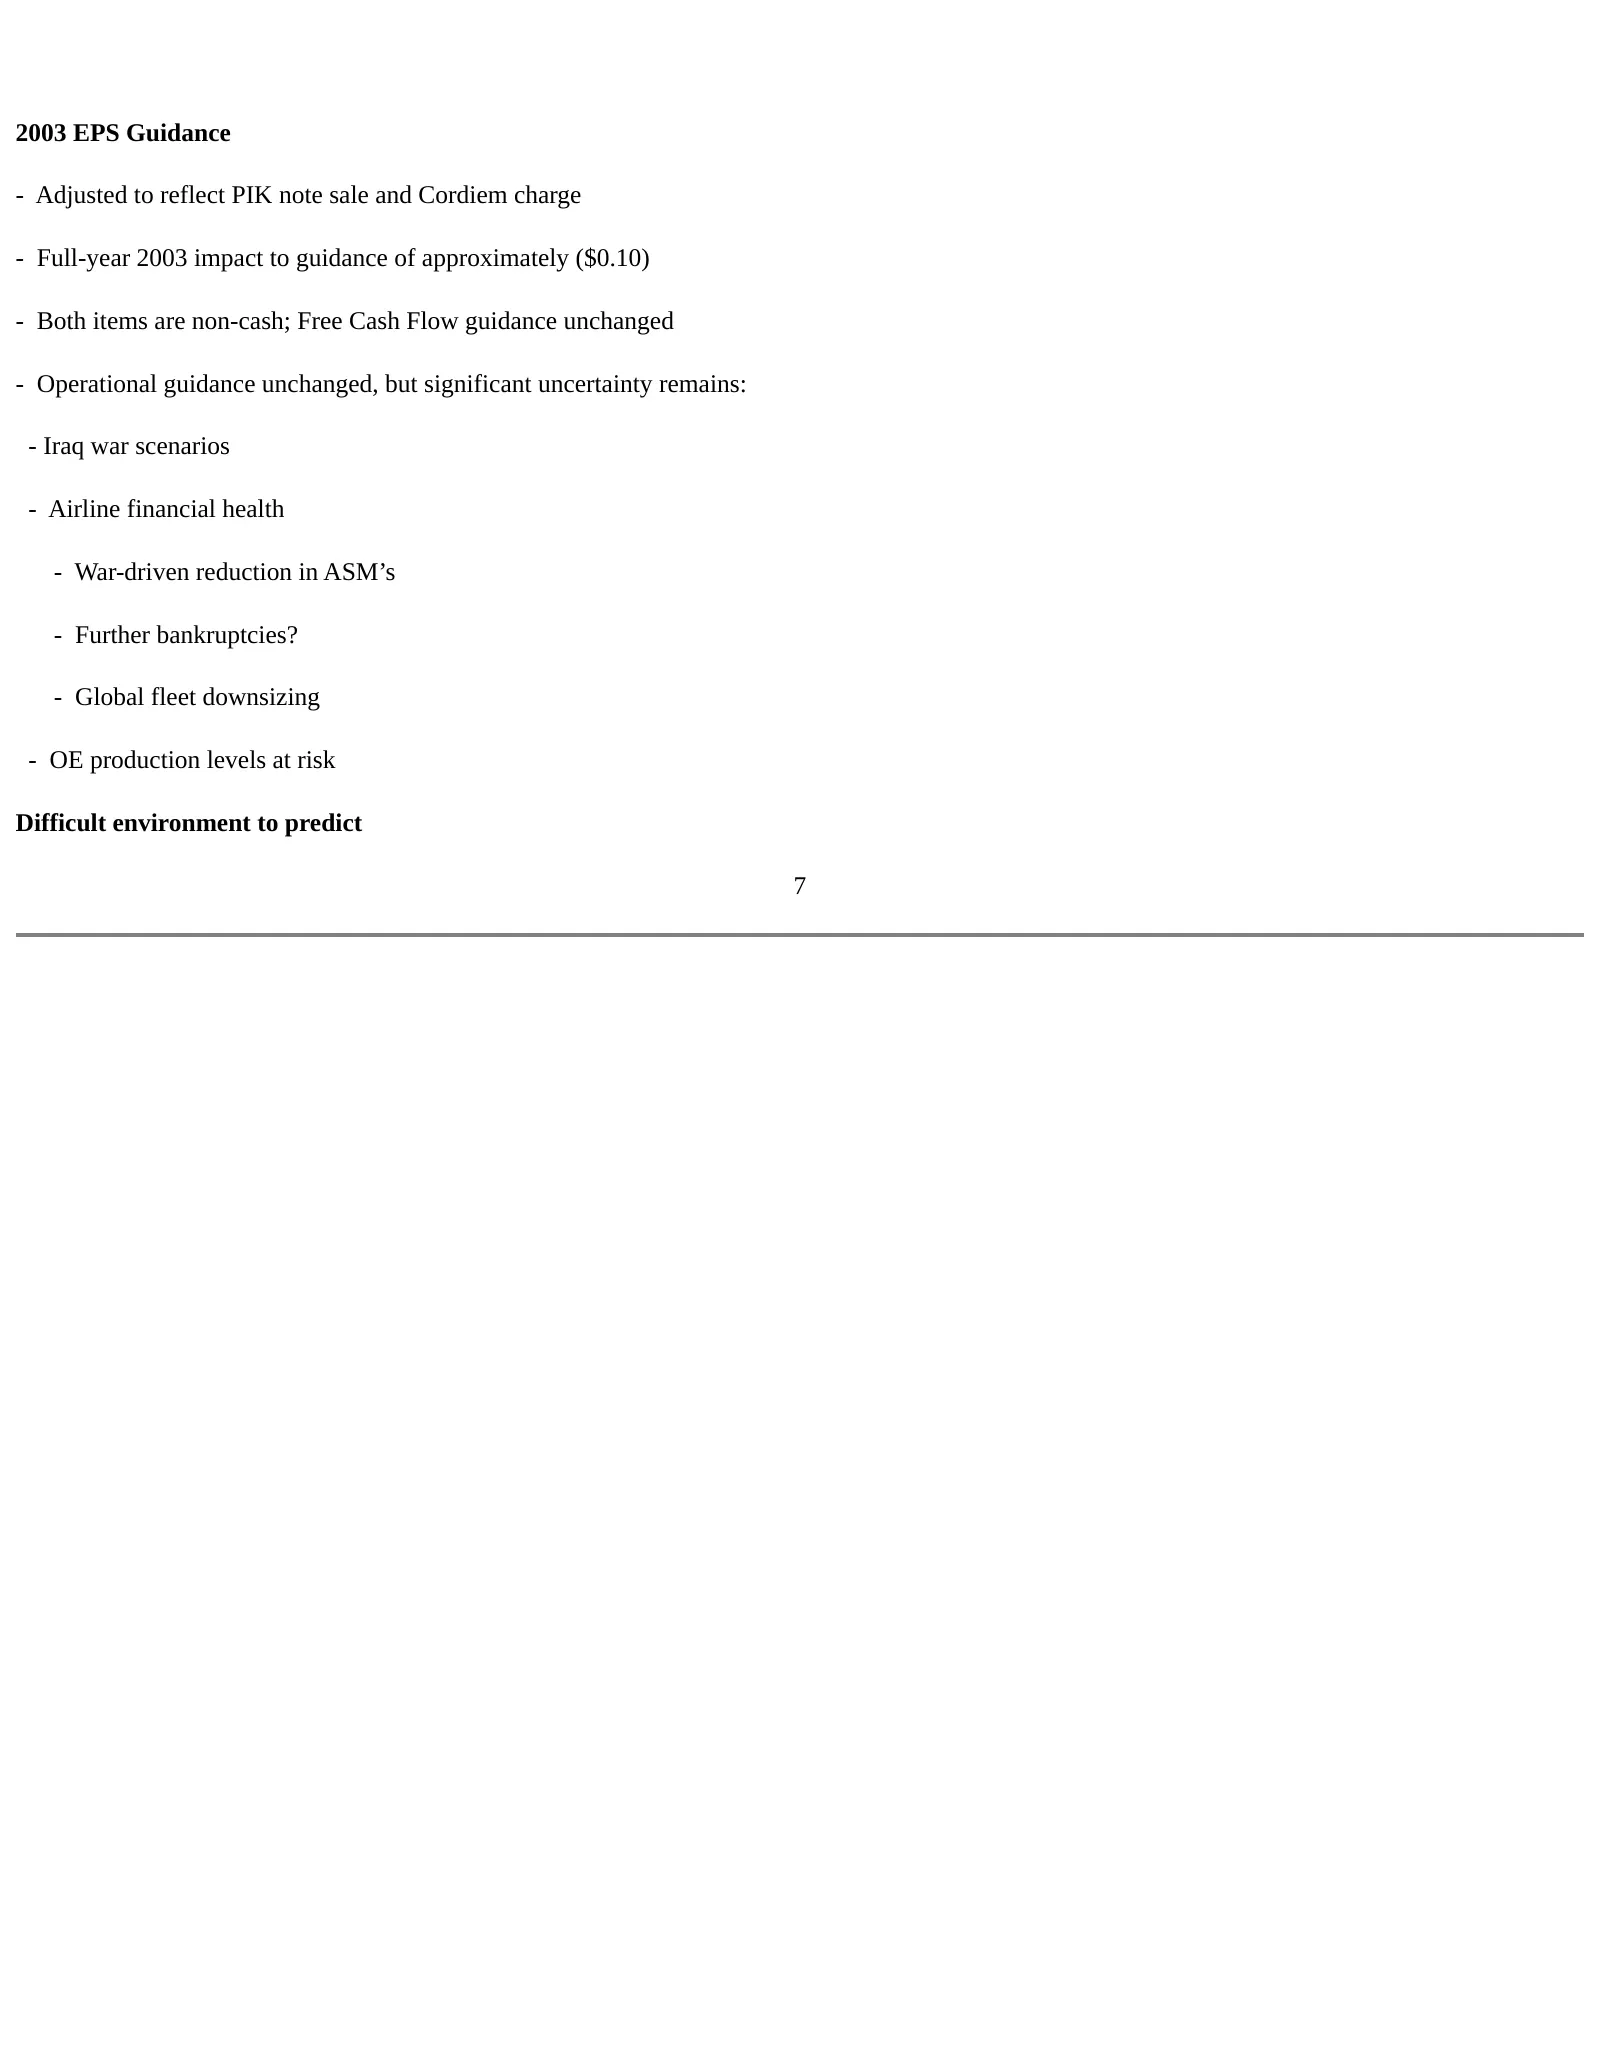
Slide 7: 2003 EPS Guidance
2003 EPS Guidance - Adjusted to reflect PIK note sale and Cordiem charge - Full-year 2003 impact to guidance of approximately ($0.10) - Both items are non-cash; Free Cash Flow guidance unchanged - Operational guidance unchanged, but significant uncertainty remains: - Iraq war scenarios - Airline fin
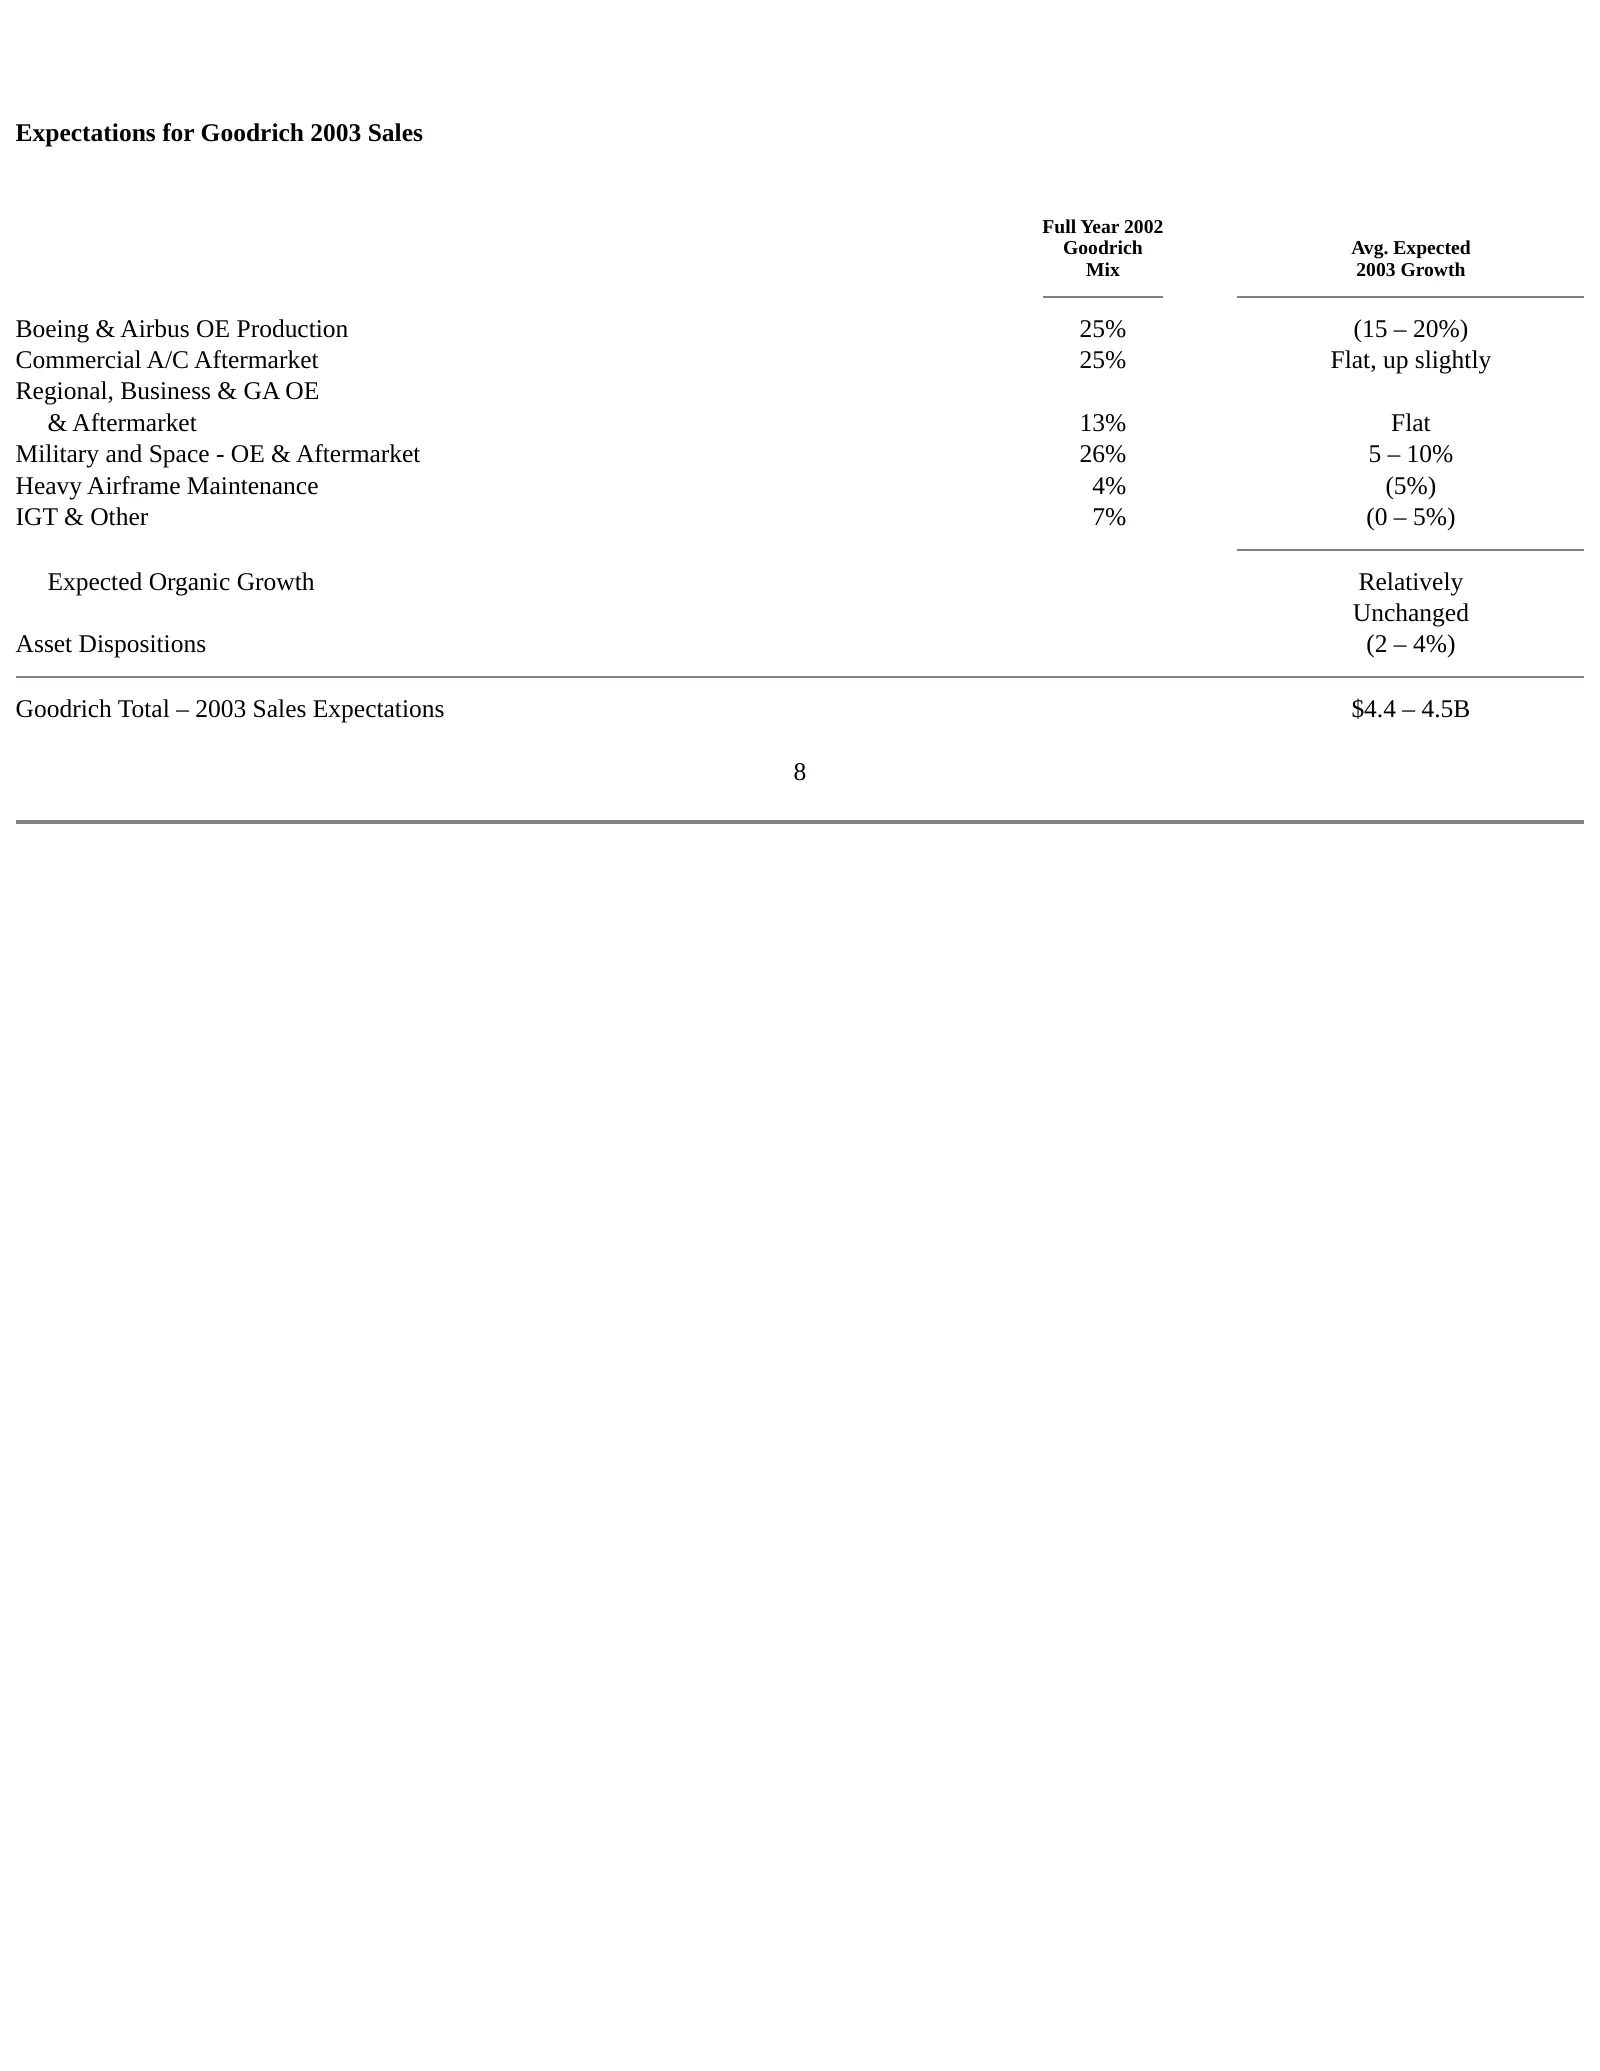
Slide 8: Expectations for Goodrich 2003 Sales
Expectations for Goodrich 2003 Sales Full Year 2002 Goodrich Avg. Expected Mix 2003 Growth Boeing & Airbus OE Production 25% (15 – 20%) Commercial A/C Aftermarket 25% Flat, up slightly Regional, Business & GA OE & Aftermarket 13% Flat Military and Space - OE & Aftermarket 26% 5 – 10% Heavy Airframe
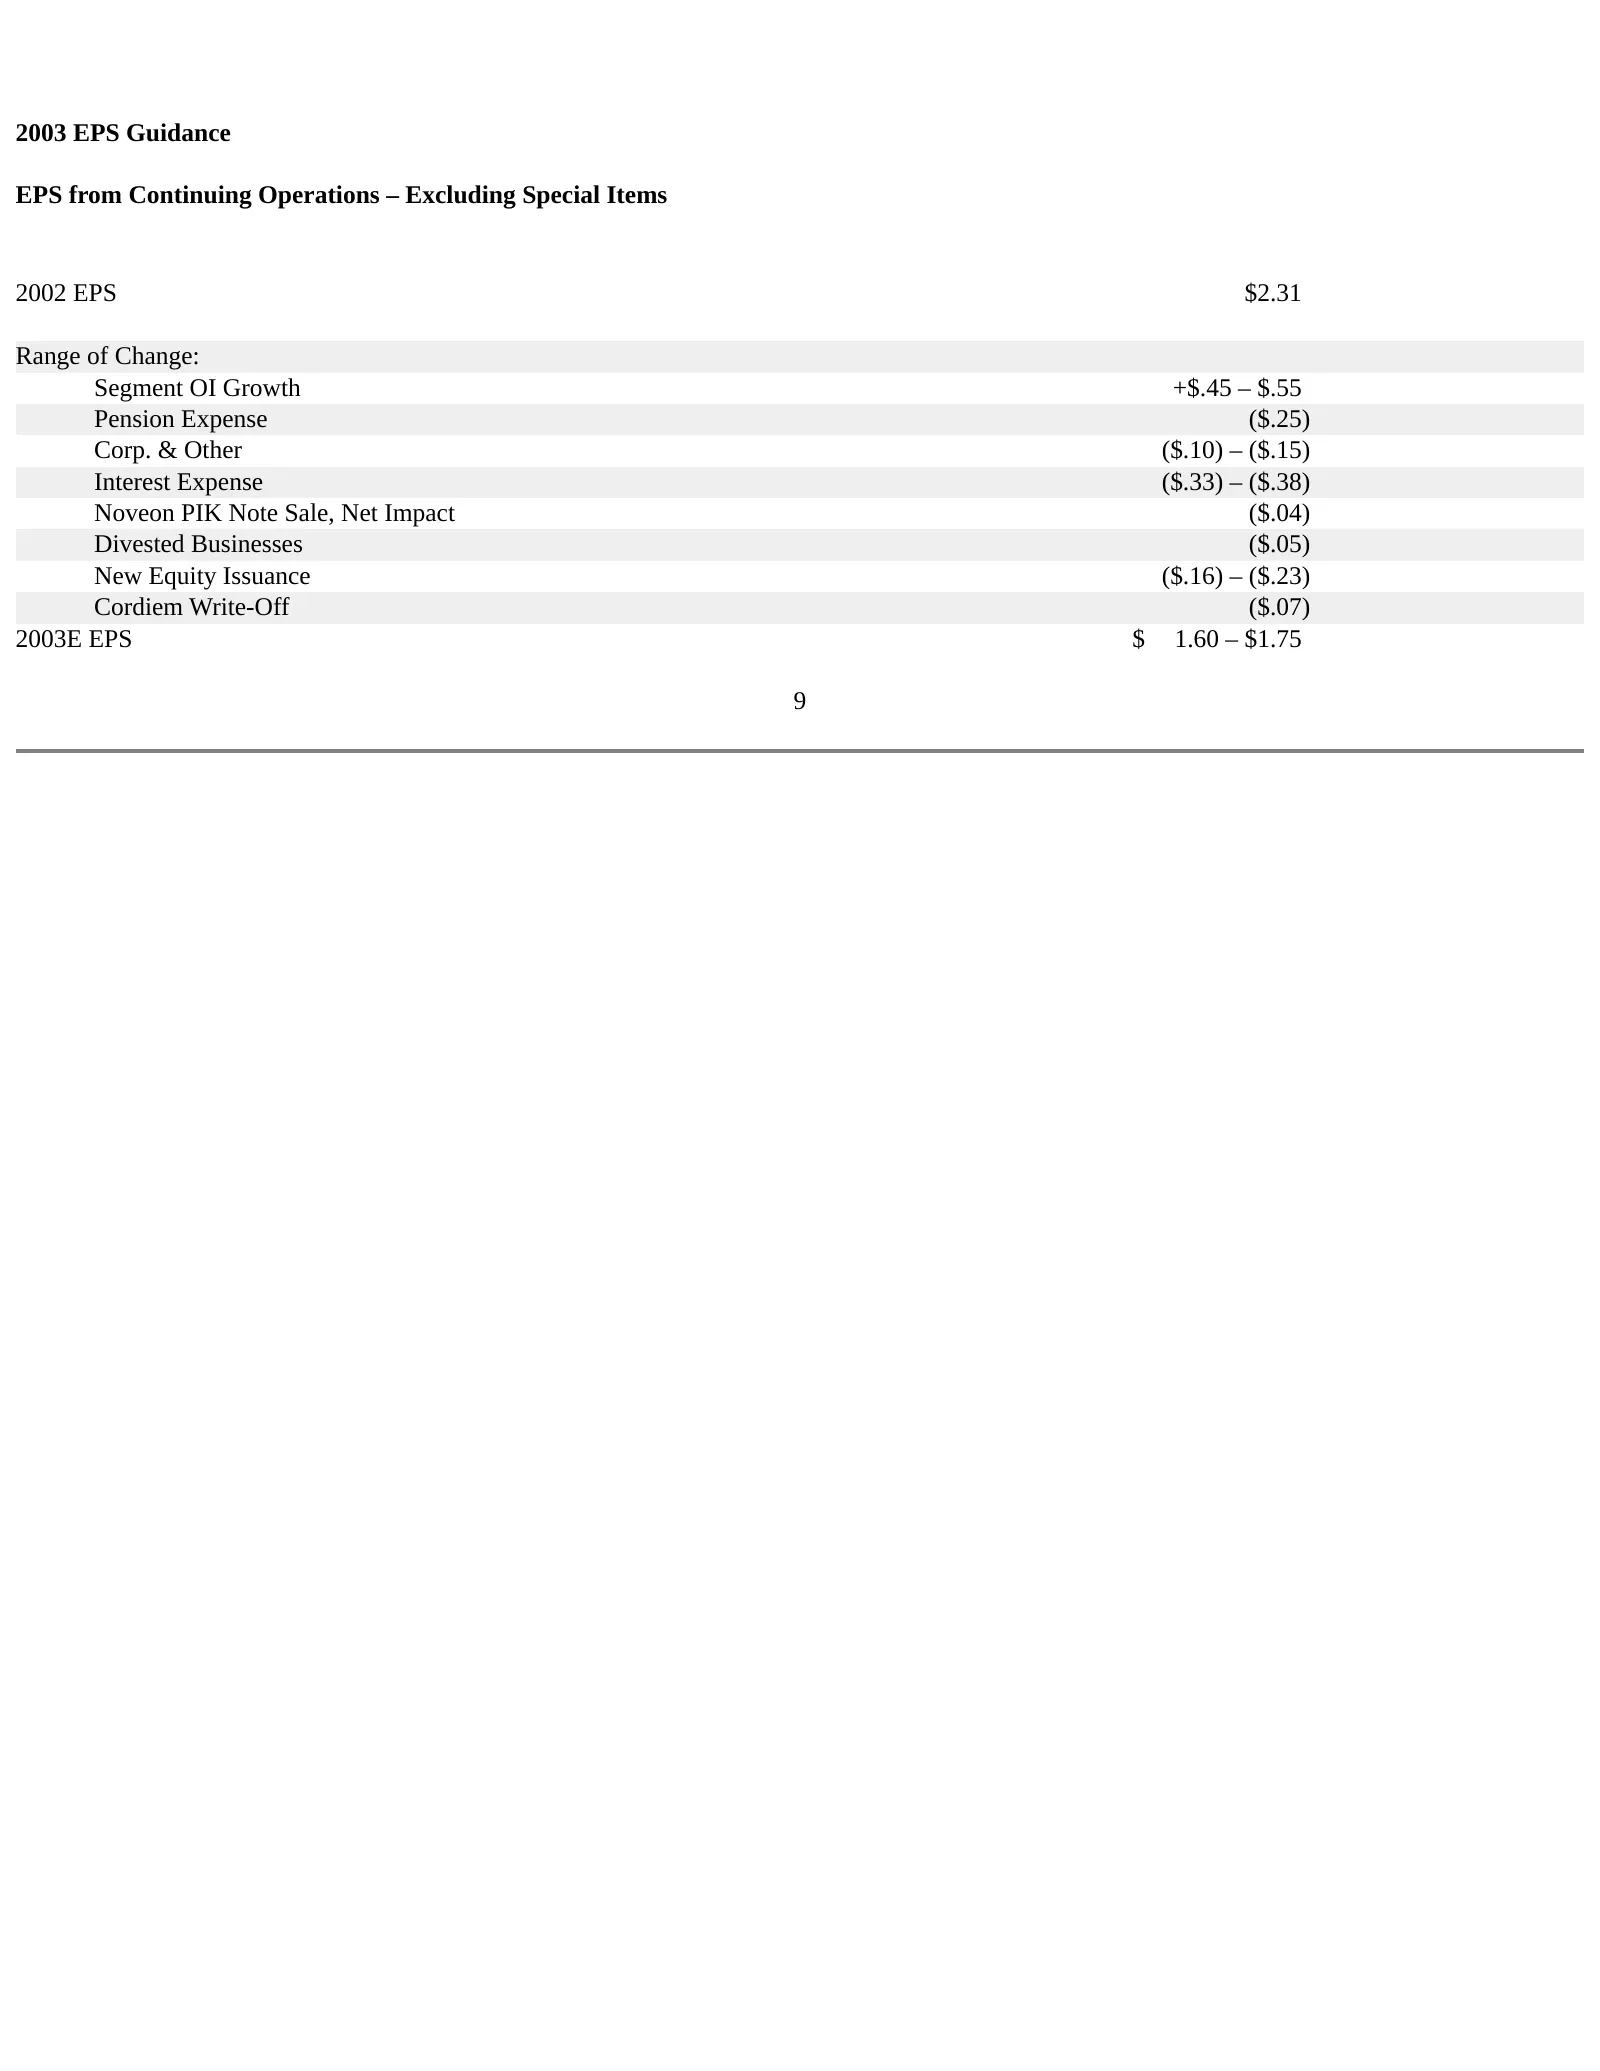
Slide 9: 2003 EPS Guidance
2003 EPS Guidance EPS from Continuing Operations – Excluding Special Items 2002 EPS $2.31 Range of Change: Segment OI Growth +$.45 – $.55 Pension Expense ($.25) Corp. & Other ($.10) – ($.15) Interest Expense ($.33) – ($.38) Noveon PIK Note Sale, Net Impact ($.04) Divested Businesses ($.05) New Equit
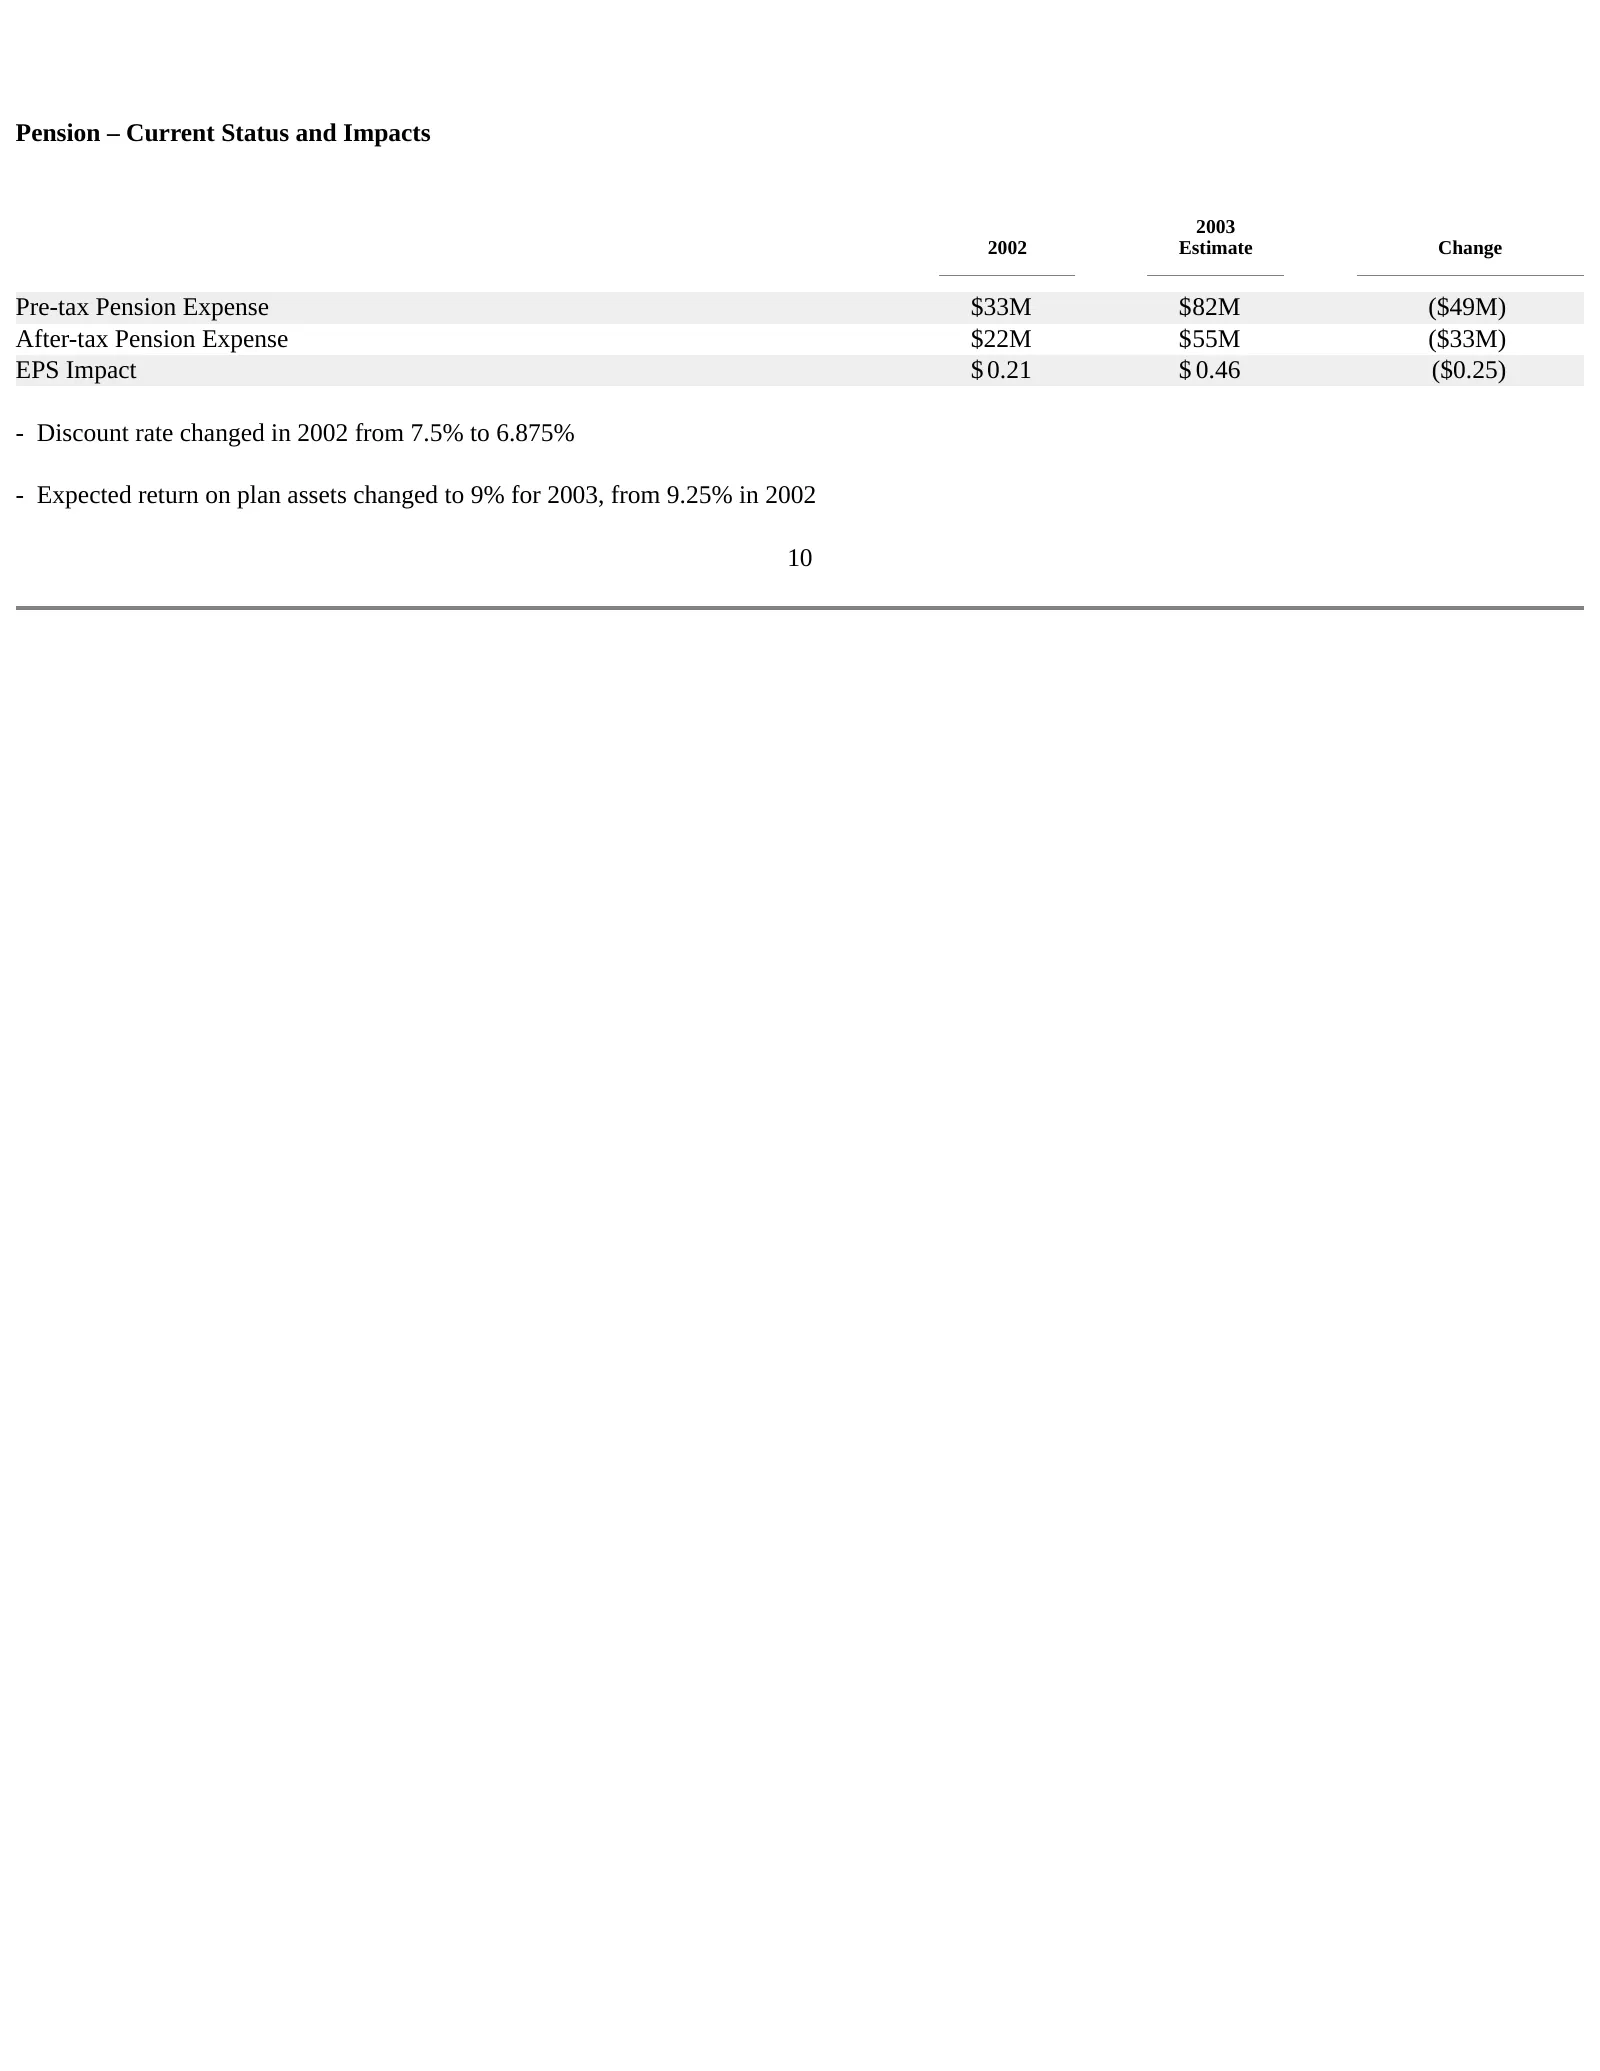
Slide 10: Pension – Current Status and Impacts
Pension – Current Status and Impacts 2003 2002 Estimate Change Pre-tax Pension Expense $33M $82M ($49M) After-tax Pension Expense $22M $55M ($33M) EPS Impact $ 0.21 $ 0.46 ($0.25) - Discount rate changed in 2002 from 7.5% to 6.875% - Expected return on plan assets changed to 9% for 2003, from 9.25%
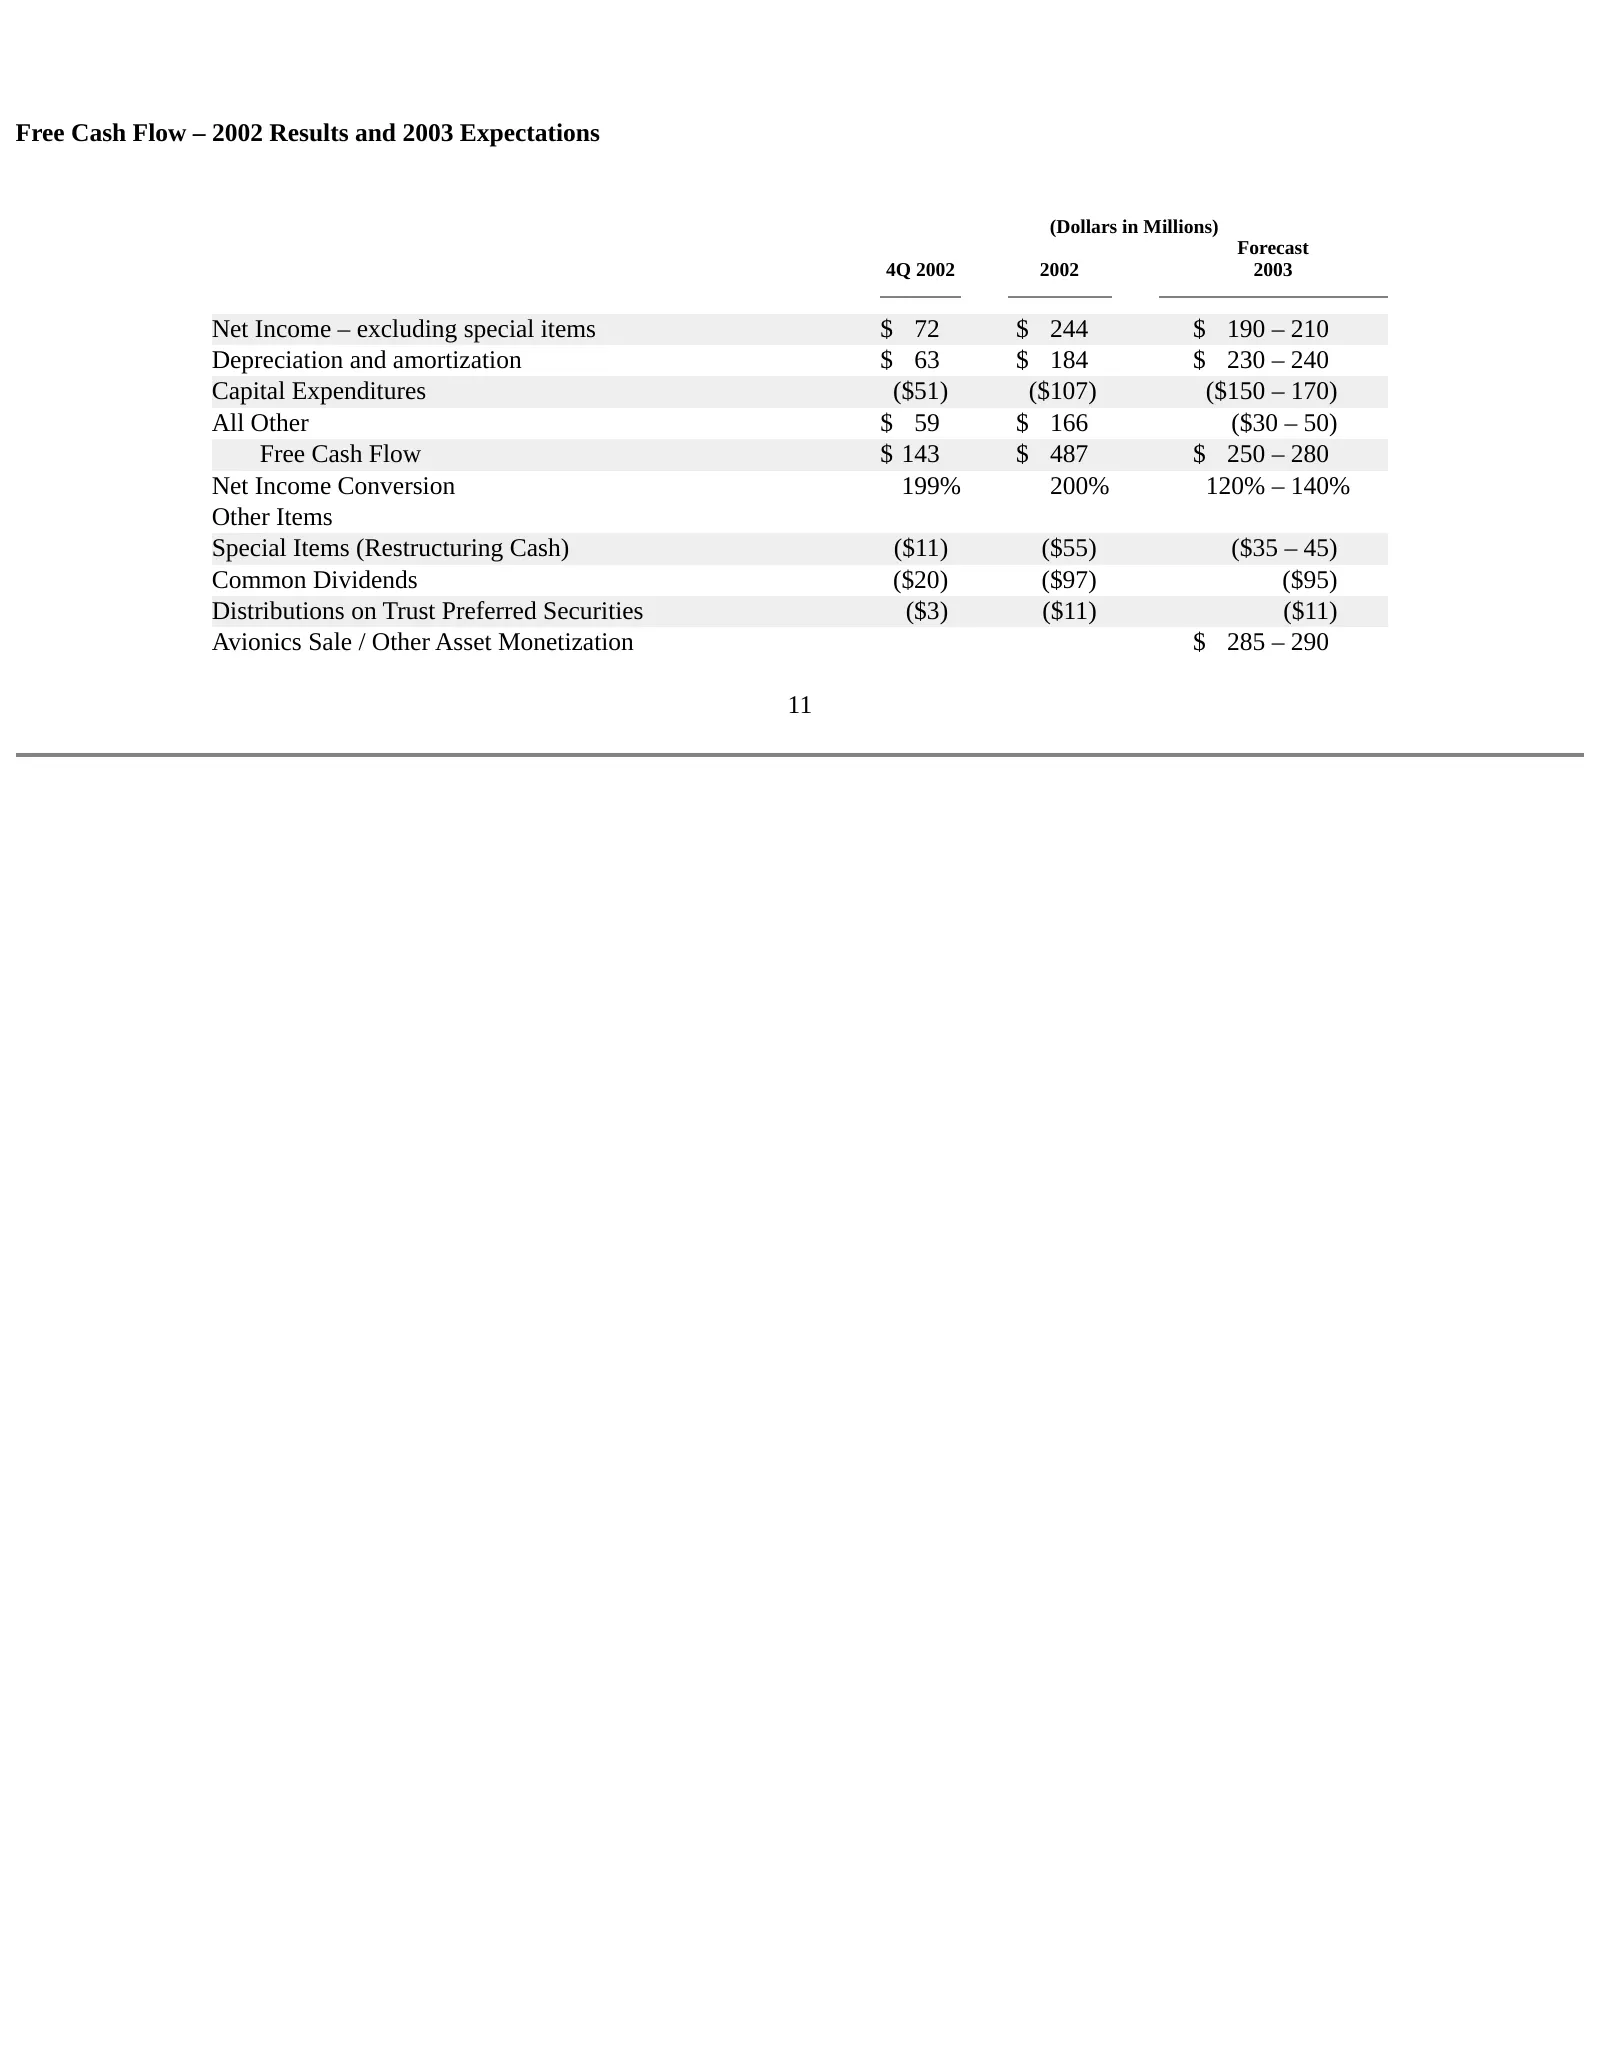
Slide 11: Free Cash Flow – 2002 Results and 2003 Expectations
Free Cash Flow – 2002 Results and 2003 Expectations (Dollars in Millions) Forecast 4Q 2002 2002 2003 Net Income – excluding special items $ 72 $ 244 $ 190 – 210 Depreciation and amortization $ 63 $ 184 $ 230 – 240 Capital Expenditures ($51) ($107) ($150 – 170) All Other $ 59 $ 166 ($30 – 50) Free Ca
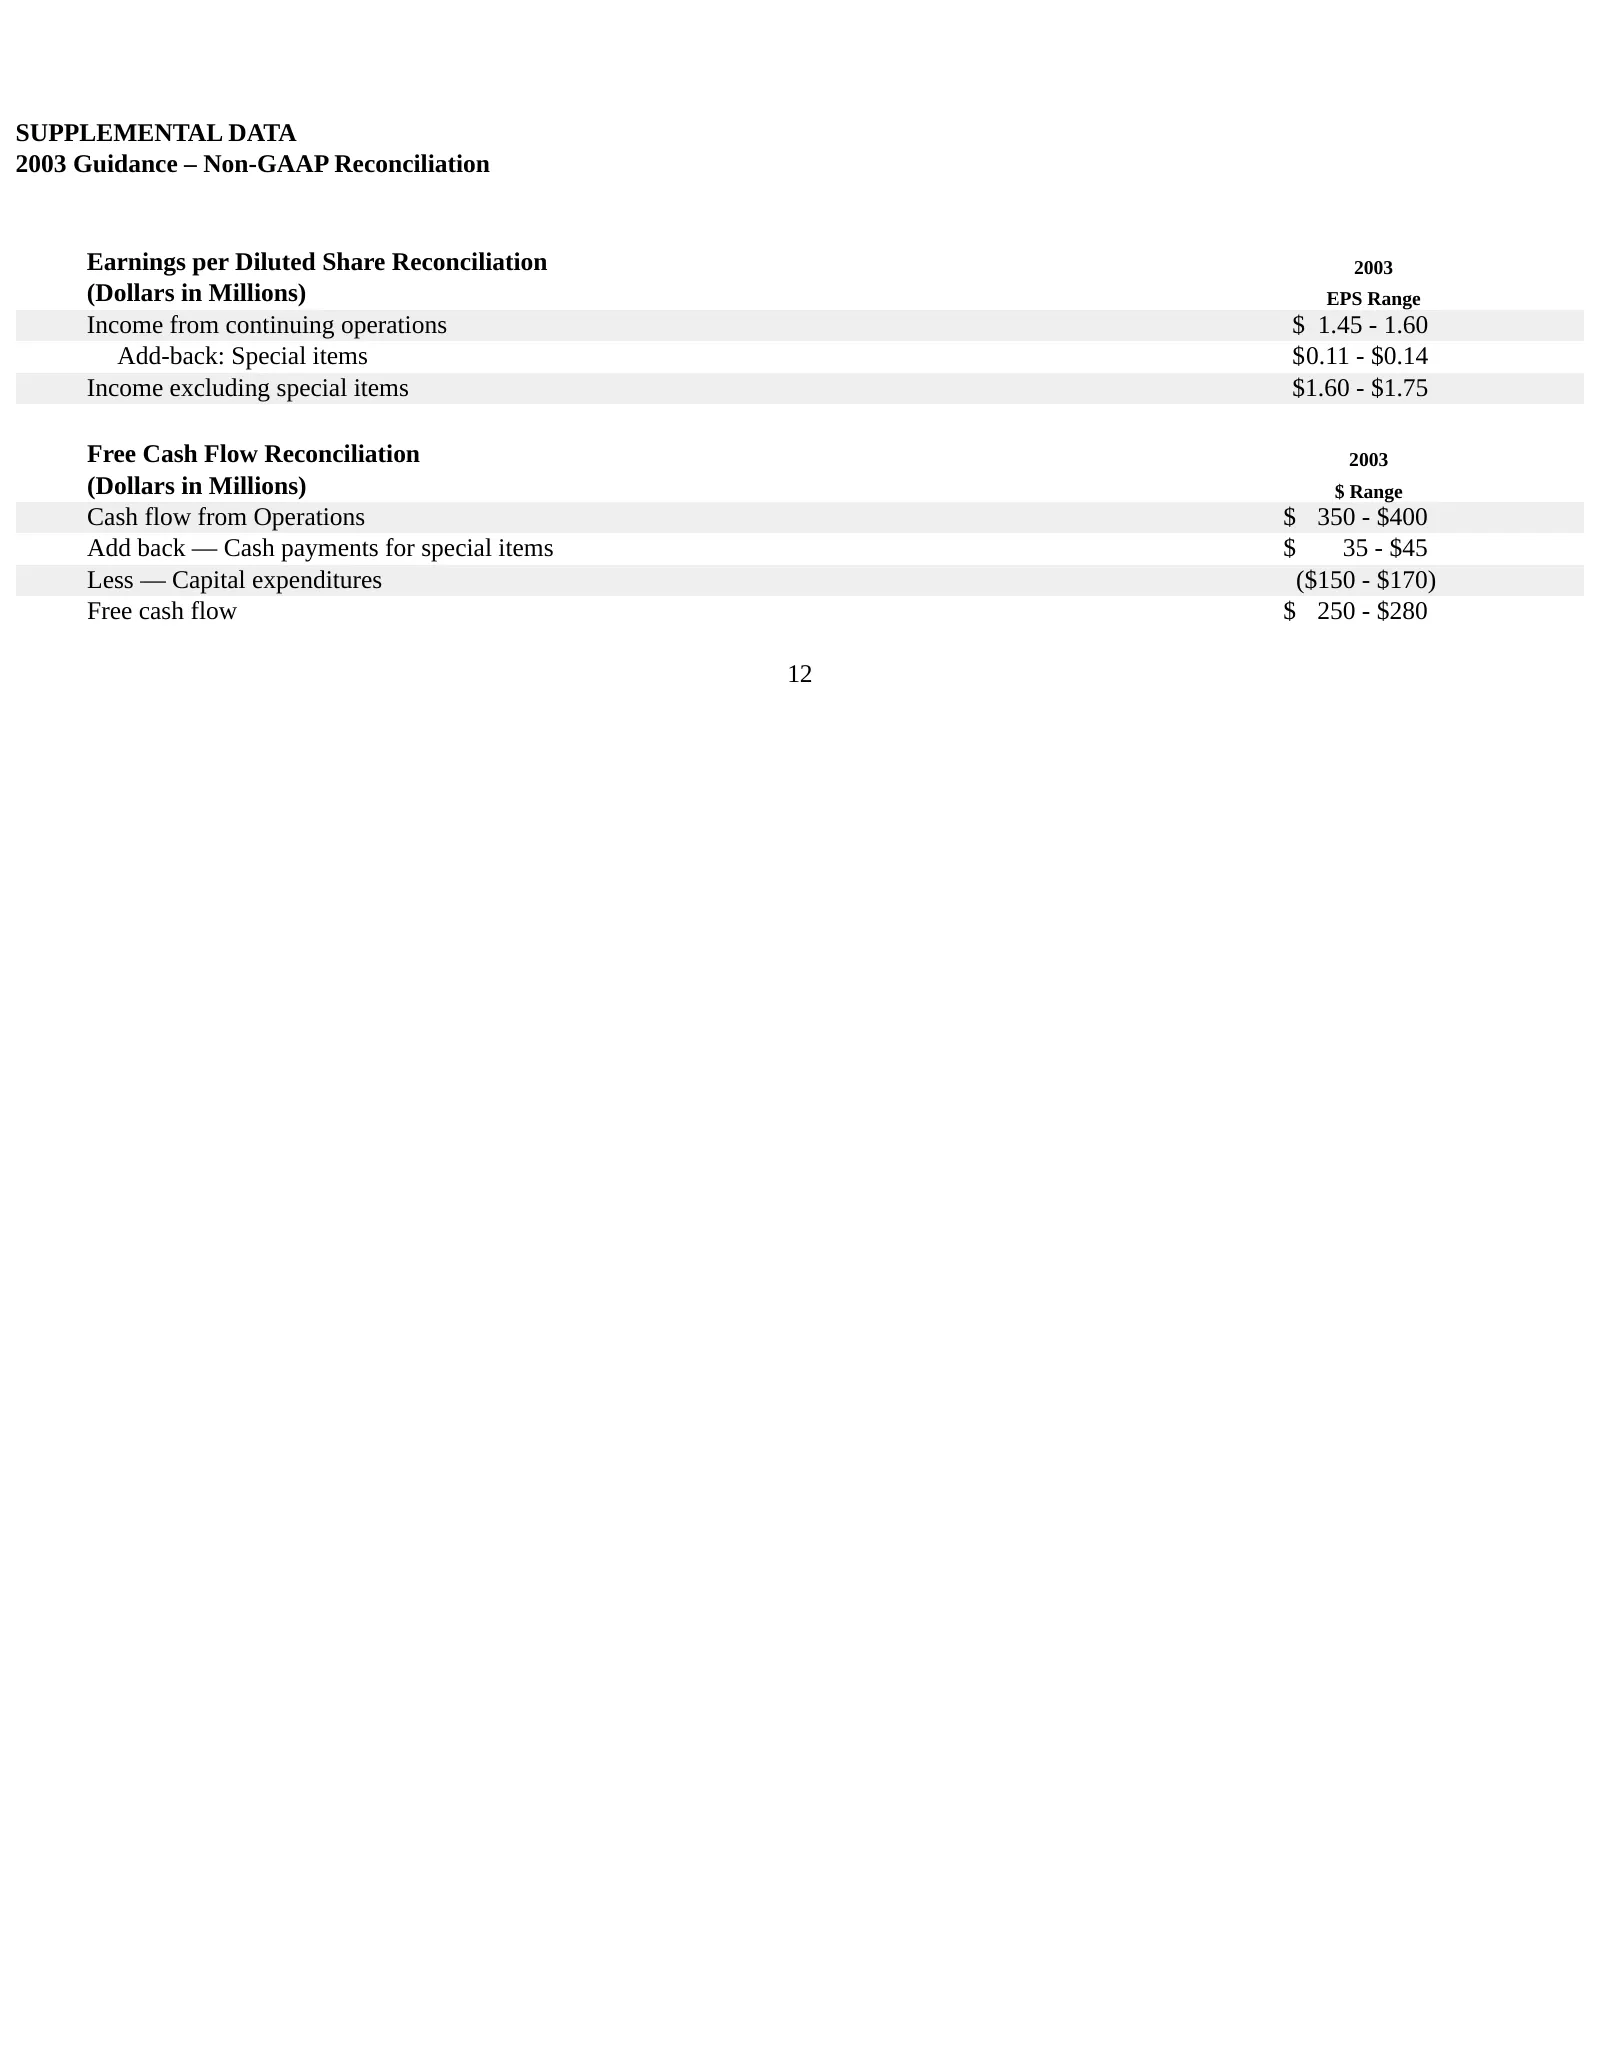
Slide 12: Supplemental Data: 2003 Guidance – Non-GAAP Reconciliation
SUPPLEMENTAL DATA 2003 Guidance – Non-GAAP Reconciliation Earnings per Diluted Share Reconciliation 2003 (Dollars in Millions) EPS Range Income from continuing operations $ 1.45 - 1.60 Add-back: Special items $0.11 - $0.14 Income excluding special items $1.60 - $1.75 Free Cash Flow Reconciliation 20
Source: SEC EDGAR · 8-K filed Mar 11, 2003
More decks from Goodrich Corp
 Q4 2009 Earnings Presentation23 slides · Jan 28, 2010
 Q3 2009 Earnings Presentation21 slides · Oct 22, 2009
 Q2 2009 Earnings Presentation21 slides · Jul 23, 2009
 Macquarie Capital Aerospace & Defense Conference 200920 slides · May 14, 2009
 Q1 2009 Earnings Presentation21 slides · Apr 23, 2009
 FY2008 Earnings Presentation28 slides · Feb 4, 2009