Inland Real Estate — Investor Presentation (April 2013)
23 slides from Inland Real Estate's investor presentation, Apr 15, 2013

Slide 1: Investor Presentation Fourth Quarter 2012
Investor Presentation Fourth Quarter 2012 www.inlandrealestate.com NYSE: IRC April 15, 2013
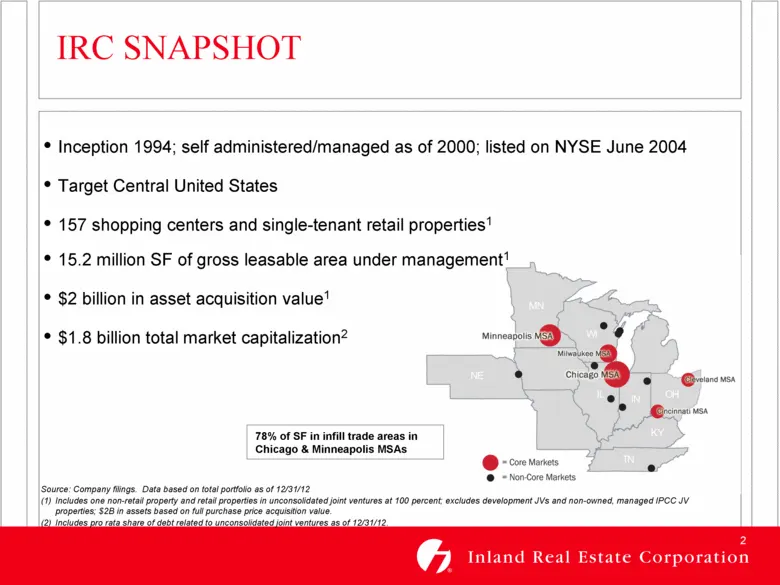
Slide 2: IRC Snapshot
IRC SNAPSHOT Source: Company filings. Data based on total portfolio as of 12/31/12 Includes one non-retail property and retail properties in unconsolidated joint ventures at 100 percent; excludes development JVs and non-owned, managed IPCC JV properties; $2B in assets based on full purchase price ac
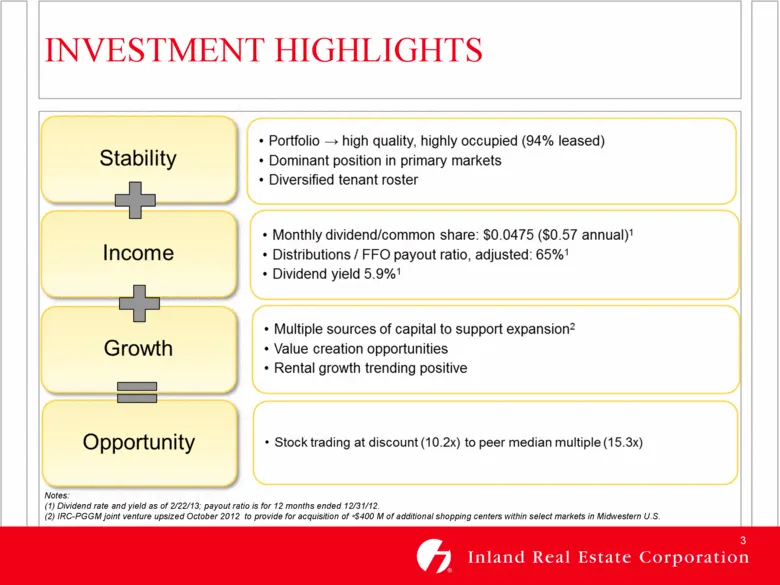
Slide 3: Investment Highlights
INVESTMENT HIGHLIGHTS Notes: (1) Dividend rate and yield as of 2/22/13; payout ratio is for 12 months ended 12/31/12. (2) IRC-PGGM joint venture upsized October 2012 to provide for acquisition of $400 M of additional shopping centers within select markets in Midwestern U.S.
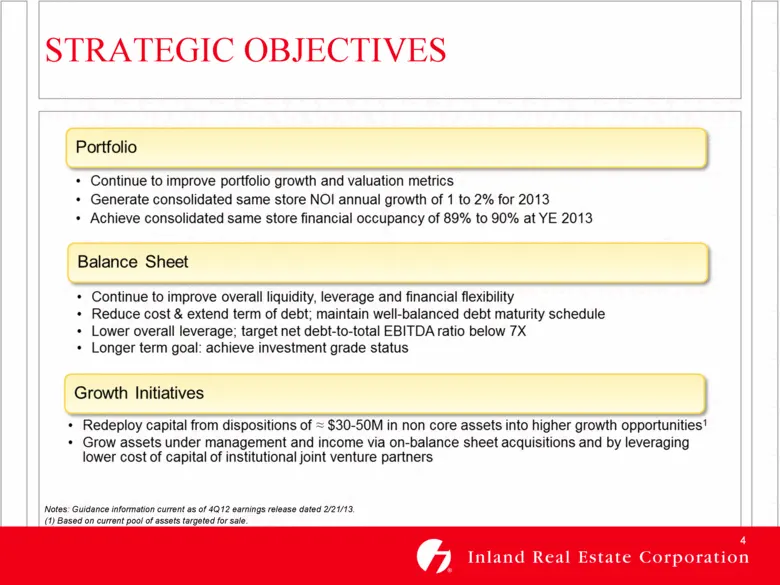
Slide 4: Strategic Objectives
STRATEGIC OBJECTIVES Notes: Guidance information current as of 4Q12 earnings release dated 2/21/13. (1) Based on current pool of assets targeted for sale.
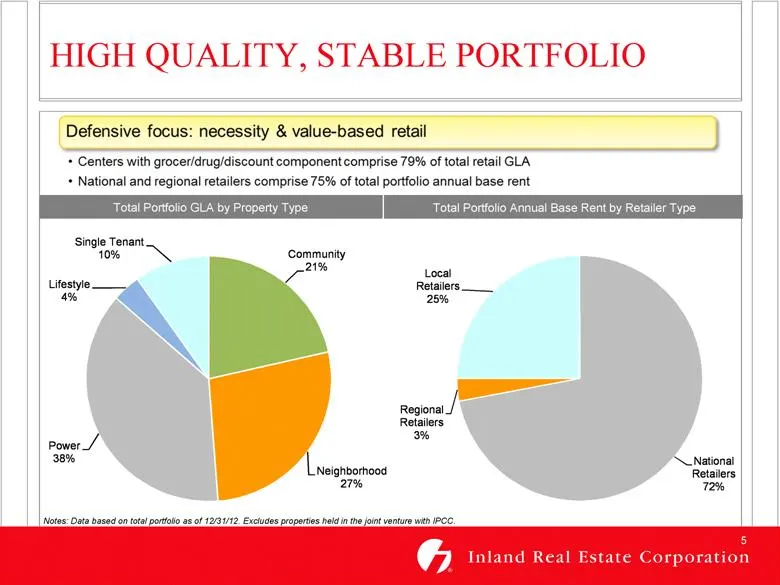
Slide 5: High Quality, Stable Portfolio
HIGH QUALITY, STABLE PORTFOLIO (1) Notes: Data based on total portfolio as of 12/31/12. Excludes properties held in the joint venture with IPCC. Total Portfolio GLA by Property Type Total Portfolio Annual Base Rent by Retailer Type Community 21% Neighborhood 27% Power 38% Lifestyle 4% Single Tenant
Slide 6: Diversified Tenant Base
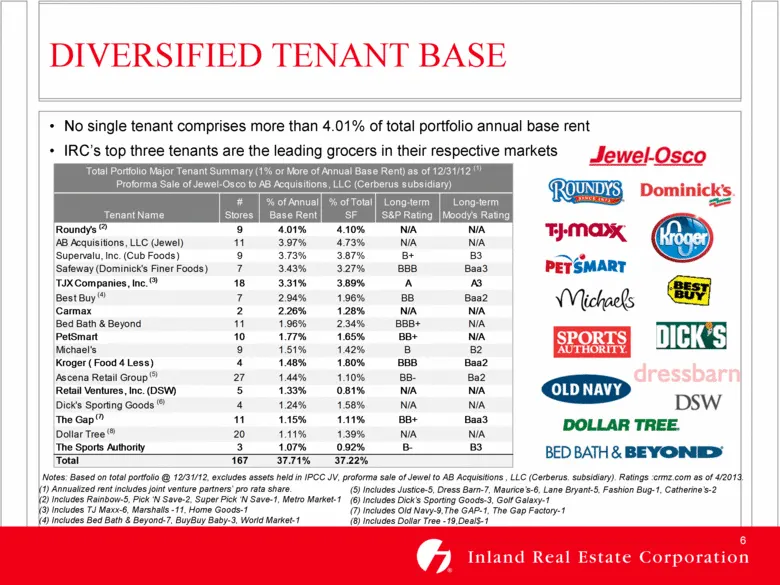
(5) Includes Justice-5, Dress Barn-7, Maurice’s-6, Lane Bryant-5, Fashion Bug-1, Catherine’s-2 (6) Includes Dick’s Sporting Goods-3, Golf Galaxy-1 (7) Includes Old Navy-9,The GAP-1, The Gap Factory-1 (8) Includes Dollar Tree -19,Deal$-1 DIVERSIFIED TENANT BASE No single tenant comprises more than 4.
Slide 7: Strong Market Demographics
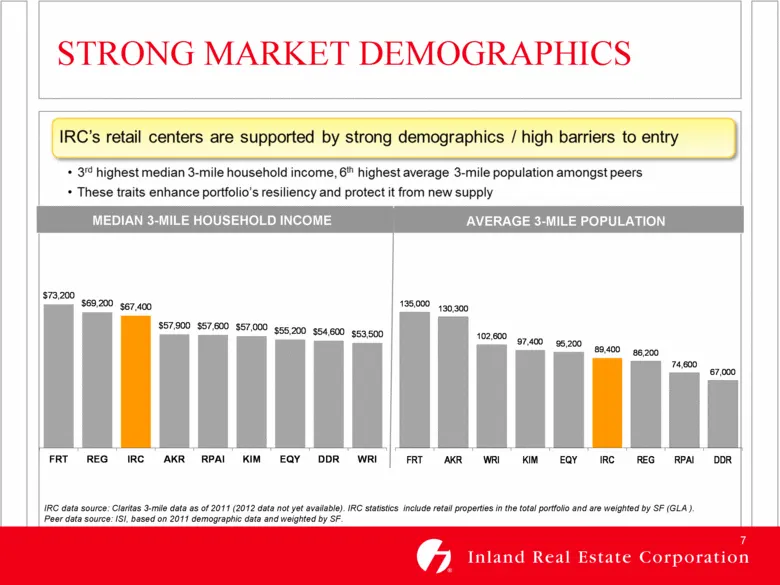
STRONG MARKET DEMOGRAPHICS MEDIAN 3-MILE HOUSEHOLD INCOME AVERAGE 3-MILE POPULATION IRC data source: Claritas 3-mile data as of 2011 (2012 data not yet available). IRC statistics include retail properties in the total portfolio and are weighted by SF (GLA ). Peer data source: ISI, based on 2011 demo
Slide 8: Primary Markets
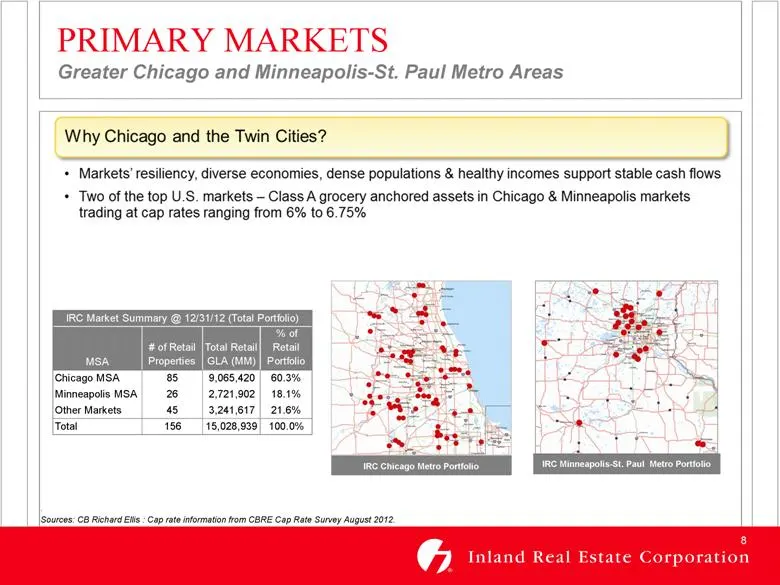
PRIMARY MARKETS Greater Chicago and Minneapolis-St. Paul Metro Areas . Sources: CB Richard Ellis : Cap rate information from CBRE Cap Rate Survey August 2012. IRC Chicago Metro Portfolio IRC Minneapolis-St. Paul Metro Portfolio MSA # of Retail Properties Total Retail GLA (MM) % of Retail Portfolio C
Slide 9: Dominant REIT in Primary Markets
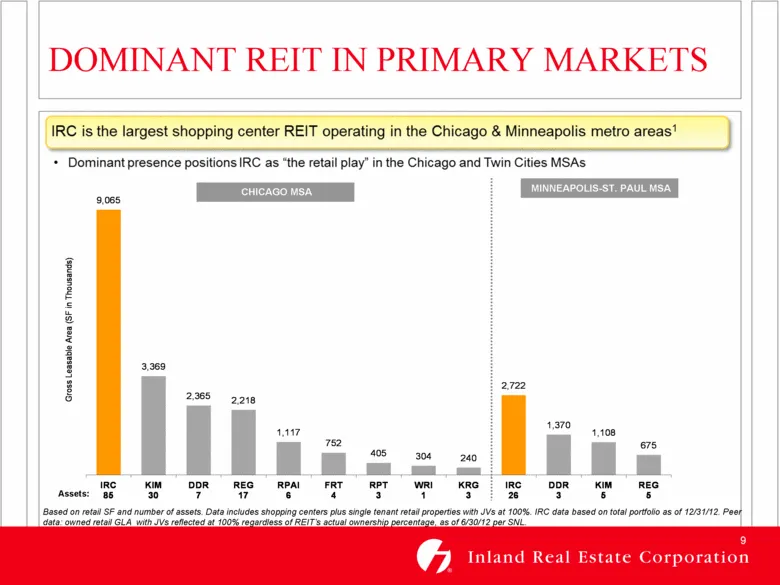
Assets: DOMINANT REIT IN PRIMARY MARKETS Based on retail SF and number of assets. Data includes shopping centers plus single tenant retail properties with JVs at 100%. IRC data based on total portfolio as of 12/31/12. Peer data: owned retail GLA with JVs reflected at 100% regardless of REIT’s actual
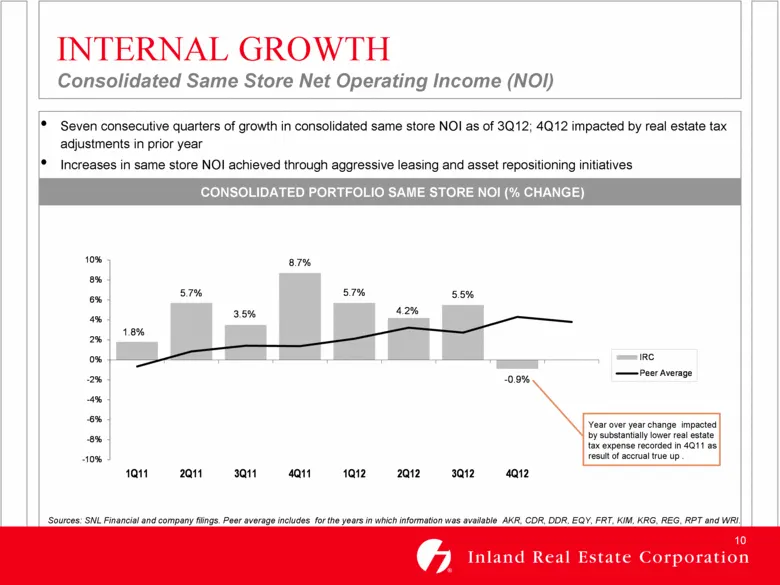
Slide 10: Internal Growth: Consolidated Same Store NOI
Year over year change impacted by substantially lower real estate tax expense recorded in 4Q11 as result of accrual true up . Seven consecutive quarters of growth in consolidated same store NOI as of 3Q12; 4Q12 impacted by real estate tax adjustments in prior year Increases in same store NOI achieve
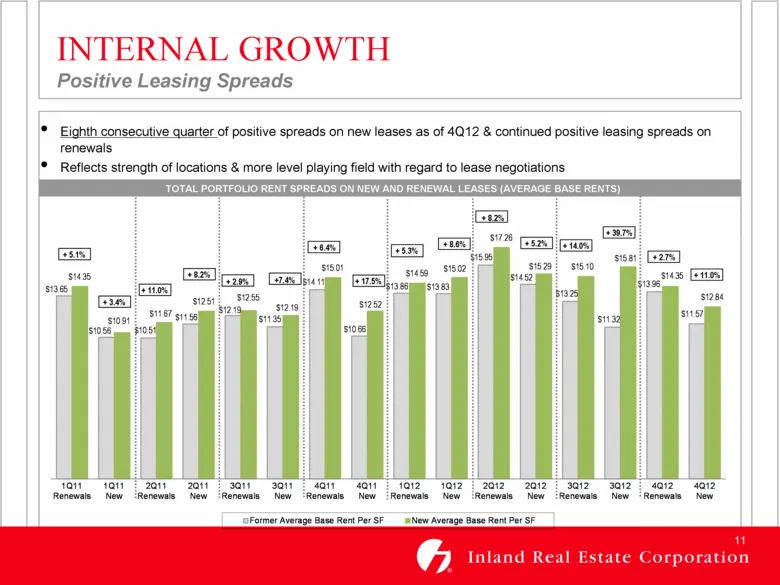
Slide 11: Internal Growth: Positive Leasing Spreads
Eighth consecutive quarter of positive spreads on new leases as of 4Q12 & continued positive leasing spreads on renewals Reflects strength of locations & more level playing field with regard to lease negotiations TOTAL PORTFOLIO RENT SPREADS ON NEW AND RENEWAL LEASES (AVERAGE BASE RENTS) INTERNAL GR
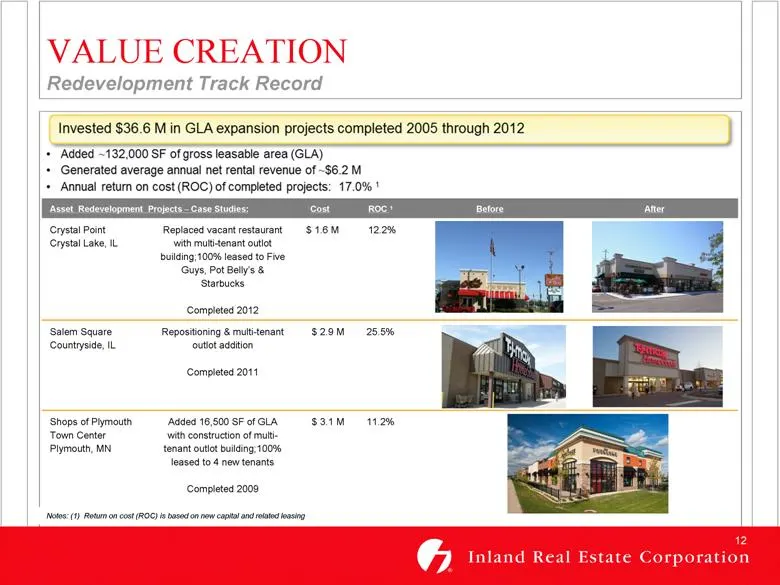
Slide 12: Value Creation: Redevelopment Track Record
Asset Redevelopment Projects – Case Studies: Cost ROC 1 Before After Crystal Point Crystal Lake, IL Replaced vacant restaurant with multi-tenant outlot building;100% leased to Five Guys, Pot Belly’s & Starbucks Completed 2012 $ 1.6 M 12.2% Salem Square Countryside, IL Repositioning & multi-tenant ou
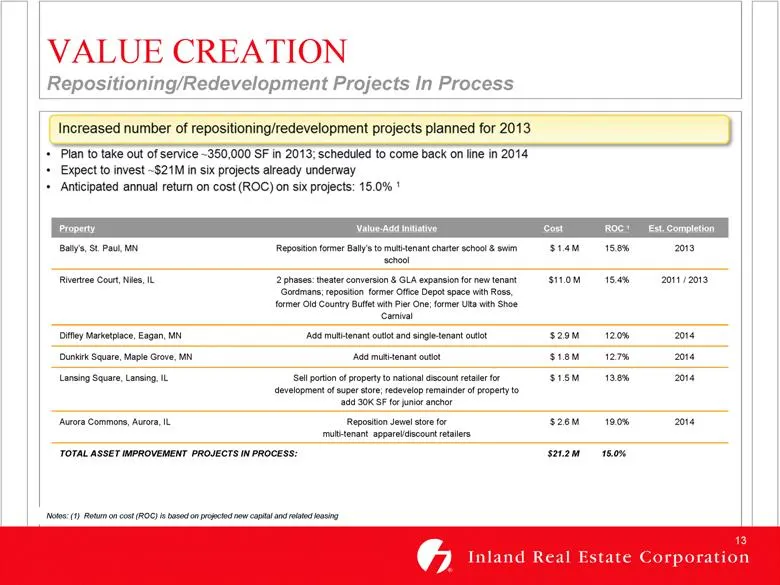
Slide 13: Value Creation: Projects In Process
VALUE CREATION Repositioning/Redevelopment Projects In Process Property Value-Add Initiative Cost ROC 1 Est. Completion Bally’s, St. Paul, MN Reposition former Bally’s to multi-tenant charter school & swim school $ 1.4 M 15.8% 2013 Rivertree Court, Niles, IL 2 phases: theater conversion & GLA expans
Slide 14: Successful Business Model
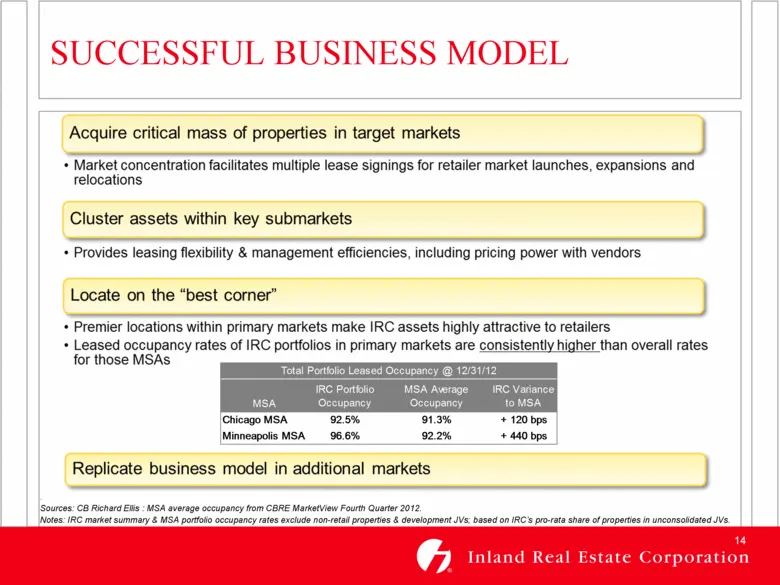
. Sources: CB Richard Ellis : MSA average occupancy from CBRE MarketView Fourth Quarter 2012. Notes: IRC market summary & MSA portfolio occupancy rates exclude non-retail properties & development JVs; based on IRC’s pro-rata share of properties in unconsolidated JVs. SUCCESSFUL BUSINESS MODEL MSA IR
Slide 15: Disciplined Investment Strategy
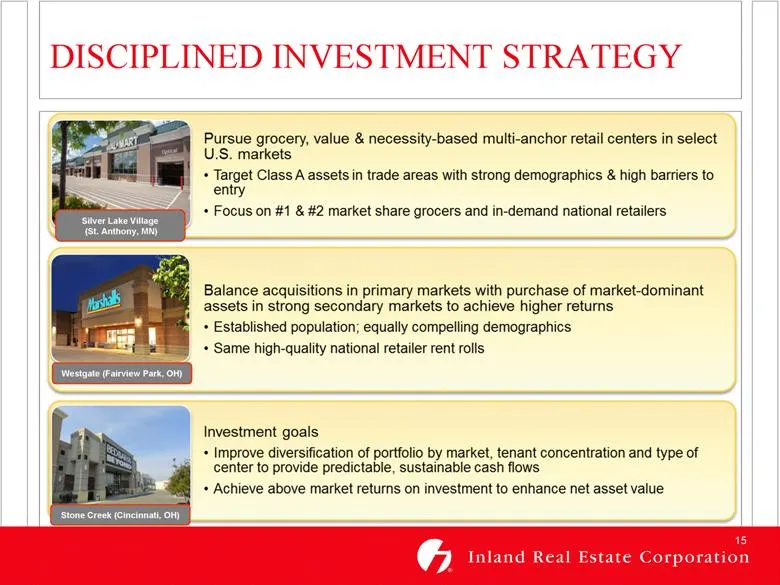
DISCIPLINED INVESTMENT STRATEGY Silver Lake Village (St. Anthony, MN) Westgate (Fairview Park, OH) Stone Creek (Cincinnati, OH)
Slide 16: Joint Venture Growth Strategies
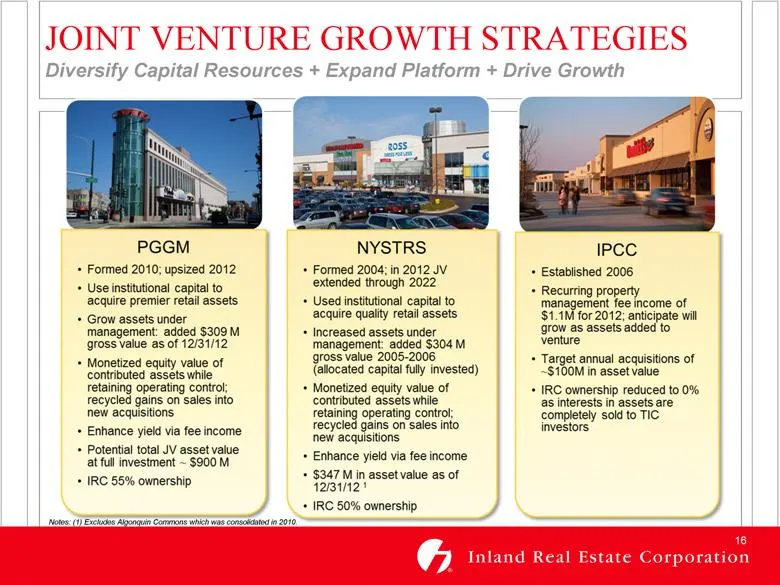
JOINT VENTURE GROWTH STRATEGIES Diversify Capital Resources + Expand Platform + Drive Growth Notes: (1) Excludes Algonquin Commons which was consolidated in 2010.
Slide 17: Joint Venture Fee Income
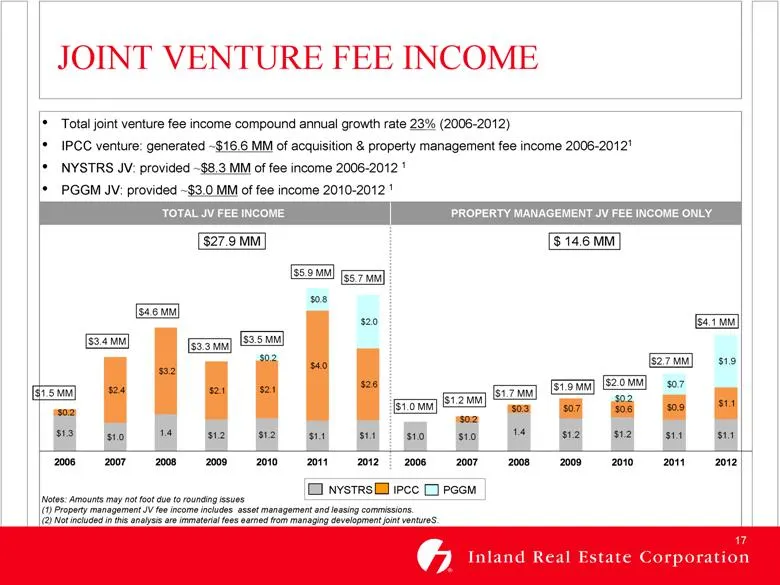
$3.4 MM $3.3 MM $1.5 MM $4.6 MM $3.5 MM $5.9 MM $1.0 MM $1.2 MM $1.7 MM $1.9 MM $2.7 MM $2.0 MM JOINT VENTURE FEE INCOME Total joint venture fee income compound annual growth rate 23% (2006-2012) IPCC venture: generated ~$16.6 MM of acquisition & property management fee income 2006-20121 NYSTRS JV:
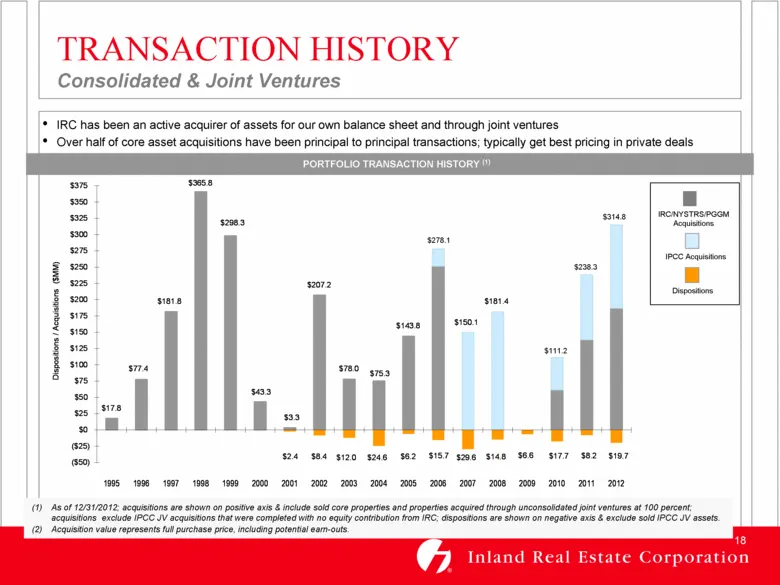
Slide 18: Transaction History
As of 12/31/2012; acquisitions are shown on positive axis & include sold core properties and properties acquired through unconsolidated joint ventures at 100 percent; acquisitions exclude IPCC JV acquisitions that were completed with no equity contribution from IRC; dispositions are shown on negativ
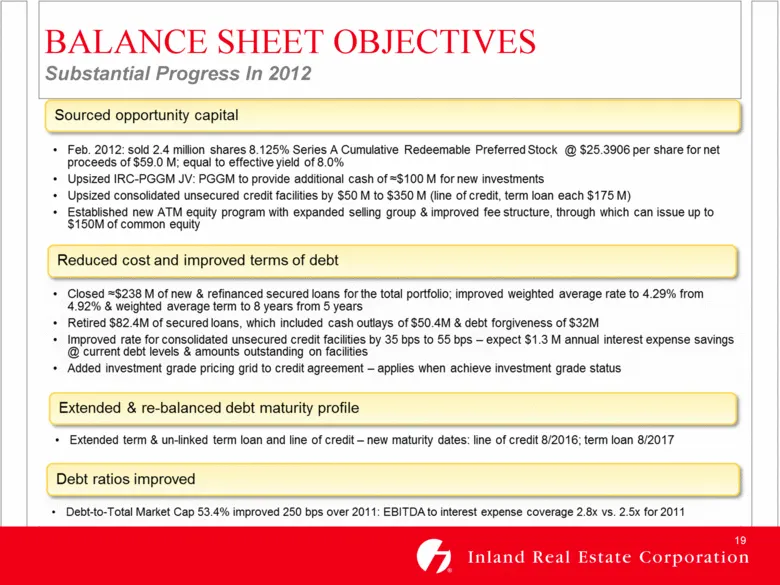
Slide 19: Balance Sheet Objectives
BALANCE SHEET OBJECTIVES Substantial Progress In 2012
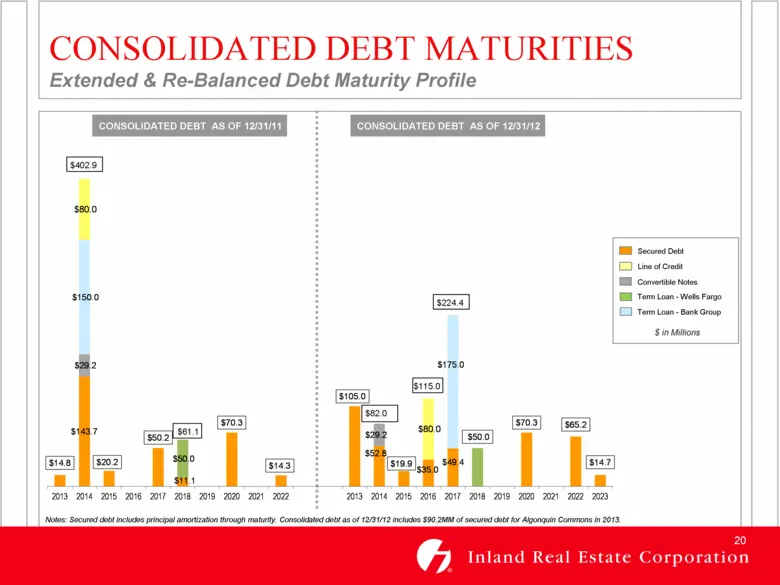
Slide 20: Extended & Re-Balanced Debt Maturity Profile
$402.9 $82.0 $61.1 $224.4 Secured Debt Term Loan - Bank Group Term Loan - Wells Fargo CONSOLIDATED DEBT AS OF 12/31/12 CONSOLIDATED DEBT AS OF 12/31/11 CONSOLIDATED DEBT MATURITIES Extended & Re-Balanced Debt Maturity Profile $115.0 Notes: Secured debt includes principal amortization through maturit
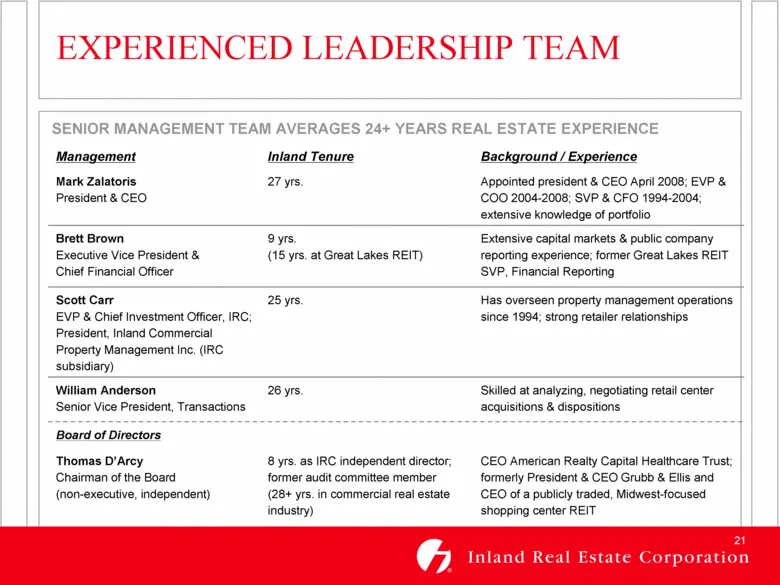
Slide 21: Experienced Leadership Team
EXPERIENCED LEADERSHIP TEAM Management Inland Tenure Background / Experience Mark Zalatoris President & CEO 27 yrs. Appointed president & CEO April 2008; EVP & COO 2004-2008; SVP & CFO 1994-2004; extensive knowledge of portfolio Brett Brown Executive Vice President & Chief Financial Officer 9 yrs. (
Slide 22: IRC Today
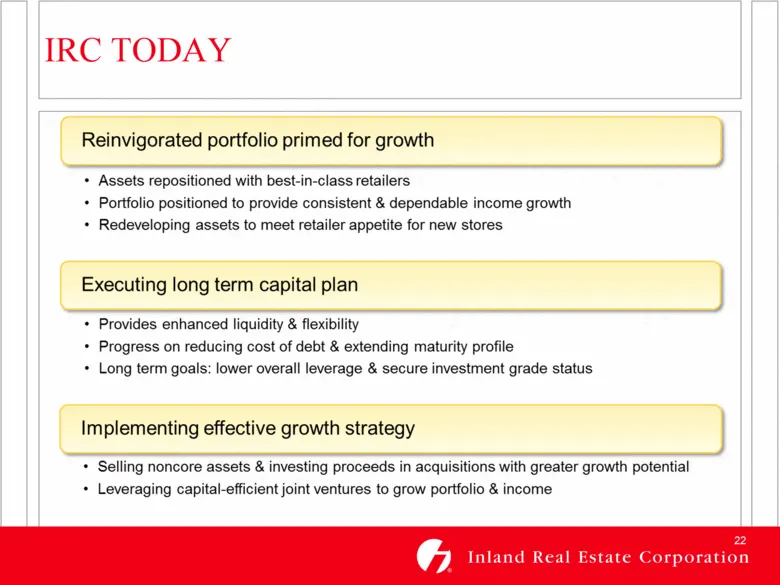
IRC TODAY Reinvigorated portfolio primed for growth + Assets repositioned with best-in-class retailers + Portfolio positioned to provide consistent & dependable income growth + Redeveloping assets to meet retailer appetite for new stores Executing long term capital plan + Provides enhanced liquidity
Slide 23: Forward-Looking Statements
FORWARD-LOOKING STATEMENTS Certain statements in this presentation constitute "forward-looking statements" within the meaning of the Federal Private Securities Litigation Reform Act of 1995. These forward-looking statements are not historical facts but are the intent, belief or current expectations
Source: SEC EDGAR · 8-K filed Apr 15, 2013
More decks from Inland Real Estate Corp
 Investor Presentation (November 2015)30 slides · Nov 17, 2015
 Investor Presentation (September 2015)29 slides · Sep 16, 2015
 Investor Presentation (June 2015)29 slides · Jun 9, 2015
 Investor Presentation (May 2015)26 slides · May 15, 2015
 Investor Presentation (February 2015)26 slides · Feb 24, 2015
 Investor Presentation (November 2014)26 slides · Nov 5, 2014