TransAtlantic Petroleum — Shareholder Meeting (June 2016)
21 slides from TransAtlantic Petroleum's shareholder meeting presentation, Jun 28, 2016
Slide 1: 2016 Annual General Meeting
2016 Annual General Meeting Exhibit 99.1
Slide 2: Forward Looking Statements
FORWARD LOOKING STATEMENTS Outlooks, projections, estimates, targets and business plans in this presentation or any related subsequent discussions are forward-looking statements. Actual future results, including TransAtlantic Petroleum Ltd.’s own production growth and mix; financial results; the amo
Slide 3: Summary: cost reductions, debt paydown, Albanian divestiture
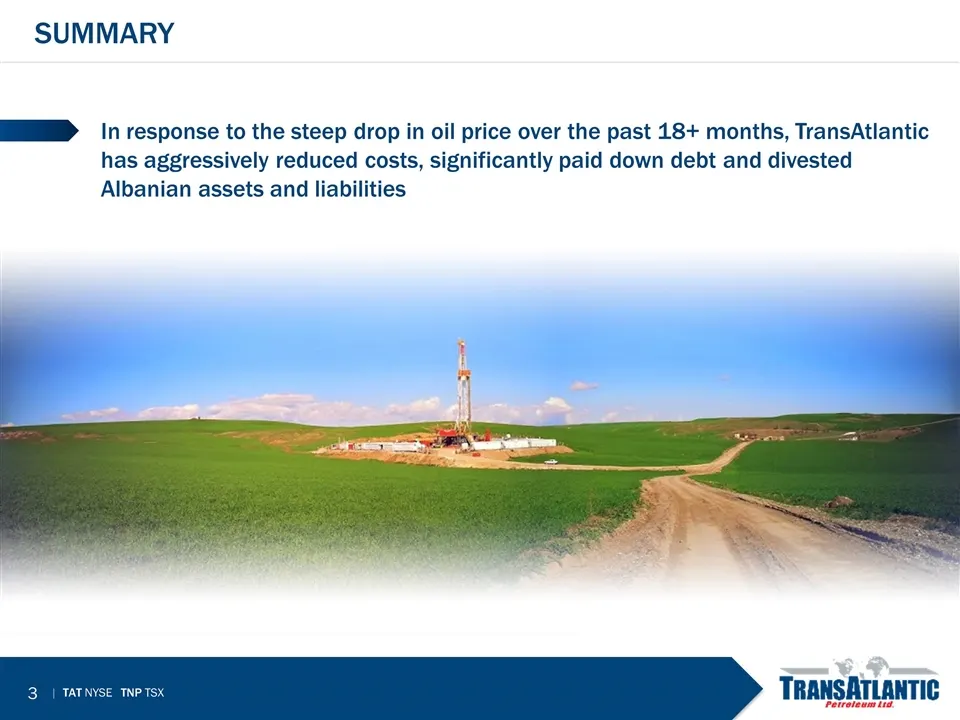
In response to the steep drop in oil price over the past 18+ months, TransAtlantic has aggressively reduced costs, significantly paid down debt and divested Albanian assets and liabilities SUMMARY
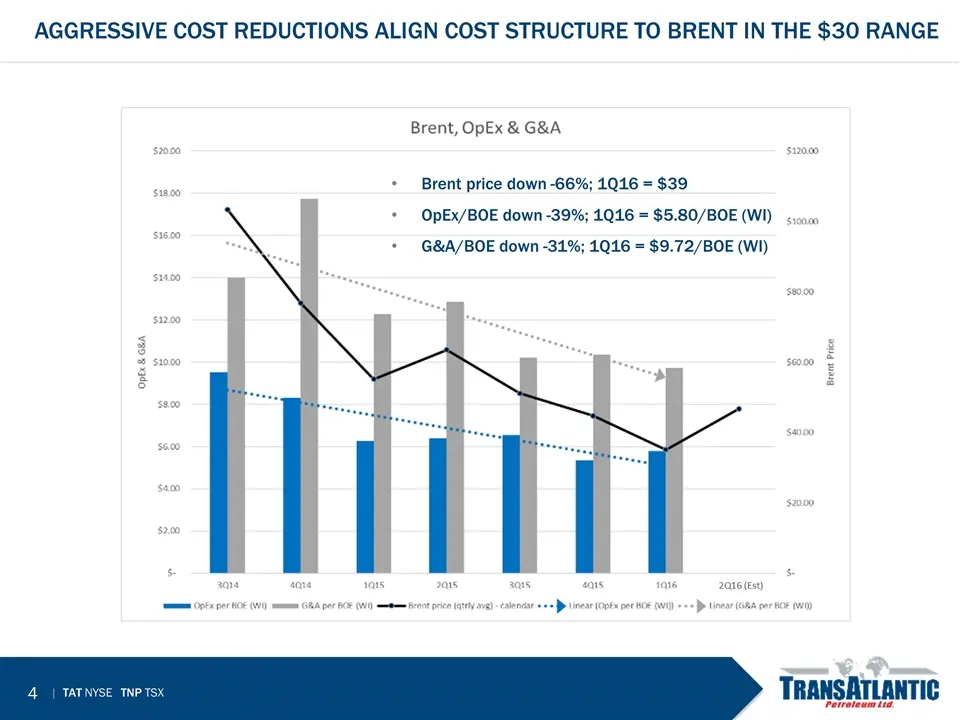
Slide 4: Aggressive cost reductions align cost structure to Brent in the $30 range
Aggressive Cost reductions align cost structure to Brent in the $30 range Brent price down -66%; 1Q16 = $39 OpEx/BOE down -39%; 1Q16 = $5.80/BOE (WI) G&A/BOE down -31%; 1Q16 = $9.72/BOE (WI)
Slide 5: Summary: recent improvements in oil prices improve economics
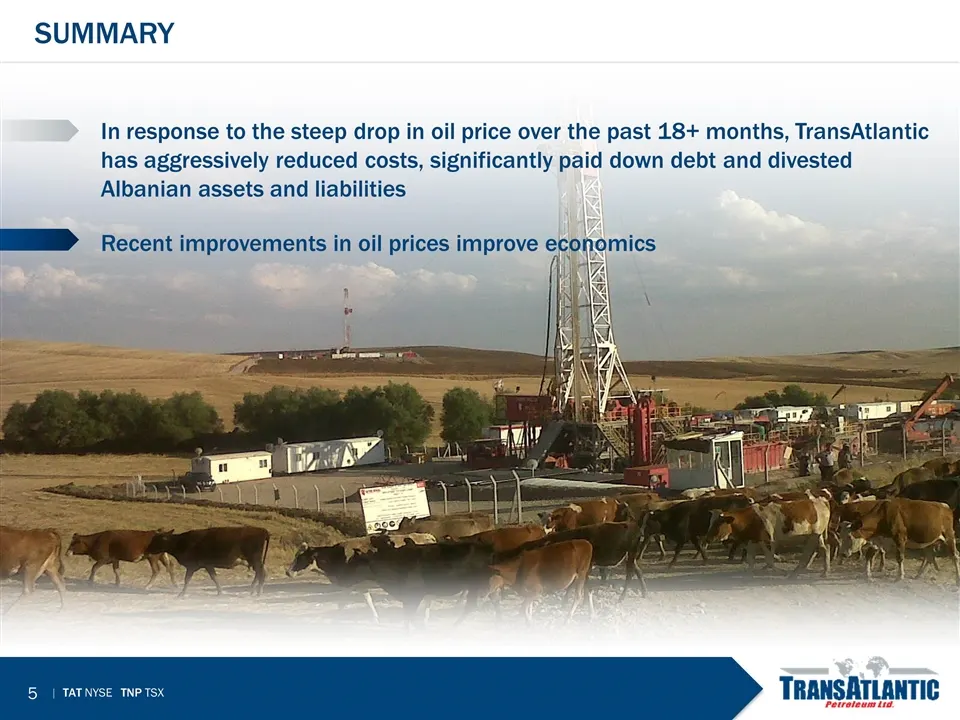
In response to the steep drop in oil price over the past 18+ months, TransAtlantic has aggressively reduced costs, significantly paid down debt and divested Albanian assets and liabilities Recent improvements in oil prices improve economics SUMMARY
Slide 6: Historical Brent oil price deck
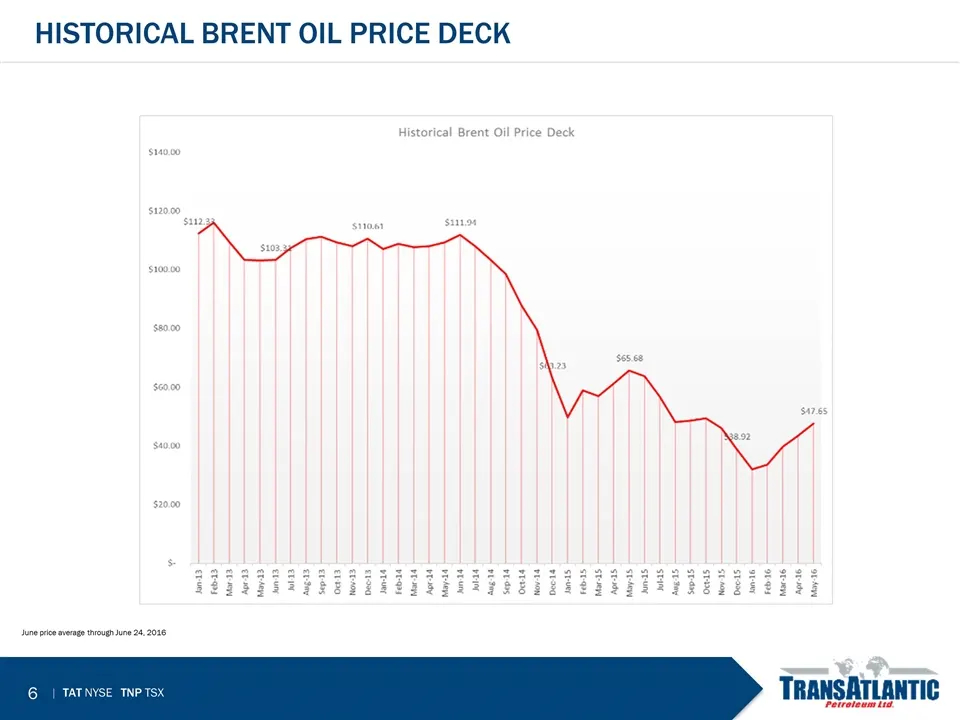
Historical brent OIL Price deck June price average through June 24, 2016
Slide 7: Future Brent oil price deck
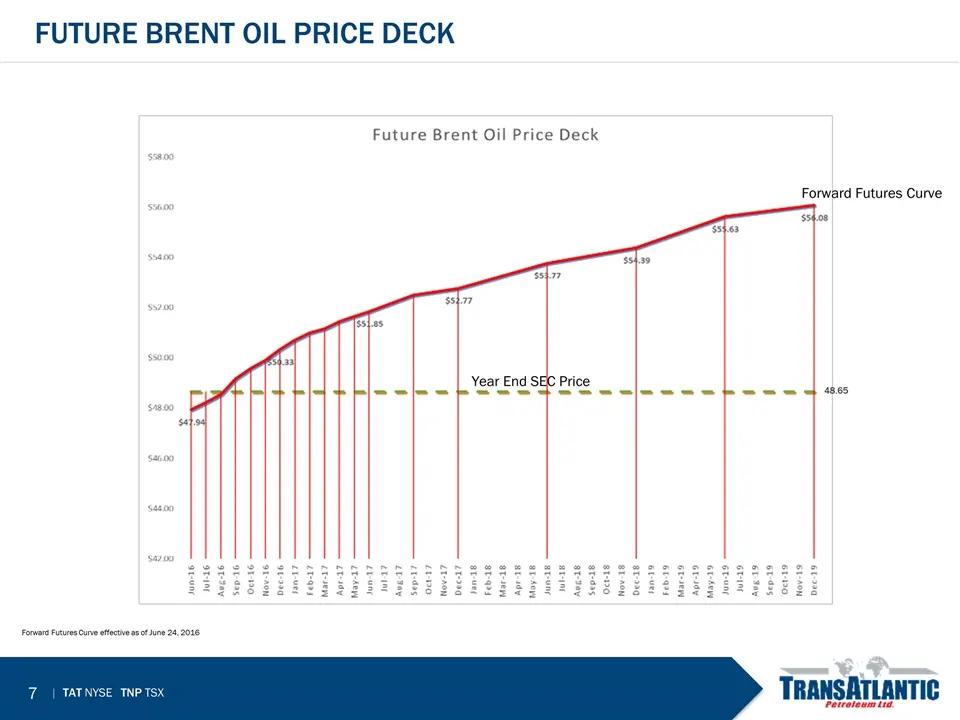
Future brent OIL Price deck Forward Futures Curve effective as of June 24, 2016 Forward Futures Curve Year End SEC Price 48.65
Slide 8: Net cash flow
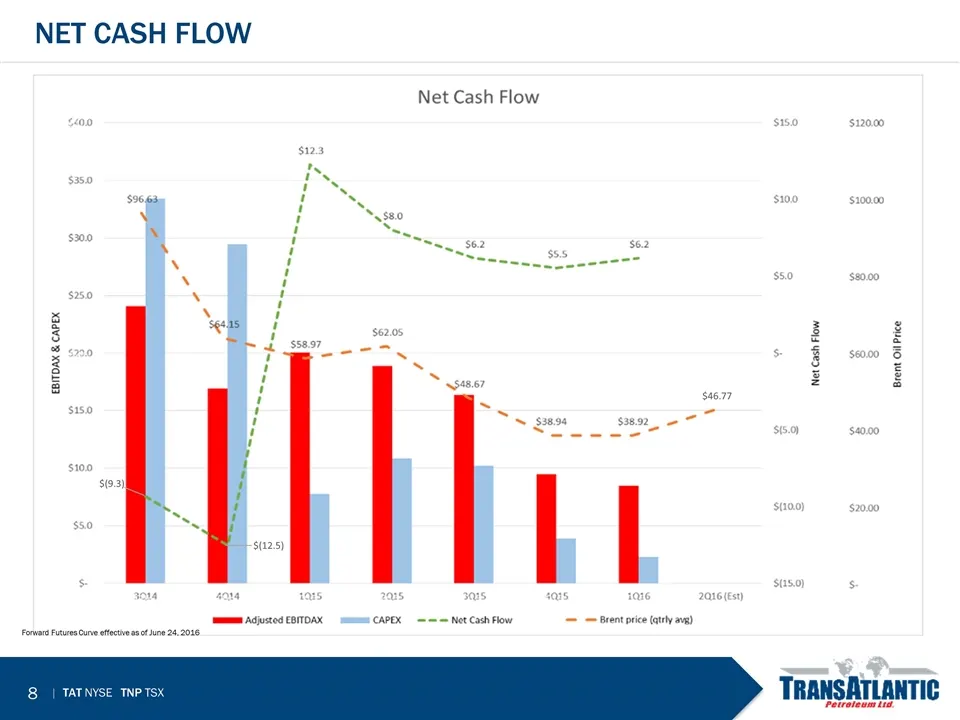
$46.77 $(9.3) $(12.5) NET Cash flow Forward Futures Curve effective as of June 24, 2016
Slide 9: Summary: rapid changes in borrowing base dominated cash flows
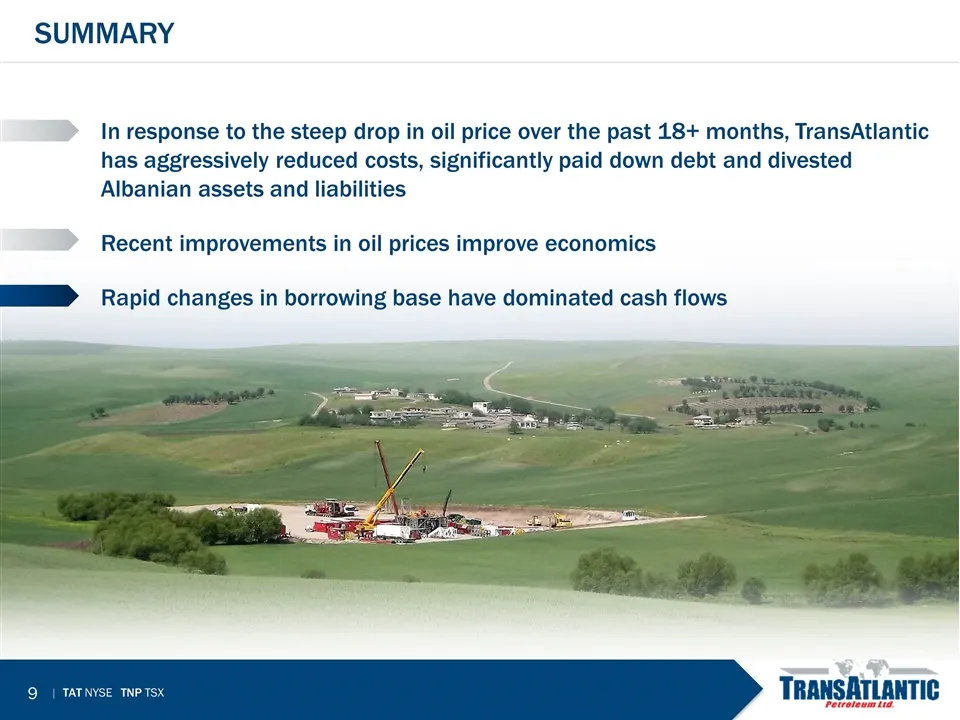
In response to the steep drop in oil price over the past 18+ months, TransAtlantic has aggressively reduced costs, significantly paid down debt and divested Albanian assets and liabilities Recent improvements in oil prices improve economics Rapid changes in borrowing base have dominated cash flows S
Slide 10: Significant debt reduction
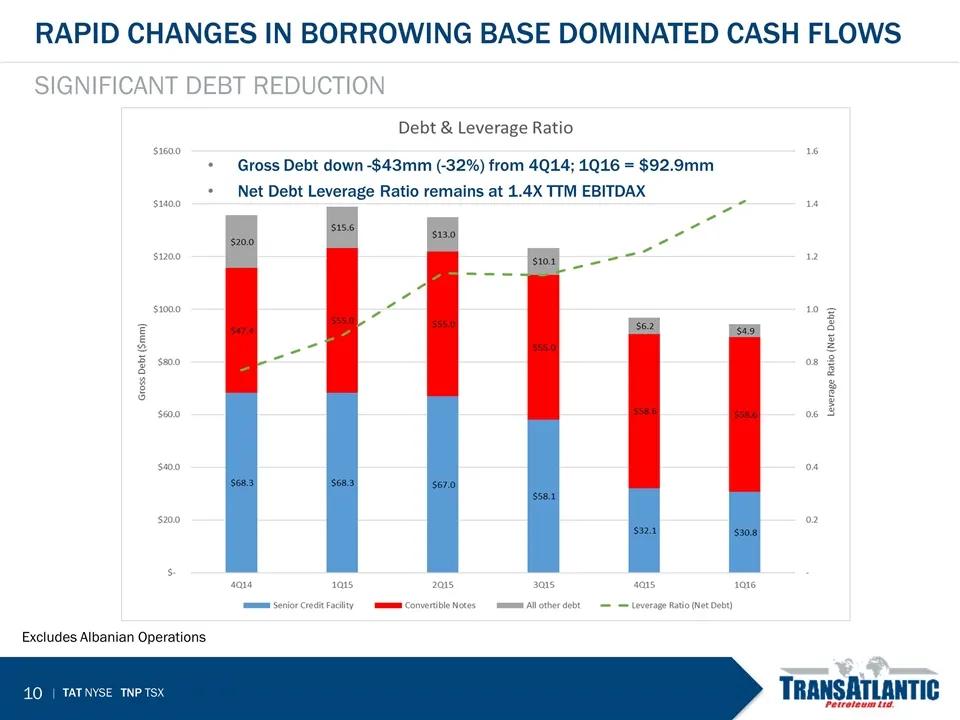
Rapid Changes in Borrowing base dominated cash flows Significant debt reduction Excludes Albanian Operations Gross Debt down -$43mm (-32%) from 4Q14; 1Q16 = $92.9mm Net Debt Leverage Ratio remains at 1.4X TTM EBITDAX
Slide 11: Senior credit facility availability through March 2019
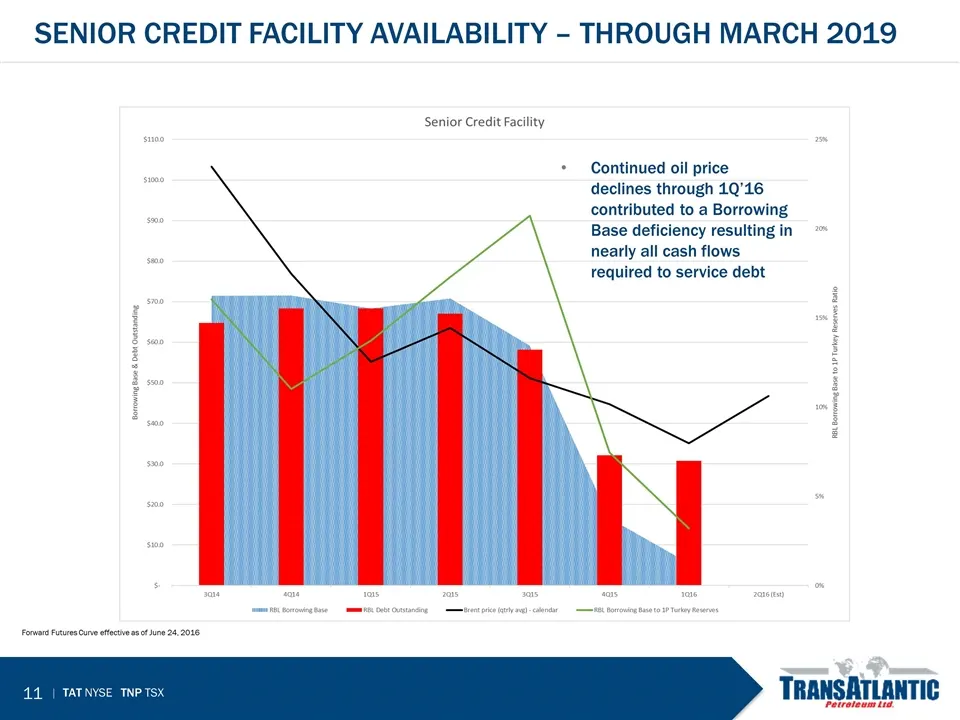
senior credit facility availability – Through March 2019 Forward Futures Curve effective as of June 24, 2016 Continued oil price declines through 1Q’16 contributed to a Borrowing Base deficiency resulting in nearly all cash flows required to service debt
Slide 12: Summary: debt restructuring initiatives and monetizing non-core assets
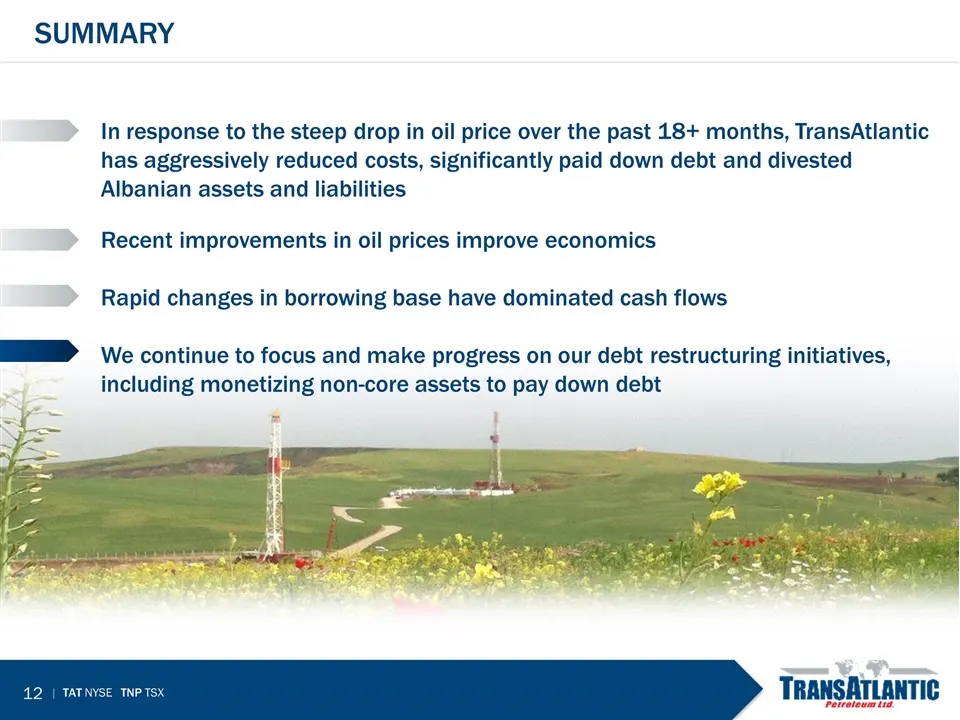
In response to the steep drop in oil price over the past 18+ months, TransAtlantic has aggressively reduced costs, significantly paid down debt and divested Albanian assets and liabilities Recent improvements in oil prices improve economics Rapid changes in borrowing base have dominated cash flows W
Slide 13: Summary: advanced seismic processing in Molla area
In response to the steep drop in oil price over the past 18+ months, TransAtlantic has aggressively reduced costs, significantly paid down debt and divested Albanian assets and liabilities Recent improvements in oil prices improve economics Rapid changes in borrowing base have dominated cash flows W
Slide 14: SE Turkey
TransAtlantic Petroleum’s lease position in SE Turkey is very promising. Recent advances in seismic processing has led to an improved understanding of the geology of the region. Reprocessing of the 3D seismic is enabling TransAtlantic: to convert the data from time to depth for more accurate mapping
Slide 15: Comparison of 2D seismic with reprocessed 3D seismic, Molla Area
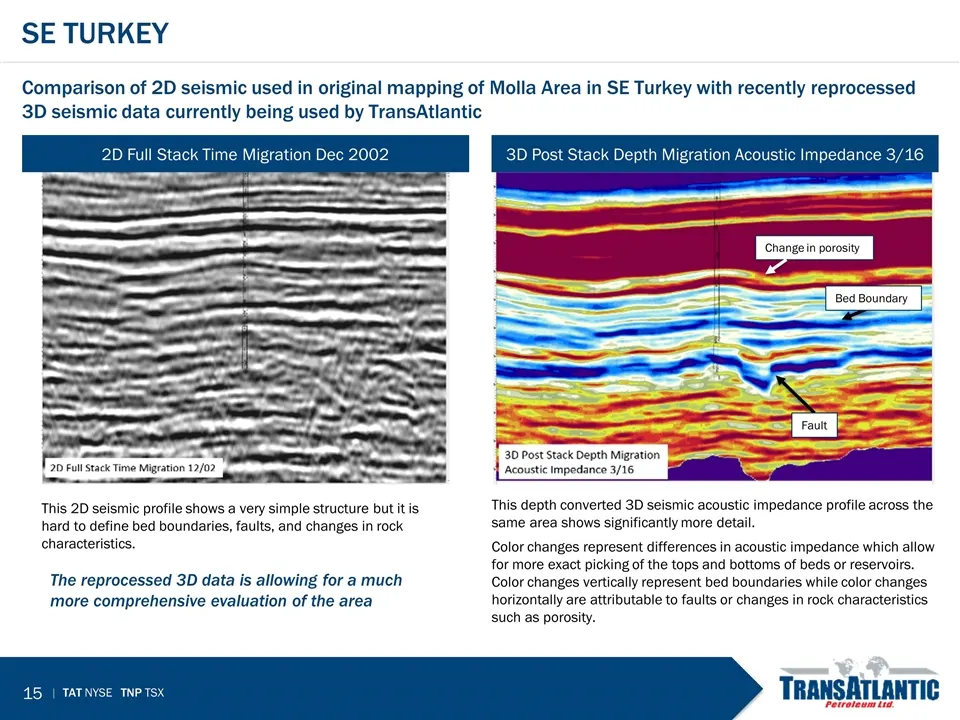
Change in porosity Fault Bed Boundary Se turkey Comparison of 2D seismic used in original mapping of Molla Area in SE Turkey with recently reprocessed 3D seismic data currently being used by TransAtlantic 2D Full Stack Time Migration Dec 2002 This 2D seismic profile shows a very simple structure but
Slide 16: SE Turkey identified prospects and leads in the Molla Area
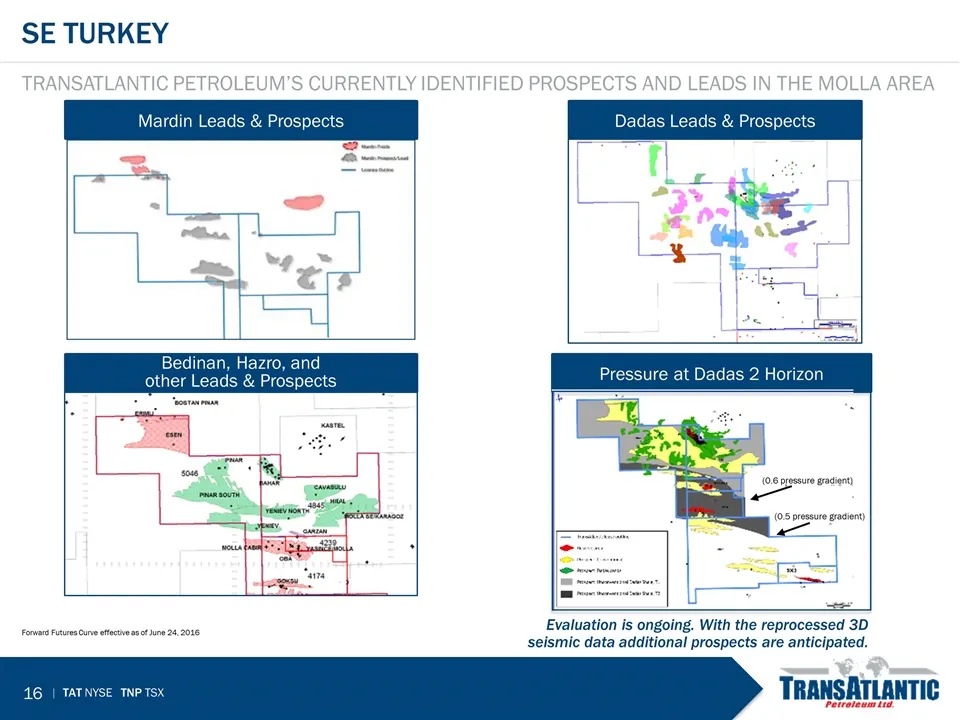
SE turkey TransAtlantic Petroleum’s currently identified prospects and leads in the Molla Area Forward Futures Curve effective as of June 24, 2016 Mardin Leads & Prospects Bedinan, Hazro, and other Leads & Prospects Dadas Leads & Prospects Evaluation is ongoing. With the reprocessed 3D seismic data
Slide 17: SE Turkey resource play analog map
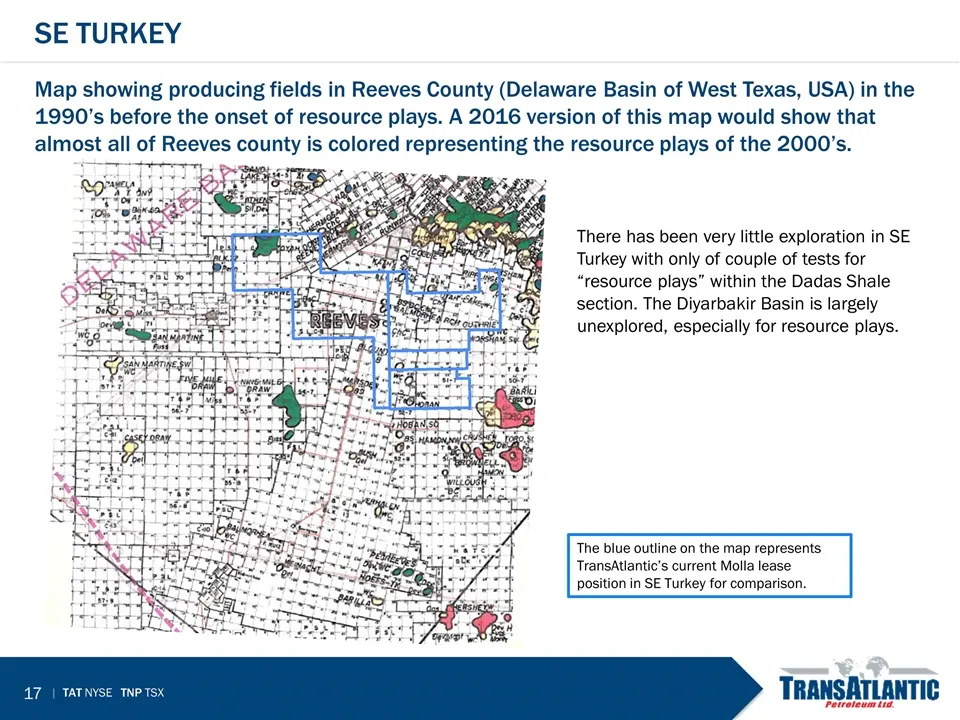
SE Turkey Map showing producing fields in Reeves County (Delaware Basin of West Texas, USA) in the 1990’s before the onset of resource plays. A 2016 version of this map would show that almost all of Reeves county is colored representing the resource plays of the 2000’s. The blue outline on the map r
Slide 18: Long term well economics $30-60 Brent
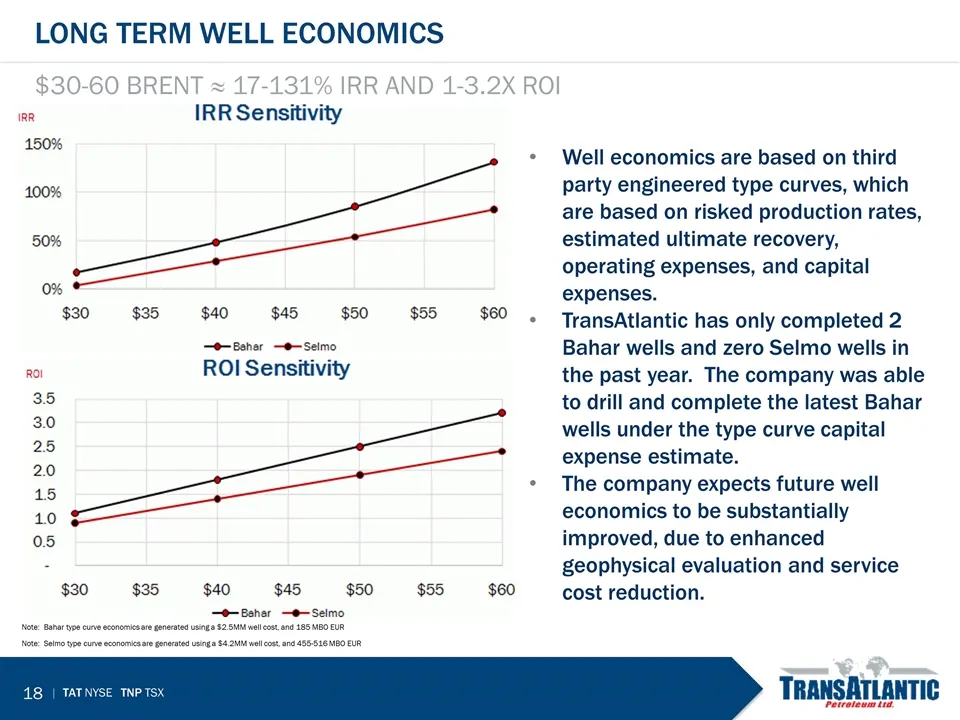
Long term well economics $30-60 Brent ≈ 17-131% IRR and 1-3.2x ROI Note: Bahar type curve economics are generated using a $2.5MM well cost, and 185 MBO EUR Note: Selmo type curve economics are generated using a $4.2MM well cost, and 455-516 MBO EUR Well economics are based on third party engineered
Slide 19: Summary: financial restructuring should improve price to value ratio
In response to the steep drop in oil price over the past 18+ months, TransAtlantic has aggressively reduced costs, significantly paid down debt and divested Albanian assets and liabilities Recent improvements in oil prices improve economics Rapid changes in borrowing base have dominated cash flows W
Slide 20: Oil price to market and enterprise value
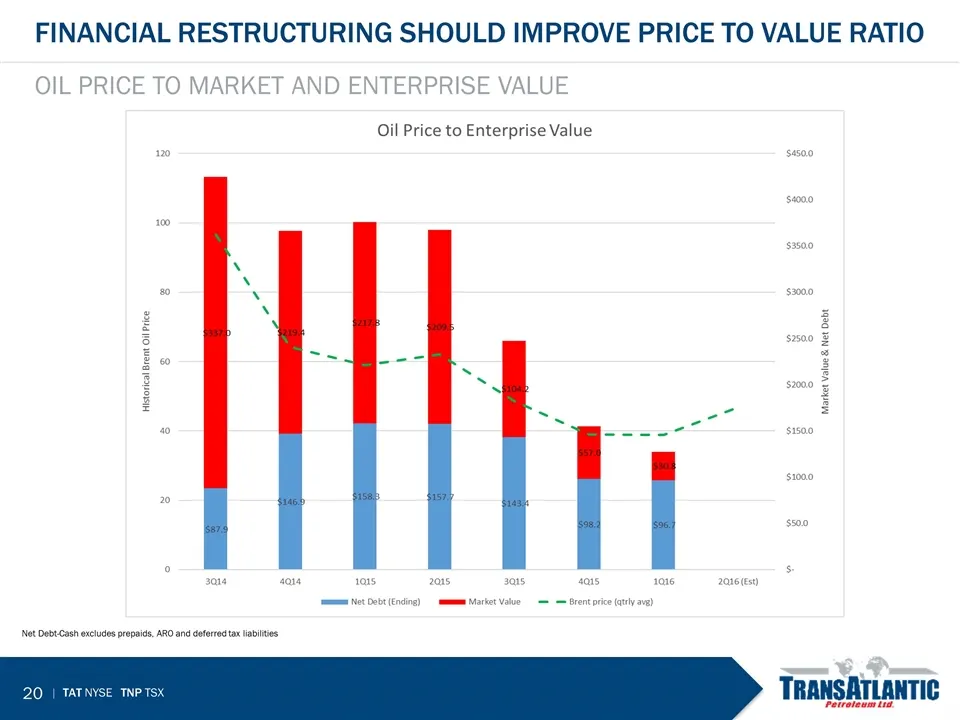
Oil price to market and enterprise value Net Debt-Cash excludes prepaids, ARO and deferred tax liabilities Financial restructuring should improve price to value ratio
Slide 21: Summary and Questions
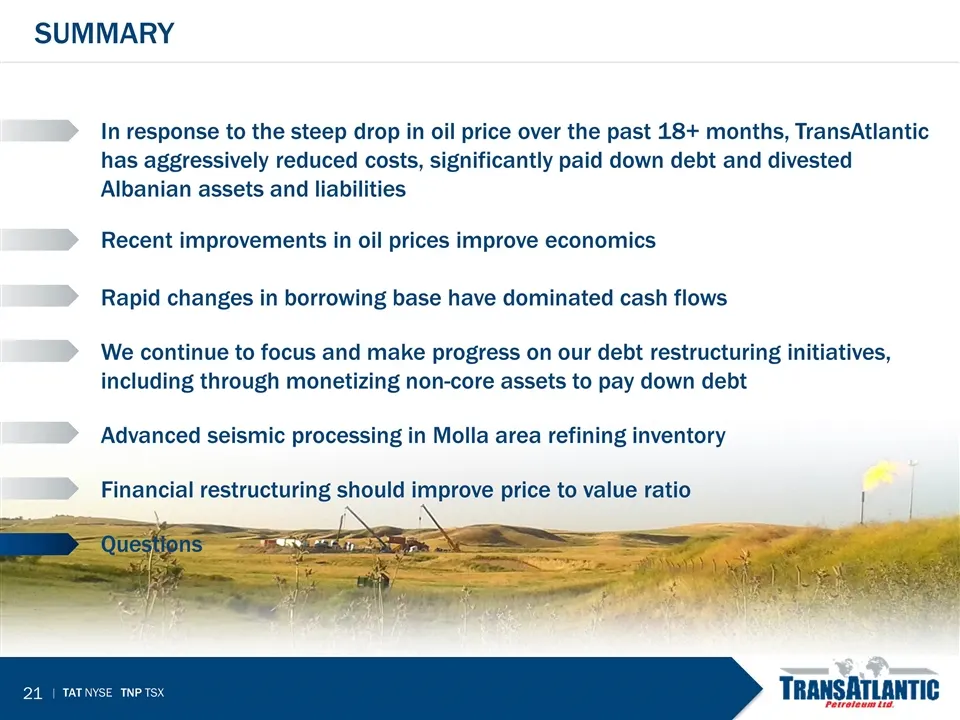
In response to the steep drop in oil price over the past 18+ months, TransAtlantic has aggressively reduced costs, significantly paid down debt and divested Albanian assets and liabilities Recent improvements in oil prices improve economics Rapid changes in borrowing base have dominated cash flows W
Source: SEC EDGAR · 8-K filed Jun 28, 2016
More decks from TransAtlantic Petroleum Ltd
 Shareholder Meeting (June 2020)11 slides · Jun 4, 2020
 Corporate Update (March 2020)9 slides · Mar 9, 2020
 CEEC Scout Meeting, Constanta, Romania (May 2019)14 slides · May 10, 2019
 Technical Presentation (March 2019)10 slides · Mar 26, 2019
 2018 IPAA OGIS New York32 slides · Apr 6, 2018
 Investor Presentation (April 2018)14 slides · Apr 2, 2018