Old Point Financial Corporation
Old Point Financial — Investor Presentation (September 2018)
22 slides from Old Point Financial's investor presentation, Sep 10, 2018

Slide 1: Investor Presentation
POINT Investor Presentation Nasdaq: OPOF OldPoint.com
Slide 2: Forward-Looking Statements
Forward-Looking Statements Certain statementsin this report may constitute “forward-looking statements” within the meaning of the Private Securities Litigation Reform Act of 1995. Forward-looking statements are statements that include projections, predictions, expectations, or beliefs about future e
Slide 3: Old Point Overview
Old Point Overview One of the largest community banks headquartered in the Hampton Roads, Virginia MSA
Slide 4: A Family of Companies
A Family of Companies He ee OLD OLD OLD POINT POINT POINT POINT NATIONAL BANK MORTGAGE INSURANCE TRUST
Slide 5: Old Point's Strengths
Old Point's Strengths Unique branch network and aloyal customer basein one of the strongest markets in Virginia Competitive banking products and services Significant disruption of community banks (Monarch, Xenith, Heritage) affords anopportunity in this space Well positioned for organic growth given
Slide 6: Business in Virginia
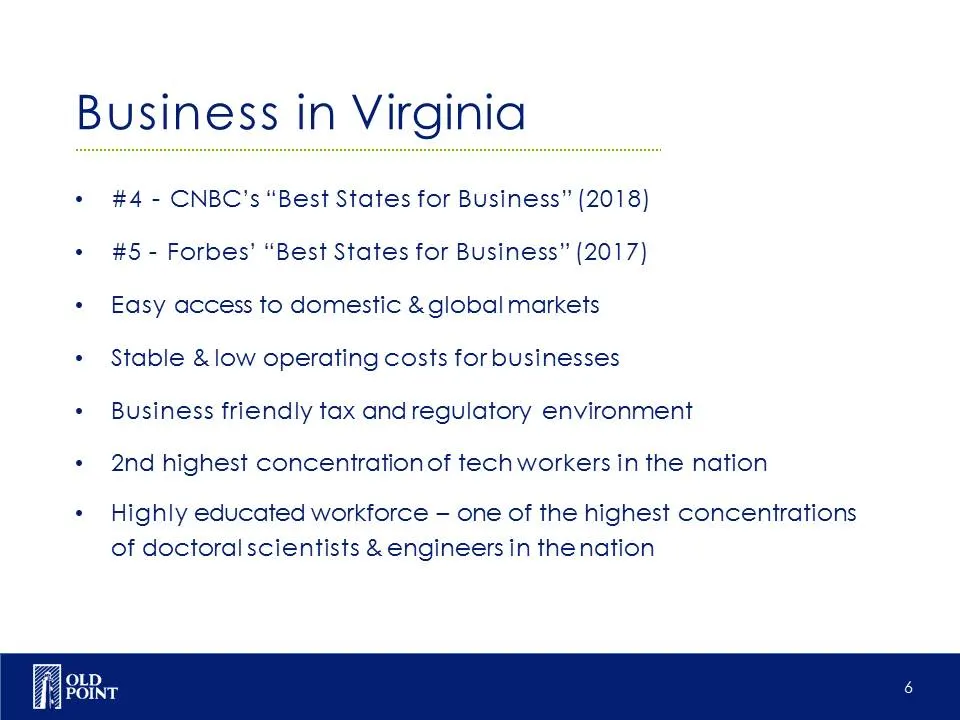
Business in Virginia ° #4 - CNBC's “Best States for Business” (2018) + #5- Forbes’ “Best States for Business” (2017) + Easy access to domestic & global markets + Stable &low operating costs for businesses + Business friendly tax and regulatory environment * 2nd highest concentration of tech workers
Slide 7: Hampton Roads Market
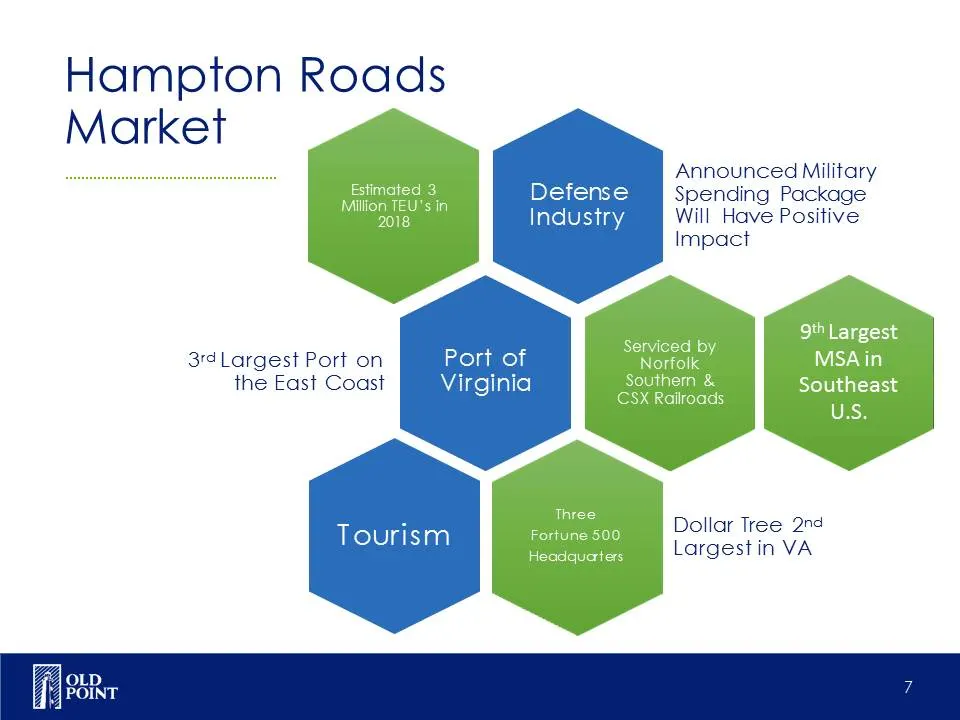
Hampton Roads Market Announced Military Defense Spending Package Industry Will Have Positive Impact 3rd Largest Port on Port of the East Coast Virginia Dollar Tree 24 Largest in VA
Slide 8: Hampton Roads Market
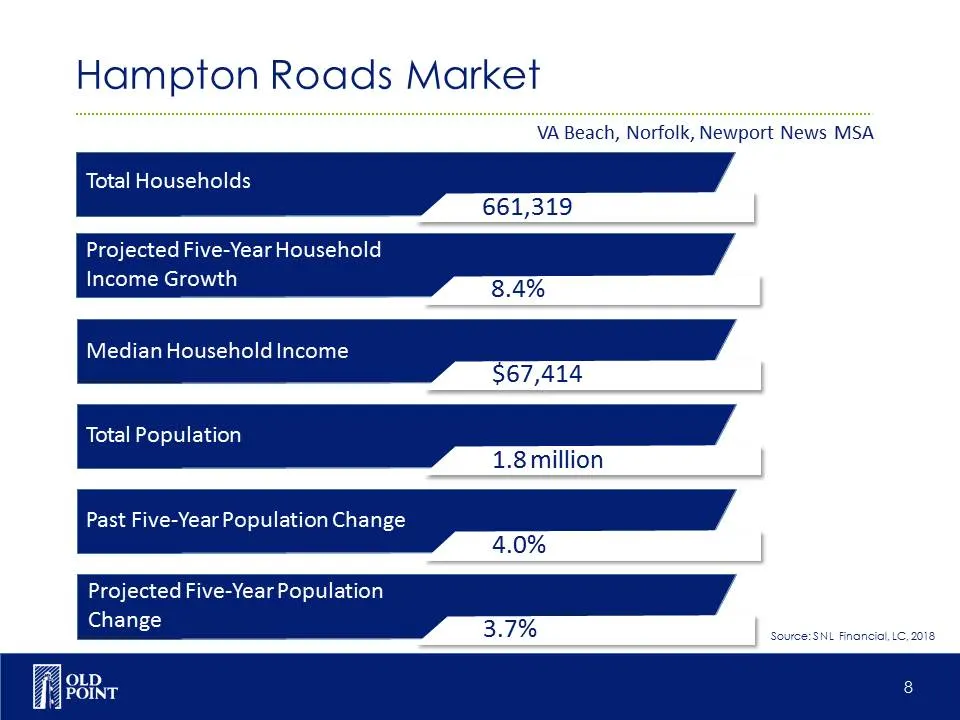
Hampton Roads Market VA Beach, Norfolk, Newport News MSA Total Households 661,319 Projected Fiv ‘ar Household Income Growth 3.4% Median Household Income $67,414 Total Population 1.8 million Past Five-Year Population Change 4.0% Projected Five-Year Population Change 3.7%
Slide 9: Strong Bank Position in Hampton, VA Market
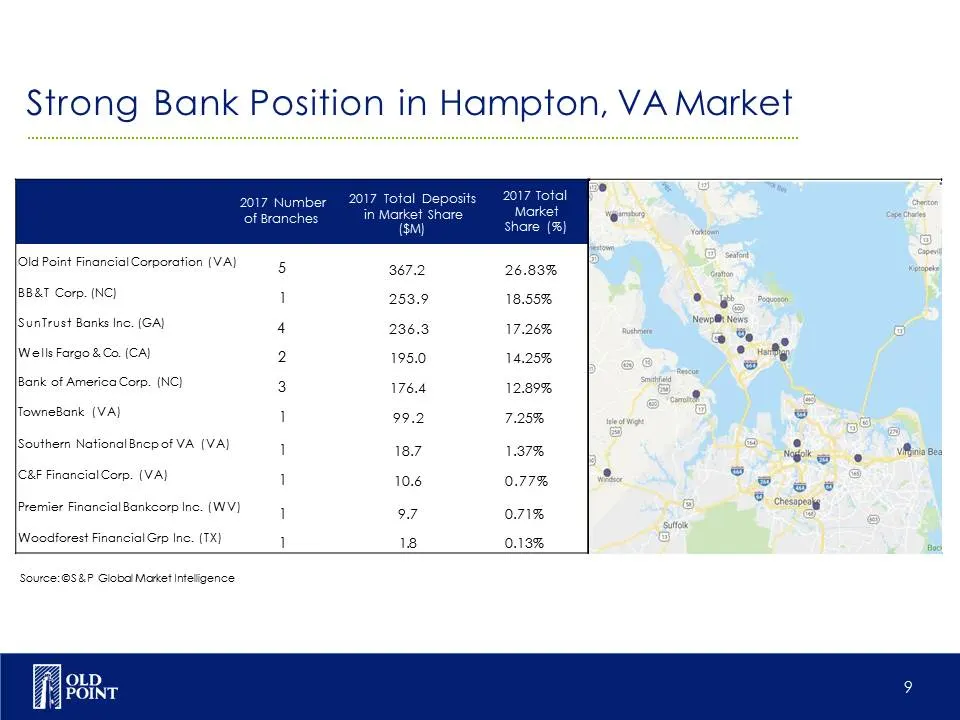
Strong Bank Position in Hampton, VA Market in Marke (sm) |Old Point Financial Corporation (VA} BB&T Corp. (NC) 1 253.9 18.55% [Suntrust Banks Inc. (GA) 4 236.3 17.26% |Wells Farge & Co. (CA) 2 195.0 14.25% Bank of America Corp. (NC) 3 176.4 12.89% HTowneBank (VA) 1 99.2 7.25% Ws lSouthern National B
Slide 10: Experienced Senior Management
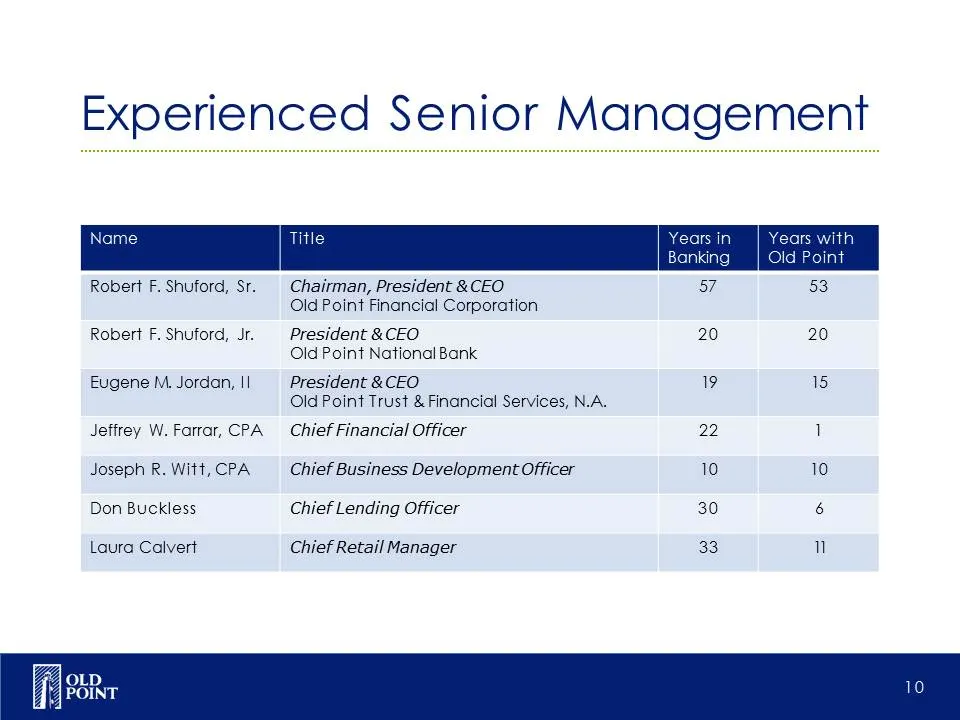
Experienced Senior Management Robert F. Shuford, Sr. Chairman, President &CEO Old Point Financial Corporation Robert F. Shuford, Jr. President &CEO 20 20 Old Point National Bank. Eugene M. Jordan, || President &CEO 19 15 Old Point Trust & Financial Services, N.A. Jeffrey W. Farrar, CPA Chief Financi
Slide 11: Old Point Trust & Financial Services
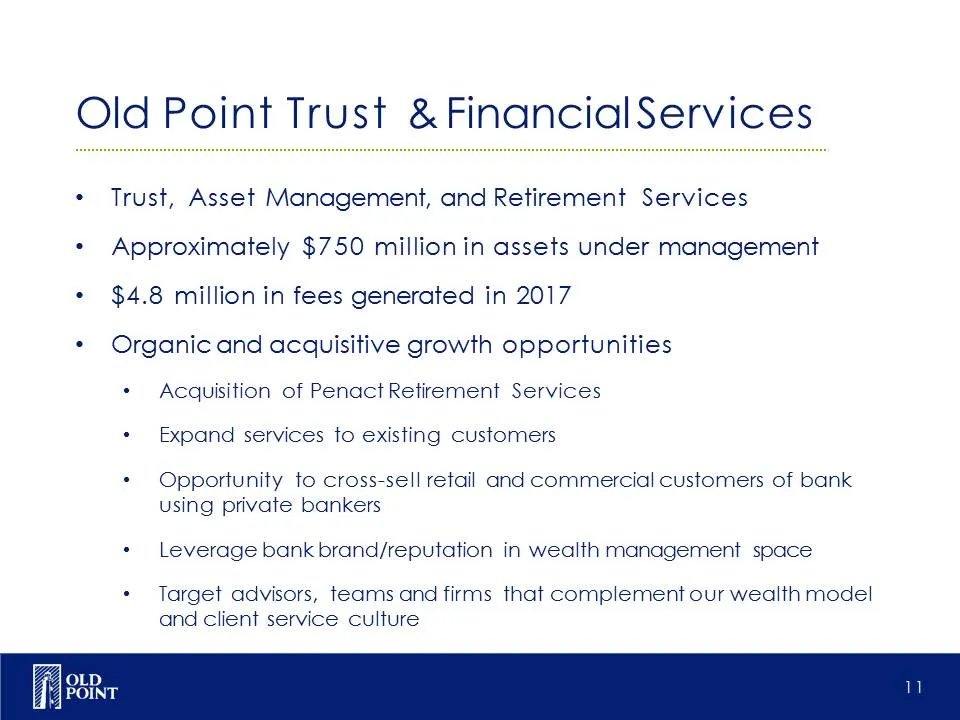
Old Point Trust & FinancialServices + Trust, Asset Management, and Retirement Services * Approximately $750 millionin assets under management * $4.8 million in fees generated in 2017 * Organic and acquisitive growth opportunities * Acquisition of Penact Retirement Services + Expand services to exist
Slide 12: Non-Performing Asset Metrics
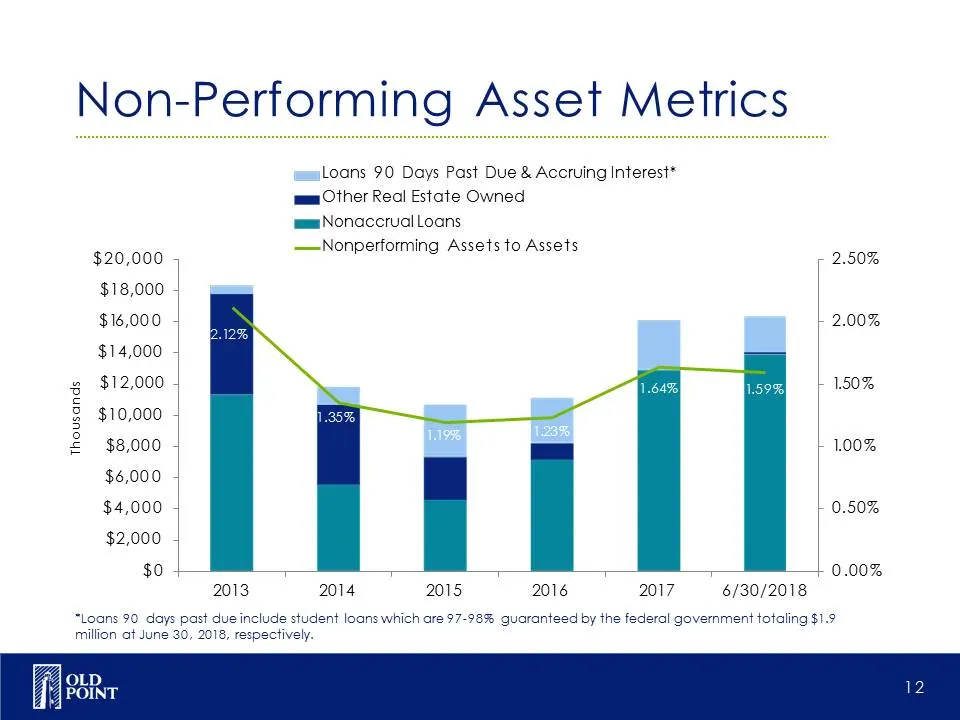
Non-Performing Asset Metrics Loans 90 Days Past Due & Accruing Interest* gam Other Real Estate Owned am Nonaccrual Loans $08.000 _—Nonperforming Assets to Assets $18,000 $16,000 $14,000 $12,000 $10,000 $8,000 $6,000 $4,000 $2,000 $0 Thousands 2013 2014 2015 2016 2017 6/30/2018 “Loans 90 days past du
Slide 13: Balance Sheet Trends
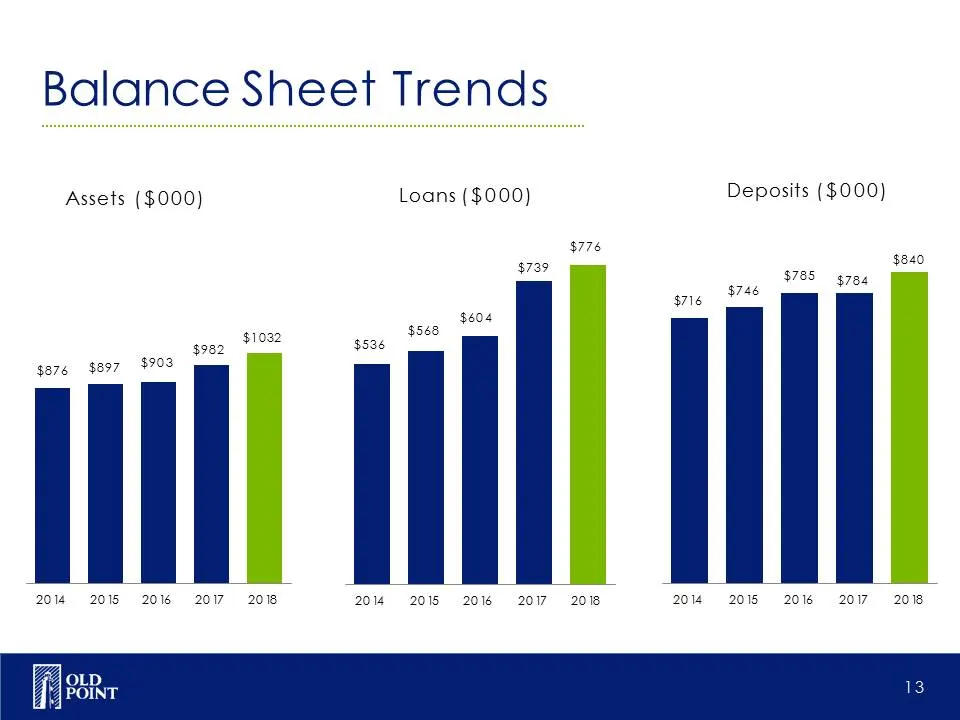
Balance Sheet Trends Assets ($000) Loans ($000) Deposits ($000) $982 gore $897 $703 2014 201 20% 207 208 $1032
Slide 14: Loan Portfolio
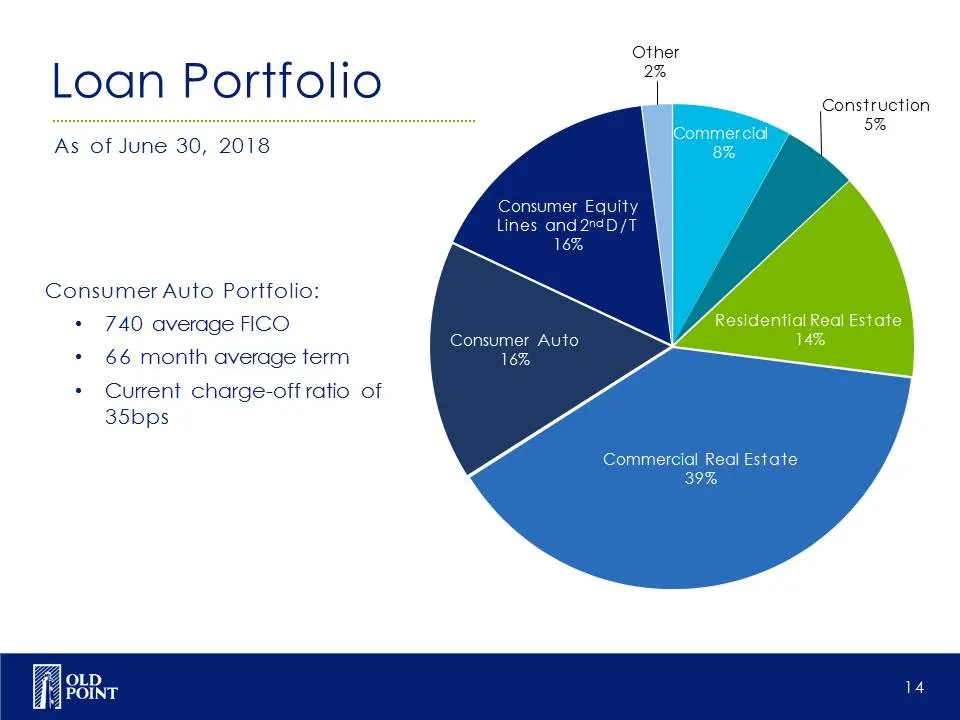
Loan Portfolio As of June 30, 2018 Consumer Auto Portfolio: + 740 average FICO + 66 month average term * Current charge-off ratio of 35bps Other 2% Consumer Equity lines and2°4D/T 16% Consumer Auto Construction 5%
Slide 15: Profitability Ratios & Income Trends
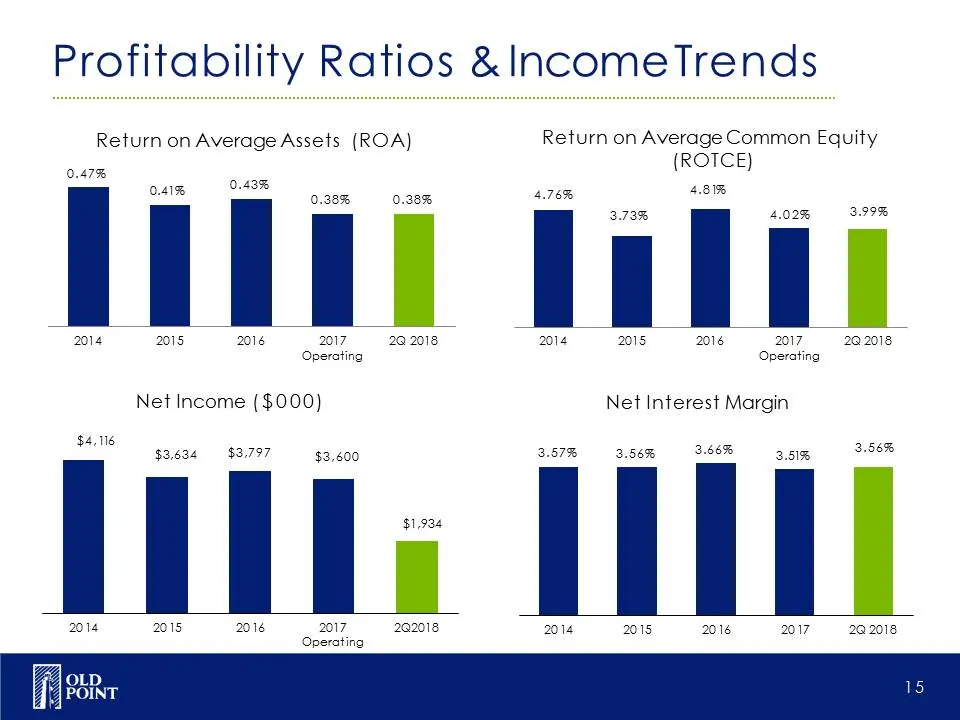
Profitability Ratios &lncomeTrends Return on Average Assets (ROA) 0.47% il j Net Income ($000) 0.43% 20168 2017 292018 Operating $4,118 634 $3,797 $3,600 Return on Average Common Equity (ROTCE) 4.8% 4.02% 3.99% 2017 Operating Net Interest Margin 3.66% see 3.56% 2014 2015 ting iE nT
Slide 16: Leveraging Capital
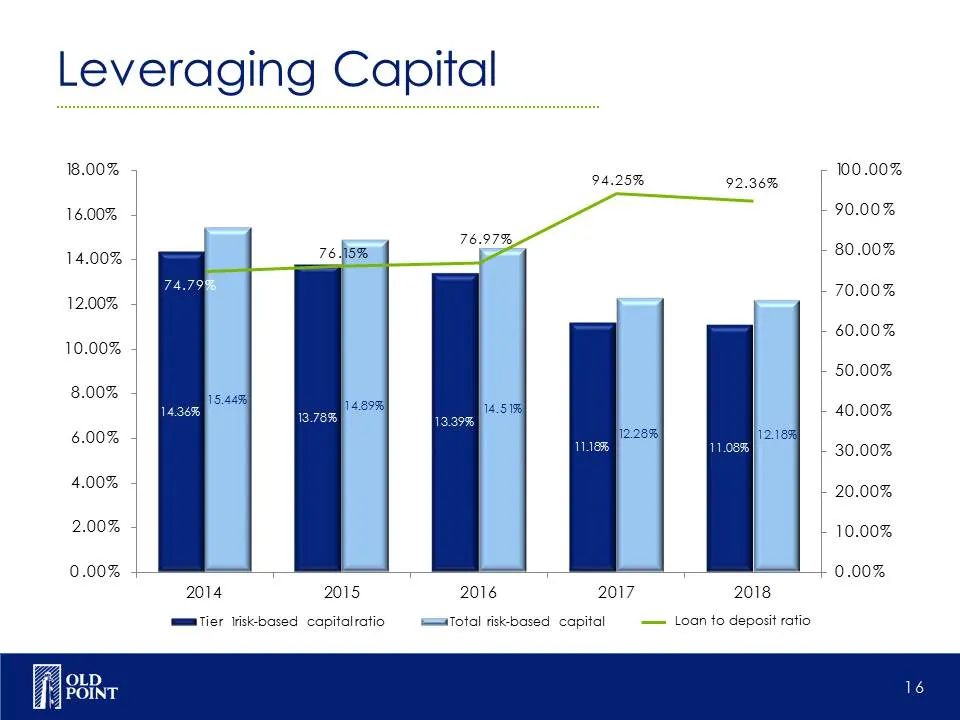
Leveraging Capital 18.00% sa5ee on.asse 100.00% 16.00% 90.00% (a CO% 80.00% 70.00% 12.00% 60.00% 10.00% 50.00% 8.00% 40.00% 6.00% 30.00% 4.00% 20.00% 200% 10.00% 0.00% 0.00% 2014 2015 2016 2017 2018 mmmtier trisk-based capitalratio ‘=eurTotal risk-based capital — Loan to deposit ratio OLD POINT
Slide 17: Deposit Mix
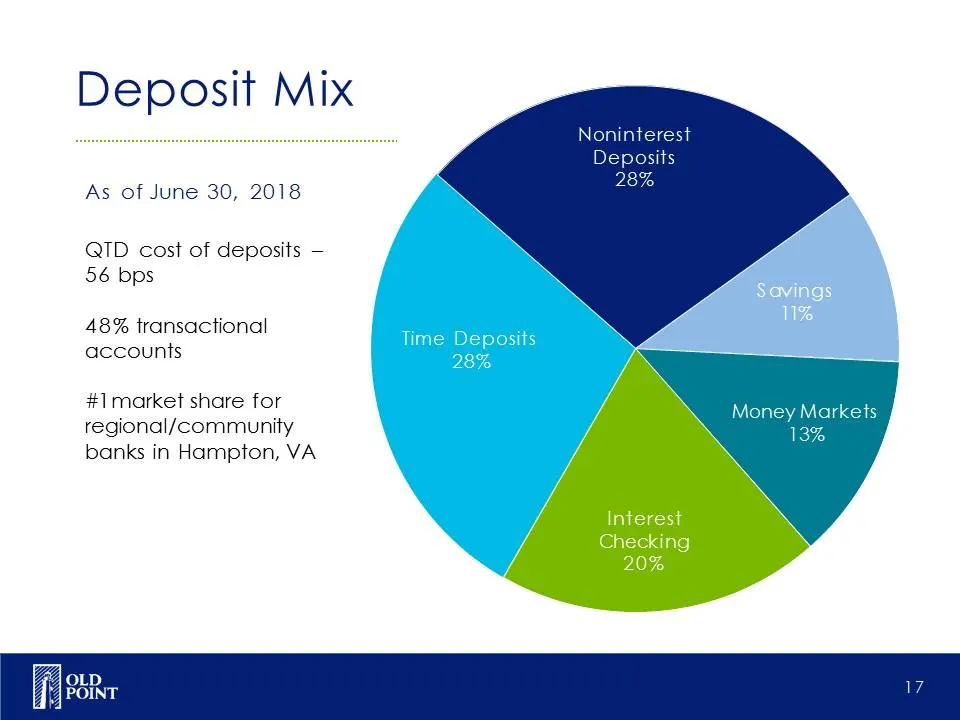
Deposit Mix As of June 30, 2018 QTD cost of deposits — 56 bps 48% transactional accounts #1 market share for Money Markets regional/community 13% banks in Hampton, VA
Slide 18: Overall Funding Costs
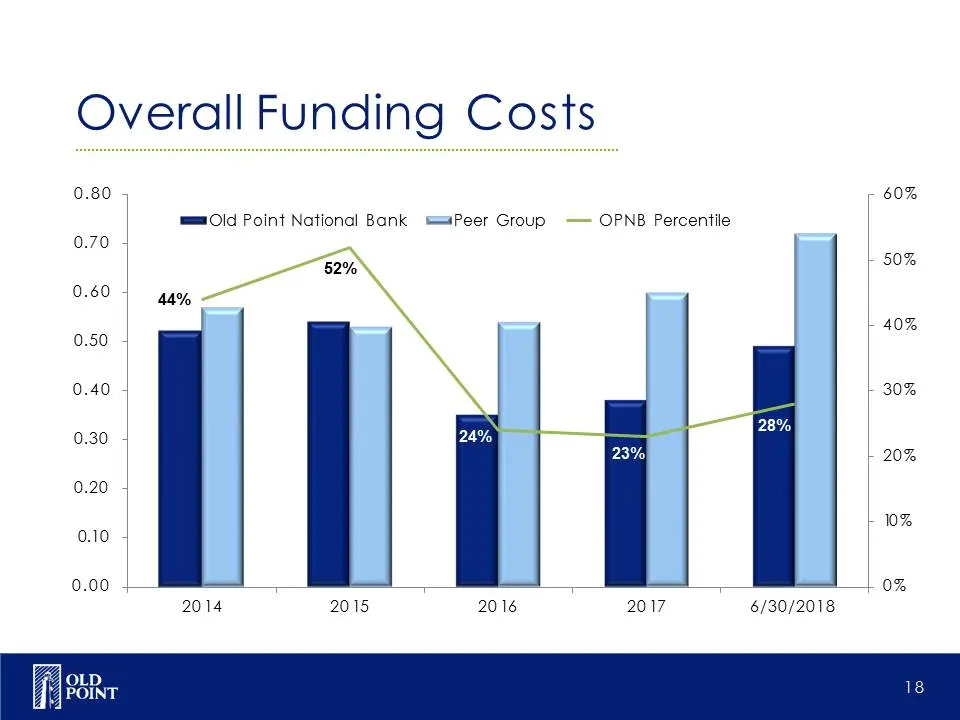
Overall Funding Costs ; 0.80 0.70 0.60 0.50 0.40 0.30 0.20 0.10 0.00 OLD POINT mmm Old Point National Bank s=aPeer Group — OPNB Percentile 2014 2015 2016 2017 60% 50% 40% 30% 20% 0% + 0%
Slide 19: Strategic Priorities
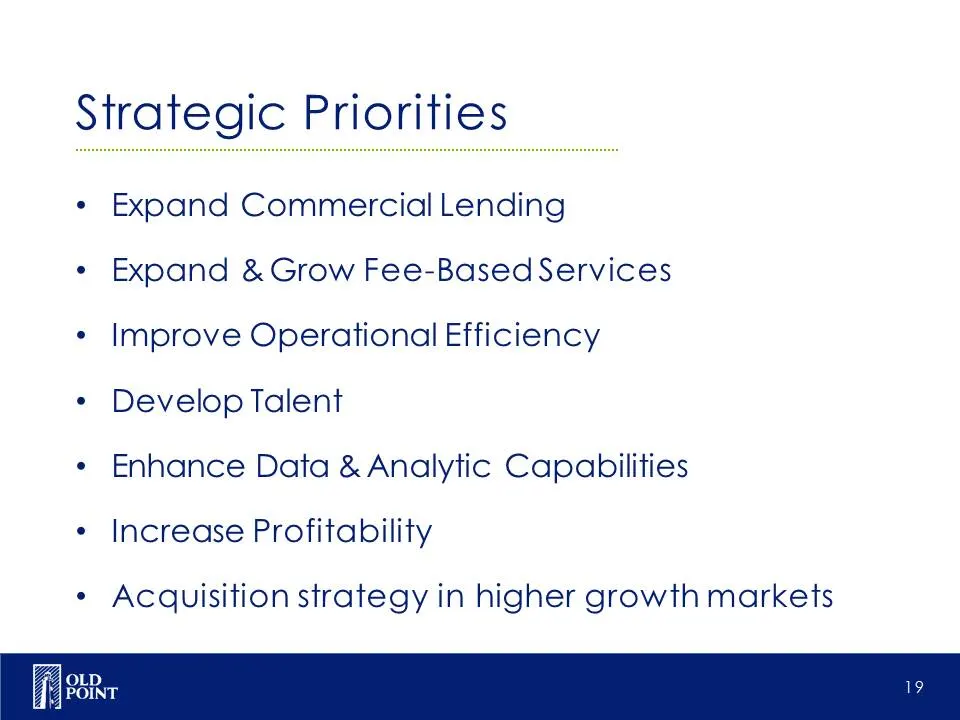
Strategic Priorities + Expand Commercial Lending « Expand & Grow Fee-Based Services * Improve Operational Efficiency * Develop Talent * Enhance Data & Analytic Capabilities * Increase Profitability * Acquisition strategy in higher growth markets
Slide 20: Financial Performance Focus
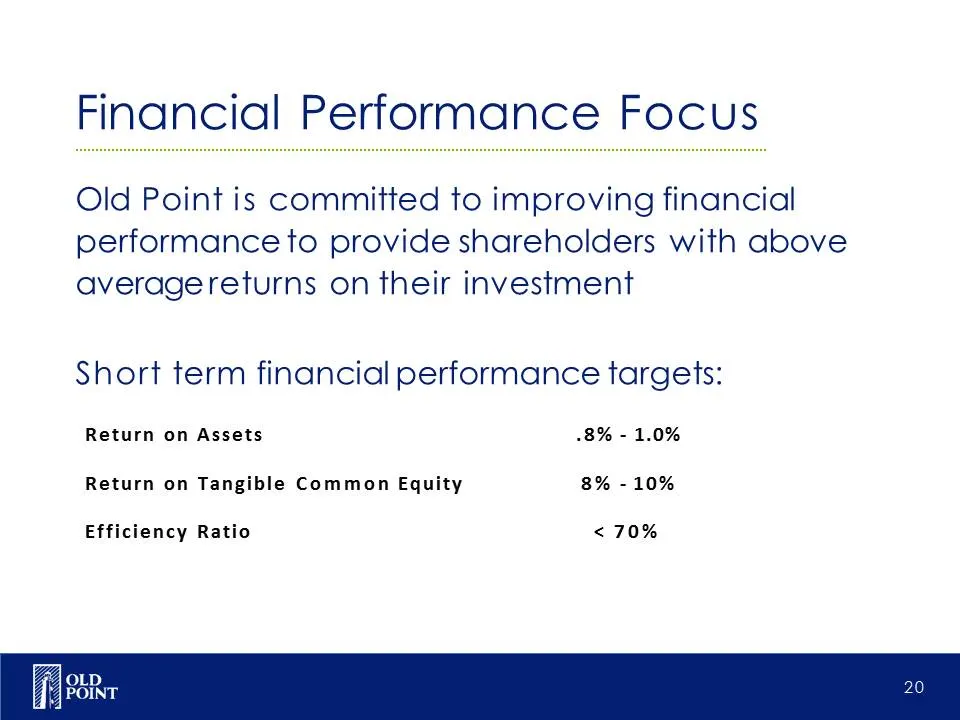
Financial Performance Focus Old Point is committed to improving financial performance to provide shareholders with above average returns on their investment Short term financial performance targets: Return on Assets -8% - 1.0% Return on Tangible Common Equity 8% -10% Efficiency Ratio < 70%
Slide 21: Shareholder Return
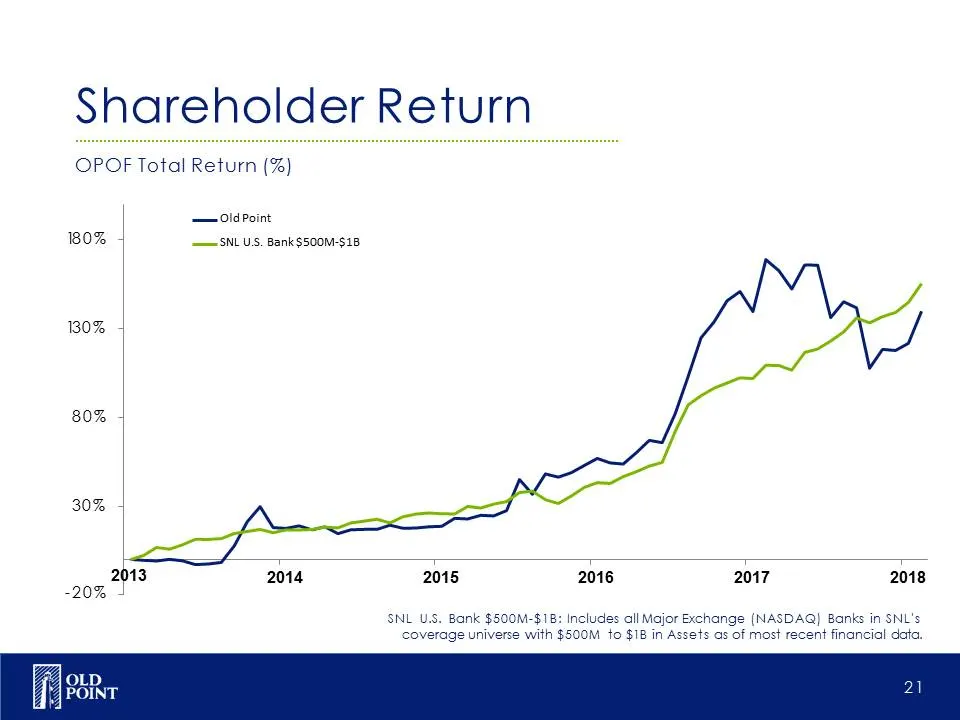
Shareholder Return OPOF Total Return (%) 0% 0% 80% 30% —oldPoint SNL US. Bank $500M-$18 13 2014 2015 2016 2017 2018 SNL U.S. Bank $500M-$18: includes all Major Exchange (NASDAQ) Banks in SNL's coverage universe with $500M to $18 in Assets as of most recent financial data.
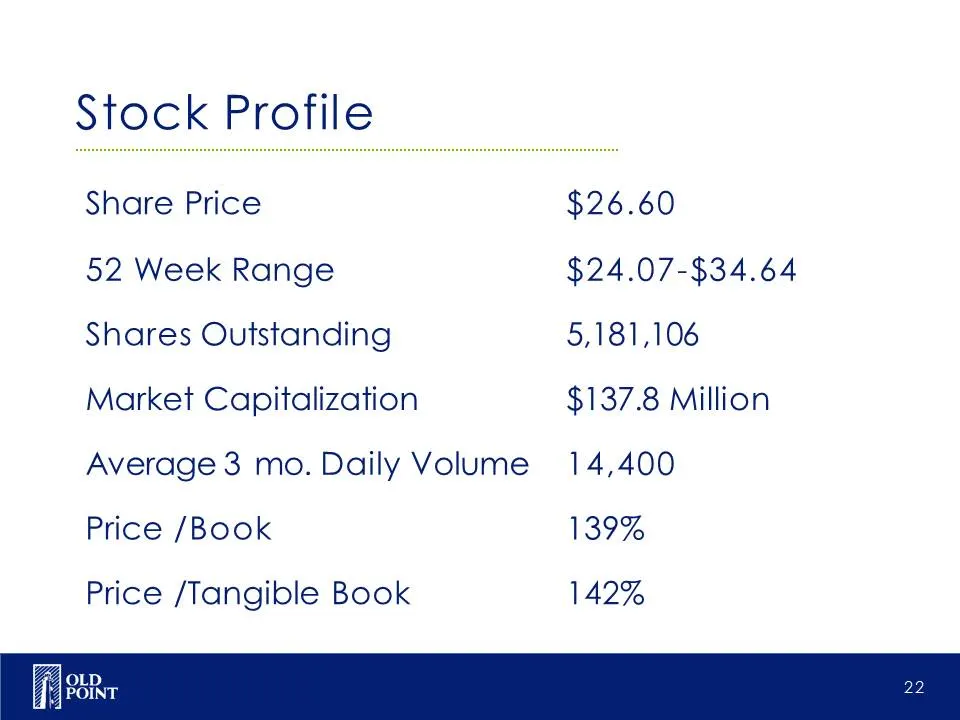
Slide 22: Stock Profile
Stock Profile Share Price 26.60 52 Week Range 24.07-$34.64 Shares Outstanding 5,181,106 Market Capitalization 137.8 Million Average 3 mo. Daily Volume 14,400 Price /Book 39% Price /Tangible Book 142%
Source: SEC EDGAR · 8-K filed Sep 10, 2018