Shyft — Spartan Motors — Investor Presentation (November 2018)
49 slides from Shyft's investor presentation, Nov 7, 2018
Slide 1: Investor Presentation November 2018
ama INVESTOR PRESENTATION COMMAND YOUR ROAD. November 2018
Slide 2: Forward Looking Statements
FORWARD LOOKING STATEMENTS This presentation contains some forward-looking statements that are not historical facts, including statements concerning our business, financial strength, future plans, objectives, and the performance of our products. These statements can be identified by words such as “b
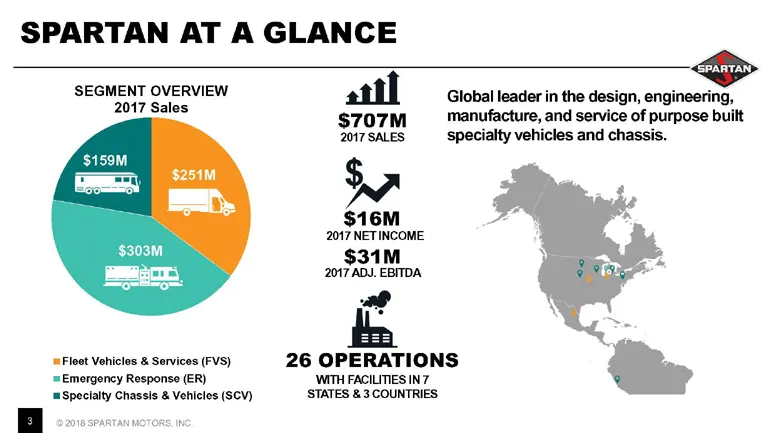
Slide 3: Spartan at a Glance
SPARTAN AT A GLANCE SEGMENT OVERVIEW 2017 Sales ‘=Floot Vehicles & Services (FVS) = Emergency Response (ER) ‘Specialty Chassis & Vehicles (SCV) atl Global leader in the design, engineering, $707M manufacture, and service of purpose built 2017 SALES Specialty vehicles and chassis. wa 6M 2017 NETINCOM
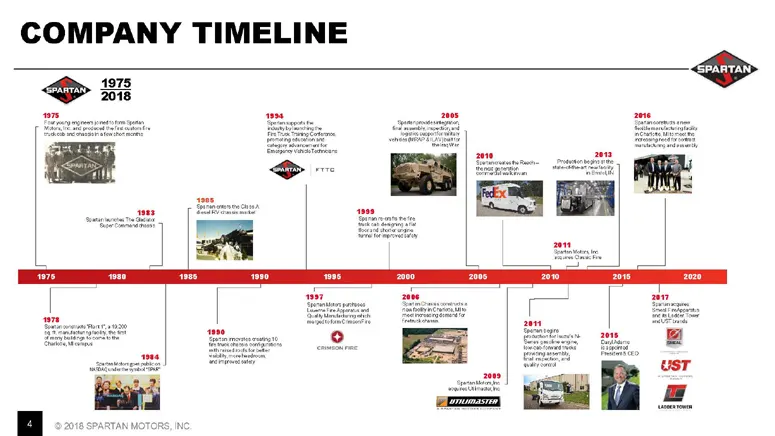
Slide 4: Company Timeline
COMPANY TIMELINE
Slide 5: Leadership Team
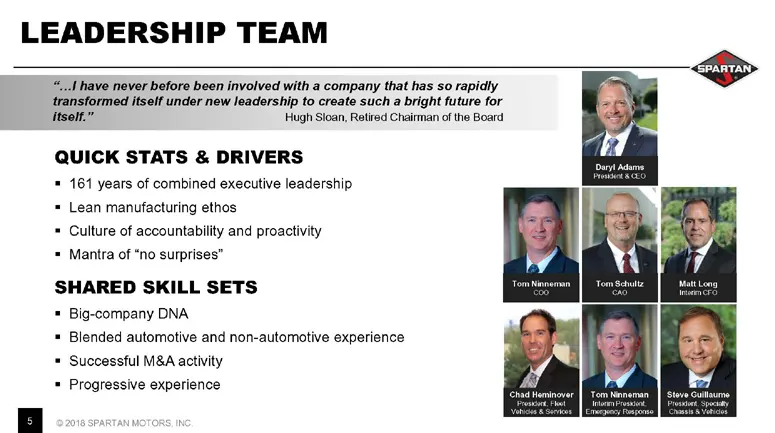
LEADERSHIP TEAM % have never before been involved with a company that has so rapidly transformed itself under new leadership to create such a bright future for itself.” Hugh Sloan, Retired Chairman of the Board QUICK STATS & DRIVERS = 161 years of combined executive leadership = Lean manufacturing e
Slide 6: Spartan Motors - Business Snapshot
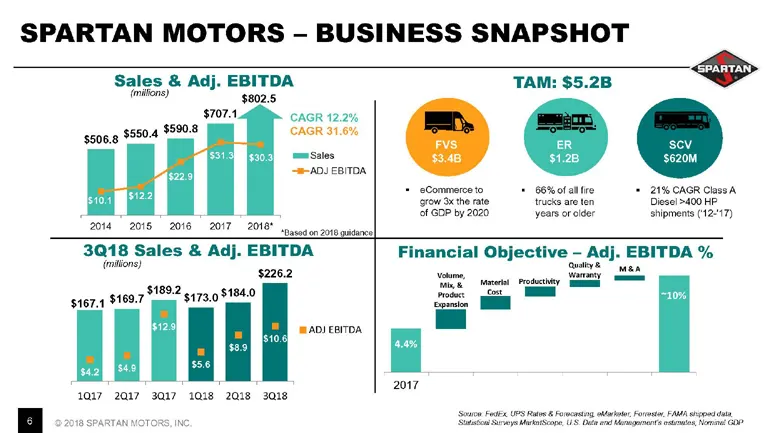
SPARTAN MOTORS - BUSINESS SNAPSHOT Sales & Adj. EBITDA TAM: $5.2B S ‘niions) $0025 CAGR 122% CAGR 31.6% smsates == ADJEBITOA + eCommerceto + «S6%ofalfre + 21%CAGR Clos A ‘row the ate tracks ae ten Diesel >400 HP OF GDP by 2020 years or elder shipments (12°17) 2014 2015 2016 2017 2018" sossrgonzoio g
Slide 7: Financial Highlights and Outlook
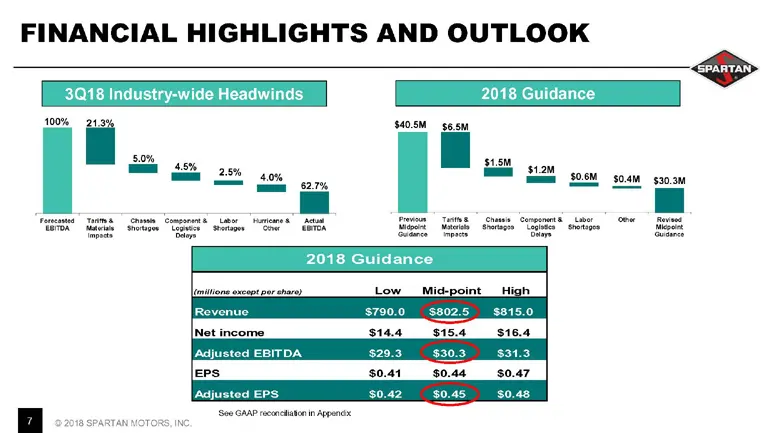
FINANCIAL HIGHLIGHTS AND OUTLOOK 2018 Guidance MOSM s55u it ot oe 2018 Guidance Revenue $790.0 $802.5 $815.0 $29.3 $30.3 $31.3 $0.41 $0.44 $0.47 $0.42 $0.45 $0.48 SPARTAN,
Slide 8: Manufacturing Improvements - Gaining Traction
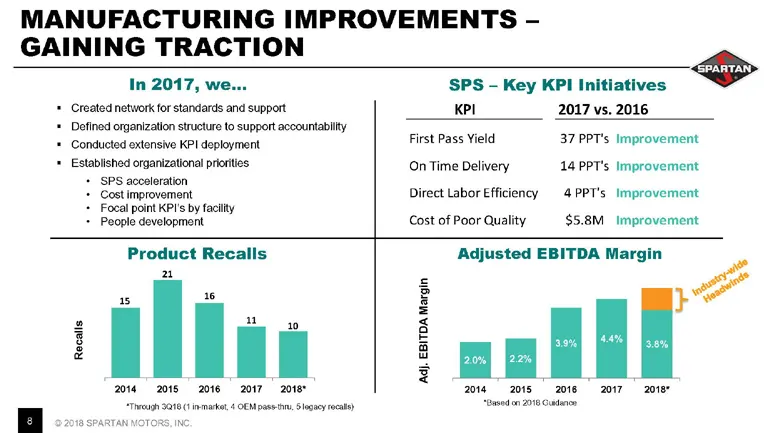
MANUFACTURING IMPROVEMENTS - GAINING TRACTION In 2017, w Created network for standards and support Defined organization structro to support accountabity Conducted extensive KP! deployment Established organizational pronties SPS acceleration Cost improvement cal point KPIs by facity Pople development
Slide 9: Fleet Vehicles & Services (FVS)
FLEET VEHICLES & SERVICES (FVS)
Slide 10: Fleet Vehicles & Services
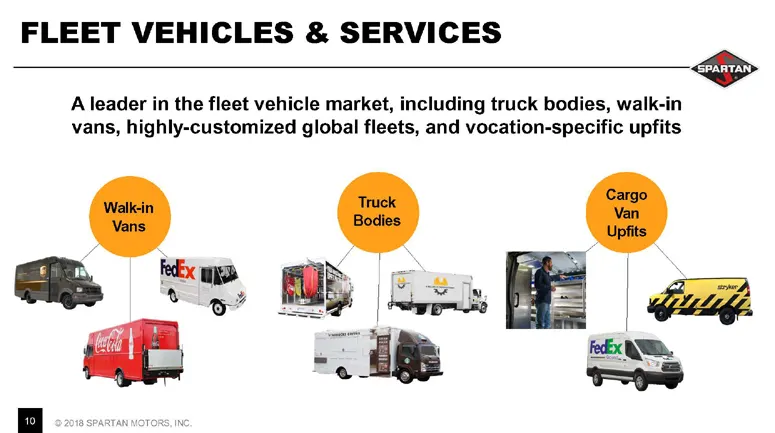
FLEET VEHICLES & SERVICES pS A leader in the fleet vehicle market, including truck bodies, walk-in vans, highly-customized global fleets, and vocation-specific upfits
Slide 11: FVS - Go-To-Market Strategy
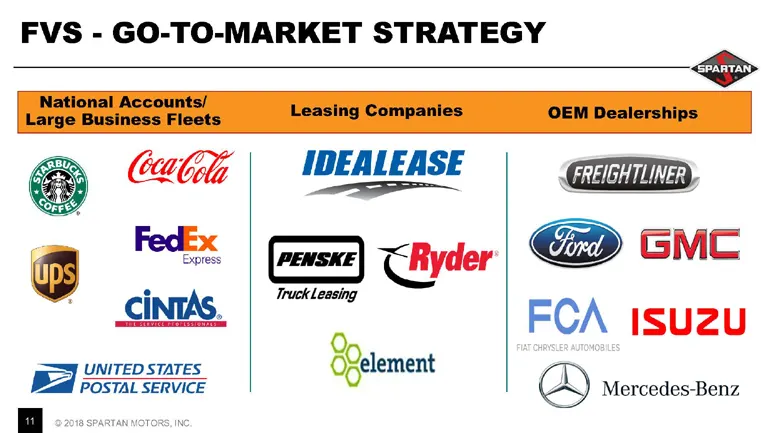
FVS - GO-TO-MARKET STRATEGY S “ungeiuiese late teasing Companies OEM Destertinn Gale; | WOEALEASE RB FREIGHTLINER} bh; Fee amar) CRyder EP GMC ° Truck Leasing Sint, FCA isuzu ‘element Ba POSTAL SERIE oO ® Mercedes-Benz
Slide 12: FVS - Business Snapshot
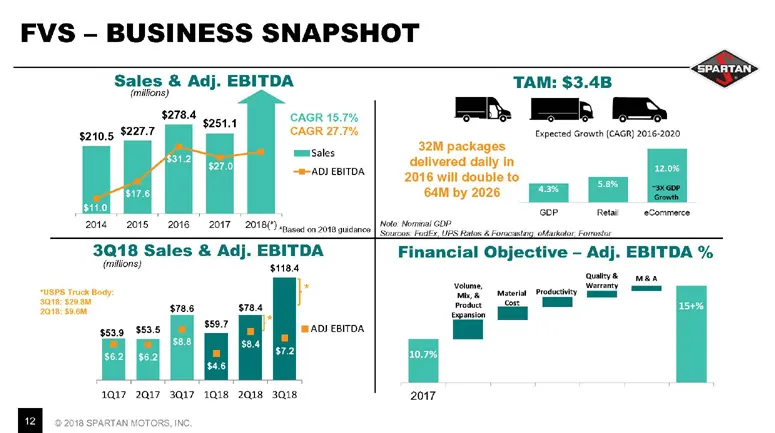
FVS - BUSINESS SNAPSHOT Sales & Adj. EBITDA TAM: $3.4B car = B= page Cepected Growth (CAGR) 20:6-2020, " 32M packages = delivered dally in SRPAGIERITON 2016 will double to 5 camby 2026 a : cP Rett eCanmrrce 2014 | 2015 | 2018 | 2017 2018 neon z018gueanon| MEO MOMEALGOP 3018. Sales & Adj. EBITDA Fina
Slide 13: FVS - Market Share
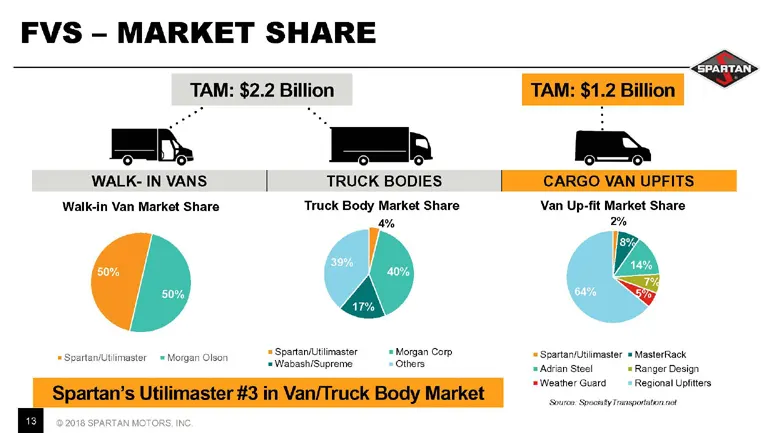
FVS - MARKET SHARE TAM: $2.2 Billion TAM: $1.2 Billion fj m=. |_| WALK- IN VANS | TRUCK BODIES Walk-in Van Market Share ‘Truck Body Market Share Van Up-fit Market Share i 2% SOikrvster hicgan Cleon SpartanUtimaster = Morgan Comp ‘= SpartayUtiimaster « MasterRack eWabebisorens _-HOthern sAdran Steel
Slide 14: FVS - Van/Truck Body & Cargo Van
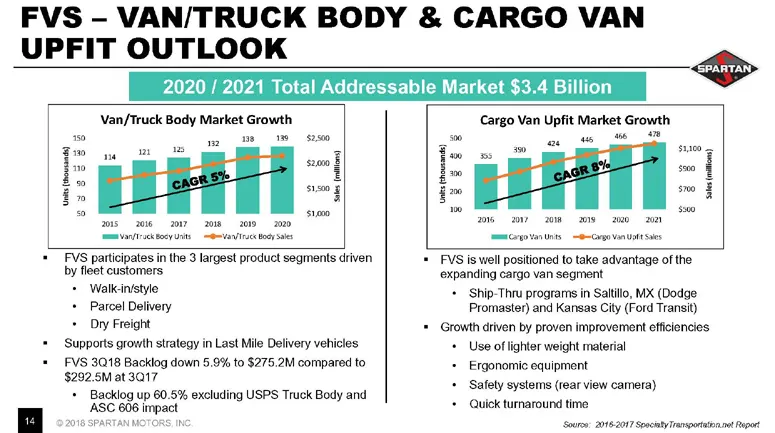
FVS - VAN/TRUCK BODY & CARGO VAN UPFIT OUTLOOK 2020 / 2021 Total Addressable Market $3.4 Billion Van/Truck Body Market Growth gm me Cargo Van Upfit Market Growth z. oe $1100 = ic vo | H H i mmo ‘+ FVS participates in the 3 largest product segments driven by fleet customers + Walkcinistyie + Parcel D
Slide 15: Fleet Growth Opportunities
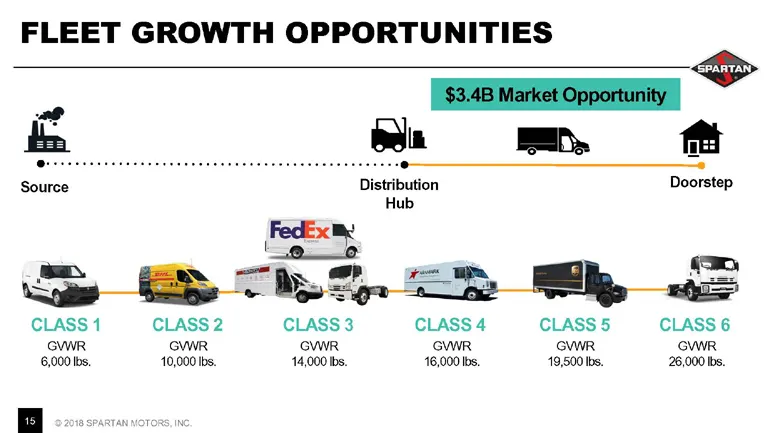
FLEET GROWTH OPPORTUNITIES pS oo = om Source Distribution Doorstep Hub FedExm ‘2 eo ae CLASS1 —CLASS2 CLASS 3 CLASS4 —— CLASS5_—sCLASS6 GVWR GVWR GVWR GVWR GVWR GWR 6,000 Ibs. 10,000 Ibs. 14,000 lbs. 16,000 Ibs. 19,500 Ibs. 26,000 Ibs.
Slide 16: FVS - Competitive Advantage
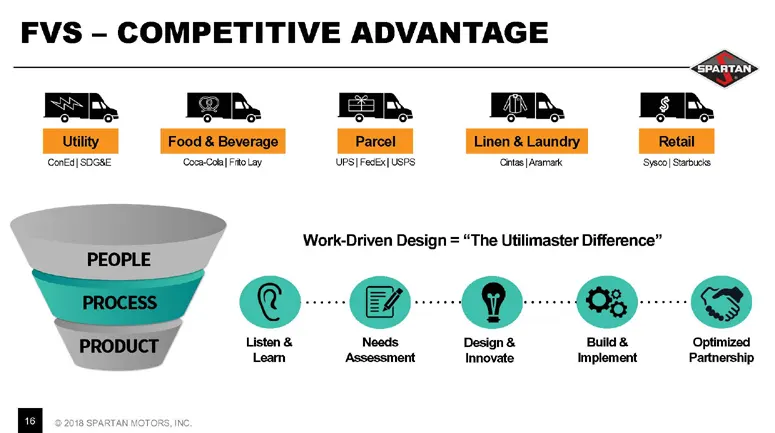
FVS - COMPETITIVE ADVANTAGE ee ae ae ae |_Uilty Food & Beverage areal | Rota (ConEd| SOGSE ‘Coral FitoLay [UPS| Fox] USPS ‘Cras |Ararark Sy8c0| Sabues
Slide 17: FVS - Building Long-Term Relationships
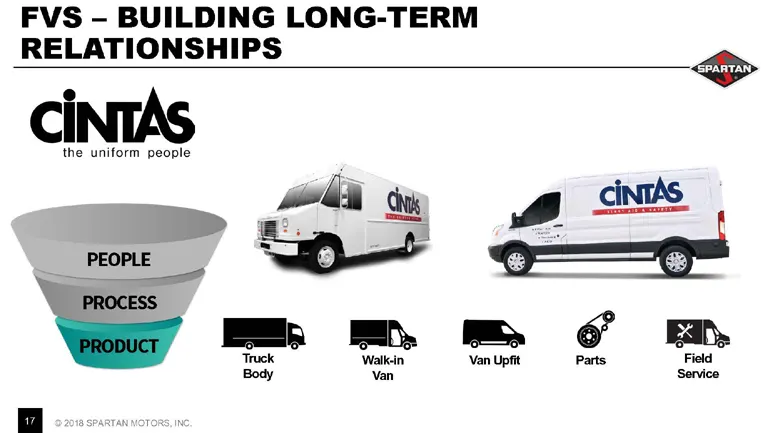
FVS - BUILDING LONG-TERM RELATIONSHIPS CiNTAS ha cintAs >» a Ta ; y eta = 9= J B PROCESS —— = 6 Em. ale wakin Van Upfit Parts Piel
Slide 18: Business Update - FVS
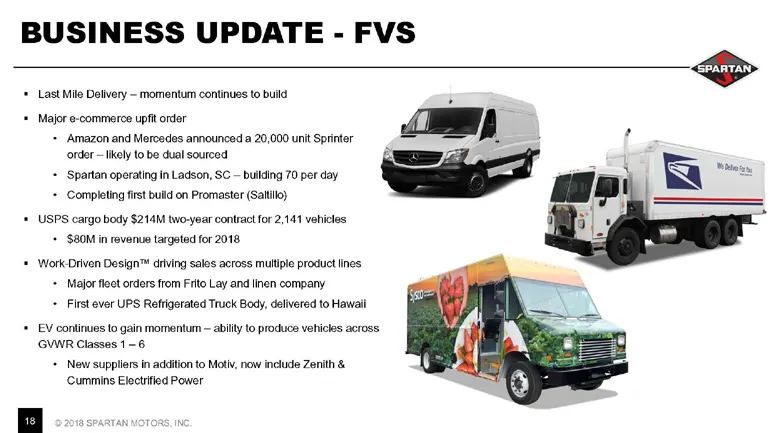
BUSINESS UPDATE - FVS pS Last Mile Delivery ~ momentum continues to build “+ Major e-commerce upfit order a__/' + Amazon and Mercedes announced a 20,000 unt Sprinter ad , ( ‘order —Ikely to be dual sourced ==. i<e = + Spartan operating in Ladson, SC — building 70 per day . 5 + Completing first build
Slide 19: Emergency Response (ER)
SPARTAN EMERGENCY RESPONSE (ER)
Slide 20: Emergency Response (ER)
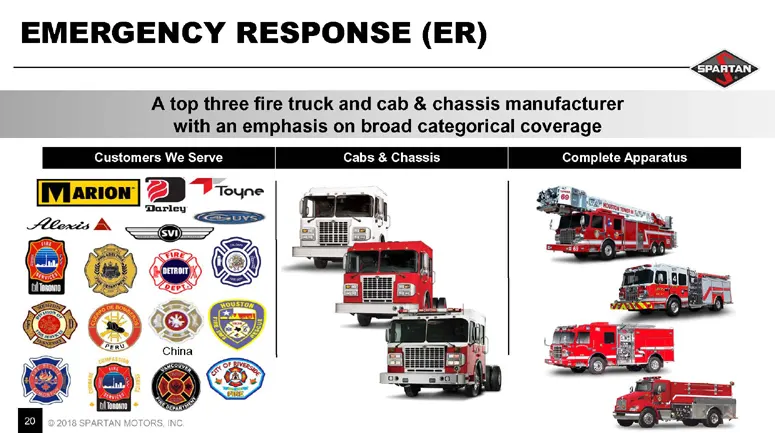
EMERGENCY RESPONSE (ER) Atop three fire truck and cab & chassis manufacturer with an emphasis on broad categorical coverage Customers We Serve Cabs & Chassis Complete Apparatus
Slide 21: ER - Business Snapshot
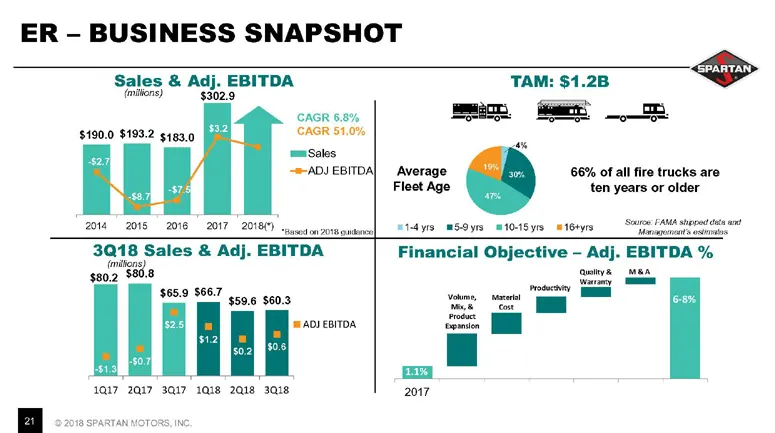
ER - BUSINESS SNAPSHOT Sales & Adj. EBITDA Late $302.9 TAM: $1.2B CAGR 68% $190.0 $193.2 s483,0 CAGR 51.0% . mSoles —™-ADJEBITDA) Average 66% of all fire trucks are f Fleet Age fen years or older 2014 2015 2016 2017 2018 eresenrortonmone] STAYS MEO YE MOIS ye mtBtyry SHER TAMA aened nant aes pales &
Slide 22: ER - Market Share
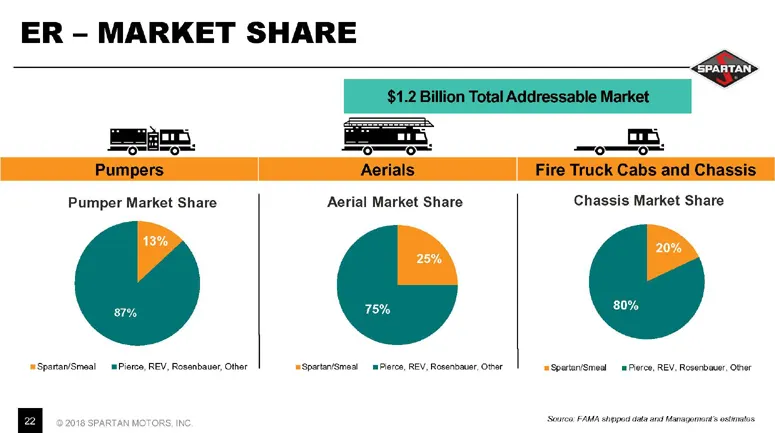
ER - MARKET SHARE i — Om. —o—o == — Pumpers Pumper Market Share Aerial Market Share Chassis Market Share “eSparan/Smaal__ sPietos REV, Rosanbaver, Other sSpanarvsmesl Peron, REV, Rowsnoawar Oar ‘sSputanSied nForce, REV, Rovecbaer, Ober
Slide 23: ER - Innovation
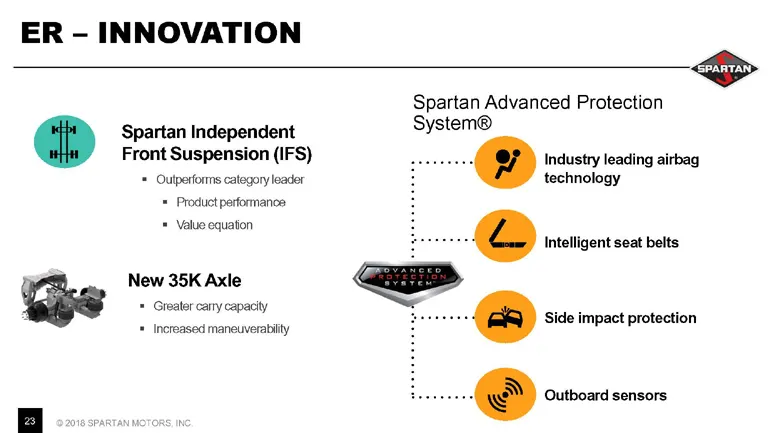
ER - INNOVATION Spartan Advanced Protection Spartan Independent System® Front Suspension (IFS) Industry leading airbag + Oulperforms category leader technology * Product performanae + Vatu equaton ne Intelligent seat belts New 35K Axle SP = Greater carn 4 reall cary copacty ee Side impact protection
Slide 24: Business Update - ER
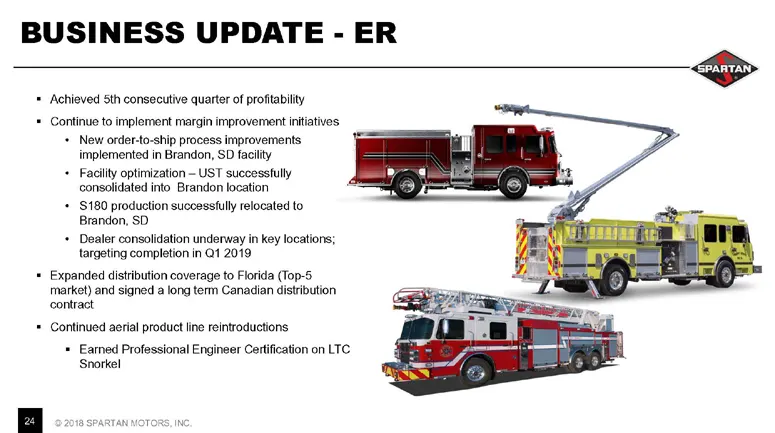
BUSINESS UPDATE - ER * Achieved Sth consecutive quarter of profitability * Continue to implement margin improvement initiatives + New order-to-ship process improvements implemented in Brandon, SD facility ‘+ Facility optimization UST successfully consolidated into Brandon location + $180 production
Slide 25: Specialty Chassis & Vehicles (SCV)
SPECIALTY CHASSIS & VEHICLES (SCV)
Slide 26: Specialty Chassis & Vehicles (SCV)
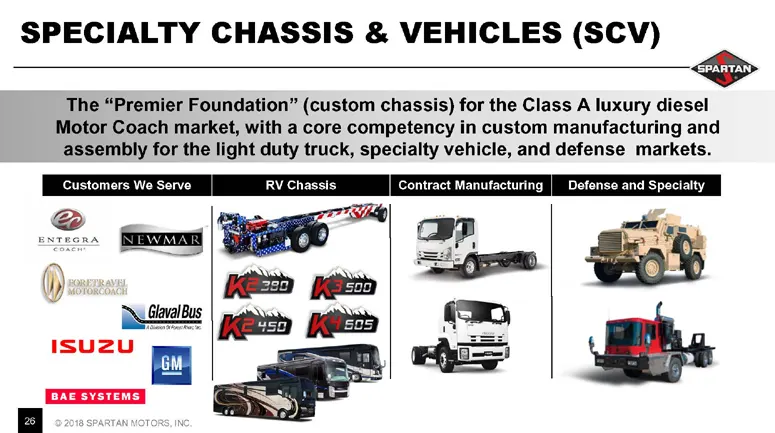
SPECIALTY CHASSIS & VEHICLES (SCV) The “Premier Foundation” (custom chassis) for the Class A luxury diesel Motor Coach market, with a core competency in custom manufacturing and assembly for the light duty truck, specialty vehicle, and defense markets. Customers We Sorve RVChassis | Contract Manufac
Slide 27: SCV - Business Snapshot
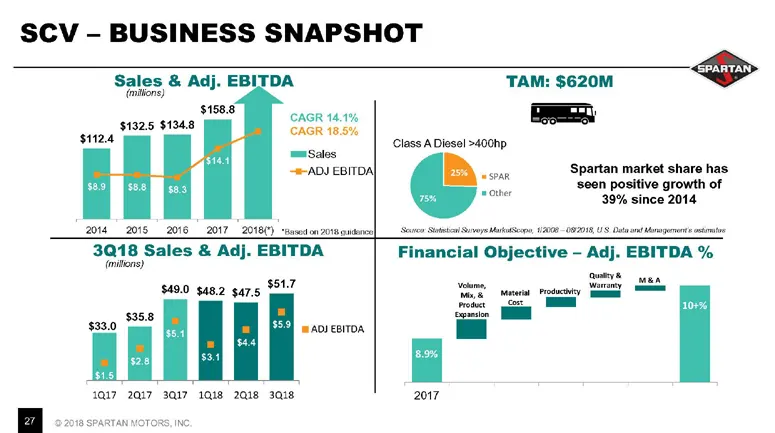
SCV - BUSINESS SNAPSHOT Sales & Adj. EBITDA ‘TAM: $620M ‘ntions) SPARTAN, $158.8 ; s1o25 $1348 CAGR 14.1% = CAGR 185% n nay Class ADiesel>400np RADI ERTION smn Spartan market share has vou ‘seen positive growth of ws 39% since 2014 Sep Stato Sipe Ml, HAE 092018 US Dann noe tiie zor 2015 2016 2017 20
Slide 28: RV Chassis - Class A Diesel
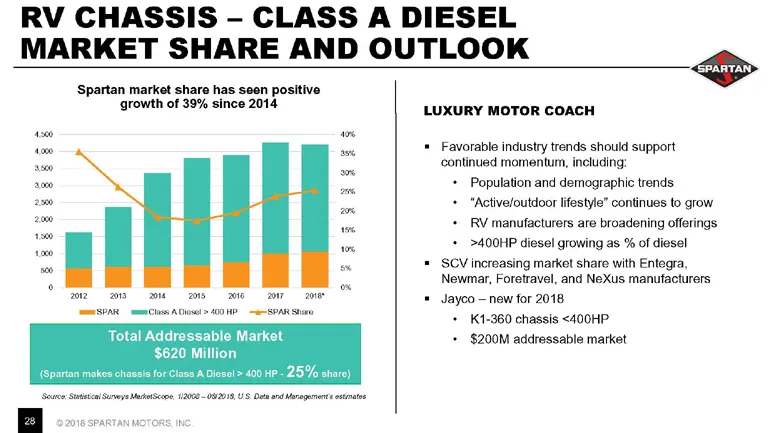
RV CHASSIS - CLASS A DIESEL MARKET SHARE AND OUTLOOK g Spartan market share has seen positive growth of 39% since 2014 LUXURY MOTOR COACH “ “ + Favorable industy trends should support we = continued momentum, including ac ~ + Population and demographic trends a 7 + “Retveloutior Hose" continues to g
Slide 29: SCV - Category Leading Innovation
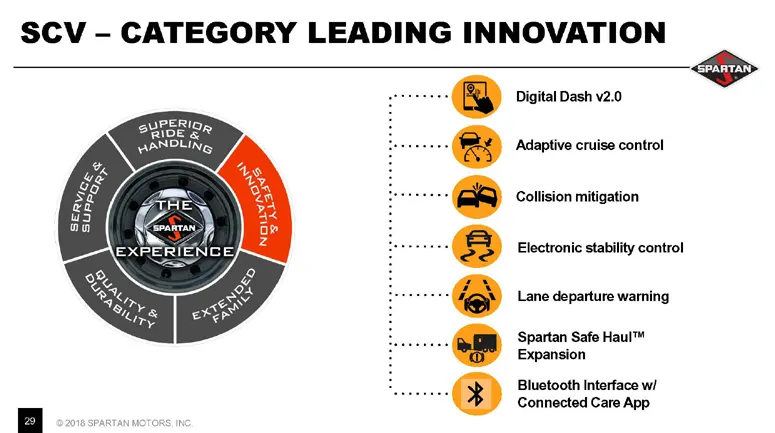
SCV - CATEGORY LEADING INNOVATION pS Digital Dash v2.0 PERI stioe a? Adaptive cruise control Collision mitigation Electronic stability control Lane departure warning Spartan Safe Haul™ Expansion Bluetooth Interface w! Connected Care App
Slide 30: SCV - First to Market Innovation
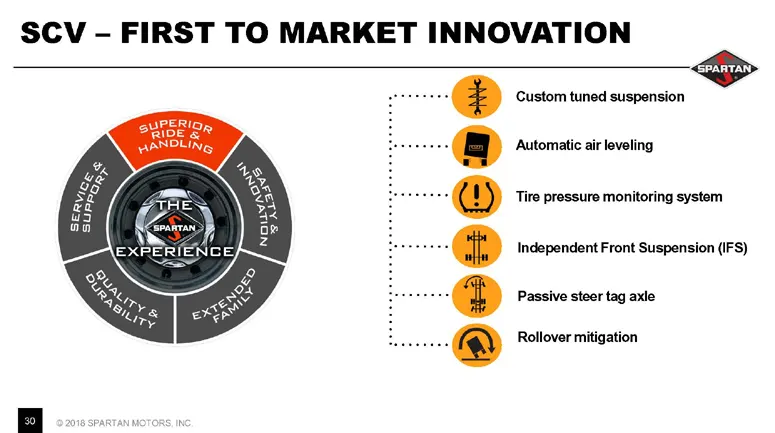
SCV - FIRST TO MARKET INNOVATION pS Custom tuned suspension PERIQ, ‘AIDE ‘Automatic air leveling Tire pressure monitoring system Independent Front Suspension (IFS) Passive steer tag axle Rollover mitigation
Slide 31: SCV - Future Innovation
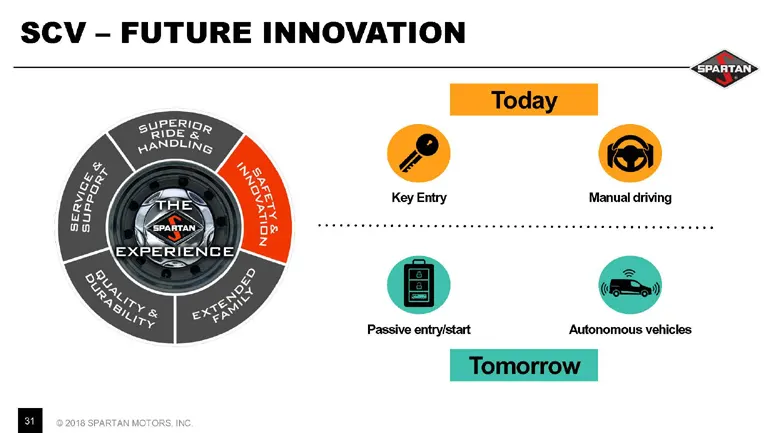
SCV - FUTURE INNOVATION Key Entry Manual driving PERI as @ cc]
Slide 32: Business Update - SCV
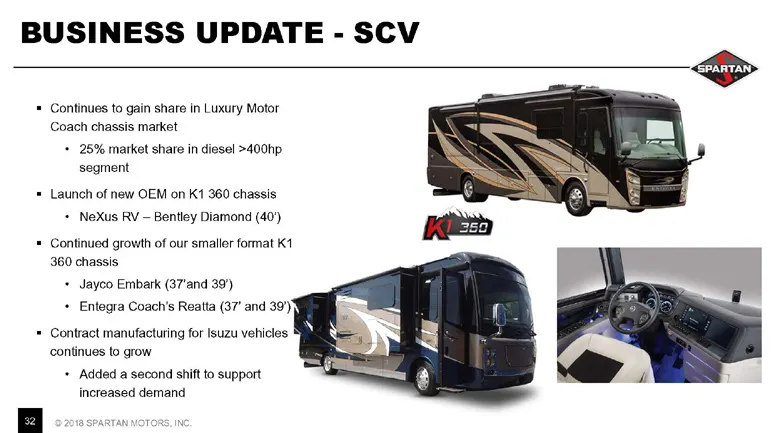
BUSINESS UPDATE - SCV Continues to gain share in Luxury Motor Coach chassis market + 25% market share in diesel >400hp segment Launch of new OEM on K1 360 chassis + NeXus RV — Bentley Diamond (40') Continued growth of our smaller format K1 360 chassis + Jayco Embark (37'and 39') + Entegra Coach's Re
Slide 33: The Path Forward
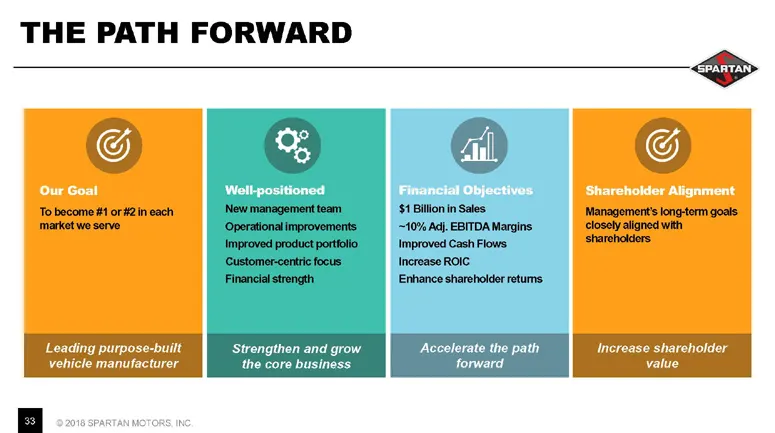
THE PATH FORWARD G Shareholder Alignment $1 Billion in Sales ~10% Adj. EBITDA Margins Improved Cash Flows Increase ROIC Enhance shareholder returns. Increase shareholder value Leading purpose-built vehicle manufacturer
Slide 34: Financial Review
SPARTAN p FINANCIAL REVIEW
Slide 35: Overview - 3Q18 vs. 3Q17
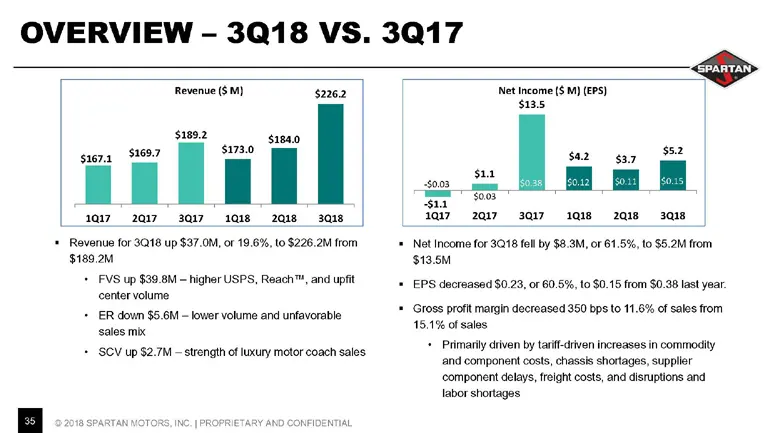
OVERVIEW - 3Q18 VS. 3017 Revenue (6) 9262 Net Income ($m) (€F5) $135 sie92 sae 3. sacra $6927 su30 saa $003 et ind $003" 101720173017 1018-218 3038 3@i7_ 20173017118 2018348, + Revenue for 3018 up $37.0M, or 19.6%, 10 $226.24 from +. Net Income for 3018 fel by $8.8M, oF 61.5%, to $5.2M from $169.2 B
Slide 36: Overview - 3Q18 vs. 3Q17
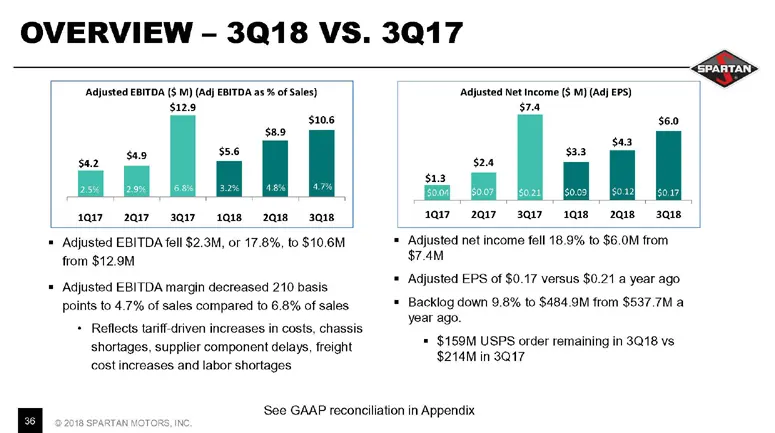
OVERVIEW - 3Q18 VS. 3017 ‘Adjusted EBITDA ($ M) (Ad) EBITDA as % of Sales) Aan nce (A 5) pS $129 $106 a al i i of l rary 3017 1018 20183018 rary 317 1018201838 = Adjusted EBITDA fell $2.3M, or 17.8%, to $10.6M Adjusted net income fell 18.9% to $6,0M from. from $12.9M = Adjusted EBITDA margin decreas
Slide 37: Fleet Vehicles & Services - 3Q18
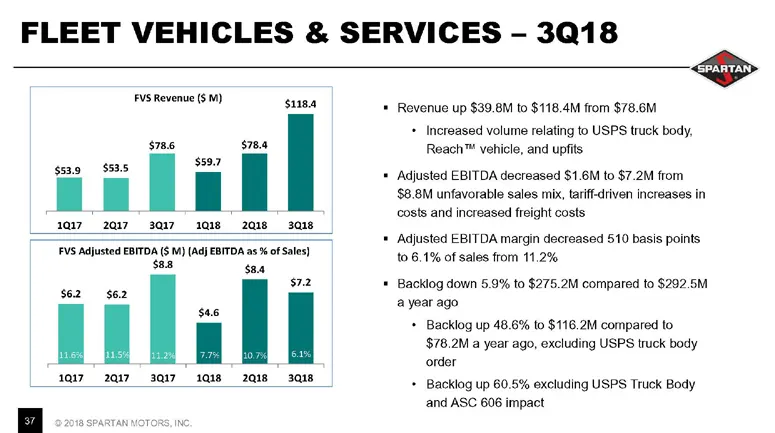
FLEET VEHICLES & SERVICES - 3Q18 FVS Revenue ($M) susa Revenue up $39,8M to $118.4M from $78.6M + Increased volume relating to USPS truck body, i738 sTan Reach™ vehicle, and upfits 3. eos, Bee sso if 101720173017 10382018 Adjusted EBITDA decreased $1.6M to $7.2M from $8.8M unfavorable sales mix, tar
Slide 38: Emergency Response - 3Q18
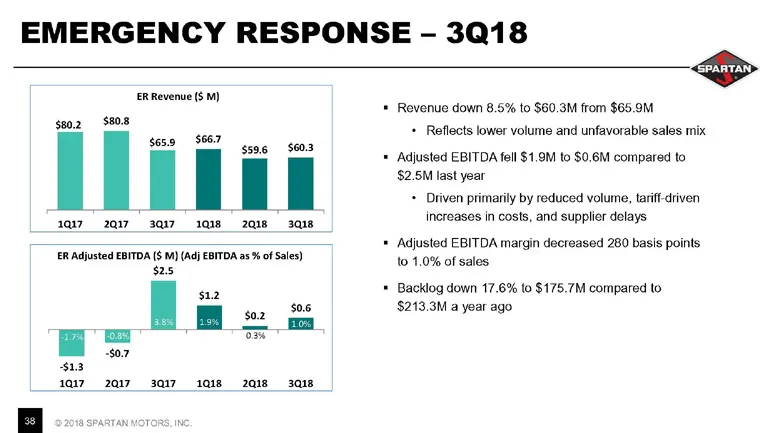
EMERGENCY RESPONSE - 3018 pS + Reflects lower volume and unfavorable sales mix $00.2 $808 $65.9 $66.7 $003 i + Adjusted EBITDA fell $1.9M to $0.6M compared to $2.5M last year + Driven primarily by reduced volume, taif-driven . tis aos Jscws eae onl sane increases in costs, and supplier delays ER Rev
Slide 39: Specialty Chassis & Vehicles - 3Q18
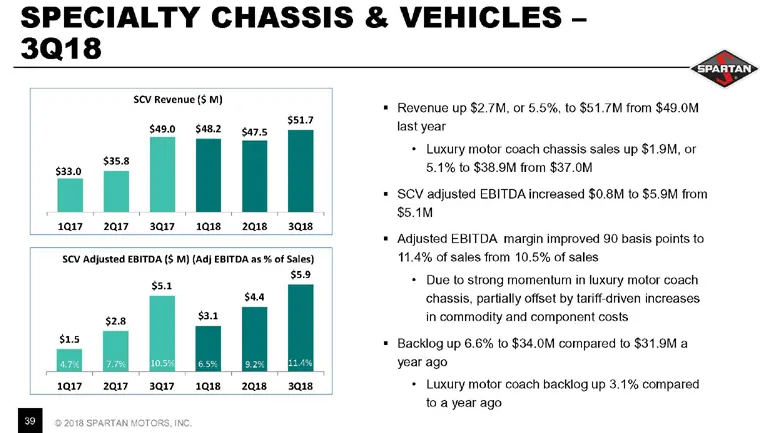
SPECIALTY CHASSIS & VEHICLES - 3Q18 SCV Revenue ($ Mi) $517 $49.0 $482 gays ii Il | I 0183018 3a17 20173017 SCV Adjusted EBITDA (5 M) (Ad EBITDA as % of Sales) $59 $51 $28 $15 saa a [ one | 10172017 30171018 2018 3018 Revenue up $2.7M, of 5.5%, to $51.7M from $49.0M last year + Luxury motor coach ch
Slide 40: Balance Sheet - 3Q18
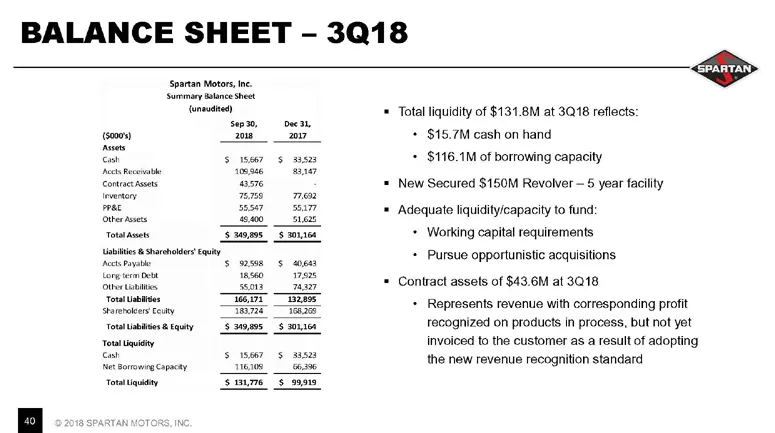
BALANCE SHEET - 3018 Spartan Motors, Ine {unnaed) (so005) aos ao sbi @ Sareeldr Eauty S sco7 § sass Toraigaey sau Total liquidity of $131.8M at 3018 reflects: + $15.7M cash on hand + $116.1M of borrowing capacity New Secured $150M Revolver ~ 5 year facility Adequate liquidity/capacity to fund: + Wor
Slide 41: Appendix
APPENDIX
Slide 42: Reconciliation of Non-GAAP Financial Measures
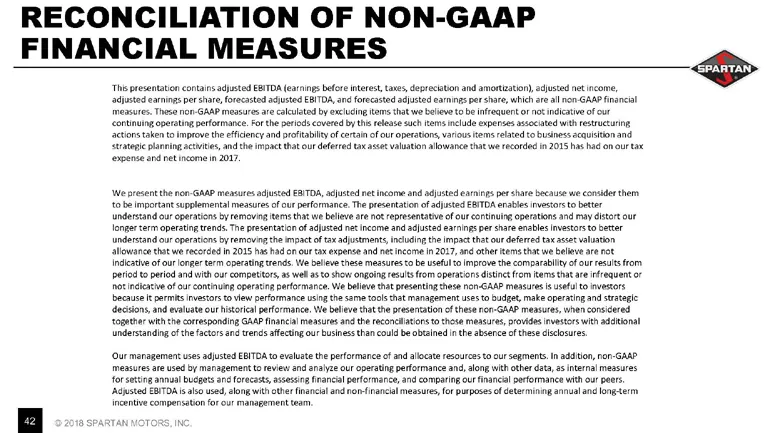
RECONCILIATION OF NON-GAAP FINANCIAL MEASURES “This presentation contain adjusted EBITDA (earnings before teres, tas deprecson and amortization) adjusted net income, acjtted earings per share, forested asjusted EBITDA, an forecasted aluted earnings per share, which ae all non GAAP financial menses.
Slide 43: Reconciliation of Non-GAAP Financial Measures
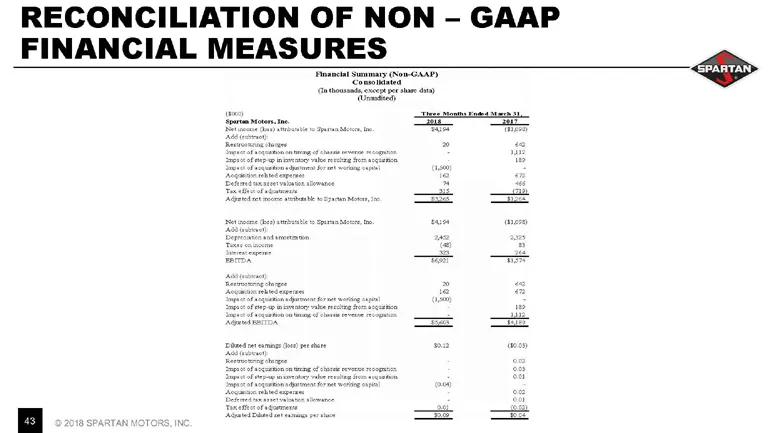
RECONCILIATION OF NON - GAAP FINANCIAL MEASURES
Slide 44: Reconciliation of Non-GAAP Financial Measures
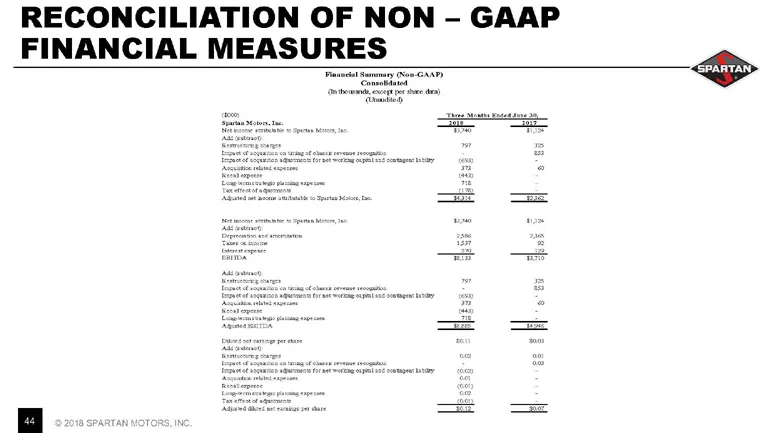
RECONCILIATION OF NON - GAAP FINANCIAL MEASURES
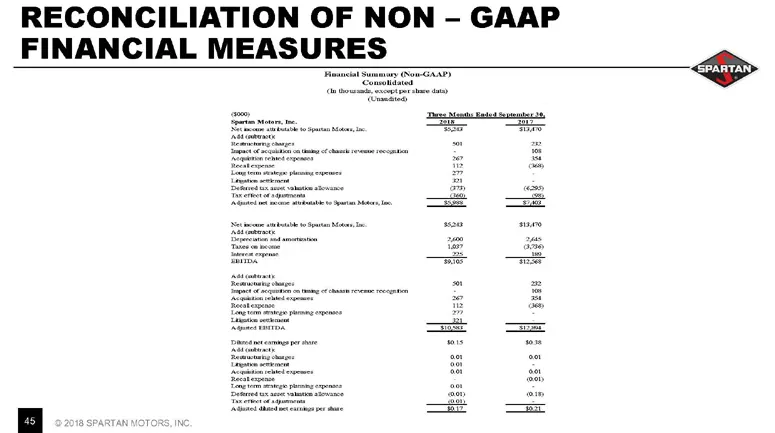
Slide 45: Reconciliation of Non-GAAP Financial Measures
RECONCILIATION OF NON - GAAP FINANCIAL MEASURES
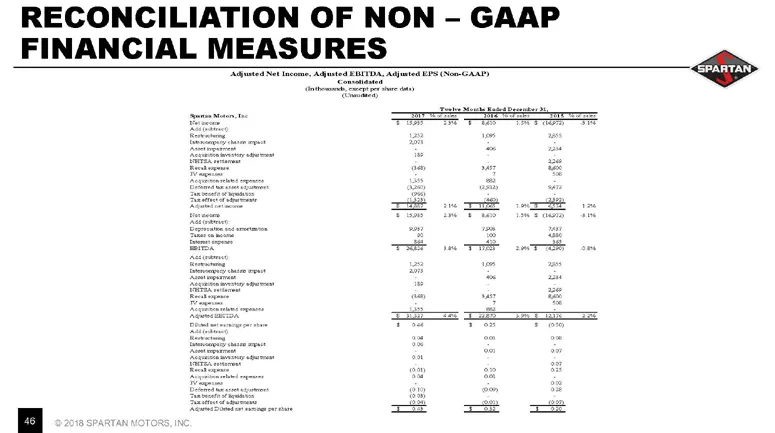
Slide 46: Reconciliation of Non-GAAP Financial Measures
RECONCILIATION OF NON - GAAP FINANCIAL MEASURES
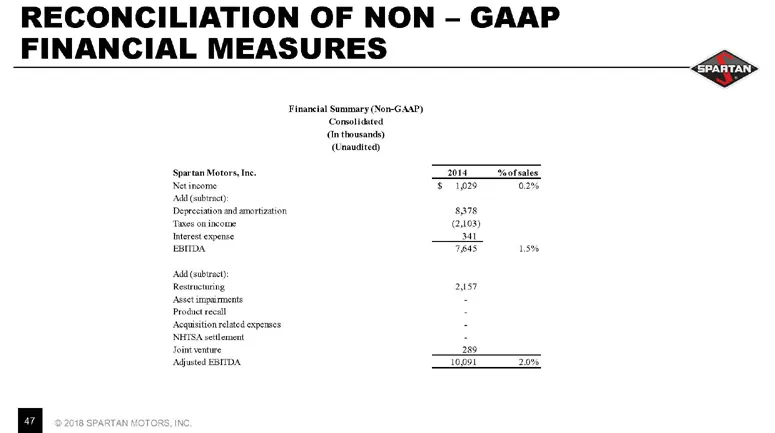
Slide 47: Reconciliation of Non-GAAP Financial Measures
RECONCILIATION OF NON - GAAP FINANCIAL MEASURES Th GAAP)
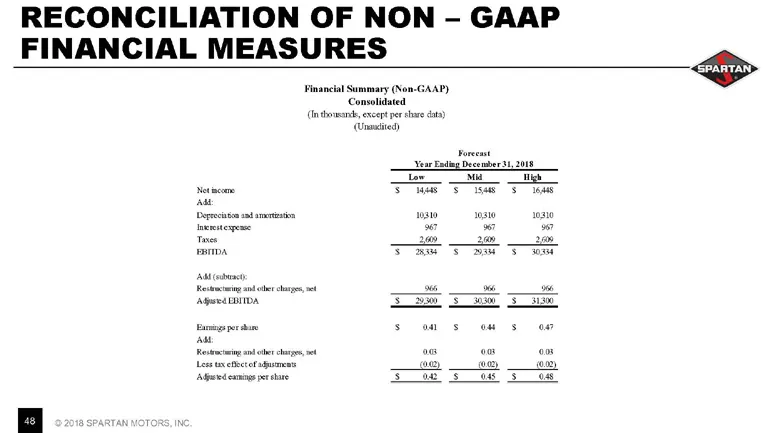
Slide 48: Reconciliation of Non-GAAP Financial Measures
RECONCILIATION OF NON - GAAP FINANCIAL MEASURES
Slide 49: For More Information
FOR MORE INFORMATION: ‘SPARTAN MOTORS, INC. JURIS PAGRABS GROUP TREASURER & DIRECTOR OF INVESTOR RELATIONS 517.997.3842 SPARTANMOTORS.COM
Source: SEC EDGAR · 8-K filed Nov 7, 2018
More decks from Shyft Group Inc
 Merger or Acquisition (April 2025)37 slides · Apr 29, 2025
 Q1 2025 Earnings Presentation18 slides · Apr 24, 2025
 Merger or Acquisition (April 2025)21 slides · Apr 4, 2025
 Q4 2024 Earnings Presentation17 slides · Feb 20, 2025
 Merger or Acquisition (January 2025)50 slides · Jan 13, 2025
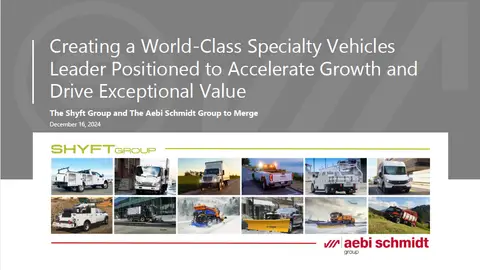 Merger or Acquisition (December 2024)22 slides · Dec 16, 2024