Atlantic Capital Bancshares Inc
Atlantic Capital Bancshares — Investor Presentation (March 2017)
29 slides from Atlantic Capital Bancshares's investor presentation, Mar 20, 2017
Slide 1: Atlantic Capital Bancshares, Inc. (ACBI) Presentation to Investments Unlimited
Atlantic Capital Bancshares, Inc. (ACBI) Presentation to Investments Unlimited March 20, 2017
Slide 2: Forward-Looking Statements
Forward-Looking Statements This presentation contains forward-looking statements within the meaning of section 27A of the Securities Act of 1933, as amended, and section 21E of the Securities Exchange Act of 1934, as amended. These forward-looking statements reflect our current views with respect to
Slide 3: Non-GAAP Financial Information
Non-GAAP Financial Information Statements included in this presentation include non-GAAP financial measures and should be read long with the accompanying tables, which provide a reconciliation of non-GAAP financial measures to GAAP financial measures. Atlantic Capital management uses non-GAAP financ
Slide 4: Atlantic Capital Bank: Our Story
• Established in May 2007 with $125 million in equity capital, which was, and still is, the largest de novo bank capital raise in US history • Publicly traded on NASDAQ since November 2nd, 2015, under the symbol “ACBI” • Exceptional record of soundness and growth through financial crisis, recession
Slide 5: Atlantic Capital Bank: Highlights
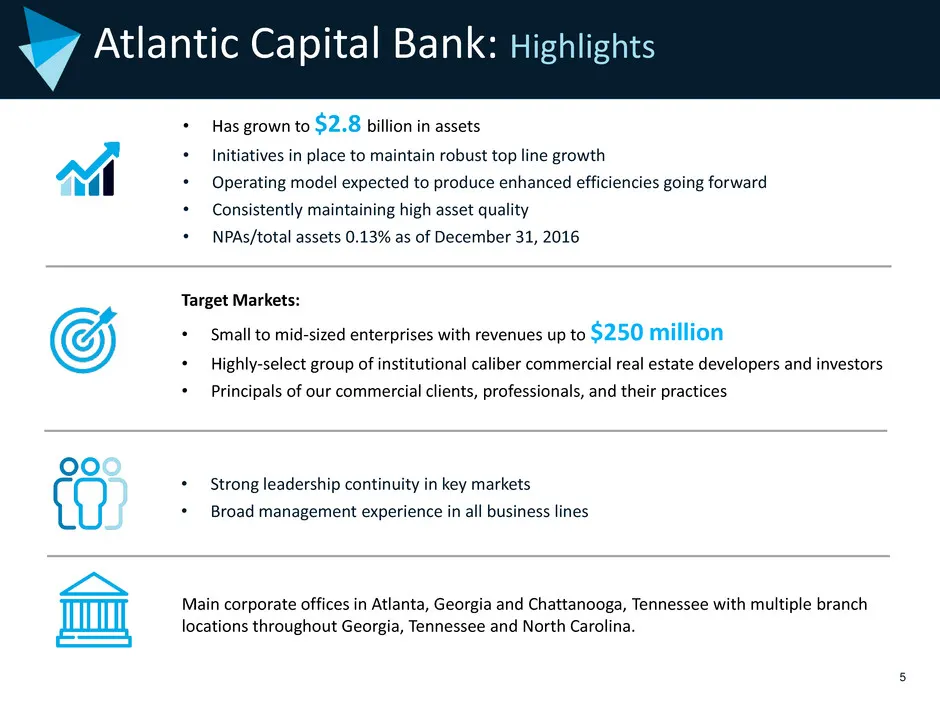
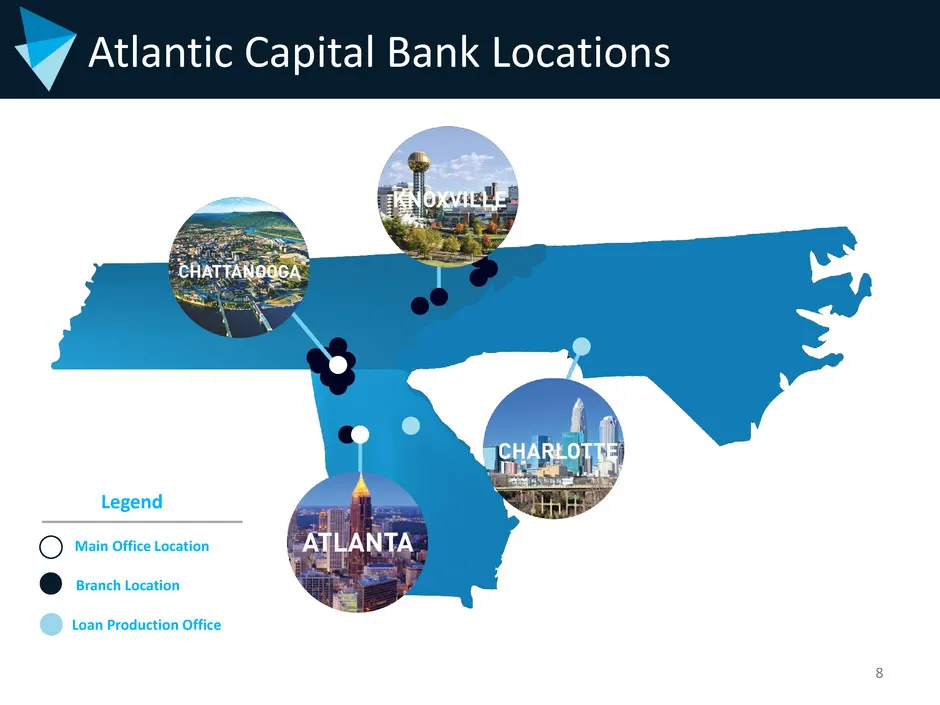
Atlantic Capital Bank: Highlights 5 Target Markets: • Small to mid-sized enterprises with revenues up to $250 million • Highly-select group of institutional caliber commercial real estate developers and investors • Principals of our commercial clients, professionals, and their practices • Has grown
Slide 6: Atlantic Capital Strategy
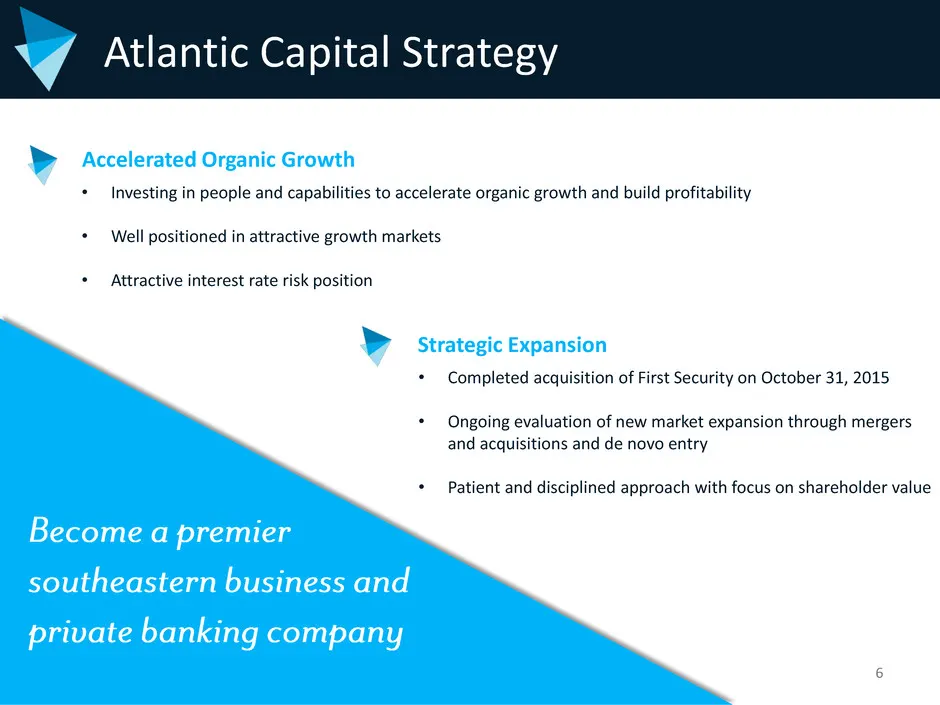
Proprietary & Confidential Atlantic Capital Strategy 6 Accelerated Organic Growth • Investing in people and capabilities to accelerate organic growth and build profitability • Well positioned in attractive growth markets • Attractive interest rate risk position Strategic Expansion • Completed acquis
Slide 7: Key Investment Considerations
7 Key Investment Considerations Attractive Growth Markets Strong Deposit Growth Asset Sensitivity Loan Growth with Superior Credit Quality
Slide 8: Atlantic Capital Bank Locations
Atlantic Capital Bank Locations 8 Branch Location Loan Production Office Main Office Location Legend
Slide 9: Attractive Market Demographics
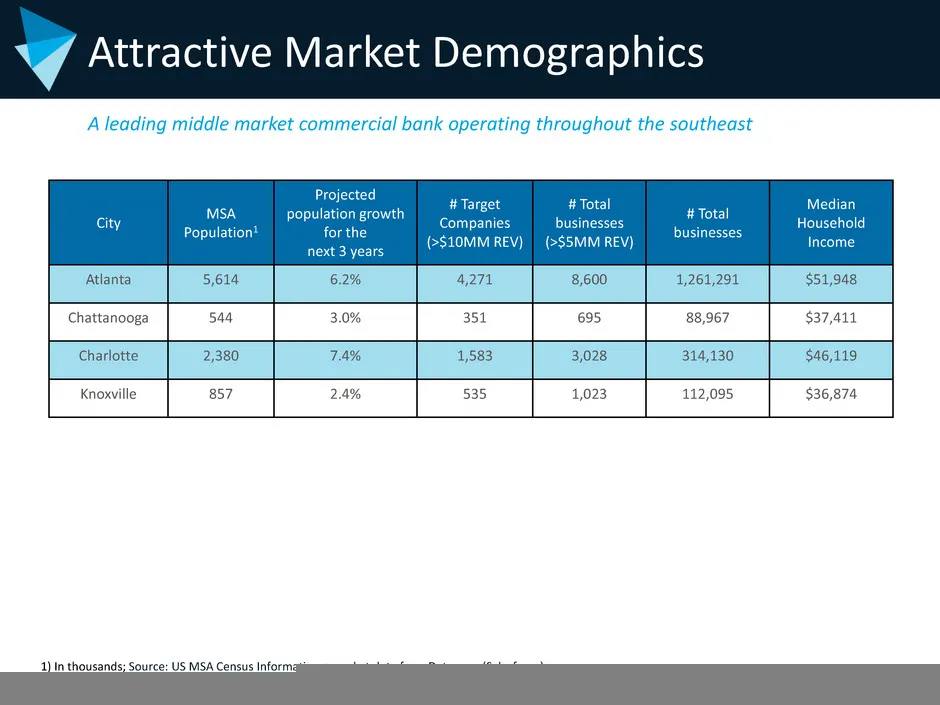
A leading middle market commercial bank operating throughout the southeast Attractive Market Demographics 1) In thousands; Source: US MSA Census Information + market data from Data.com (Salesforce). 9 City MSA Population1 Projected population growth for the next 3 years # Target Companies (>$10MM RE
Slide 10: Financial Highlights: Deposit Growth
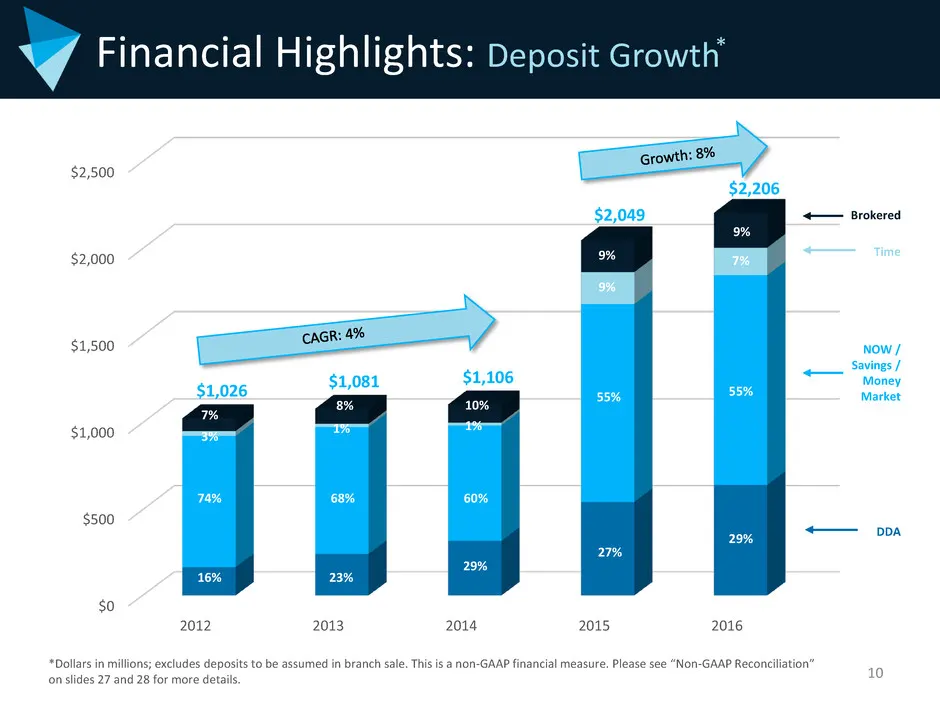
$0 $500 $1,000 $1,500 $2,000 $2,500 2012 2013 2014 2015 2016 10 Financial Highlights: Deposit Growth *Dollars in millions; excludes deposits to be assumed in branch sale. This is a non-GAAP financial measure. Please see “Non-GAAP Reconciliation” on slides 27 and 28 for more details. DDA NOW / Saving
Slide 11: Financial Highlights: Deposits
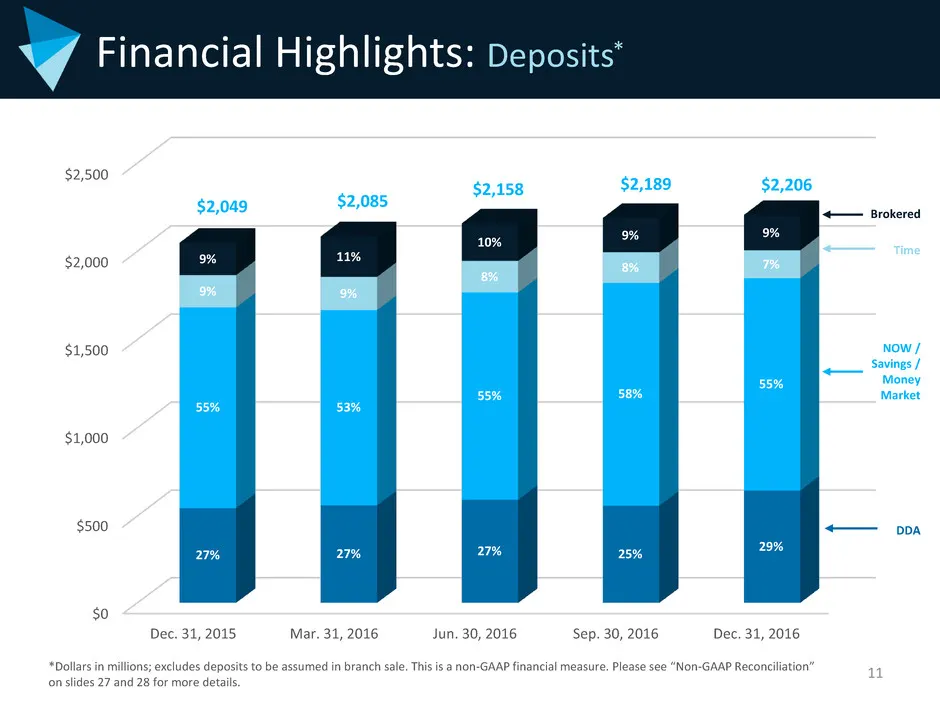
11 Financial Highlights: Deposits *Dollars in millions; excludes deposits to be assumed in branch sale. This is a non-GAAP financial measure. Please see “Non-GAAP Reconciliation” on slides 27 and 28 for more details. $0 $500 $1,000 $1,500 $2,000 $2,500 Dec. 31, 2015 Mar. 31, 2016 Jun. 30, 2016 Sep.
Slide 12: Taxable Equivalent Net Interest Income & Margin
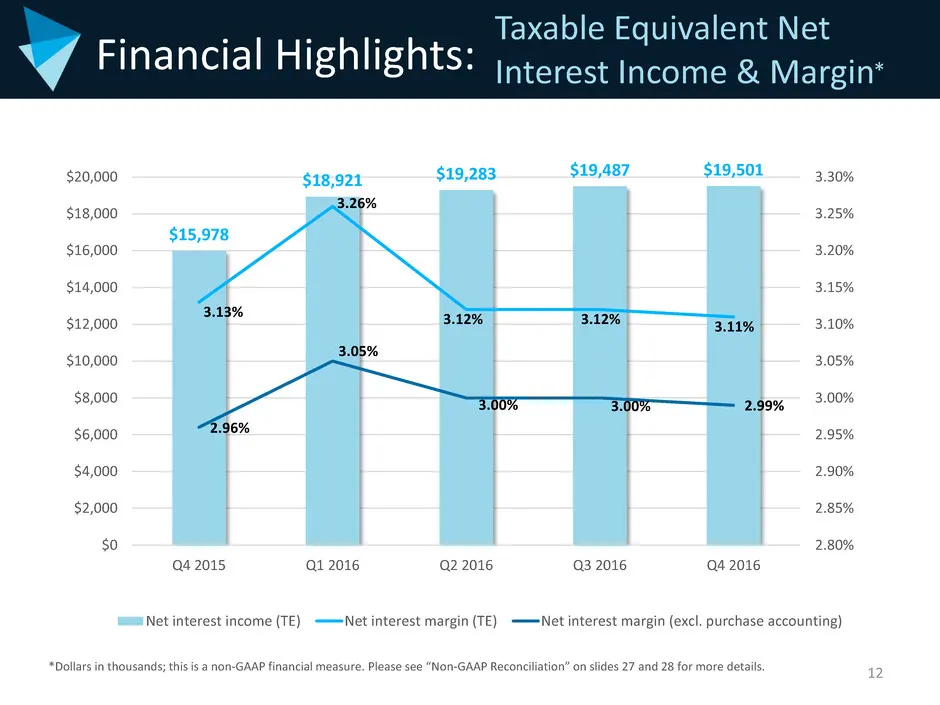
12 Financial Highlights: $15,978 $18,921 $19,283 $19,487 $19,501 3.13% 3.26% 3.12% 3.12% 3.11% 2.96% 3.05% 3.00% 3.00% 2.99% 2.80% 2.85% 2.90% 2.95% 3.00% 3.05% 3.10% 3.15% 3.20% 3.25% 3.30% $0 $2,000 $4,000 $6,000 $8,000 $10,000 $12,000 $14,000 $16,000 $18,000 $20,000 Q4 2015 Q1 2016 Q2 2016 Q3 201
Slide 13: Financial Highlights: Asset Sensitivity
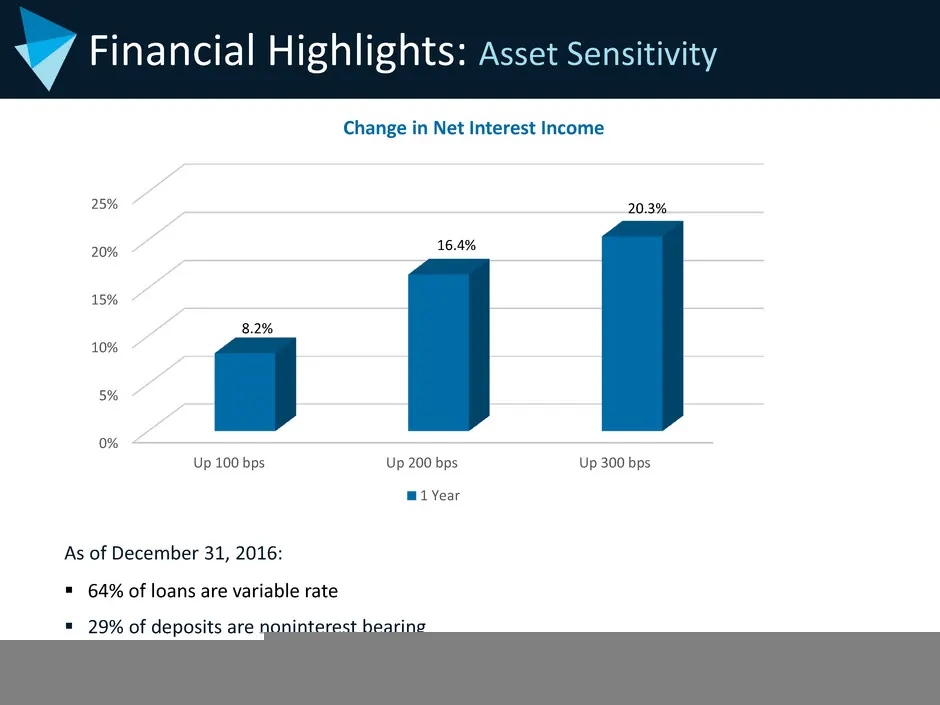
Financial Highlights: Asset Sensitivity Change in Net Interest Income 13 0% 5% 10% 15% 20% 25% Up 100 bps Up 200 bps Up 300 bps 8.2% 16.4% 20.3% 1 Year As of December 31, 2016: 64% of loans are variable rate 29% of deposits are noninterest bearing
Slide 14: Financial Highlights: Total Loan Growth
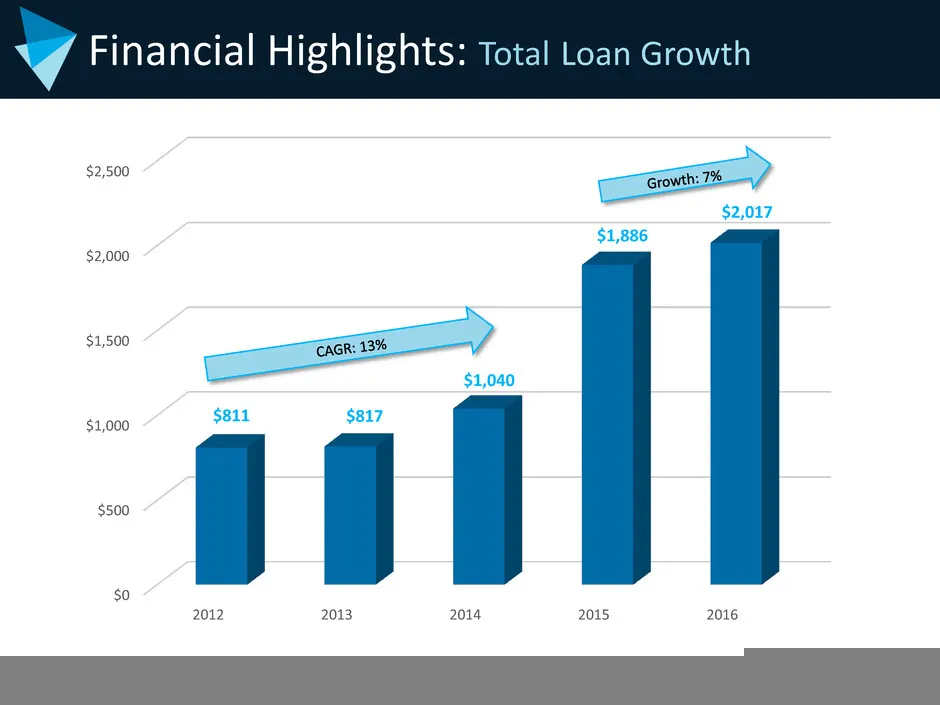
Financial Highlights: Total Loan Growth 14 $0 $500 $1,000 $1,500 $2,000 $2,500 2012 2013 2014 2015 2016 $811 $817 $1,040 $1,886 $2,017
Slide 15: Financial Highlights: Loans Held for Investment
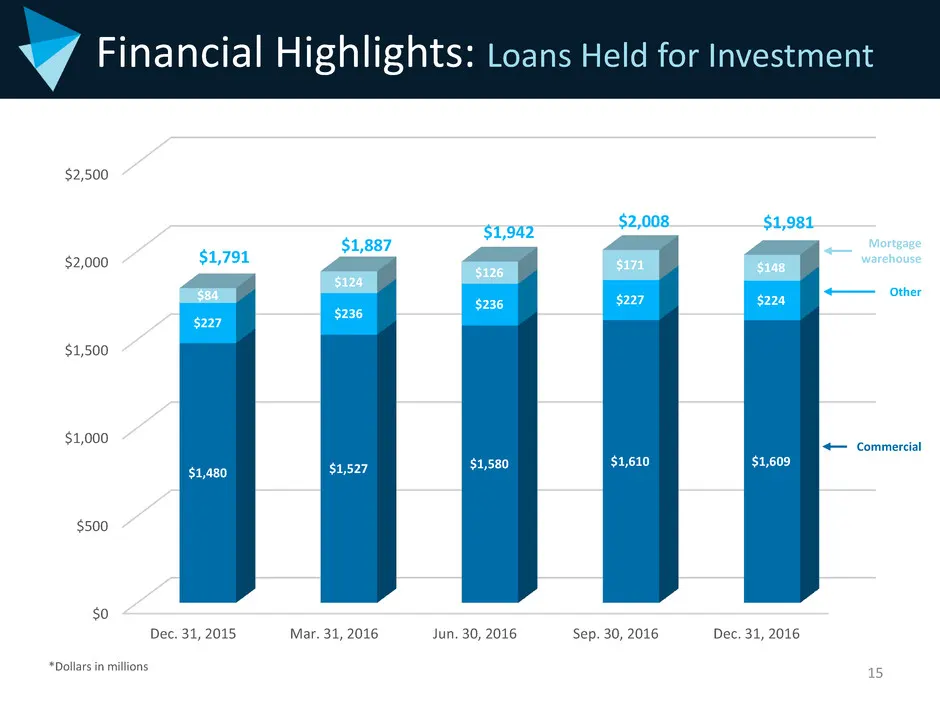
15 Financial Highlights: Loans Held for Investment *Dollars in millions $0 $500 $1,000 $1,500 $2,000 $2,500 Dec. 31, 2015 Mar. 31, 2016 Jun. 30, 2016 Sep. 30, 2016 Dec. 31, 2016 $1,480 $1,527 $1,580 $1,610 $1,609 $227 $236 $236 $227 $224 $84 $124 $126 $171 $148 $1,791 $1,887 $1,942 $2,008 $1,981 Com
Slide 16: Financial Highlights: Credit Quality
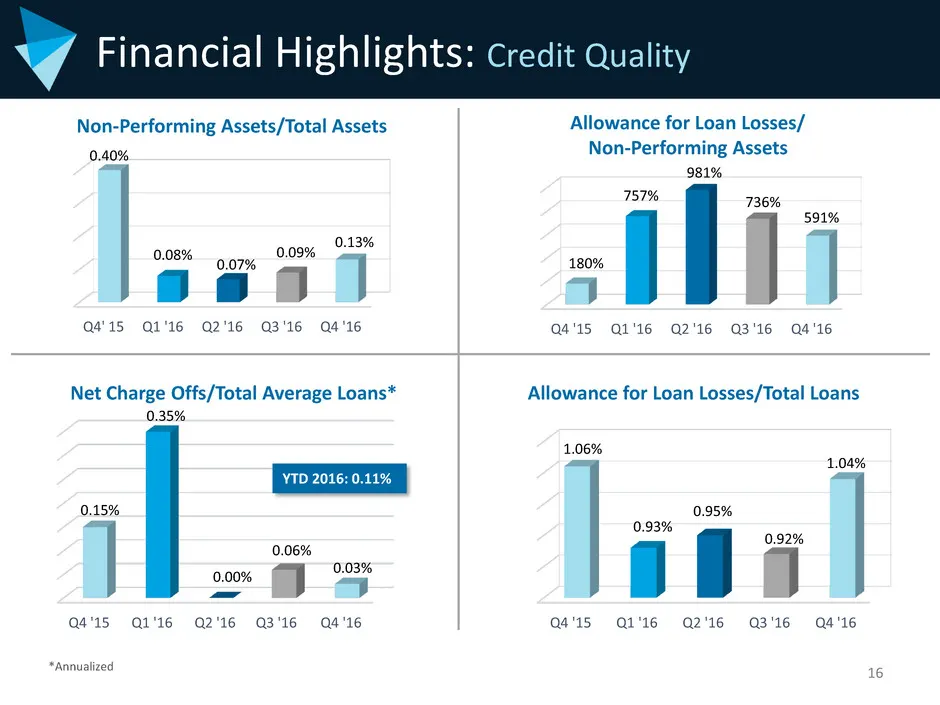
Financial Highlights: Credit Quality 16 Q4' 15 Q1 '16 Q2 '16 Q3 '16 Q4 '16 0.40% 0.08% 0.07% 0.09% 0.13% Allowance for Loan Losses/ Non-Performing Assets Q4 '15 Q1 '16 Q2 '16 Q3 '16 Q4 '16 180% 757% 981% 736% 591% Net Charge Offs/Total Average Loans* Allowance for Loan Losses/Total Loans Q4 '15 Q1 '
Slide 17: Financial Highlights
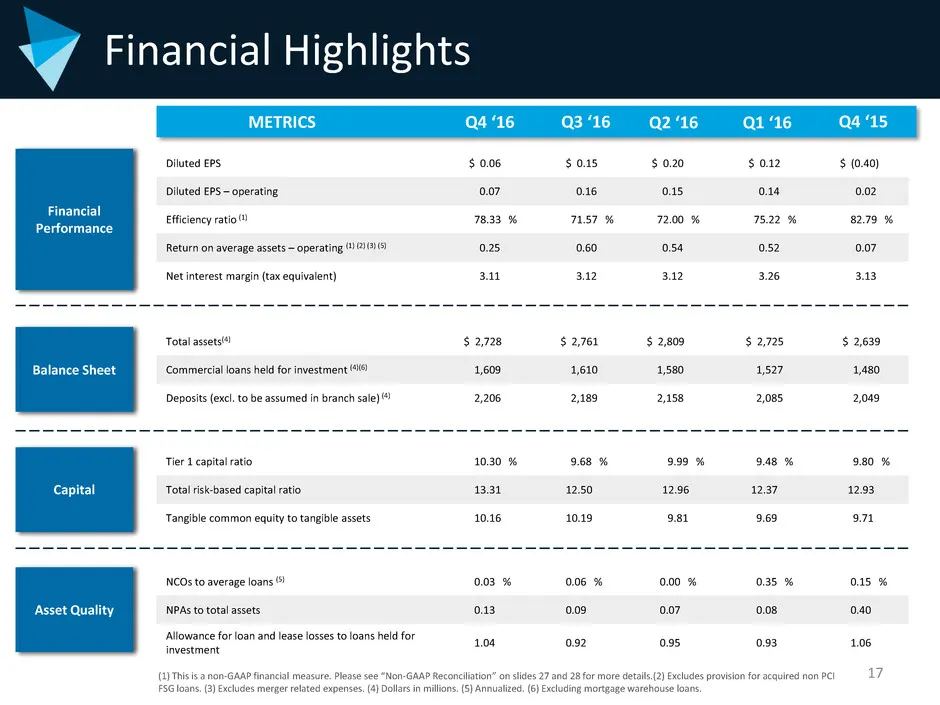
17 Financial Highlights Financial Performance Balance Sheet Capital Asset Quality Diluted EPS $ 0.06 $ 0.15 $ 0.20 $ 0.12 $ (0.40) Diluted EPS – operating 0.07 0.16 0.15 0.14 0.02 Efficiency ratio (1) 78.33 % 71.57 % 72.00 % 75.22 % 82.79 % Return on average assets – operating (1) (2) (3) (5) 0.25 0
Slide 18: Financial Highlights: Noninterest Income
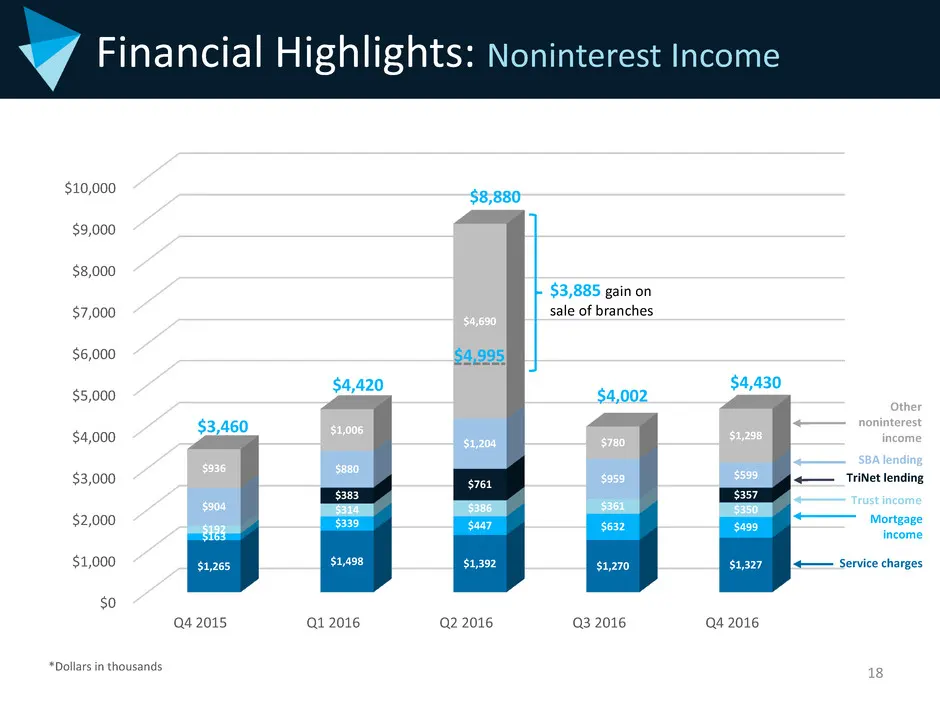
$0 $1,000 $2,000 $3,000 $4,000 $5,000 $6,000 $7,000 $8,000 $9,000 $10,000 Q4 2015 Q1 2016 Q2 2016 Q3 2016 Q4 2016 $1,265 $1,498 $1,392 $1,270 $1,327 $163 $339 $447 $632 $499 $192 $314 $386 $361 $350 $383 $761 $357 $904 $880 $1,204 $959 $599 $936 $1,006 $4,690 $780 $1,298 $4,420 $8,880 $4,002 $4,430
Slide 19: Financial Highlights: Operating Noninterest Expense
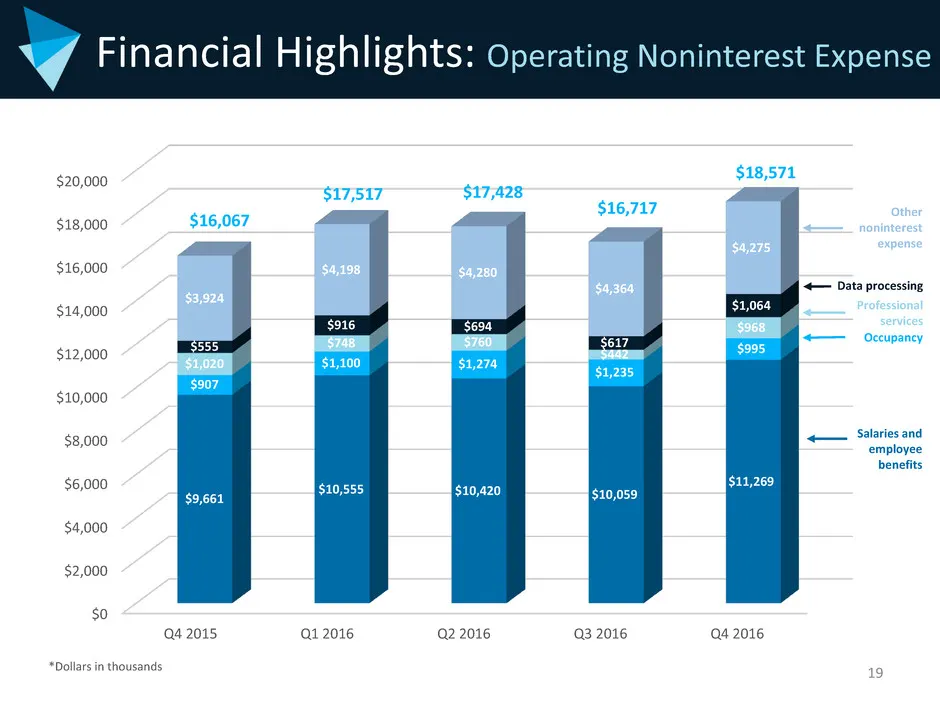
19 $0 $2,000 $4,000 $6,000 $8,000 $10,000 $12,000 $14,000 $16,000 $18,000 $20,000 Q4 2015 Q1 2016 Q2 2016 Q3 2016 Q4 2016 $9,661 $10,555 $10,420 $10,059 $11,269 $907 $1,100 $1,274 $1,235 $995 $1,020 $748 $760 $442 $968 $555 $916 $694 $617 $1,064 $3,924 $4,198 $4,280 $4,364 $4,275 Financial Highlight
Slide 20: Financial Highlights: Regulatory Capital - 12/31/16
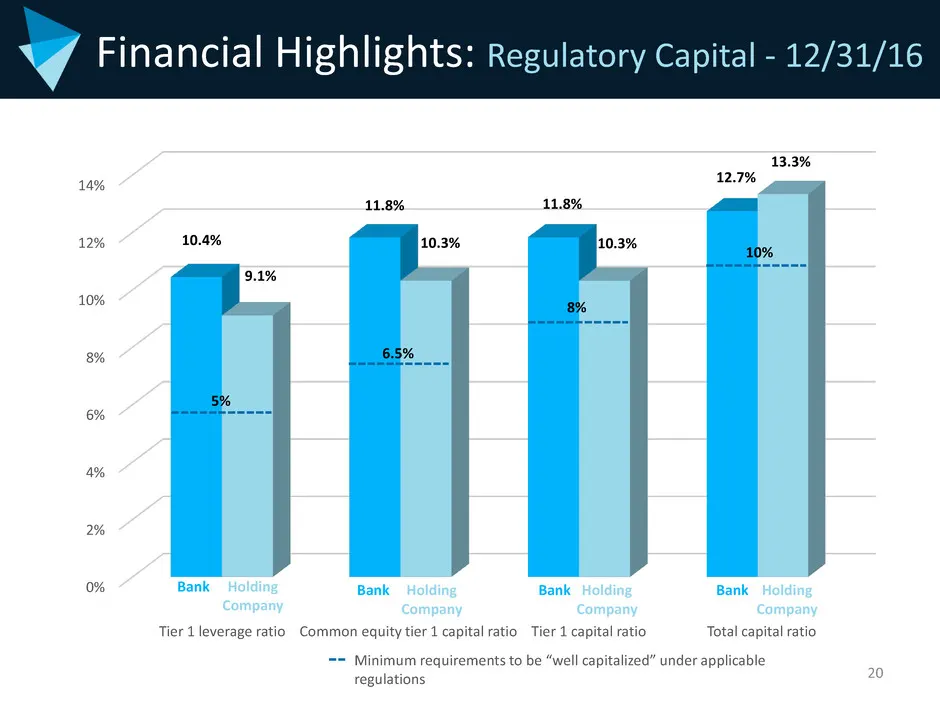
20 Financial Highlights: Regulatory Capital - 12/31/16 0% 2% 4% 6% 8% 10% 12% 14% Bank Bank 5% 6.5% 8% 10% Minimum requirements to be “well capitalized” under applicable regulations 10.4% 9.1% 11.8% 10.3% 11.8% 10.3% 12.7% 13.3% Holding Company Bank BankHolding Company Holding Company Holding Compan
Slide 21: Appendix
v Atlantic Capital APPENDIX jo
Slide 22: Management Biographies
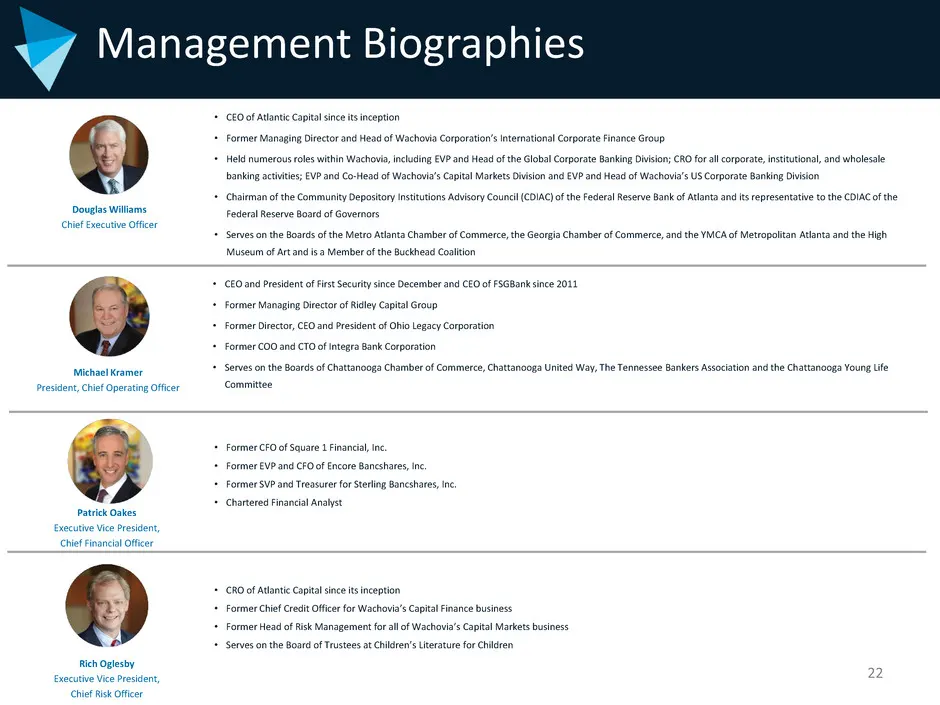
Management Biographies 22 Douglas Williams Chief Executive Officer • CEO of Atlantic Capital since its inception • Former Managing Director and Head of Wachovia Corporation’s International Corporate Finance Group • Held numerous roles within Wachovia, including EVP and Head of the Global Corporate B
Slide 23: ACBI Historical Balance Sheets
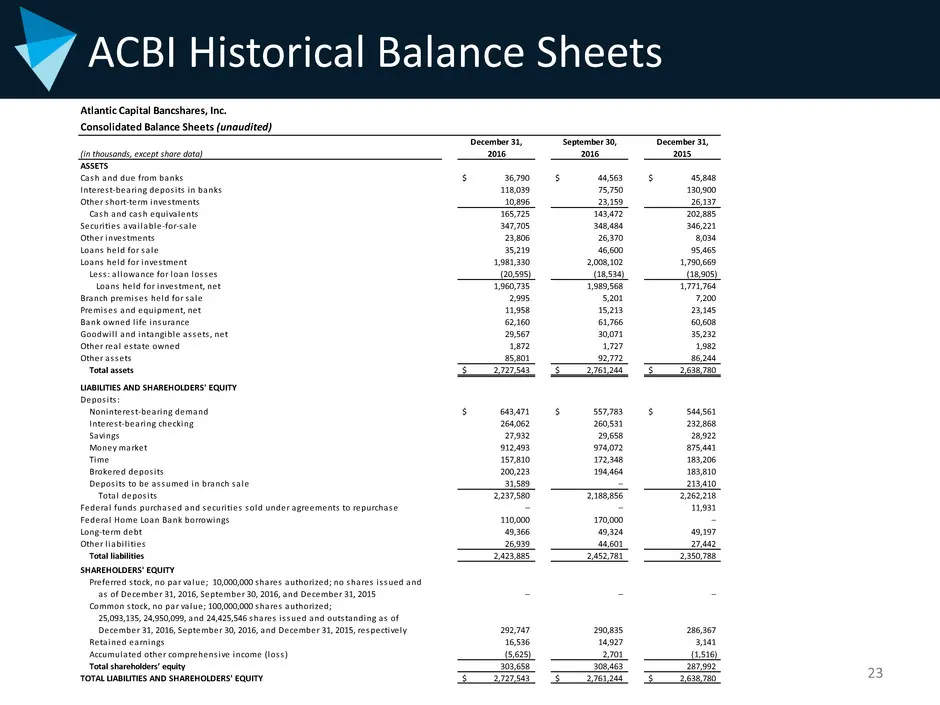
23 ACBI Historical Balance Sheets December 31, September 30, December 31, (in thousands, except share data) 2016 2016 2015 ASSETS Cash and due from banks $ 36,790 $ 44,563 $ 45,848 Interest-bearing depos i ts in banks 118,039 75,750 130,900 Other short-term investments 10,896 23,159 26,137 Cash and
Slide 24: ACBI Historical Income Statements
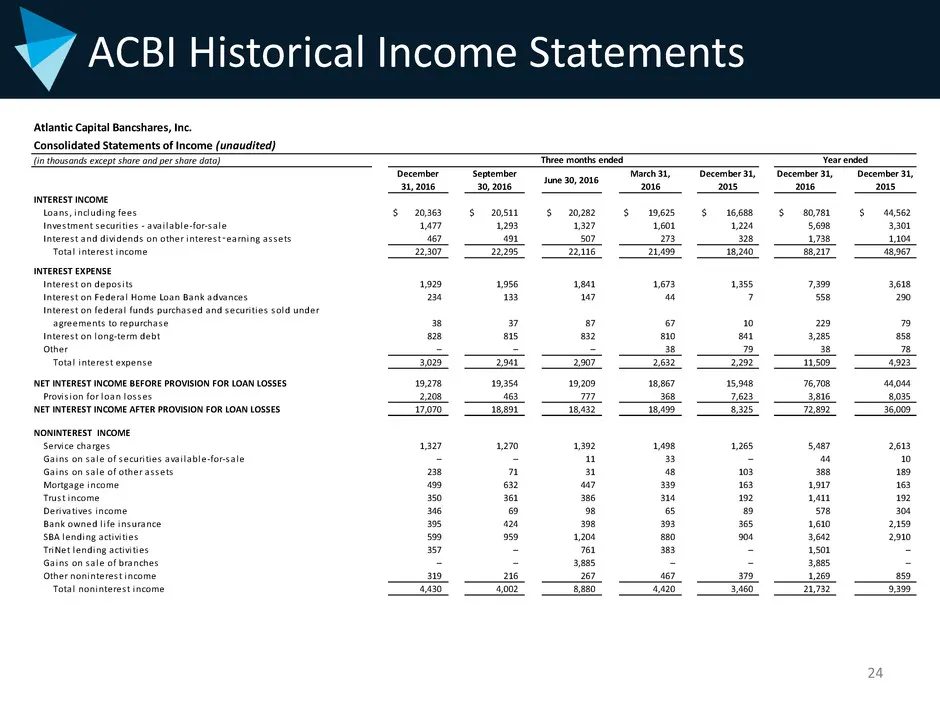
24 ACBI Historical Income Statements Atlantic Capital Bancshares, Inc. Consolidated Statements of Income (unaudited) (in thousands except share and per share data) December 31, 2016 September 30, 2016 June 30, 2016 March 31, 2016 December 31, 2015 December 31, 2016 December 31, 2015 INTEREST INCOME
Slide 25: ACBI Historical Income Statements (continued)
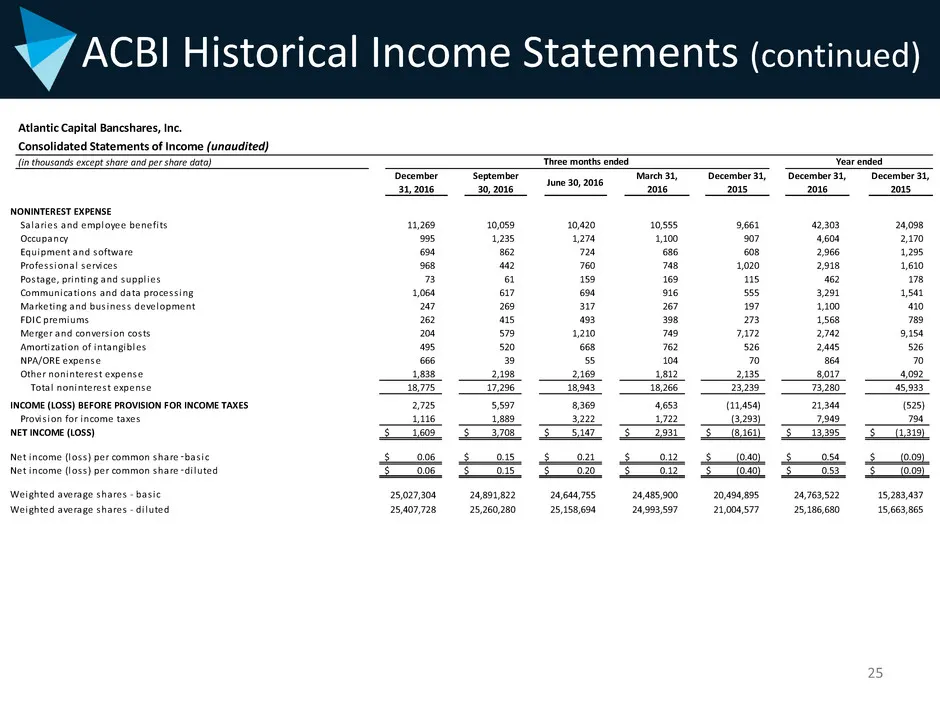
25 ACBI Historical Income Statements (continued) Atlantic Capital Bancshares, Inc. Consolidated Statements of I ome (unaudited) (in thousands except share and per share data) December 31, 2016 September 30, 2016 June 30, 2016 March 31, 2016 December 31, 2015 December 31, 2016 December 31, 2015 Year
Slide 26: ACBI Operating Income
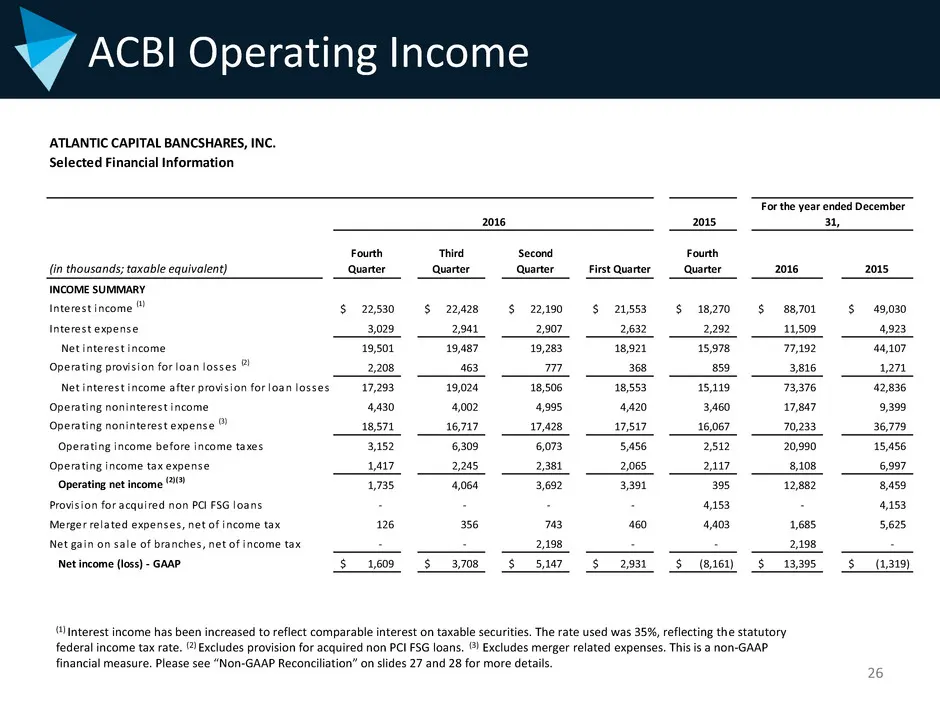
26 ACBI Operating Income ATLANTIC CAPITAL BANCSHARES, INC. Selected Financial Information (in thousands; taxable equivalent) Fourth Quarter Third Quarter Second Quarter First Quarter Fourth Quarter 2016 2015 INCOME SUMMARY Interest income (1) 22,530$ 22,428$ 22,190$ 21,553$ 18,270$ 88,701$ 49,030$ I
Slide 27: Non-GAAP Reconciliation
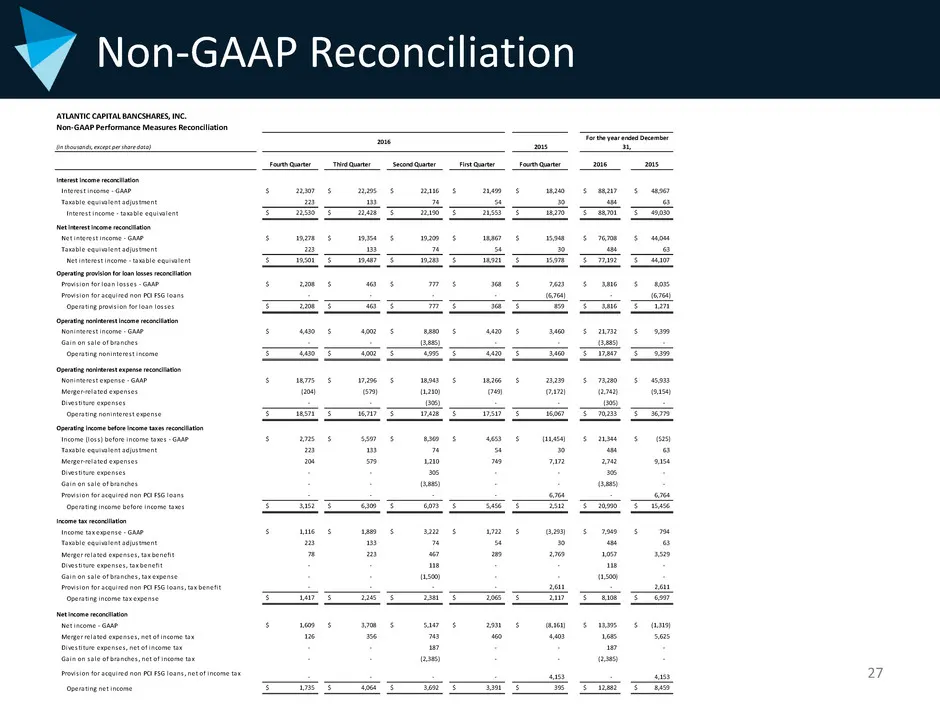
Non-GAAP Reconciliation 27 ATLANTIC CAPITAL BANCSHARES, INC. Non-GAAP Performance Measures Reconciliation (in thousands, except per share data) Fourth Quarter Third Quarter Second Quarter First Quarter Fourth Quarter 2016 2015 Interest income reconciliation Interest income - GAAP $ 22,307 $ 22,295 $
Slide 28: Non-GAAP Reconciliation (continued)
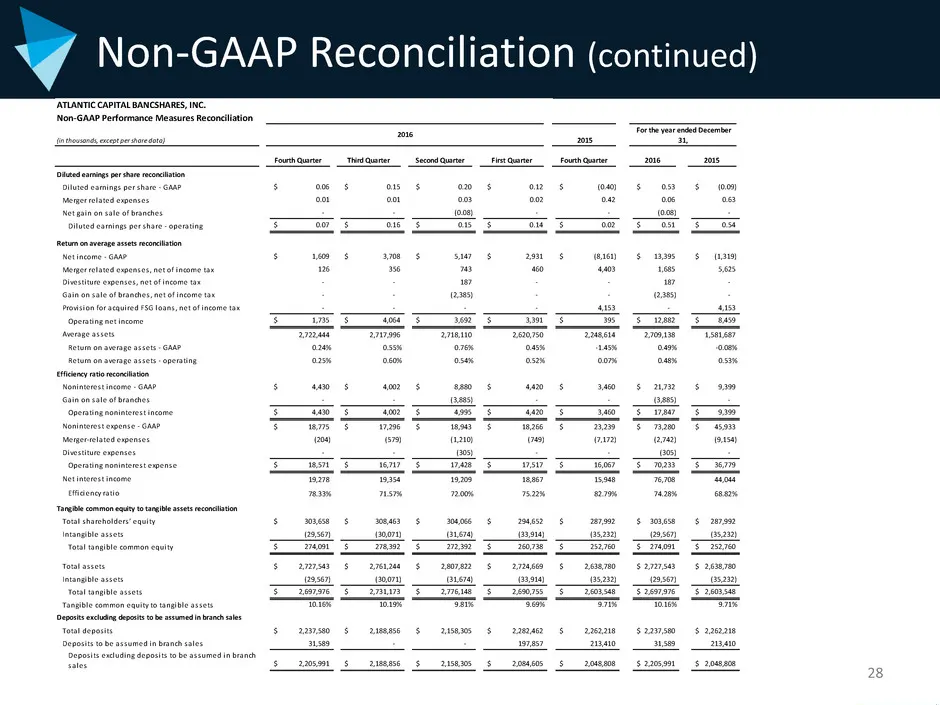
Non-GAAP Reconciliation (continued) 28 Diluted earnings per share reconciliation Di luted earnings per share - GAAP $ 0.06 $ 0.15 $ 0.20 $ 0.12 $ (0.40) $ 0.53 $ (0.09) Merger related expenses 0.01 0.01 0.03 0.02 0.42 0.06 0.63 Net ga in on sa le of branches - - (0.08) - - (0.08) - Di luted earnings

Slide 29: Atlantic Capital
v Atlantic Capital
Source: SEC EDGAR · 8-K filed Mar 20, 2017
More decks from Atlantic Capital Bancshares Inc
 Q4 2021 Earnings Presentation27 slides · Jan 24, 2022
 Q3 2021 Earnings Presentation30 slides · Oct 27, 2021
 Q3 2021 Earnings Presentation40 slides · Oct 27, 2021
 Q2 2021 Earnings Presentation33 slides · Jul 23, 2021
 Merger or Acquisition (July 2021)16 slides · Jul 23, 2021
 Q2 2021 Earnings Presentation39 slides · Jul 23, 2021