Merchants Bancorp · NASDAQ:MBIN
Merchants Bancorp — Piper Sandler Financial Services Conference 2026
34 slides from Merchants Bancorp's conference presentation, November 2026

Slide 1: Piper Sandler Financial Services Conference November 2026
Piper | Sandler Financial Services Conference November 2026
Slide 2: Legal Disclaimer
Legal Disclaimer This presentation may contain “forward-looking statements” within the meaning of Section 27A of the Securities Act, Section 21E of the Securities Exchange Act of 1934, as amended, and the U.S. Private Securities Litigation Reform Act of 1995. These forward-looking statements reflect
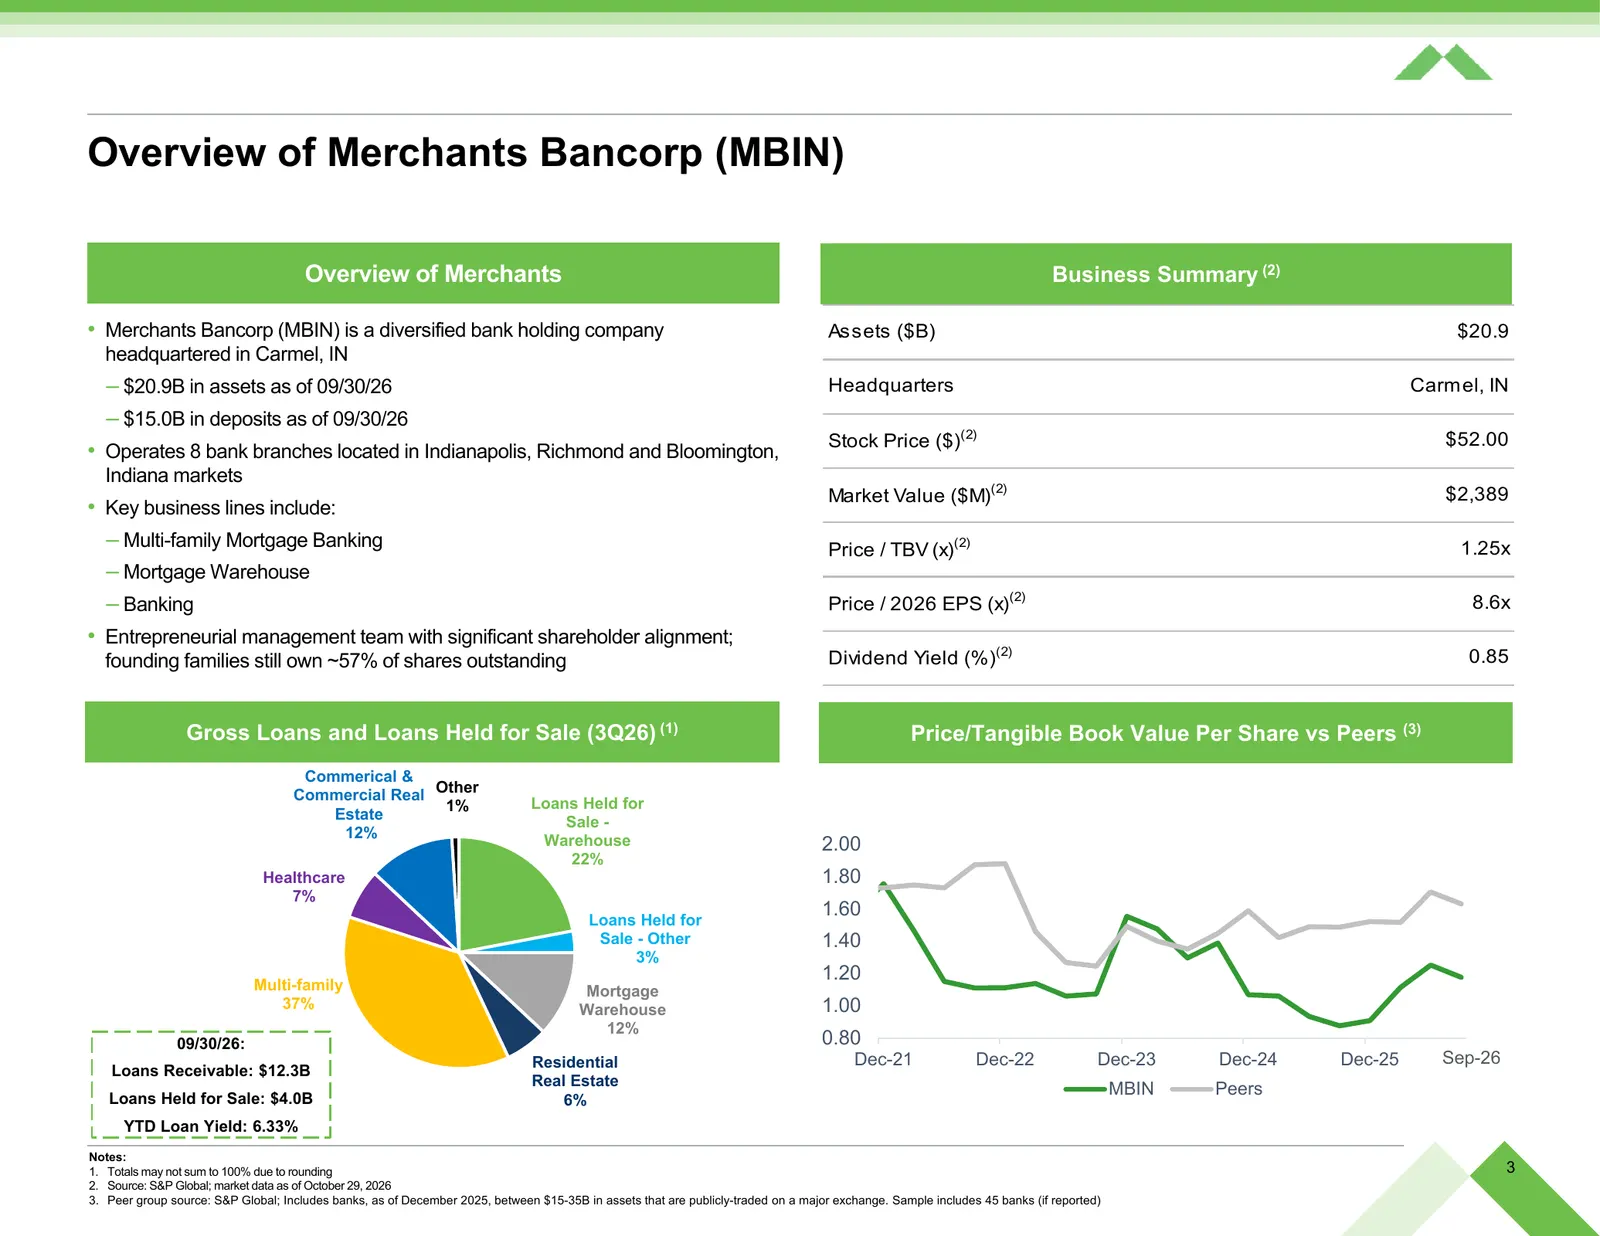
Slide 3: Overview of Merchants Bancorp (MBIN)
Overview of Merchants Bancorp (MBIN) Overview of Merchants Business Summary (2) • Merchants Bancorp (MBIN) is a diversified bank holding company Assets ($B) $20.9 headquartered in Carmel, IN – $20.9B in assets as of 09/30/26 Headquarters Carmel, IN – $15.0B in deposits as of 09/30/26 Stock Price ($)
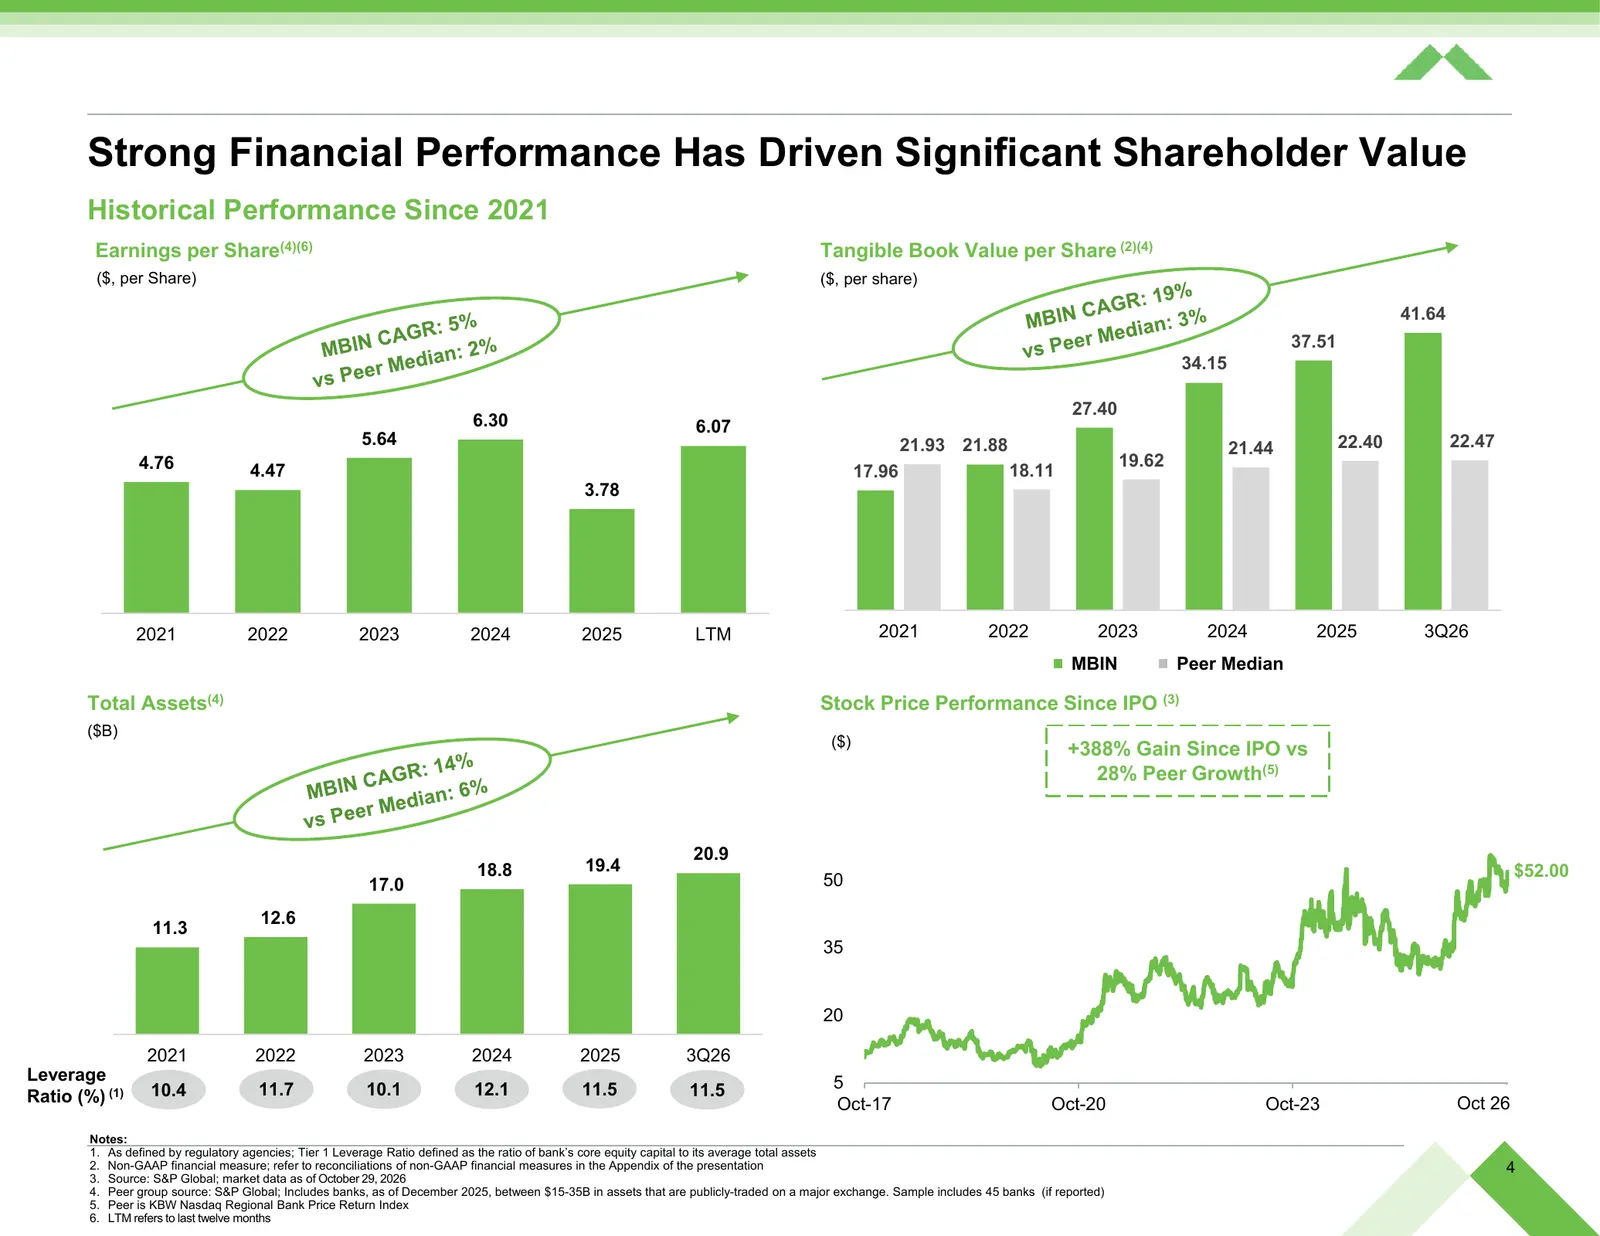
Slide 4: Strong Financial Performance Has Driven Significant Shareholder Value
Strong Financial Performance Has Driven Significant Shareholder Value Historical Performance Since 2021 Earnings per Share(4)(6) Tangible Book Value per Share (2)(4) ($, per Share) ($, per share) 41.64 37.51 34.15 27.40 6.30 6.07 5.64 21.93 21.88 22.40 22.47 21.44 4.76 19.62 4.47 17.96 18.11 3.78 20
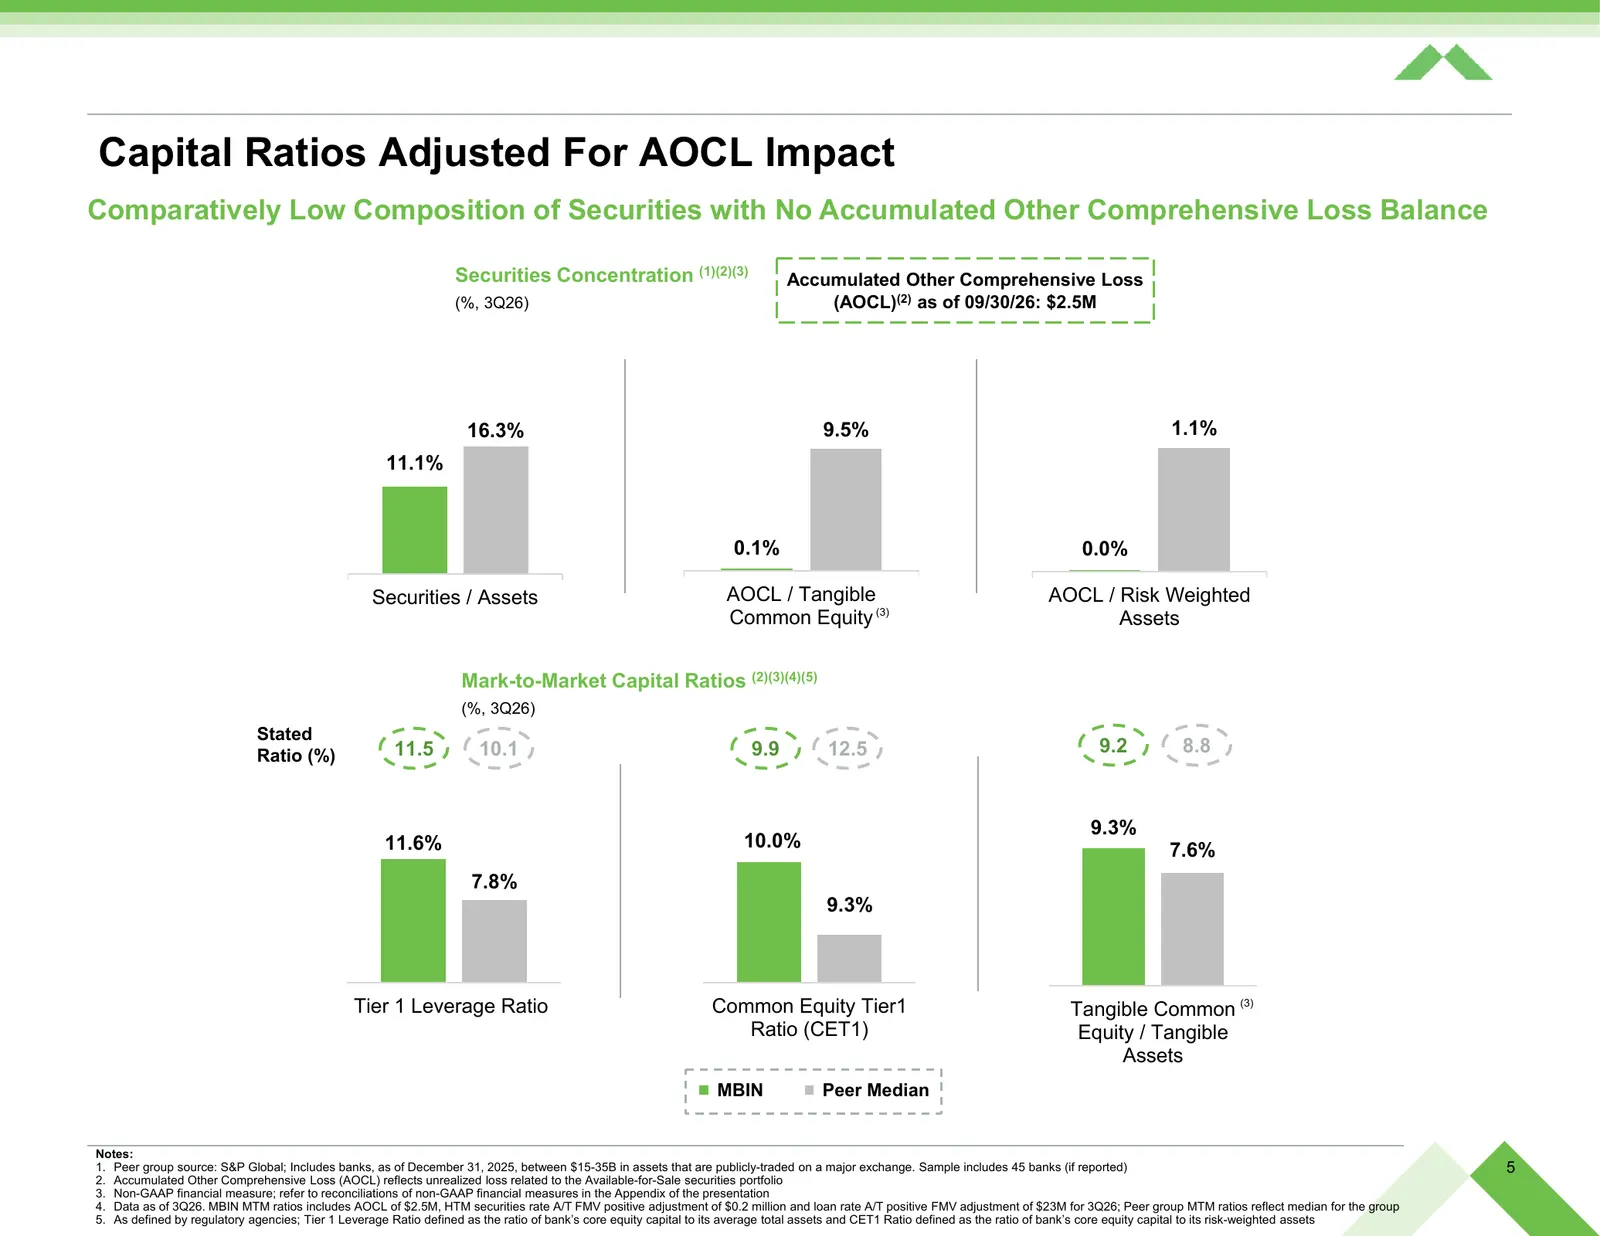
Slide 5: Capital Ratios Adjusted For AOCL Impact
Capital Ratios Adjusted For AOCL Impact Comparatively Low Composition of Securities with No Accumulated Other Comprehensive Loss Balance Securities Concentration (1)(2)(3) Accumulated Other Comprehensive Loss (%, 3Q26) (AOCL)(2) as of 09/30/26: $2.5M 16.3% 9.5% 1.1% 11.1% 0.1% 0.0% Securities / Asse
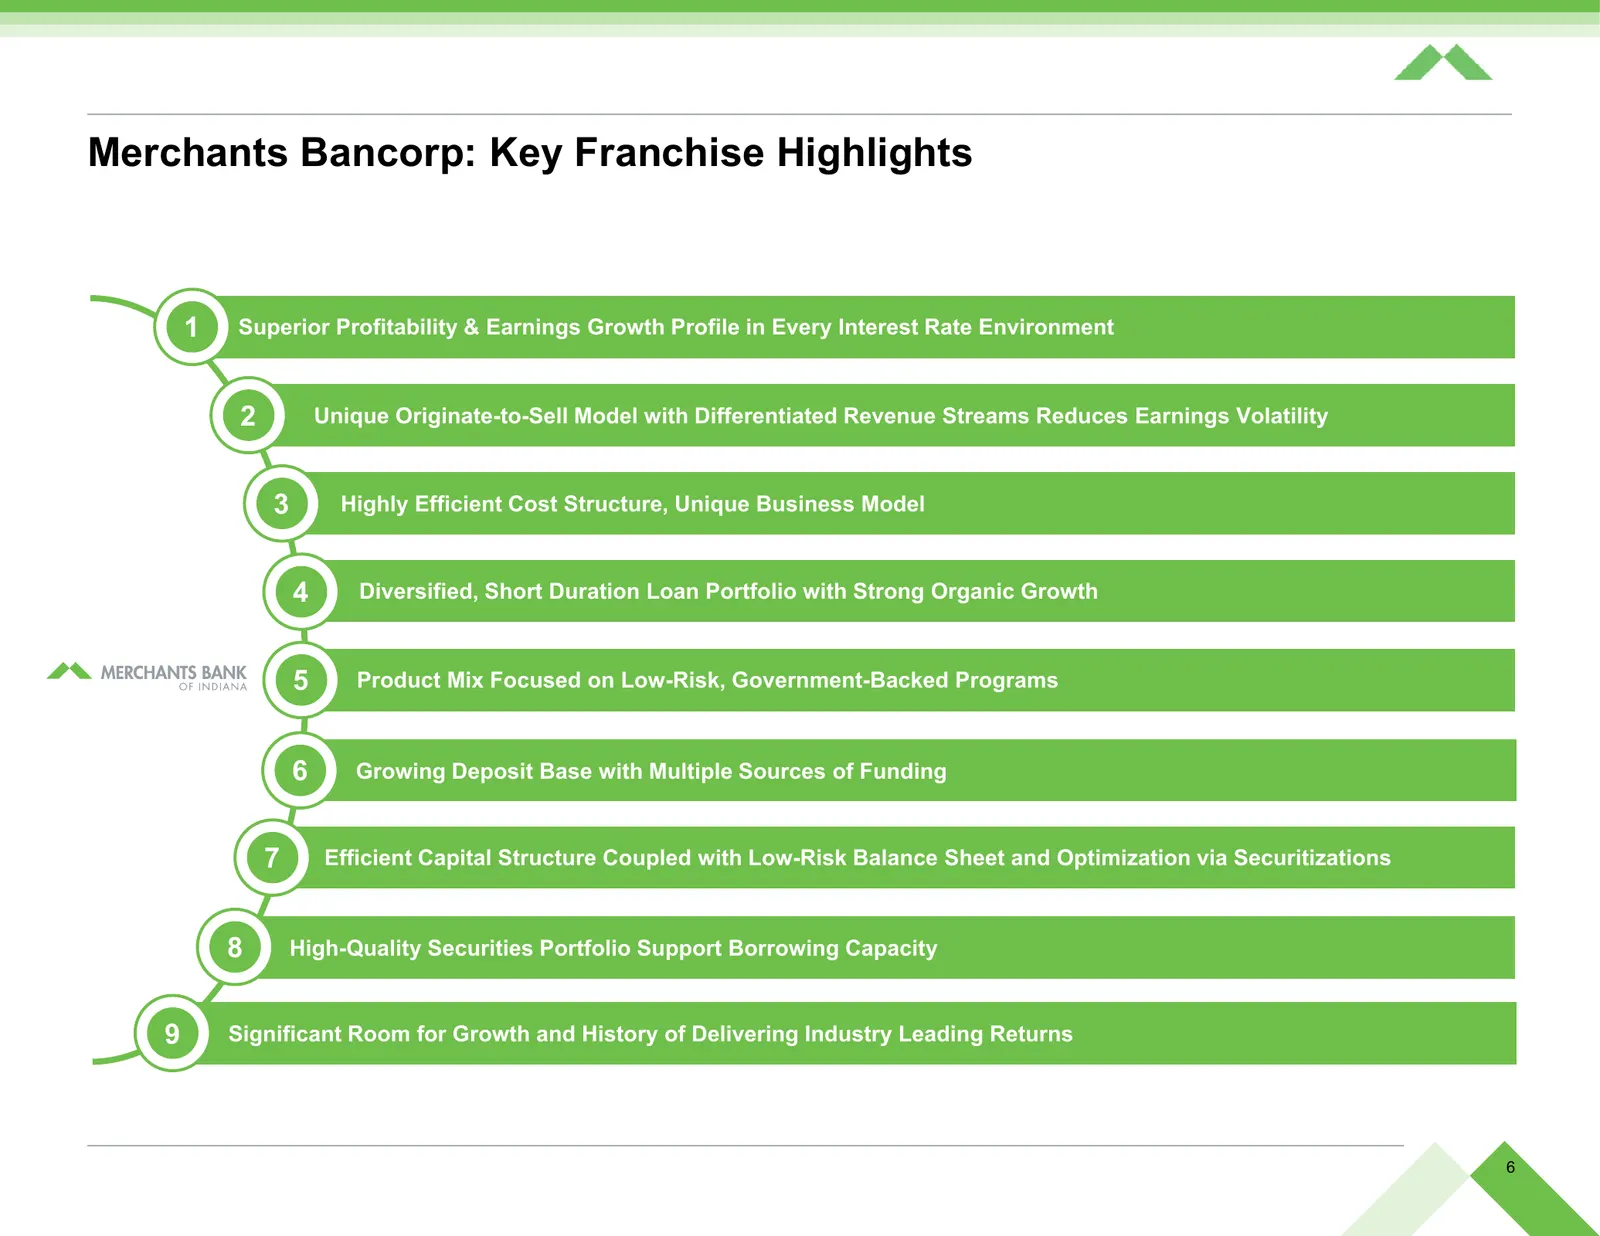
Slide 6: Merchants Bancorp: Key Franchise Highlights
Merchants Bancorp: Key Franchise Highlights 1 Superior Profitability & Earnings Growth Profile in Every Interest Rate Environment 2 Unique Originate-to-Sell Model with Differentiated Revenue Streams Reduces Earnings Volatility 3 Highly Efficient Cost Structure, Unique Business Model 4 Diversified, S
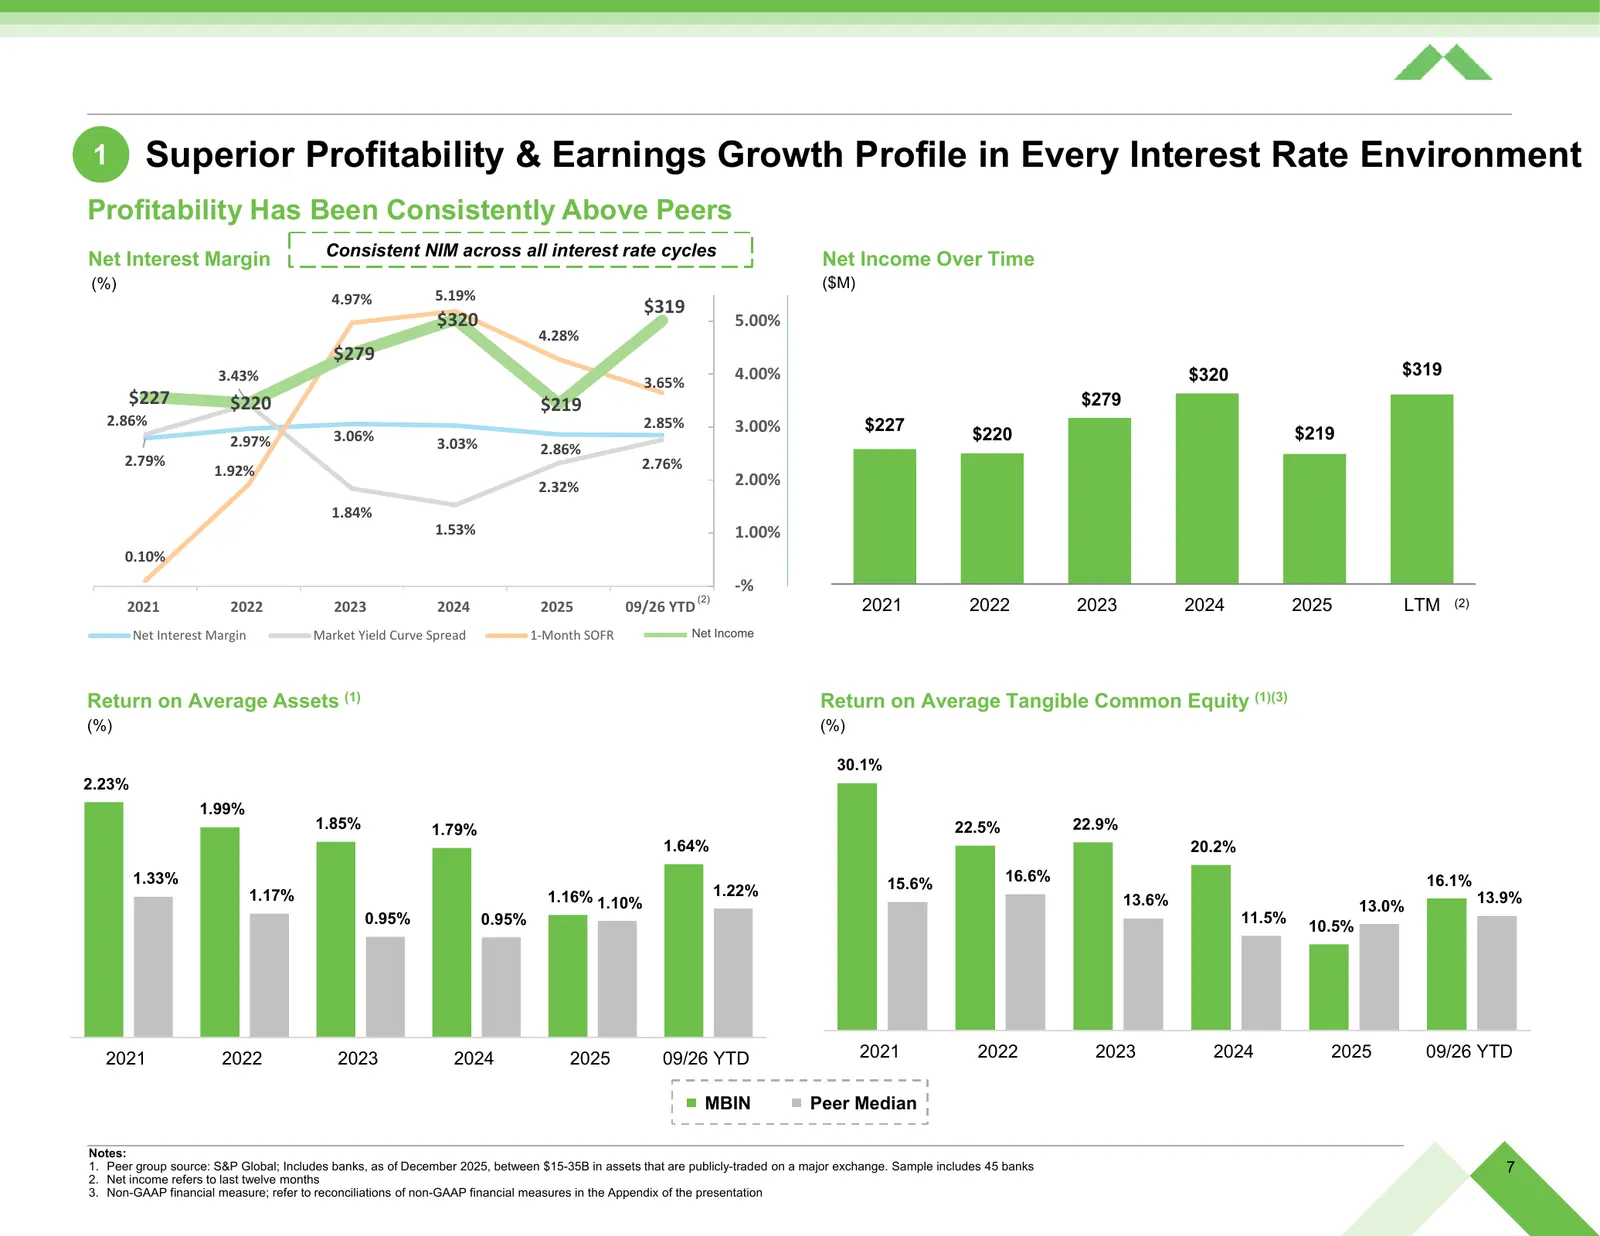
Slide 7: Superior Profitability & Earnings Growth Profile in Every Interest Rate Environment
1 Superior Profitability & Earnings Growth Profile in Every Interest Rate Environment Profitability Has Been Consistently Above Peers Consistent NIM across all interest rate cycles Net Interest Margin Net Income Over Time (%) ($M) 4.97% 5.19% $319 $320 5.00% 4.28% $279 3.43% 4.00% $320 $319 3.65% $2
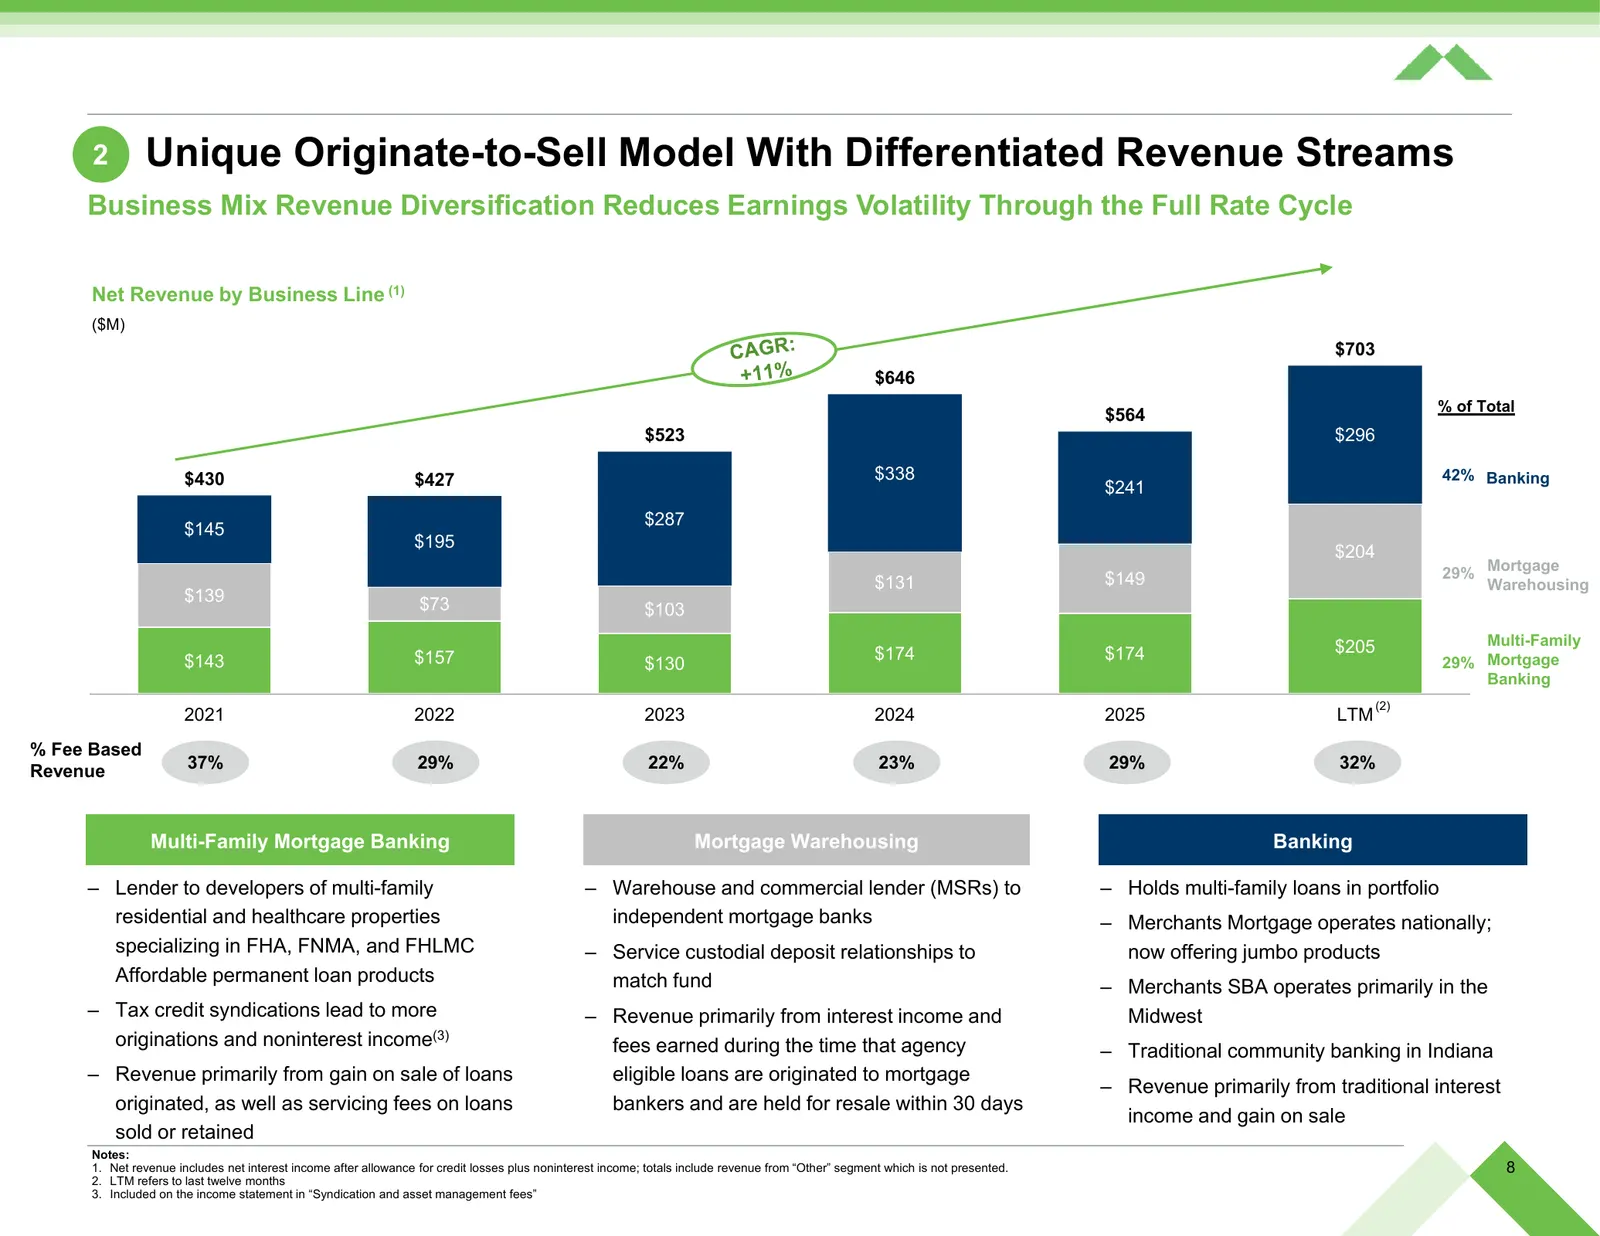
Slide 8: Unique Originate-to-Sell Model With Differentiated Revenue Streams
2 Unique Originate-to-Sell Model With Differentiated Revenue Streams Business Mix Revenue Diversification Reduces Earnings Volatility Through the Full Rate Cycle Net Revenue by Business Line (1) ($M) $703 $646 % of Total $564 $523 $296 $430 $427 $338 42% Banking $241 $287 $145 $195 $204 Mortgage $14
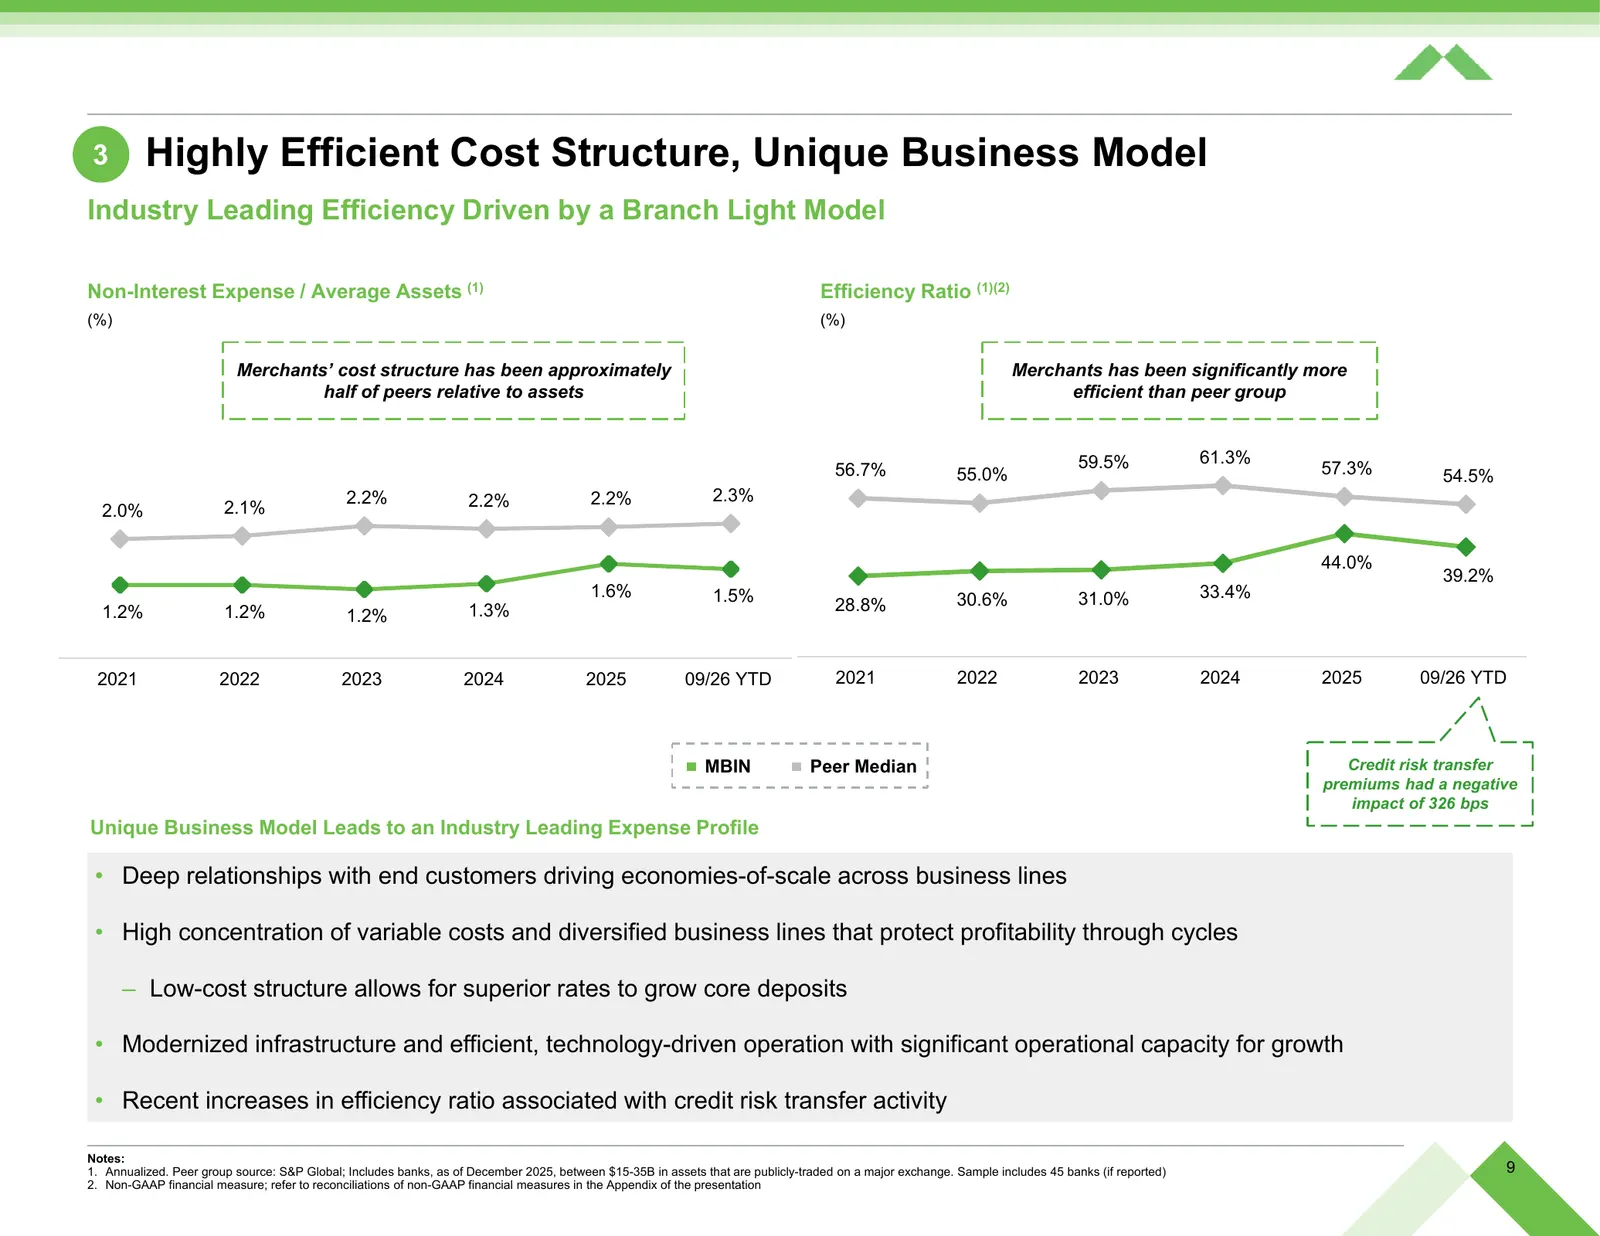
Slide 9: Highly Efficient Cost Structure, Unique Business Model
3 Highly Efficient Cost Structure, Unique Business Model Industry Leading Efficiency Driven by a Branch Light Model Non-Interest Expense / Average Assets (1) Efficiency Ratio (1)(2) (%) (%) Merchants’ cost structure has been approximately Merchants has been significantly more half of peers relative
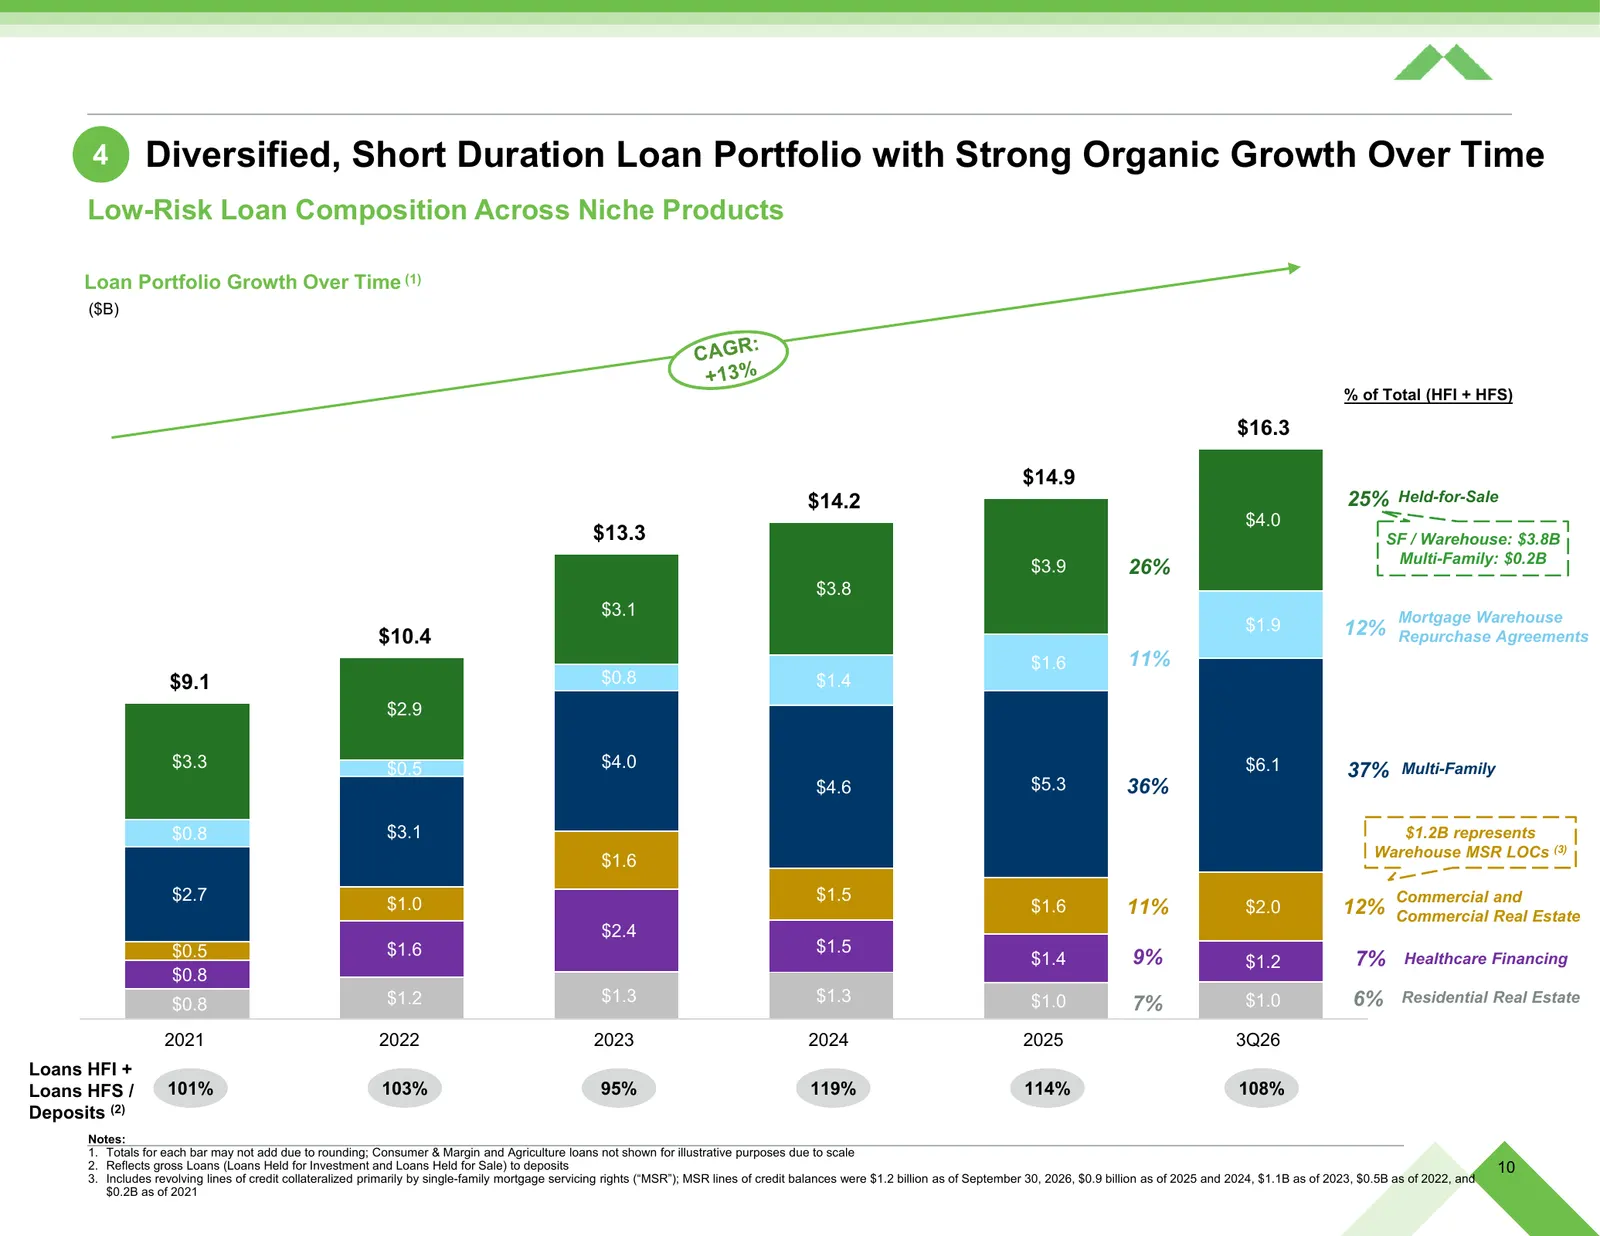
Slide 10: Diversified, Short Duration Loan Portfolio with Strong Organic Growth Over Time
4 Diversified, Short Duration Loan Portfolio with Strong Organic Growth Over Time Low-Risk Loan Composition Across Niche Products Loan Portfolio Growth Over Time (1) ($B) % of Total (HFI + HFS) $16.3 $14.9 $14.2 25% Held-for-Sale $4.0 $13.3 SF / Warehouse: $3.8B Multi-Family: $0.2B $3.9 26% $3.8 $3.
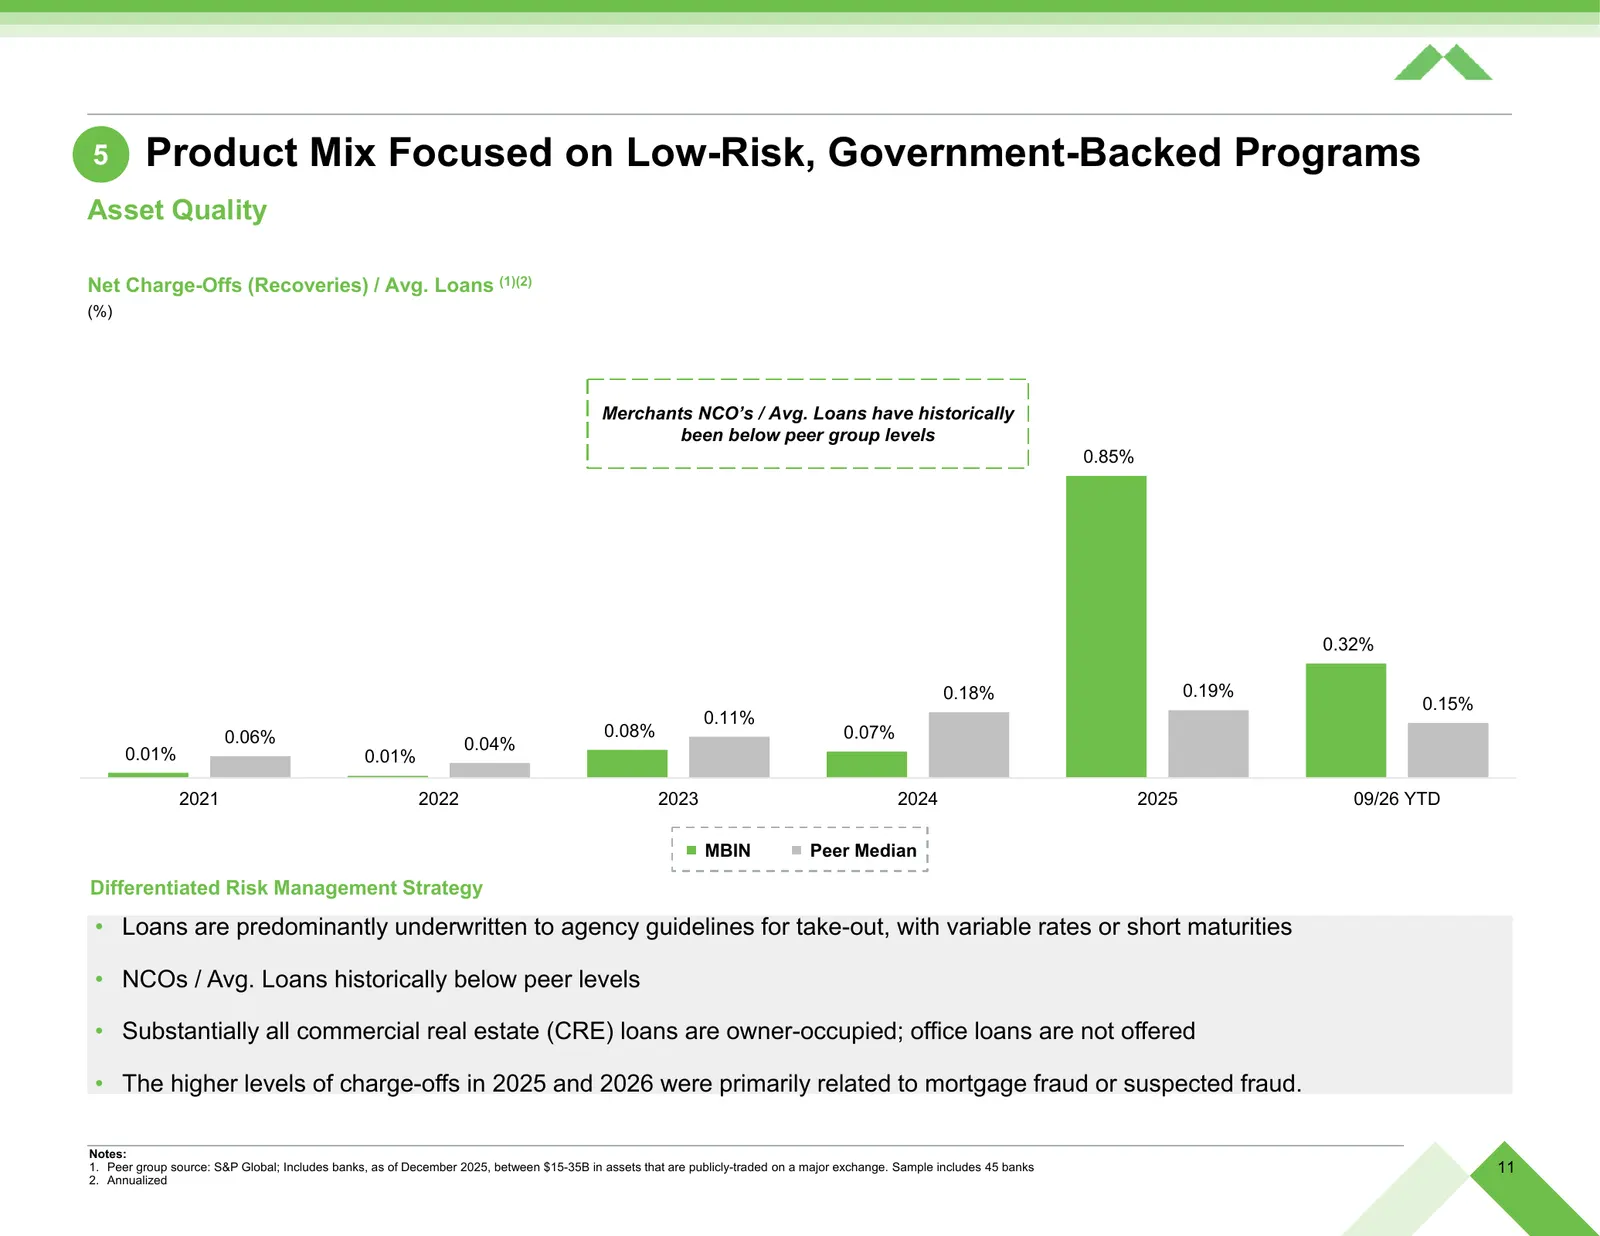
Slide 11: Product Mix Focused on Low-Risk, Government-Backed Programs
5 Product Mix Focused on Low-Risk, Government-Backed Programs Asset Quality Net Charge-Offs (Recoveries) / Avg. Loans (1)(2) (%) Merchants NCO’s / Avg. Loans have historically been below peer group levels 0.85% 0.32% 0.18% 0.19% 0.15% 0.11% 0.06% 0.08% 0.07% 0.04% 0.01% 0.01% 2021 2022 2023 2024 202
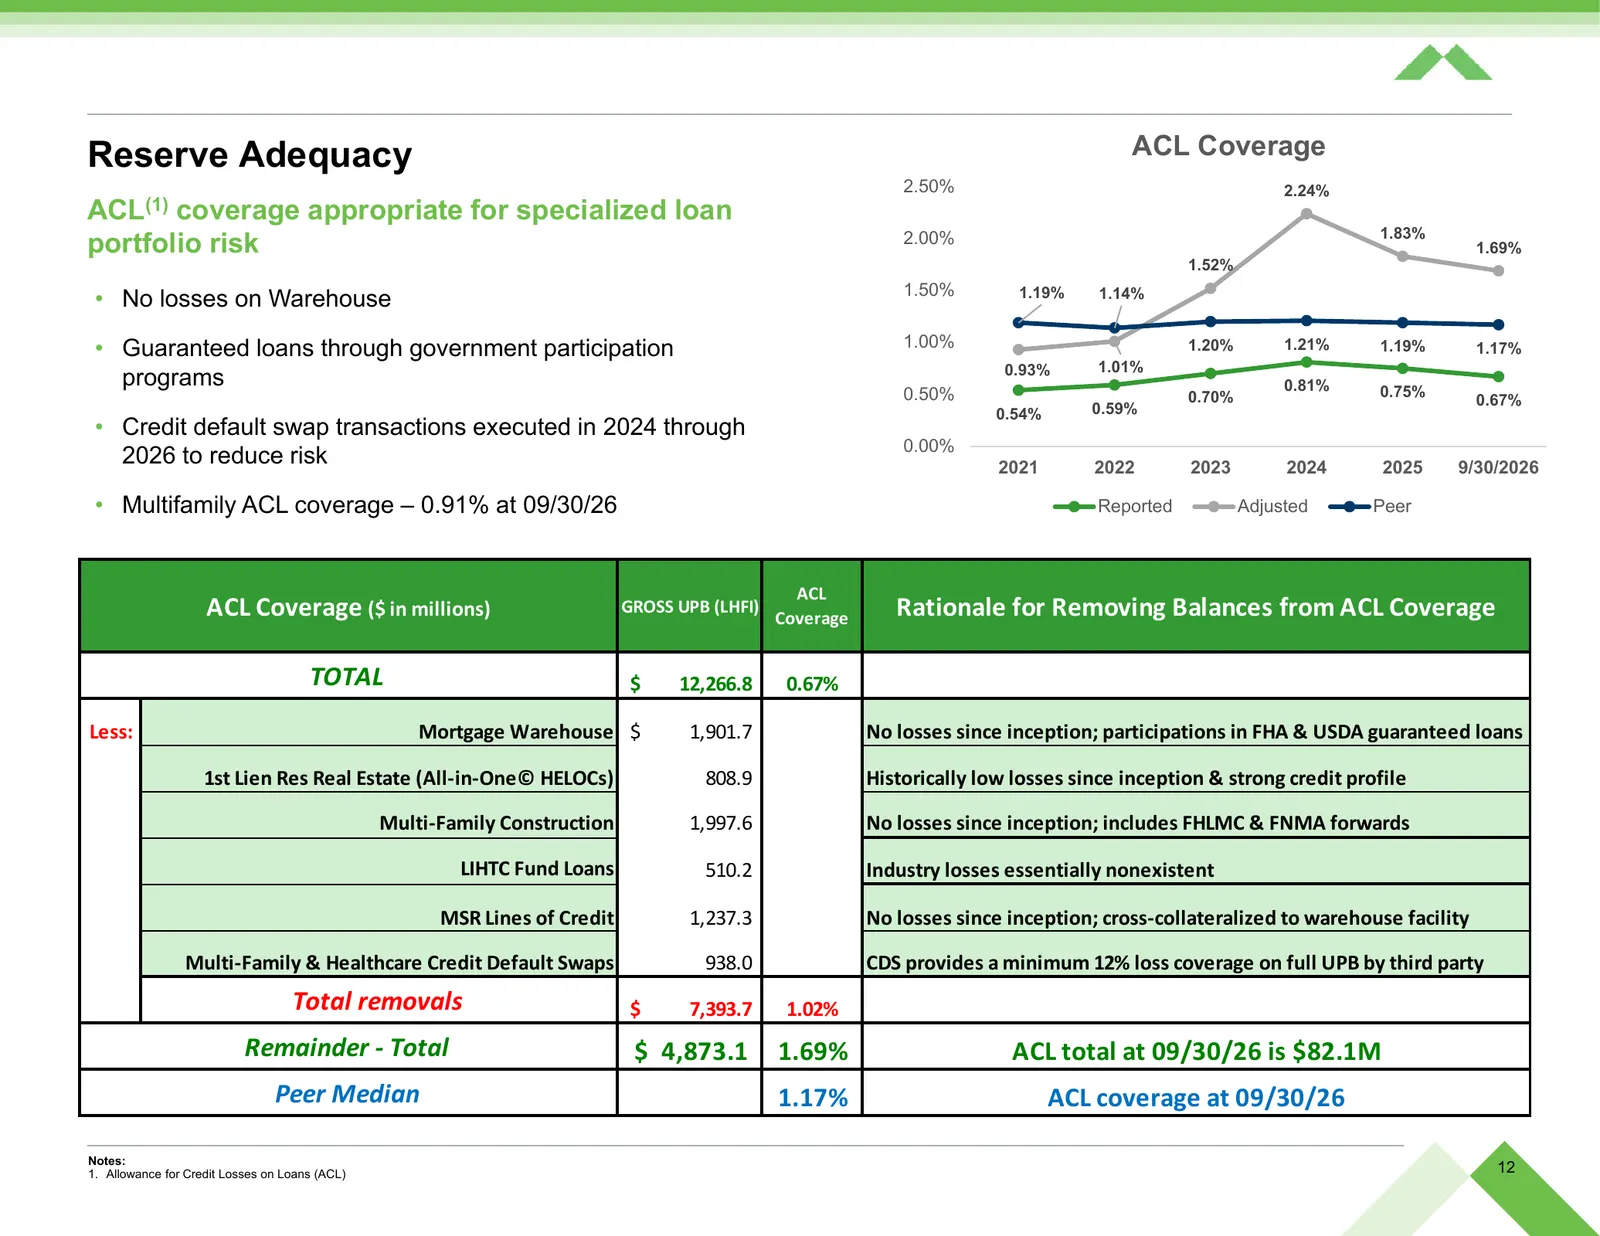
Slide 12: Reserve Adequacy
Reserve Adequacy ACL Coverage 2.50% 2.24% ACL(1) coverage appropriate for specialized loan 1.83% portfolio risk 2.00% 1.69% 1.52% 1.50% 1.19% 1.14% • No losses on Warehouse • Guaranteed loans through government participation 1.00% 1.20% 1.21% 1.19% 1.17% 0.93% 1.01% programs 0.81% 0.75% 0.50% 0.70%
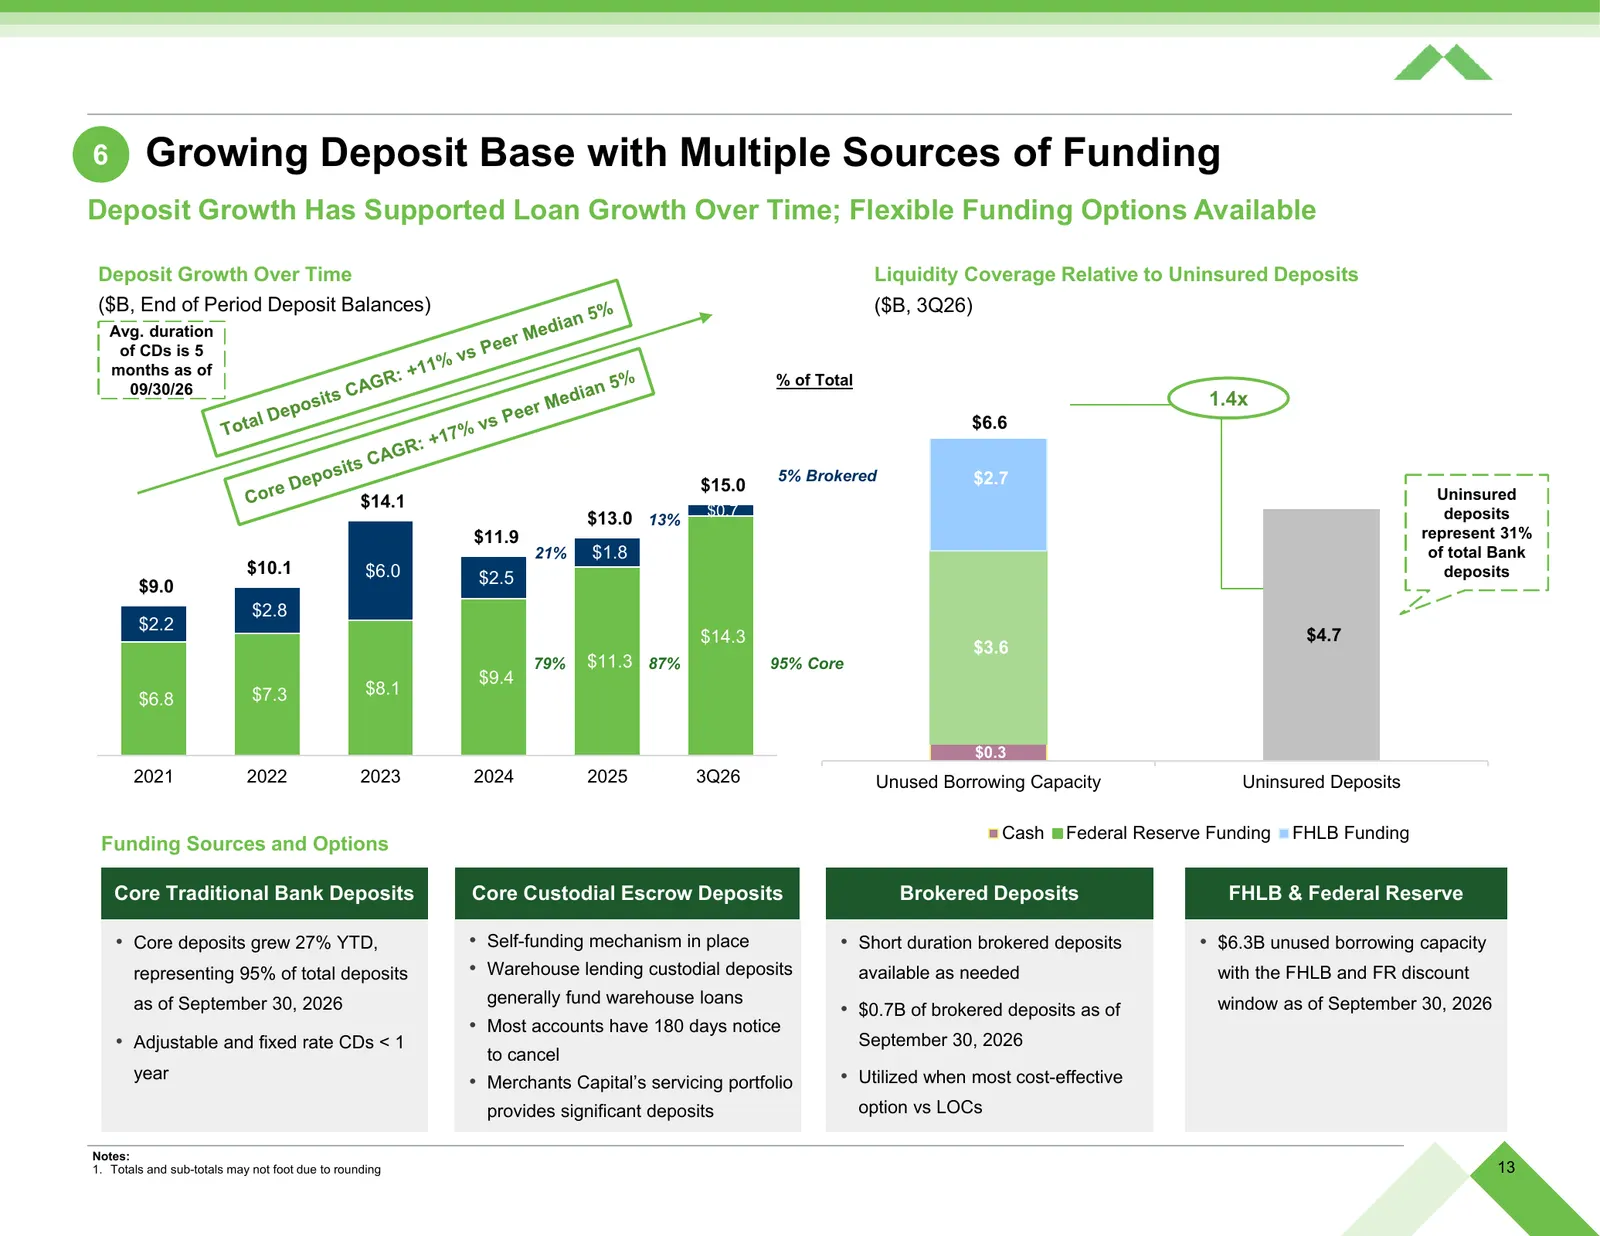
Slide 13: Growing Deposit Base with Multiple Sources of Funding
6 Growing Deposit Base with Multiple Sources of Funding Deposit Growth Has Supported Loan Growth Over Time; Flexible Funding Options Available Deposit Growth Over Time Liquidity Coverage Relative to Uninsured Deposits ($B, End of Period Deposit Balances) ($B, 3Q26) Avg. duration of CDs is 5 months a
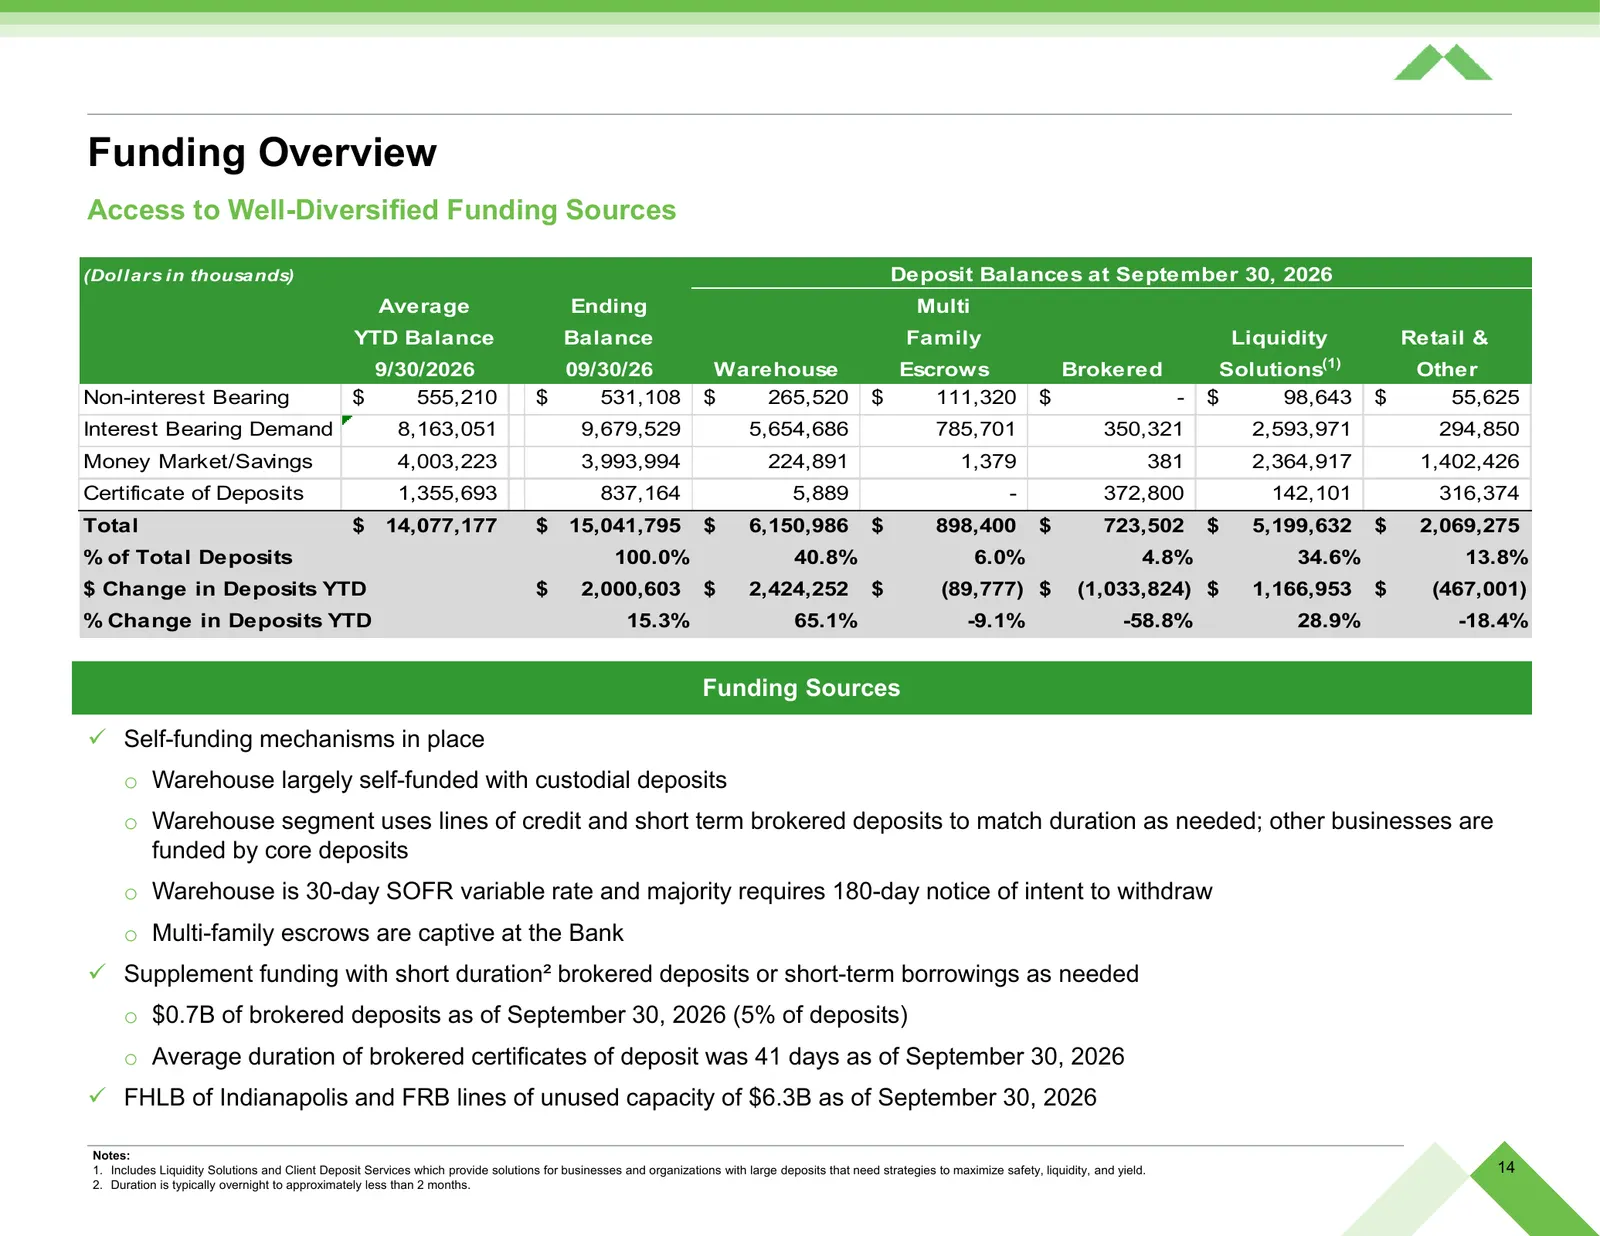
Slide 14: Funding Overview
Funding Overview Access to Well-Diversified Funding Sources (Dol l ars i n thousands) Deposit Balances at September 30, 2026 Average Ending Multi YTD Balance Balance Family Liquidity Retail & (1) 9/30/2026 09/30/26 Warehouse Escrows Brokered Solutions Other Non-interest Bearing $ 555,210 $ 531,108 $
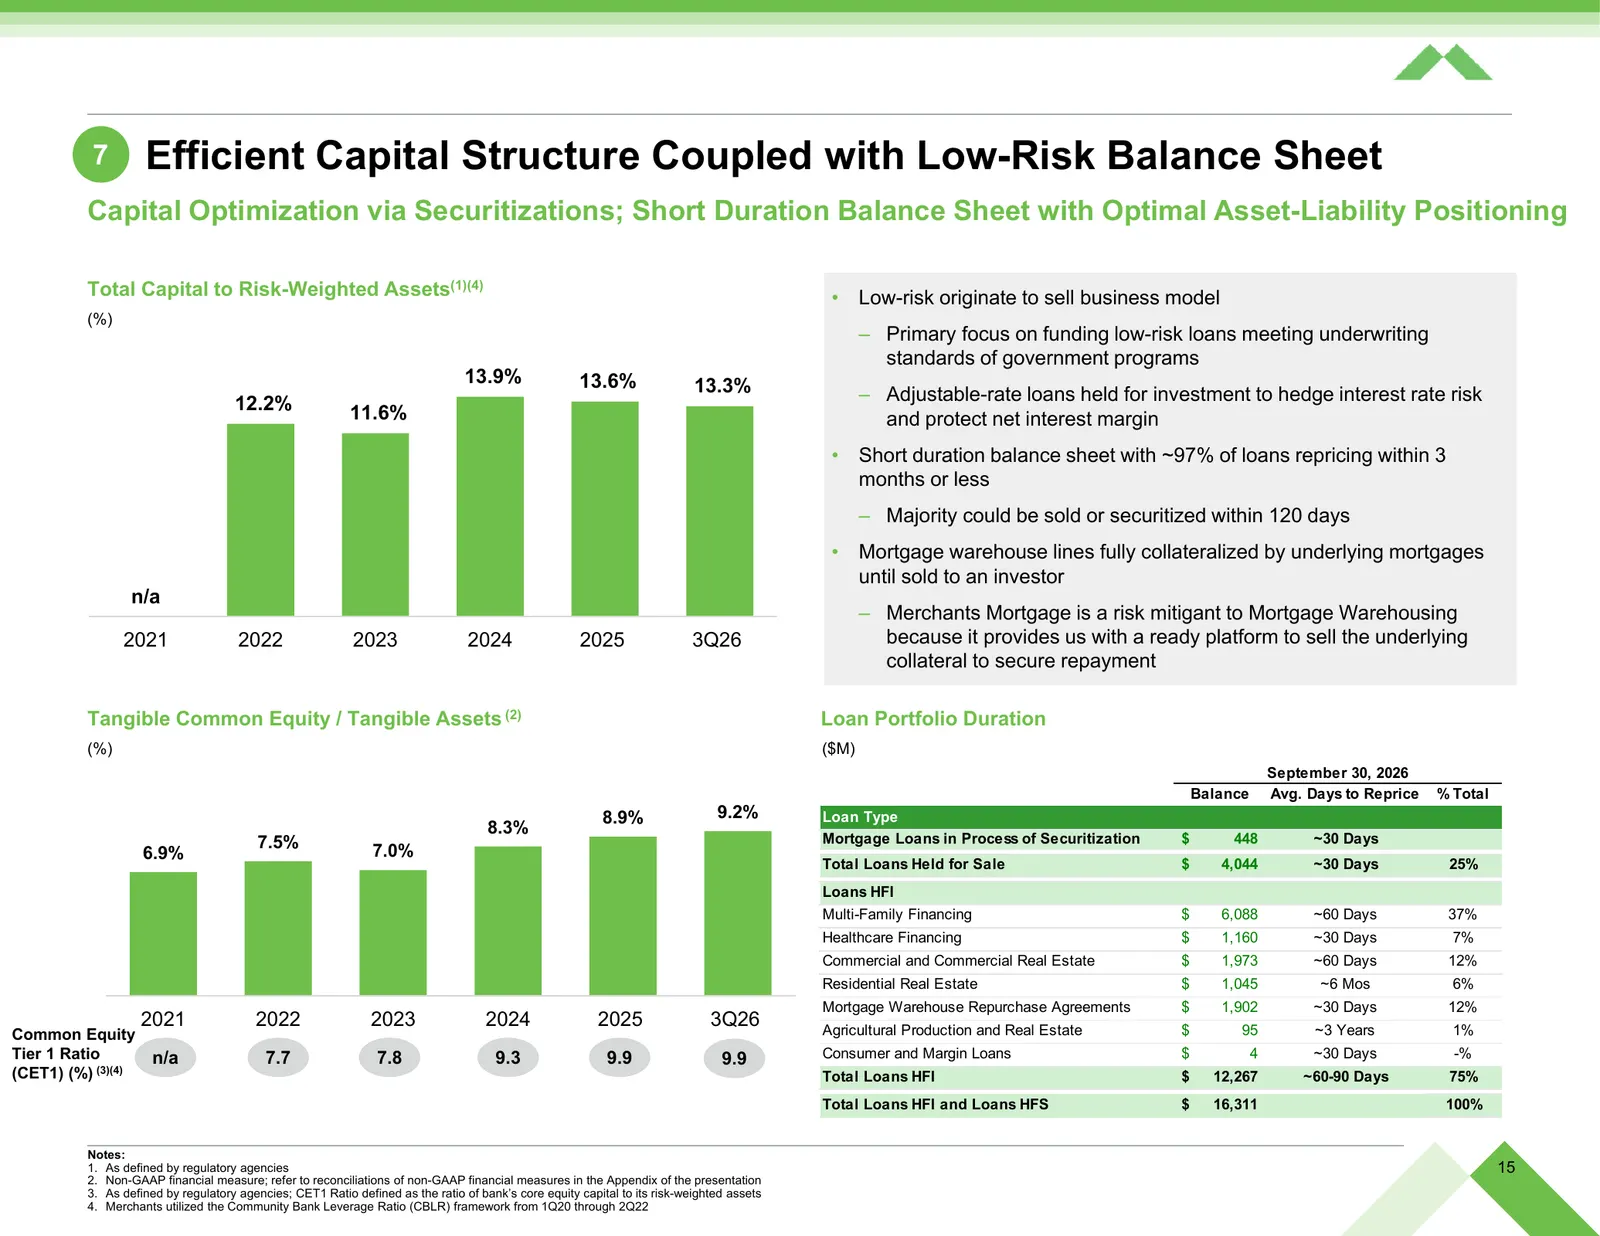
Slide 15: Efficient Capital Structure Coupled with Low-Risk Balance Sheet
7 Efficient Capital Structure Coupled with Low-Risk Balance Sheet Capital Optimization via Securitizations; Short Duration Balance Sheet with Optimal Asset-Liability Positioning Total Capital to Risk-Weighted Assets(1)(4) • Low-risk originate to sell business model (%) ‒ Primary focus on funding low
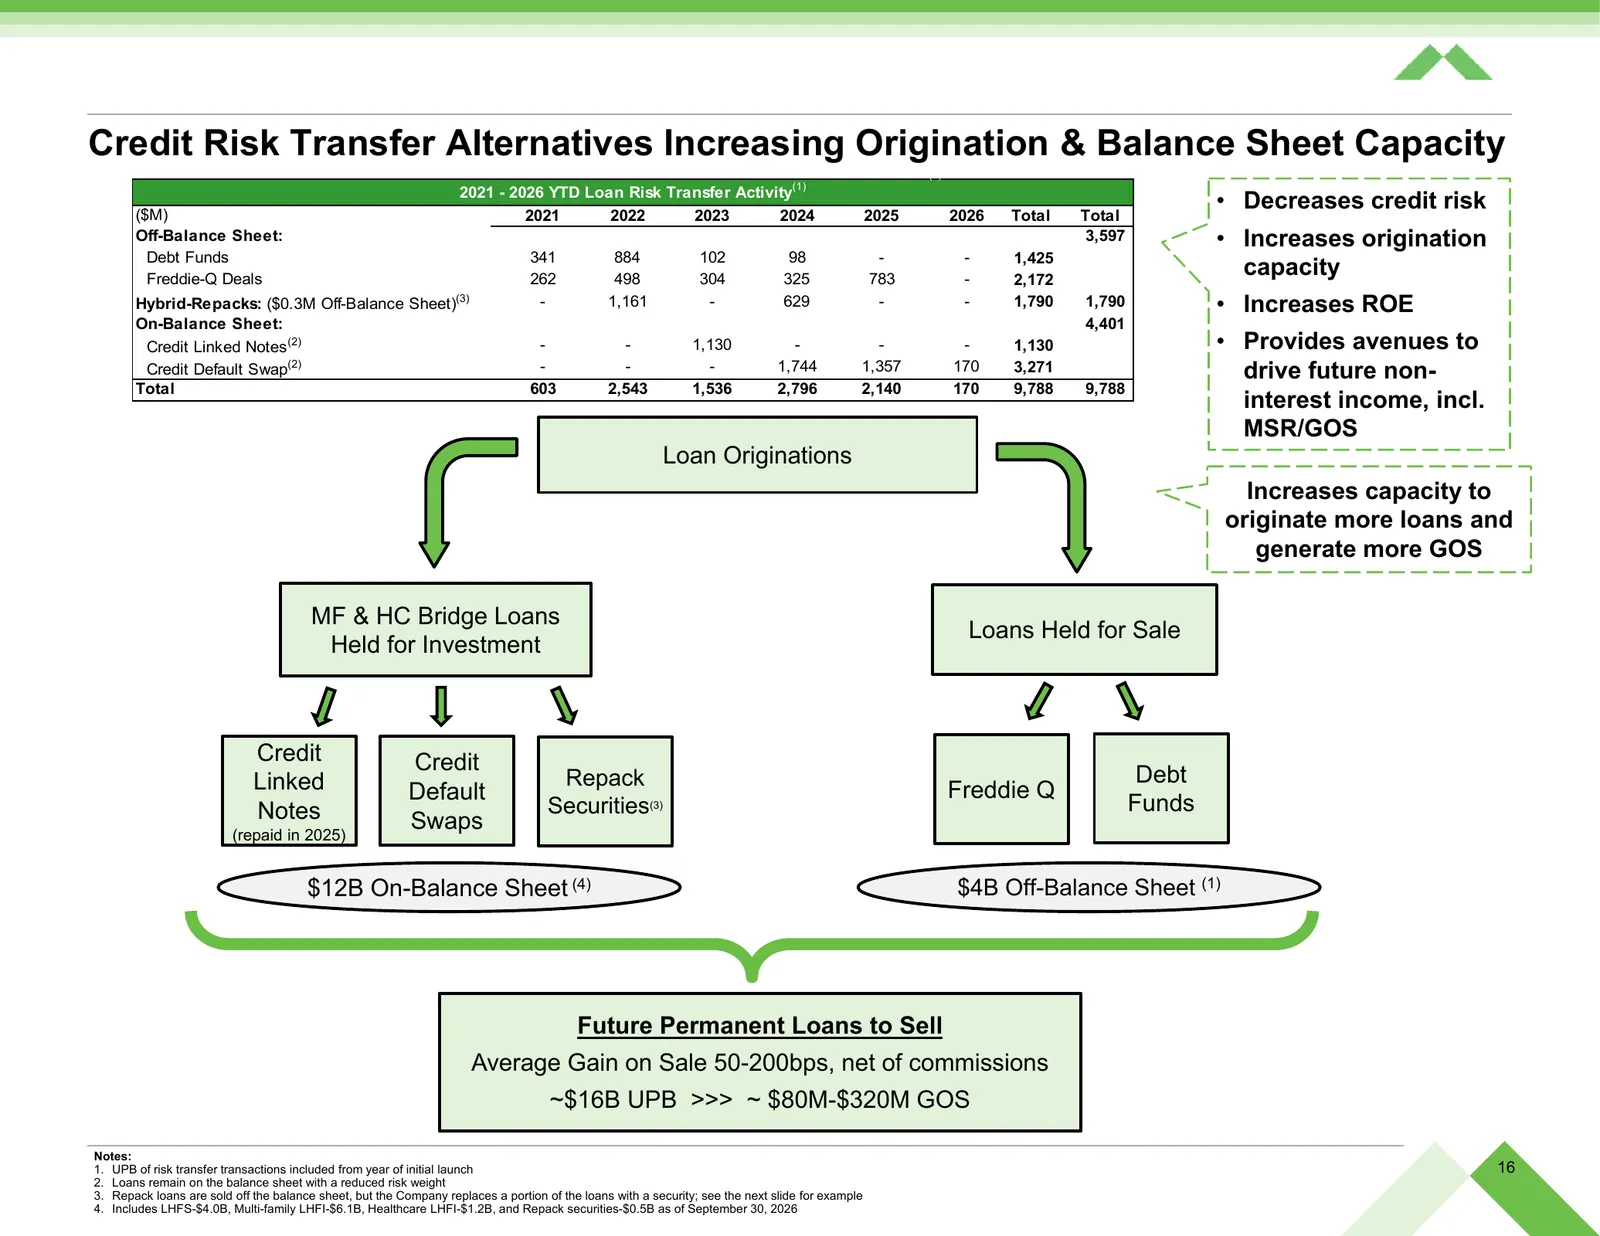
Slide 16: Credit Risk Transfer Alternatives Increasing Origination & Balance Sheet Capacity
Credit Risk Transfer Alternatives Increasing Origination & Balance Sheet Capacity (1) 2021 - 2026 YTD Loan Risk Transfer Activity(1) ($M) 2021 2022 2023 2024 2025 2026 Total Total • Decreases credit risk Off-Balance Sheet: 3,597 • Increases origination Debt Funds 341 884 102 98 - - 1,425 Freddie-Q D
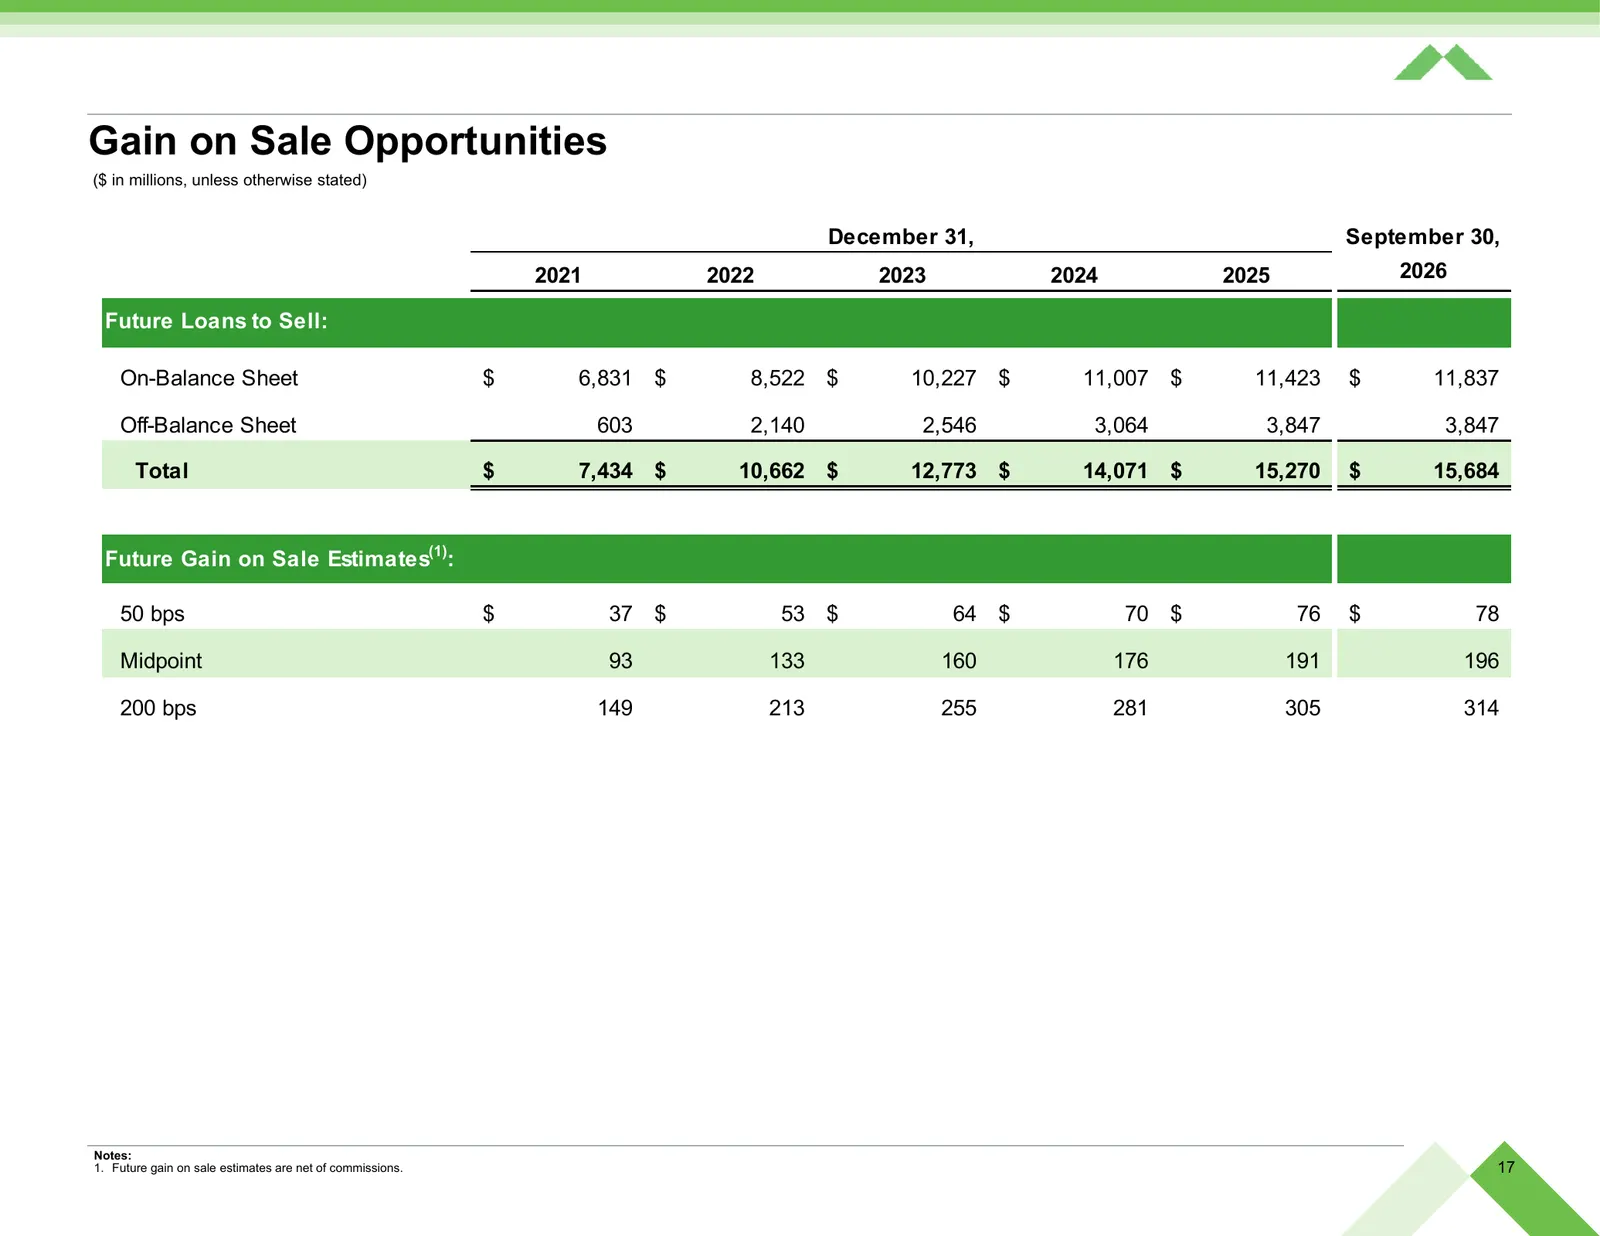
Slide 17: Gain on Sale Opportunities
Gain on Sale Opportunities (1) ($ in millions, unless otherwise stated) December 31, September 30, 2021 2022 2023 2024 2025 2026 Future Loans to Sell: On-Balance Sheet $ 6,831 $ 8,522 $ 10,227 $ 11,007 $ 11,423 $ 11,837 Off-Balance Sheet 603 2,140 2,546 3,064 3,847 3,847 Total $ 7,434 $ 10,662 $ 12,
Slide 18: Credit Risk Transfers - Examples
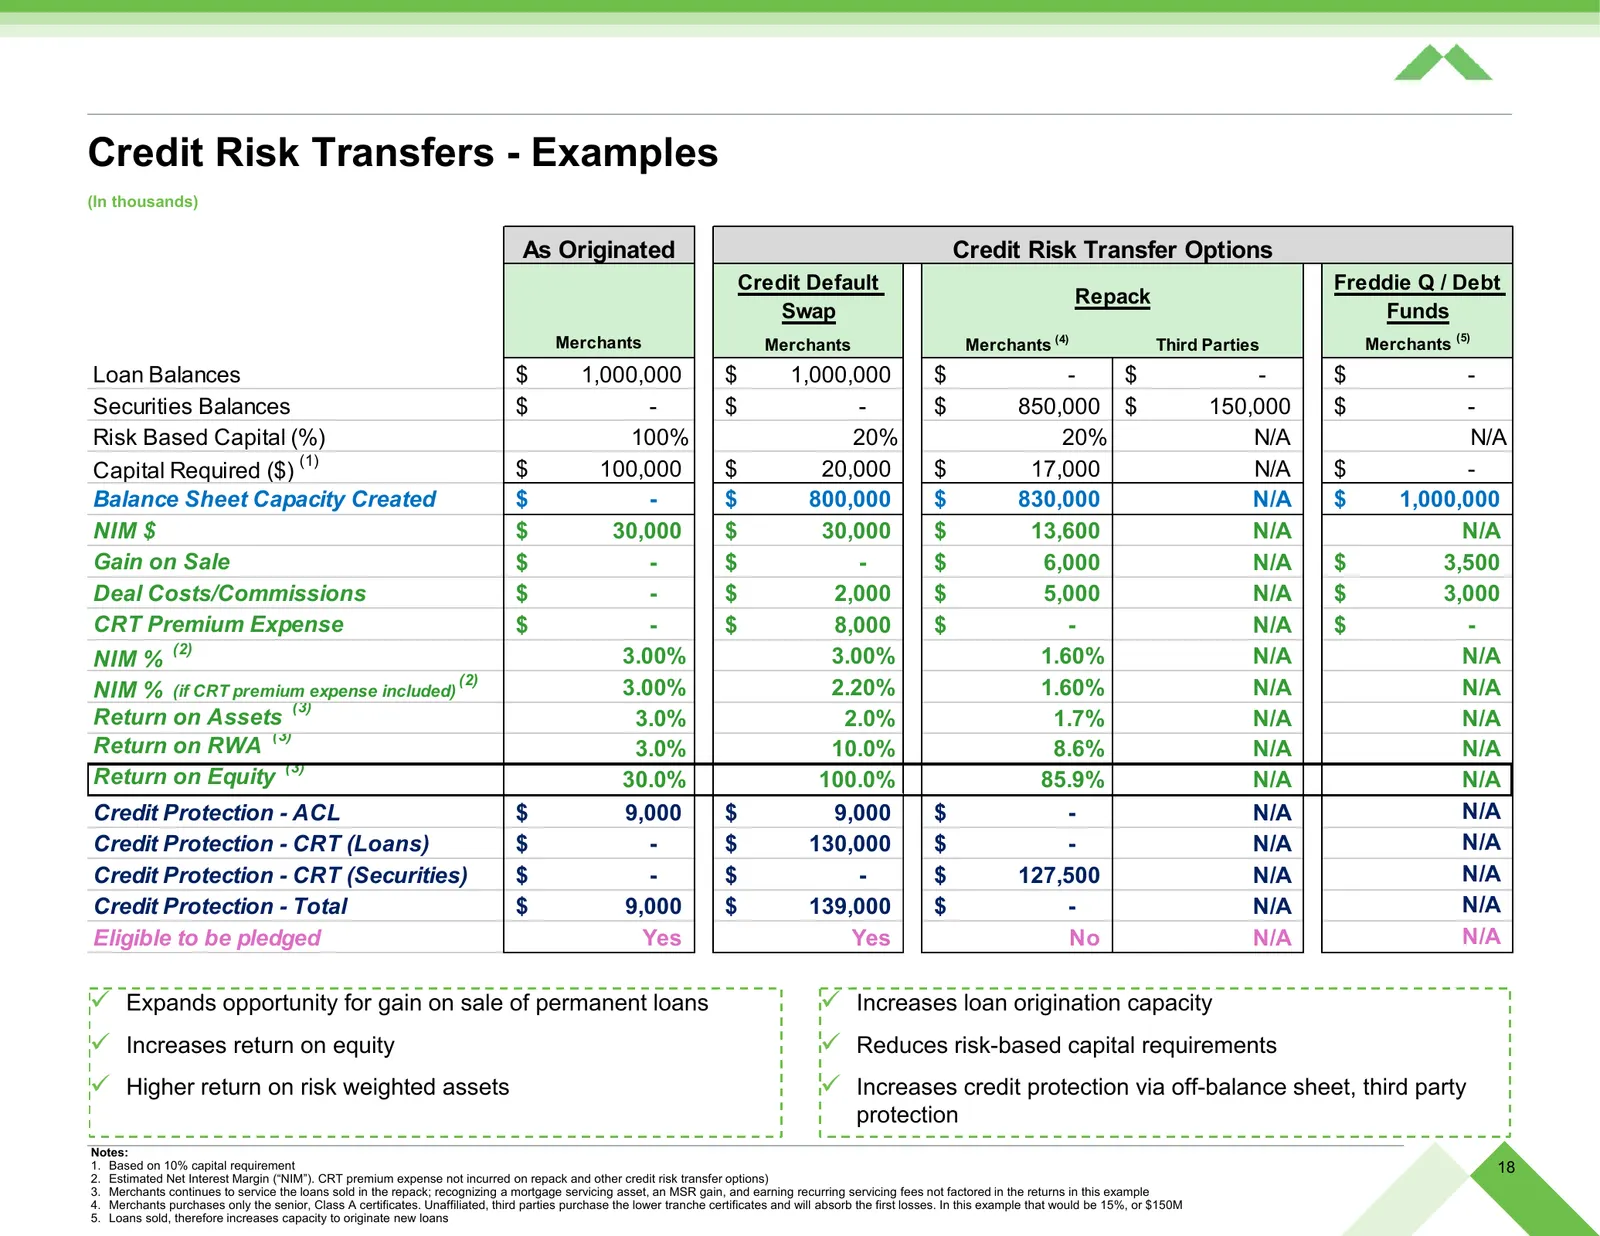
Credit Risk Transfers - Examples (In thousands) As Originated Credit Risk Transfer Options Credit Default Freddie Q / Debt Repack Swap Funds Merchants Merchants Merchants (4) Third Parties Merchants (5) Loan Balances $ 1,000,000 $ 1,000,000 $ - $ - $ - Securities Balances $ - $ - $ 850,000 $ 150,000
Slide 19: High-Quality Securities Portfolio Support Borrowing Capacity
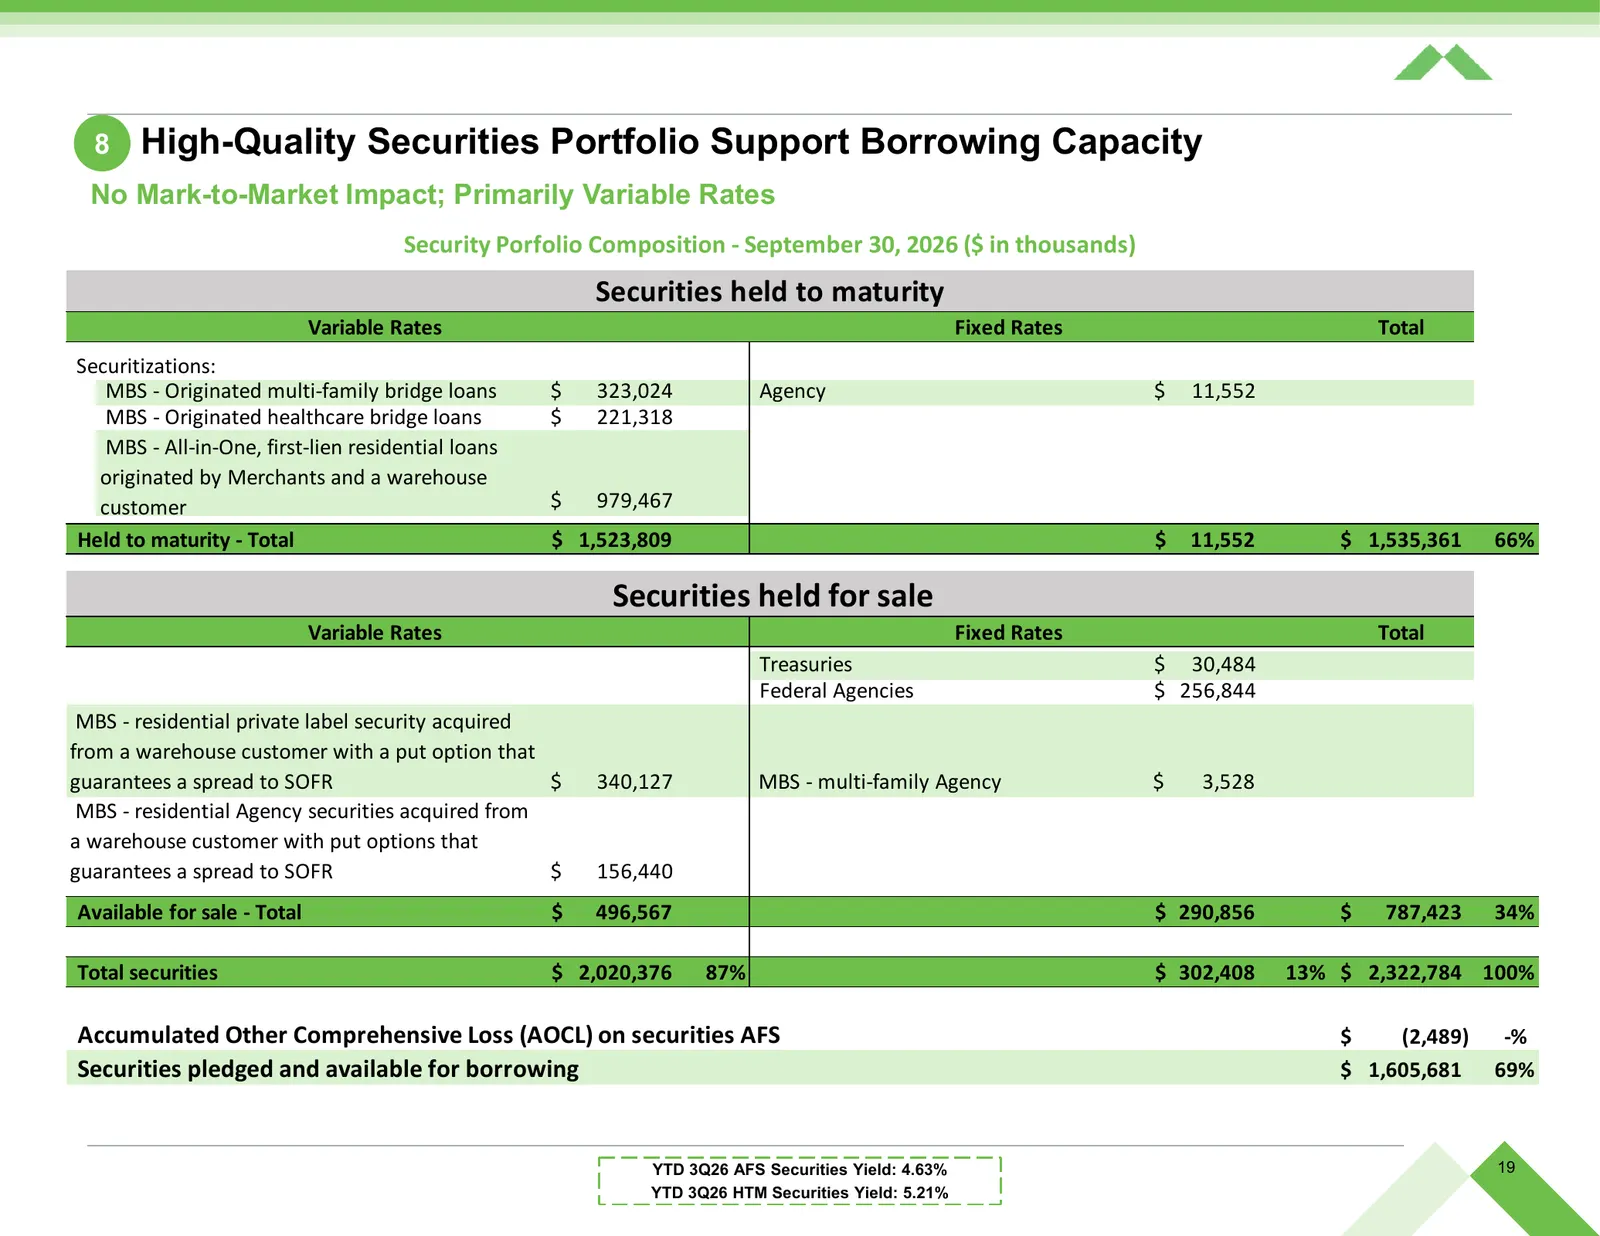
8 High-Quality Securities Portfolio Support Borrowing Capacity No Mark-to-Market Impact; Primarily Variable Rates Security Porfolio Composition - September 30, 2026 ($ in thousands) Securities held to maturity Variable Rates Fixed Rates Total Securitizations: MBS - Originated multi-family bridge loa
Slide 20: Significant Growth Opportunities
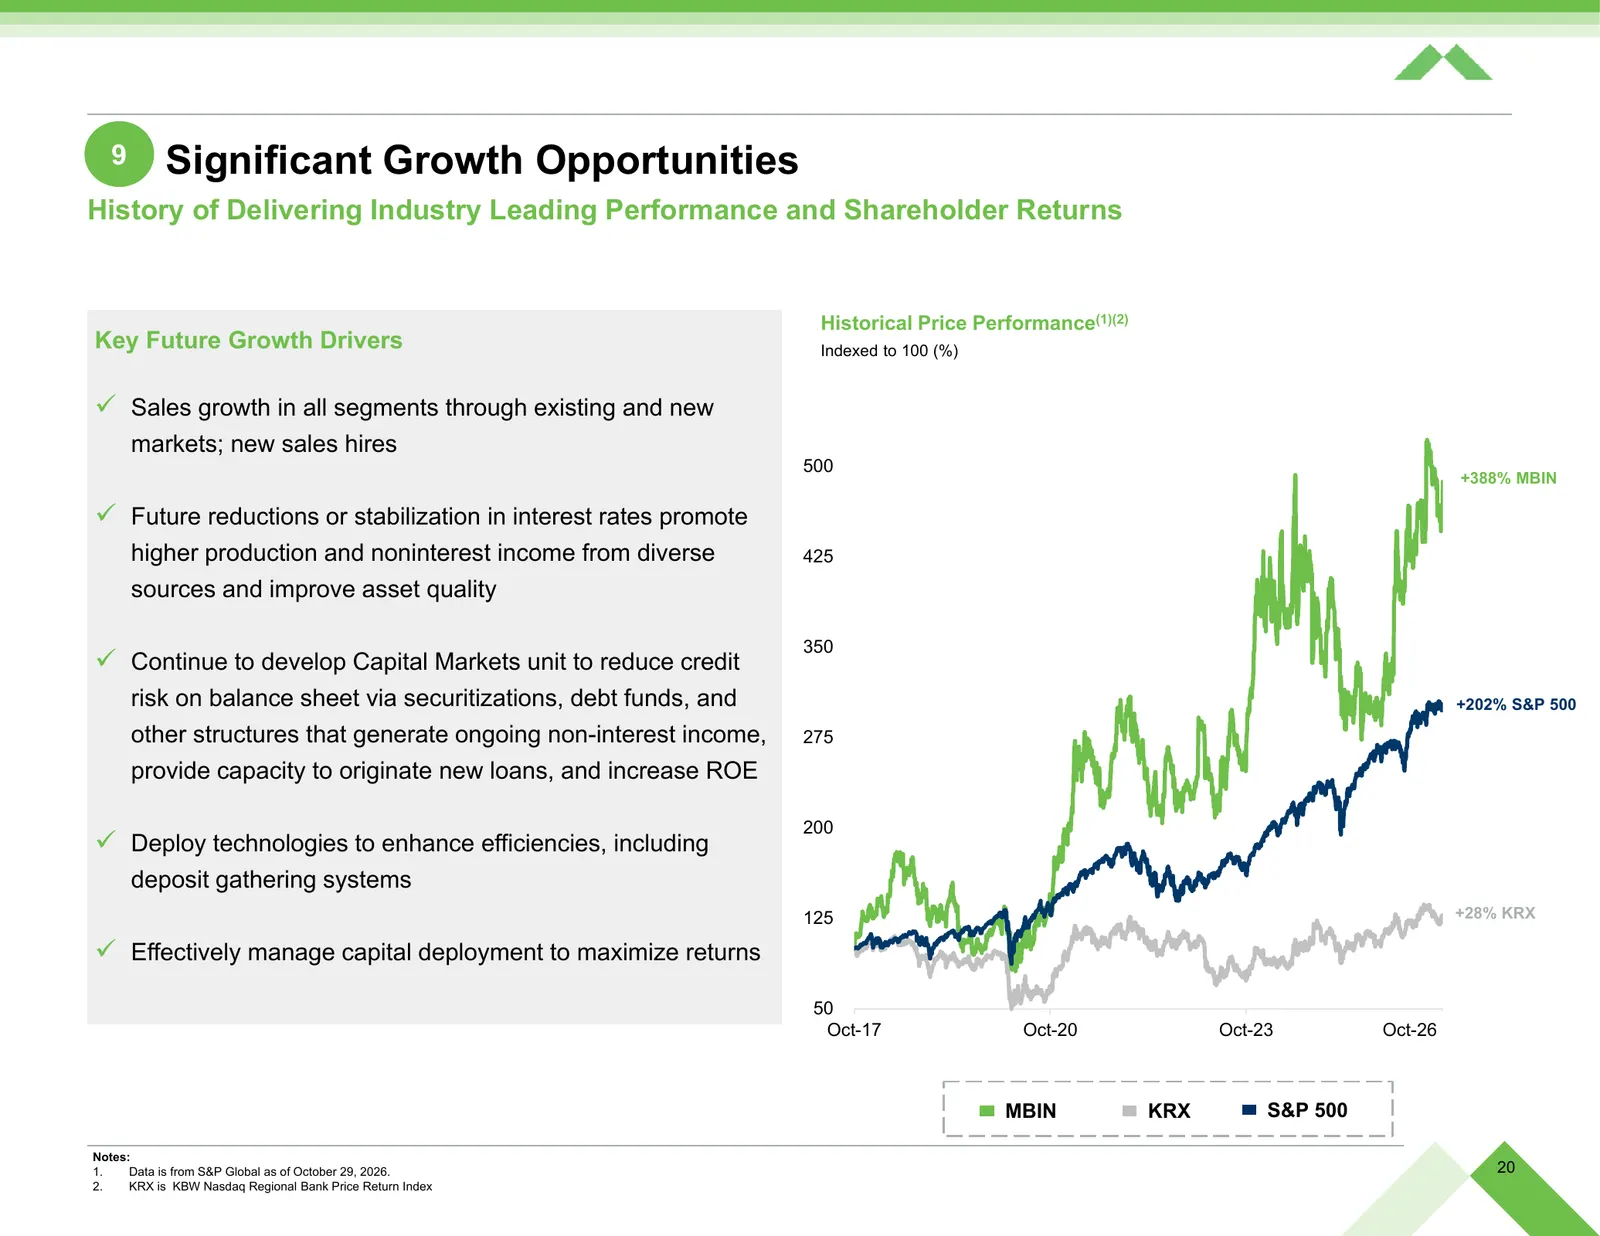
9 Significant Growth Opportunities History of Delivering Industry Leading Performance and Shareholder Returns Historical Price Performance(1)(2) Key Future Growth Drivers Indexed to 100 (%) Sales growth in all segments through existing and new markets; new sales hires 500 +388% MBIN Future reduc

Slide 21: Additional Materials
APPENDIX Additional Materials
Slide 22: History of Merchants Bank of Indiana
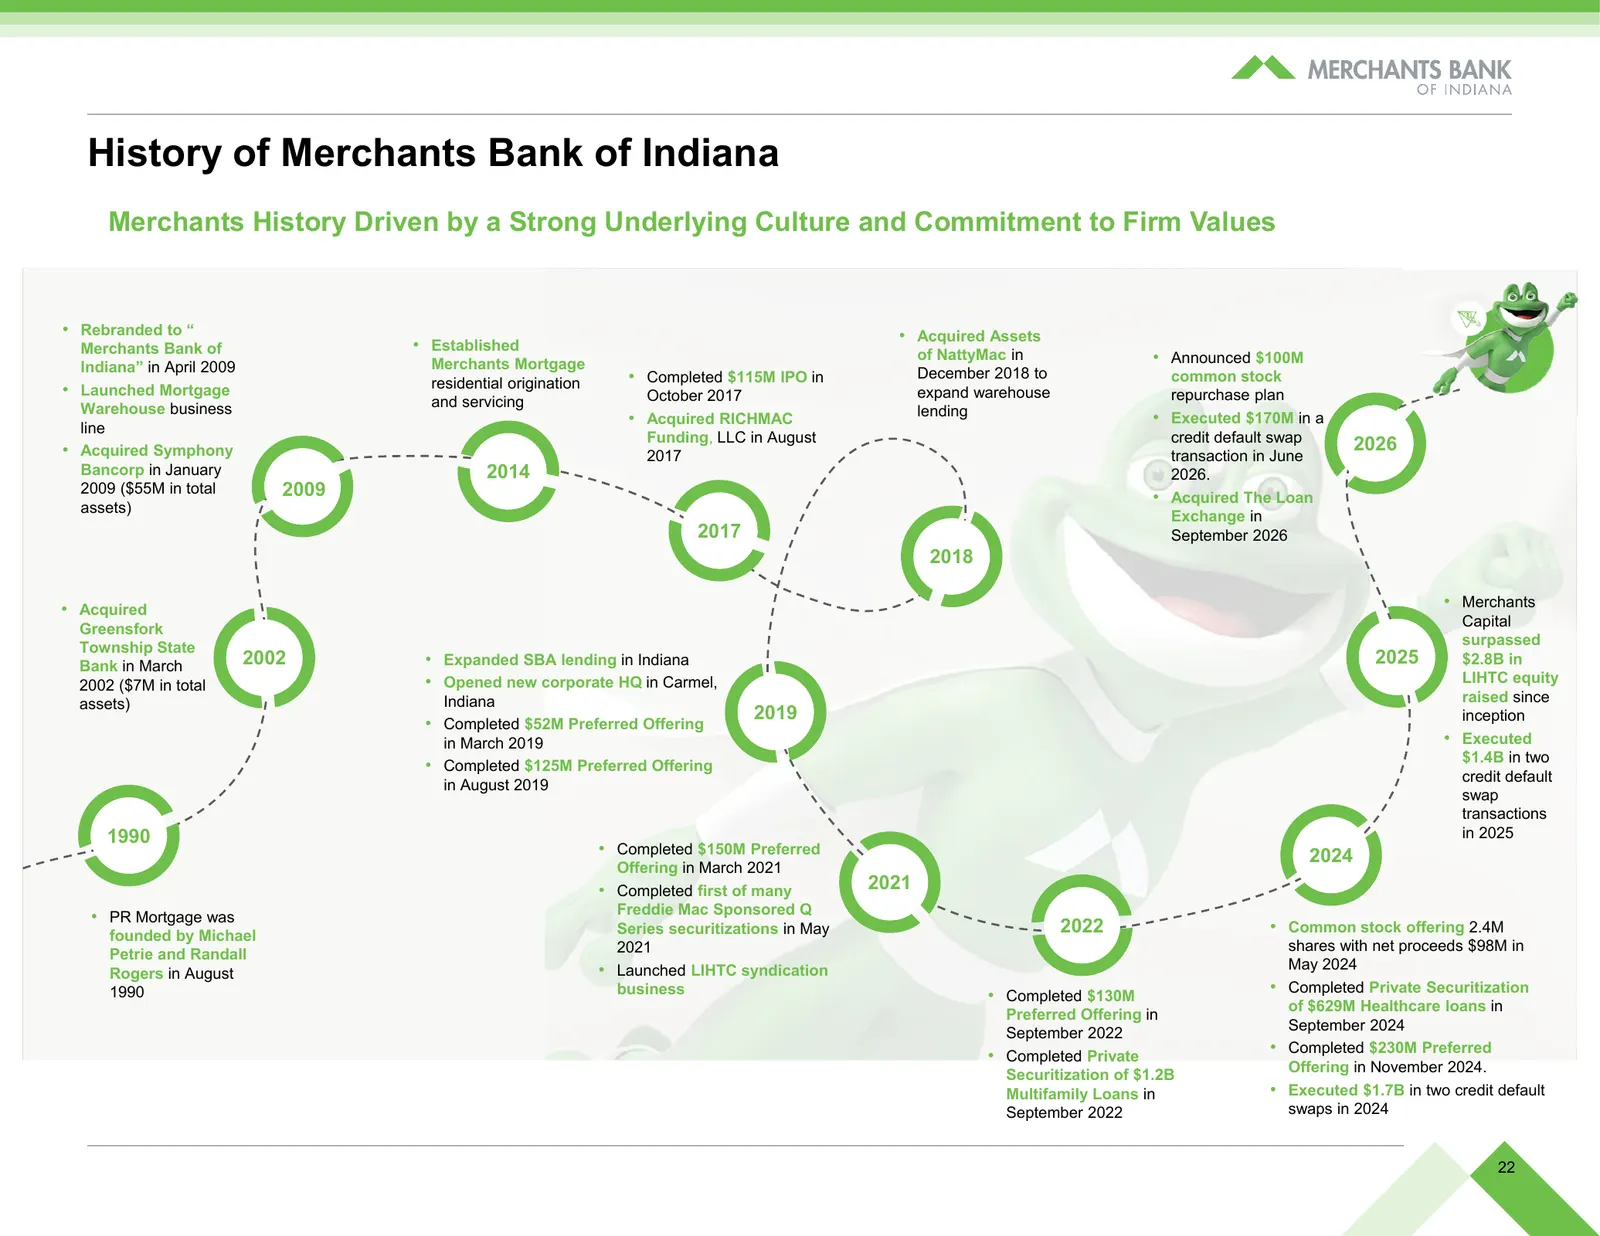
History of Merchants Bank of Indiana Merchants History Driven by a Strong Underlying Culture and Commitment to Firm Values • Rebranded to “ • Acquired Assets Merchants Bank of • Established of NattyMac in • Announced $100M Indiana” in April 2009 Merchants Mortgage • Completed $115M IPO in December 2
Slide 23: Recent Awards and Accolades
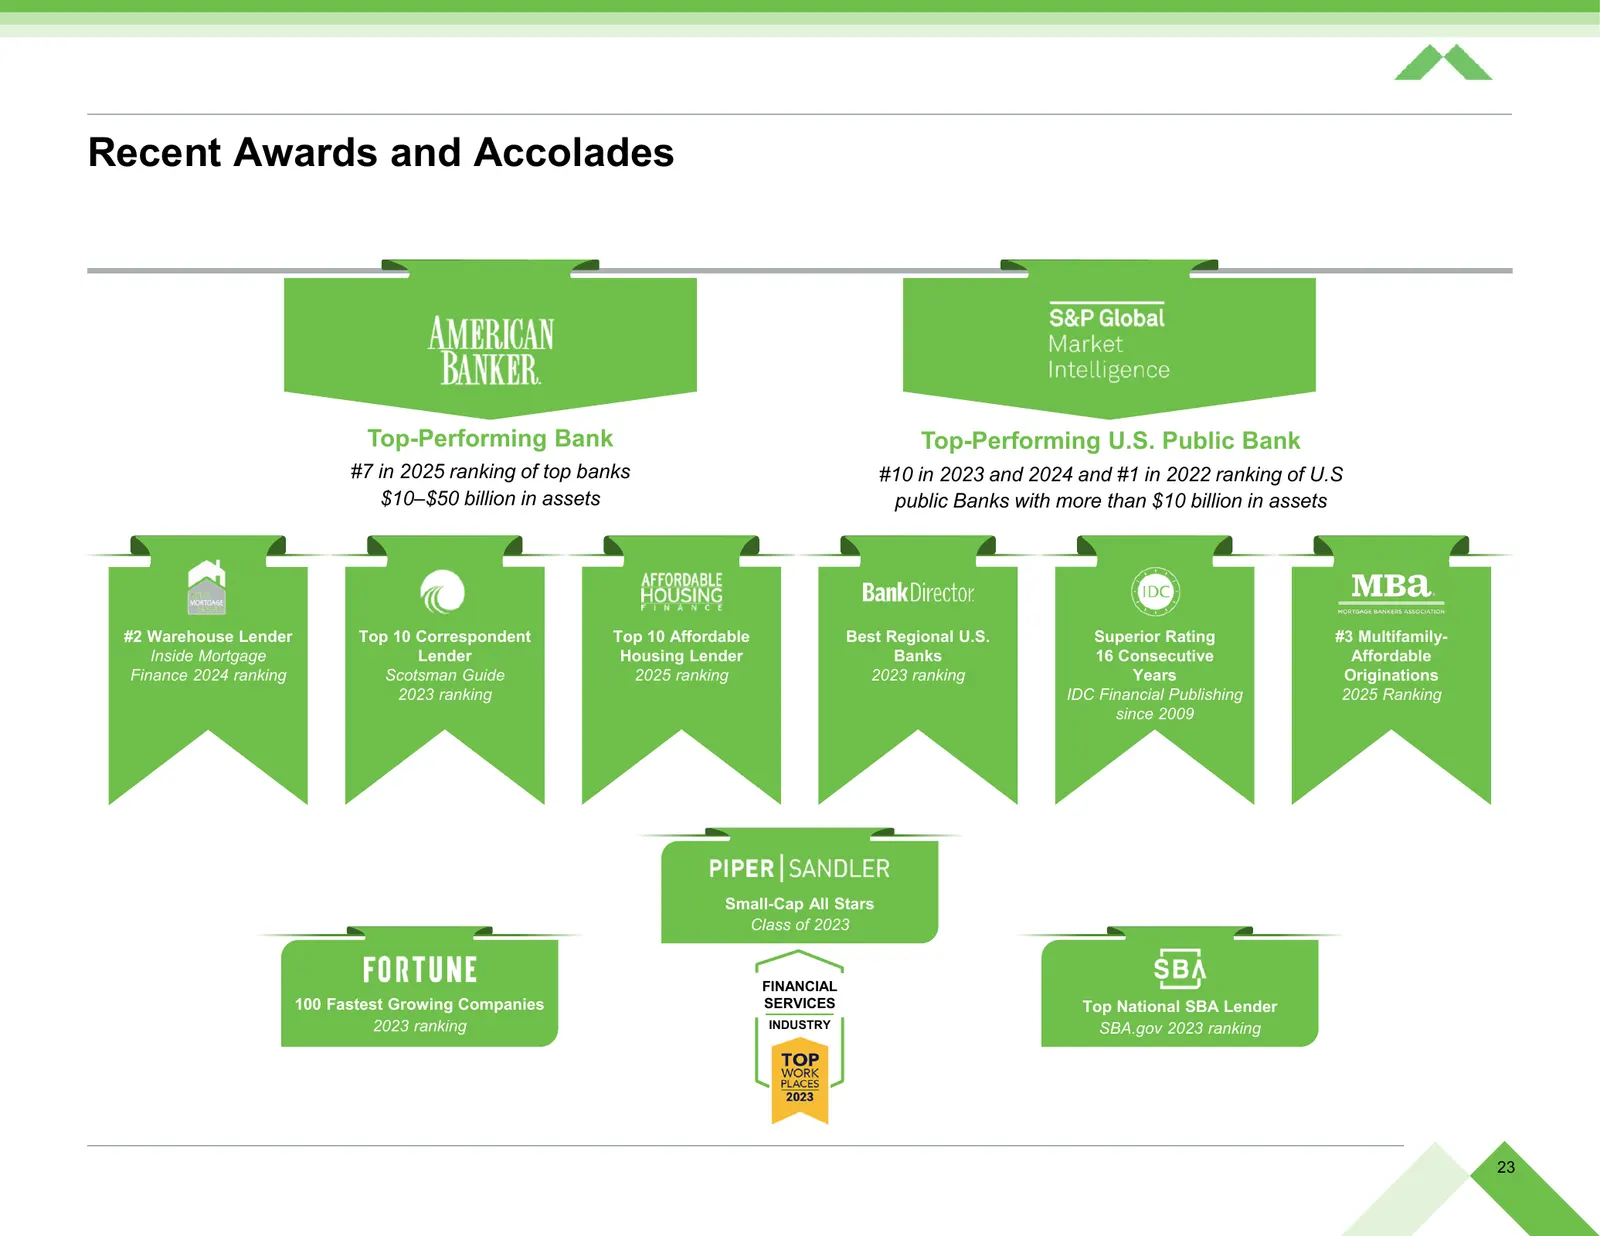
Recent Awards and Accolades Top-Performing Bank Top-Performing U.S. Public Bank #7 in 2025 ranking of top banks #10 in 2023 and 2024 and #1 in 2022 ranking of U.S $10–$50 billion in assets public Banks with more than $10 billion in assets #2 Warehouse Lender Top 10 Correspondent Top 10 Affordable Be
Slide 24: Overview of the Management Team
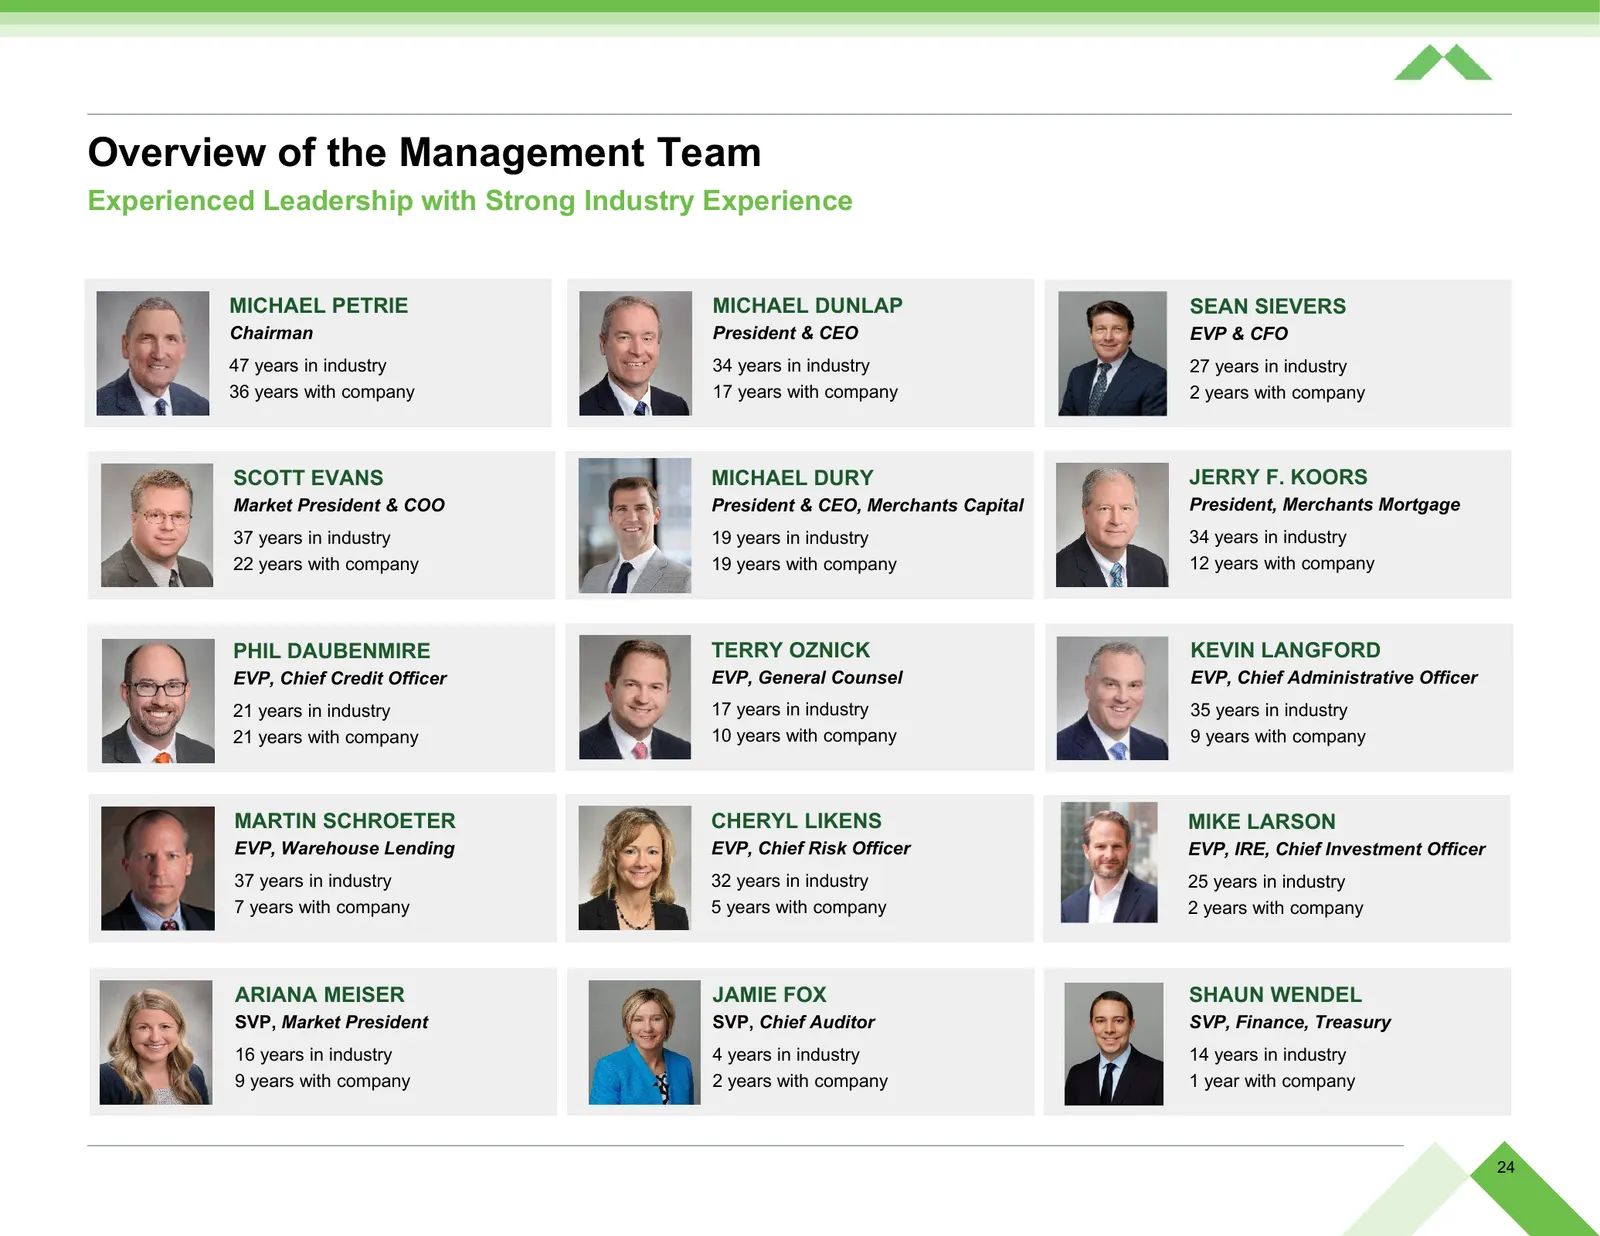
Overview of the Management Team Experienced Leadership with Strong Industry Experience MICHAEL PETRIE MICHAEL DUNLAP SEAN SIEVERS Chairman President & CEO EVP & CFO 47 years in industry 34 years in industry 27 years in industry 36 years with company 17 years with company 2 years with company SCOTT E
Slide 25: Overview of the Board of Directors
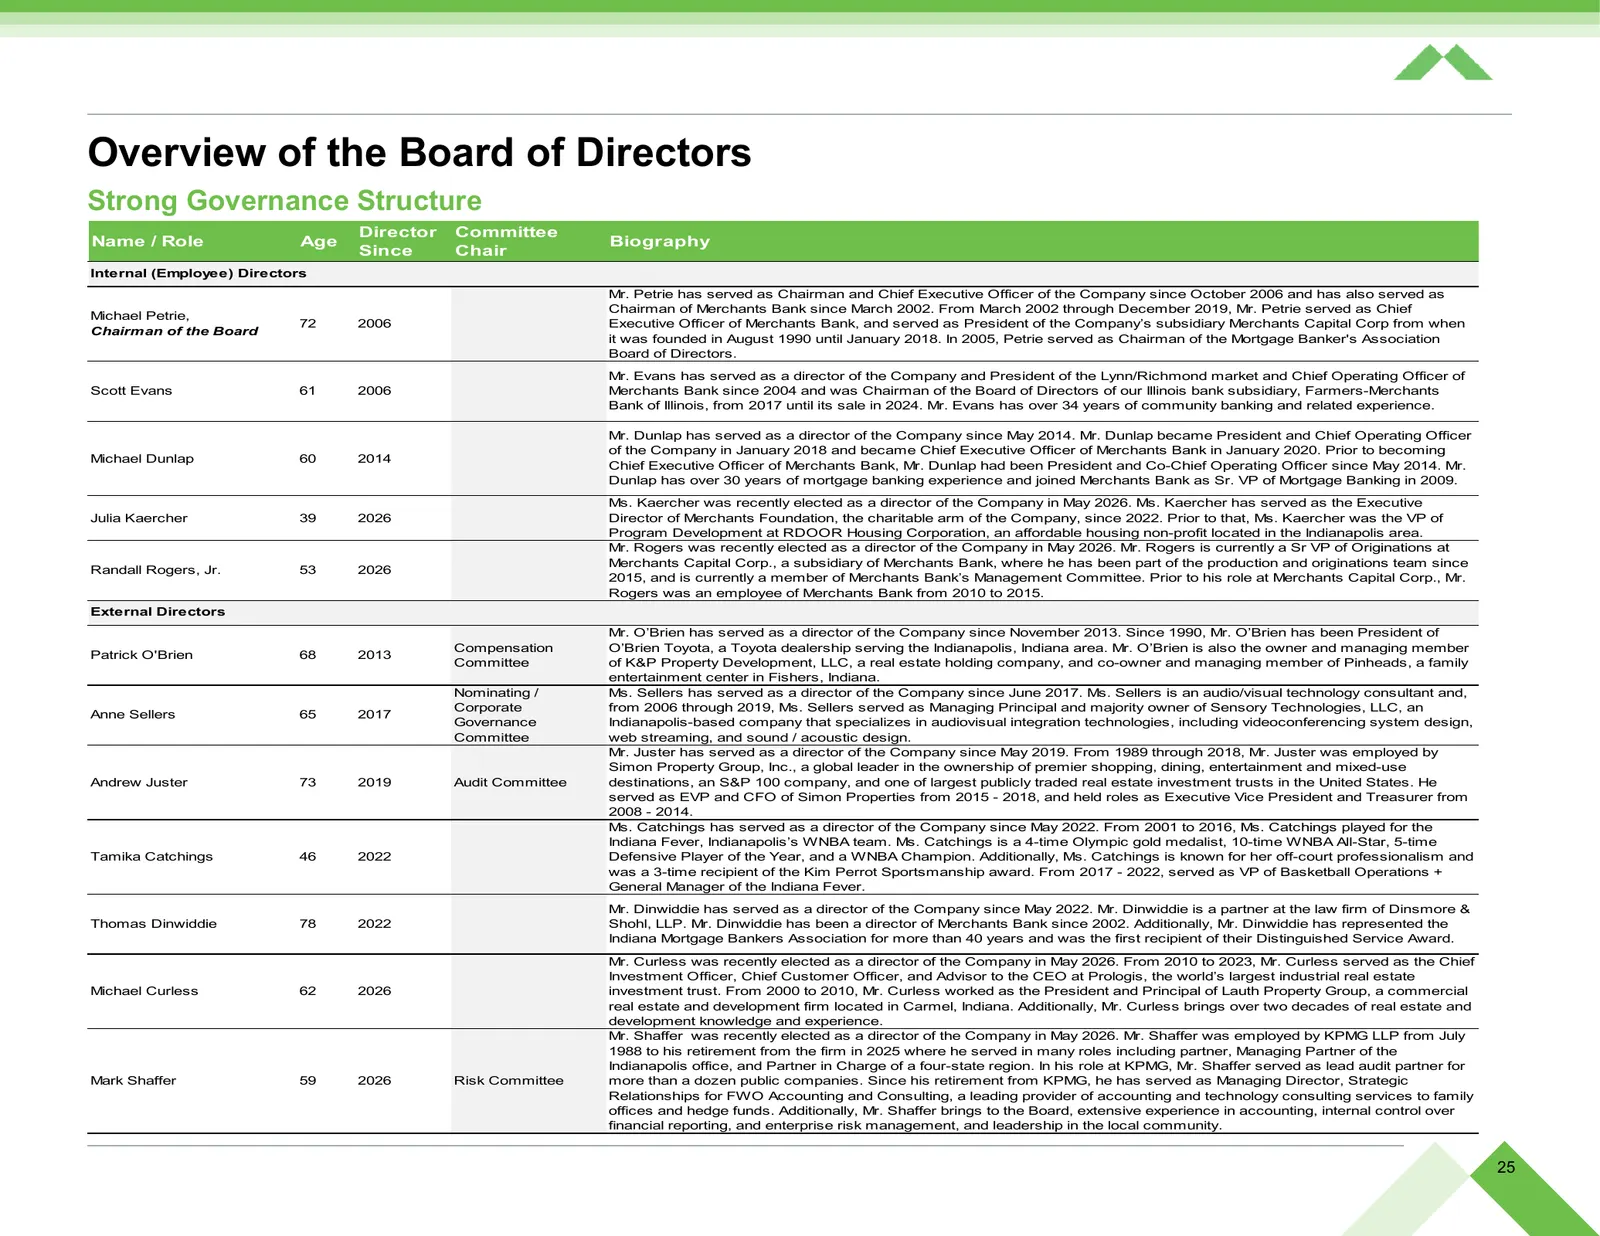
Overview of the Board of Directors Strong Governance Structure Director Committee Name / Role Age Biography Since Chair Internal (Employee) Directors Mr. Petrie has served as Chairman and Chief Executive Officer of the Company since October 2006 and has also served as Chairman of Merchants Bank sinc
Slide 26: Financial Position: Key Highlights
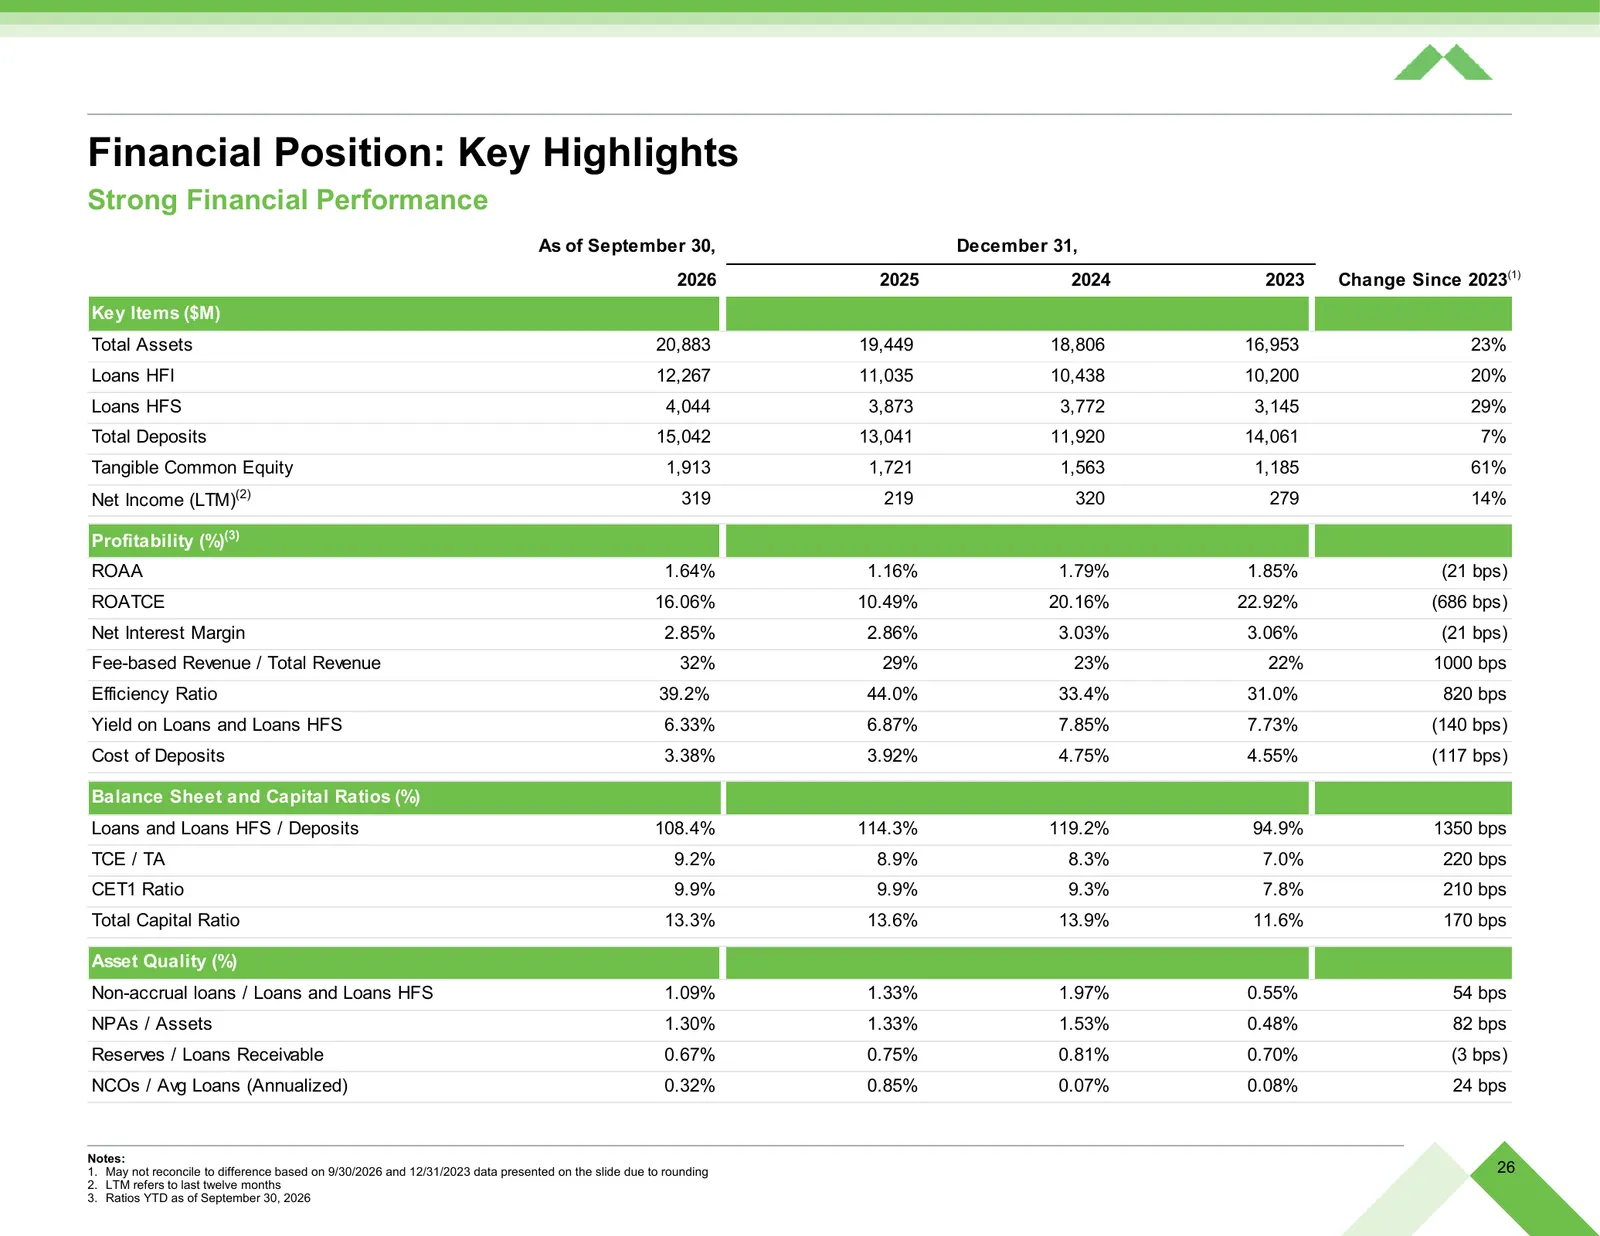
Financial Position: Key Highlights Strong Financial Performance As of September 30, December 31, 2026 2025 2024 2023 Change Since 2023(1) Key Items ($M) Total Assets 20,883 19,449 18,806 16,953 23% Loans HFI 12,267 11,035 10,438 10,200 20% Loans HFS 4,044 3,873 3,772 3,145 29% Total Deposits 15,042
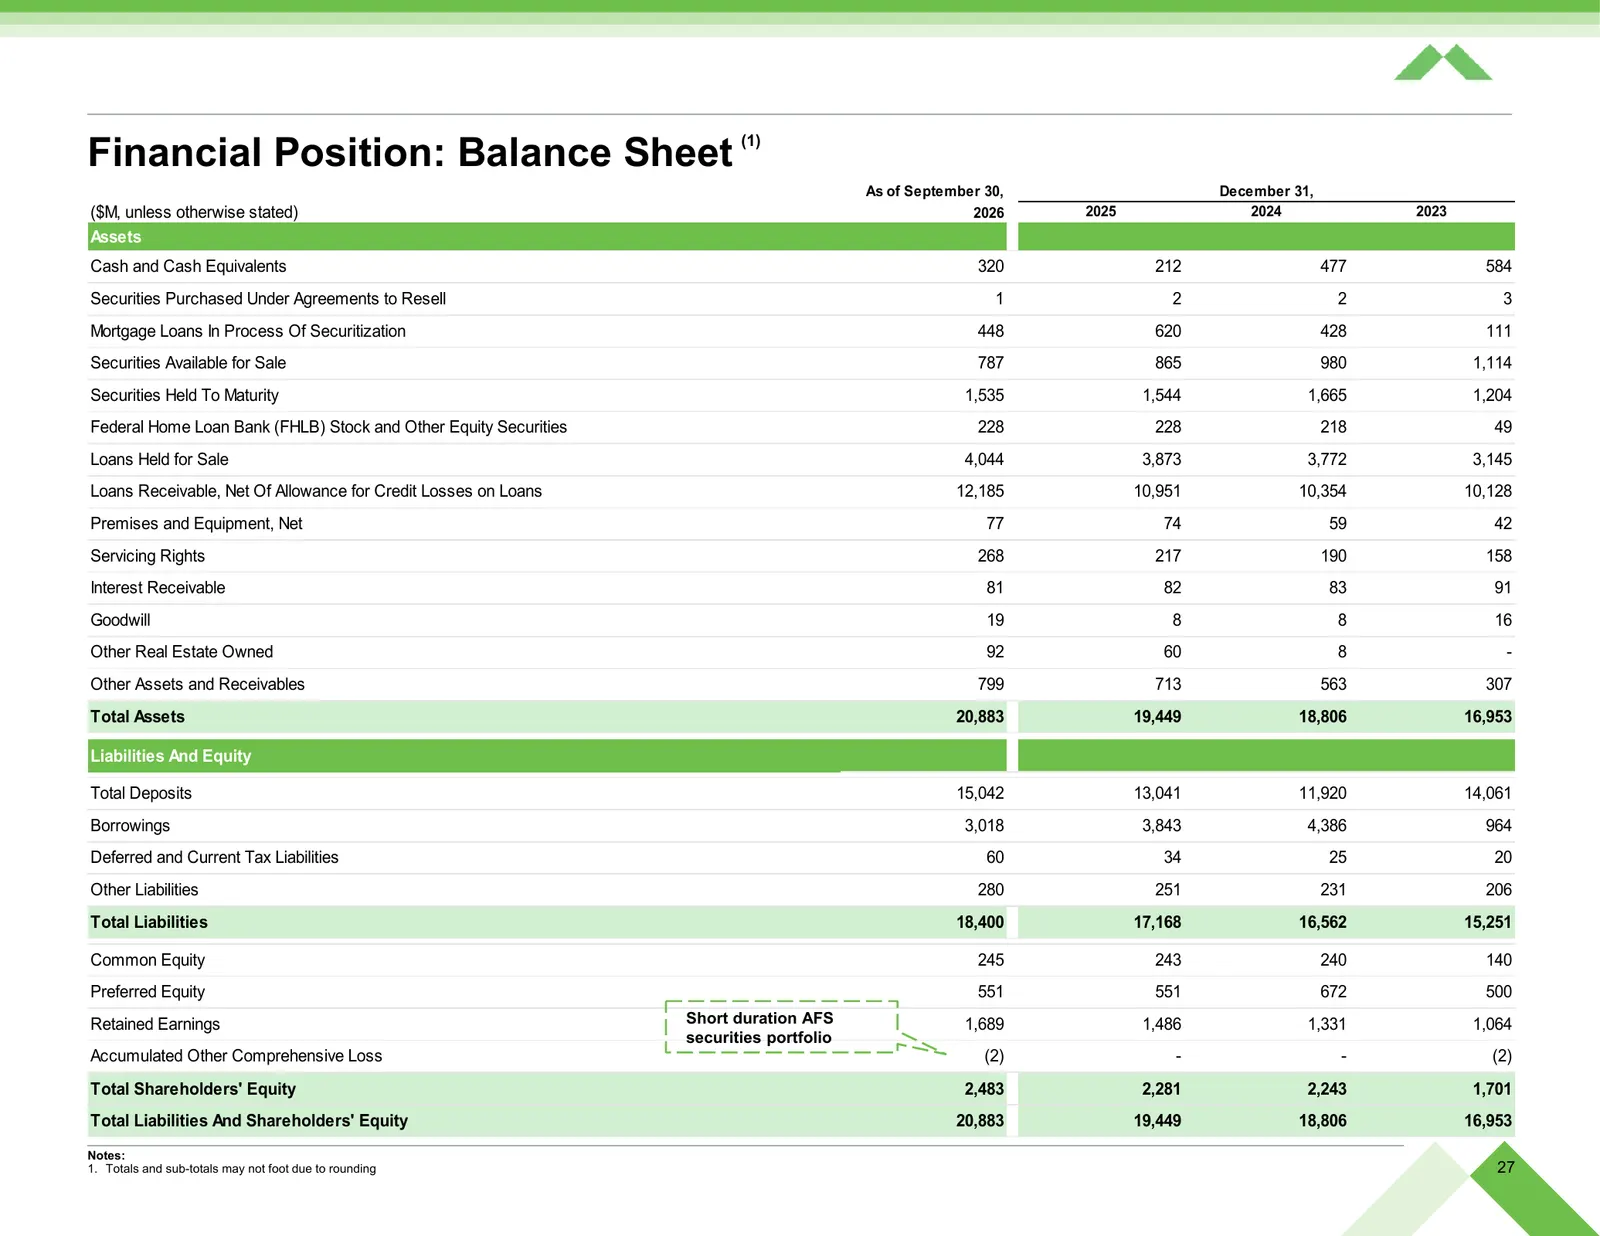
Slide 27: Financial Position: Balance Sheet
Financial Position: Balance Sheet (1) As of September 30, December 31, ($M, unless otherwise stated) 2026 2025 2024 2023 Assets Cash and Cash Equivalents 320 212 477 584 Securities Purchased Under Agreements to Resell 1 2 2 3 Mortgage Loans In Process Of Securitization 448 620 428 111 Securities Ava
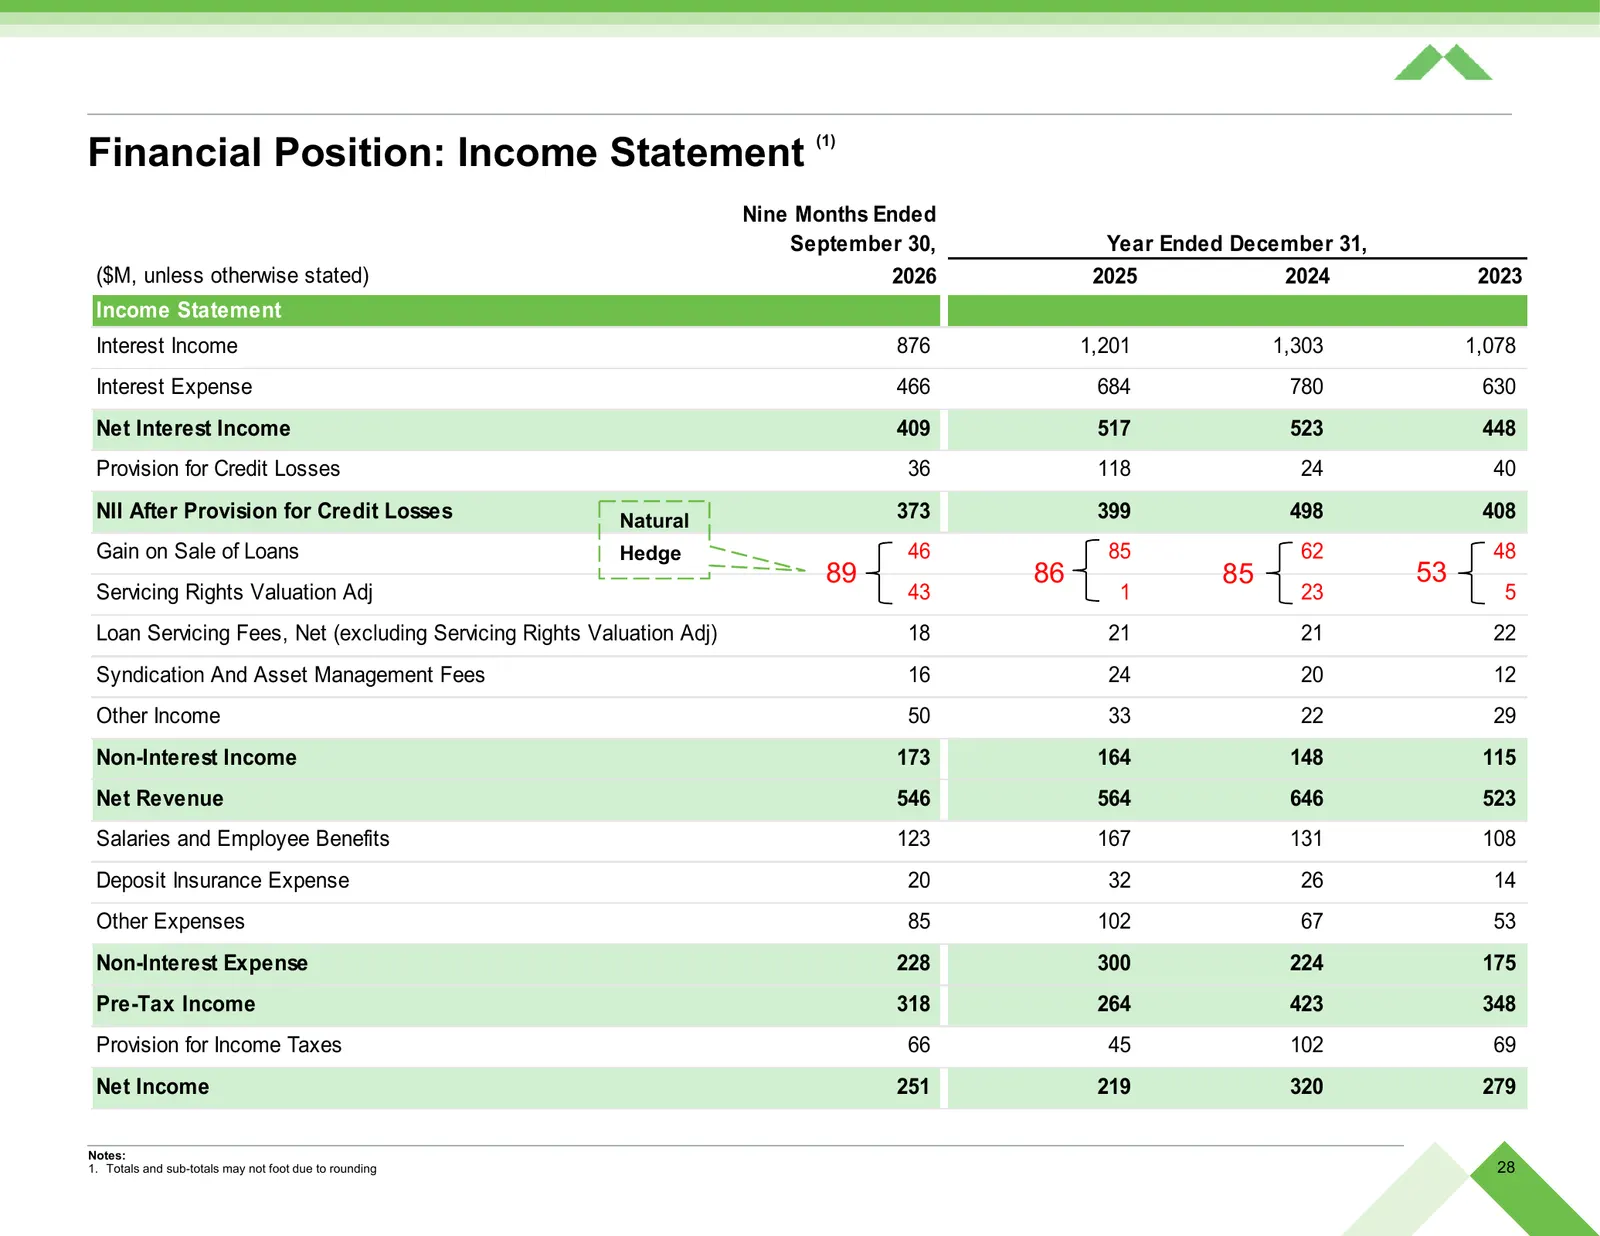
Slide 28: Financial Position: Income Statement
Financial Position: Income Statement (1) Nine Months Ended September 30, Year Ended December 31, ($M, unless otherwise stated) 2026 2025 2024 2023 Income Statement Interest Income 876 1,201 1,303 1,078 Interest Expense 466 684 780 630 Net Interest Income 409 517 523 448 Provision for Credit Losses 3
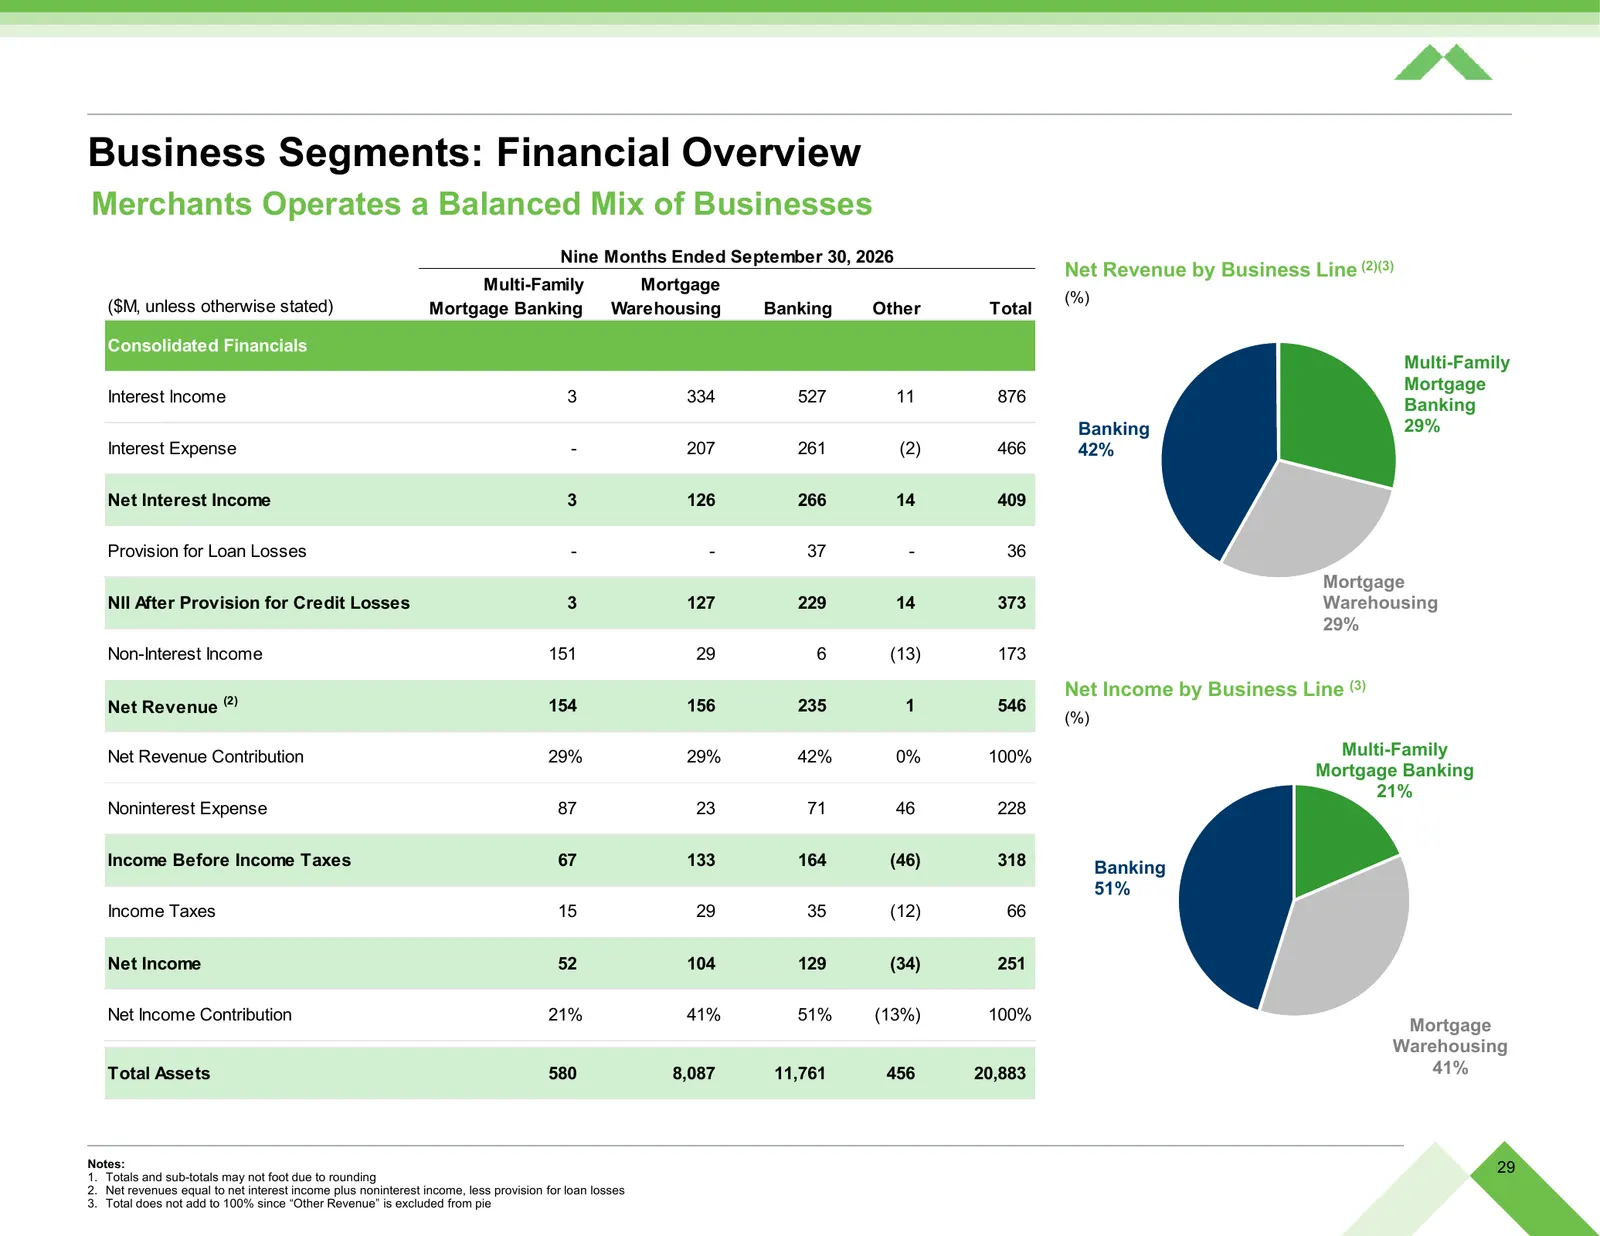
Slide 29: Business Segments: Financial Overview
Business Segments: Financial Overview Merchants Operates a Balanced Mix of Businesses Nine Months Ended September 30, 2026 Net Revenue by Business Line (2)(3) Multi-Family Mortgage (%) ($M, unless otherwise stated) Mortgage Banking Warehousing Banking Other Total (1) Consolidated Financials Multi-Fa
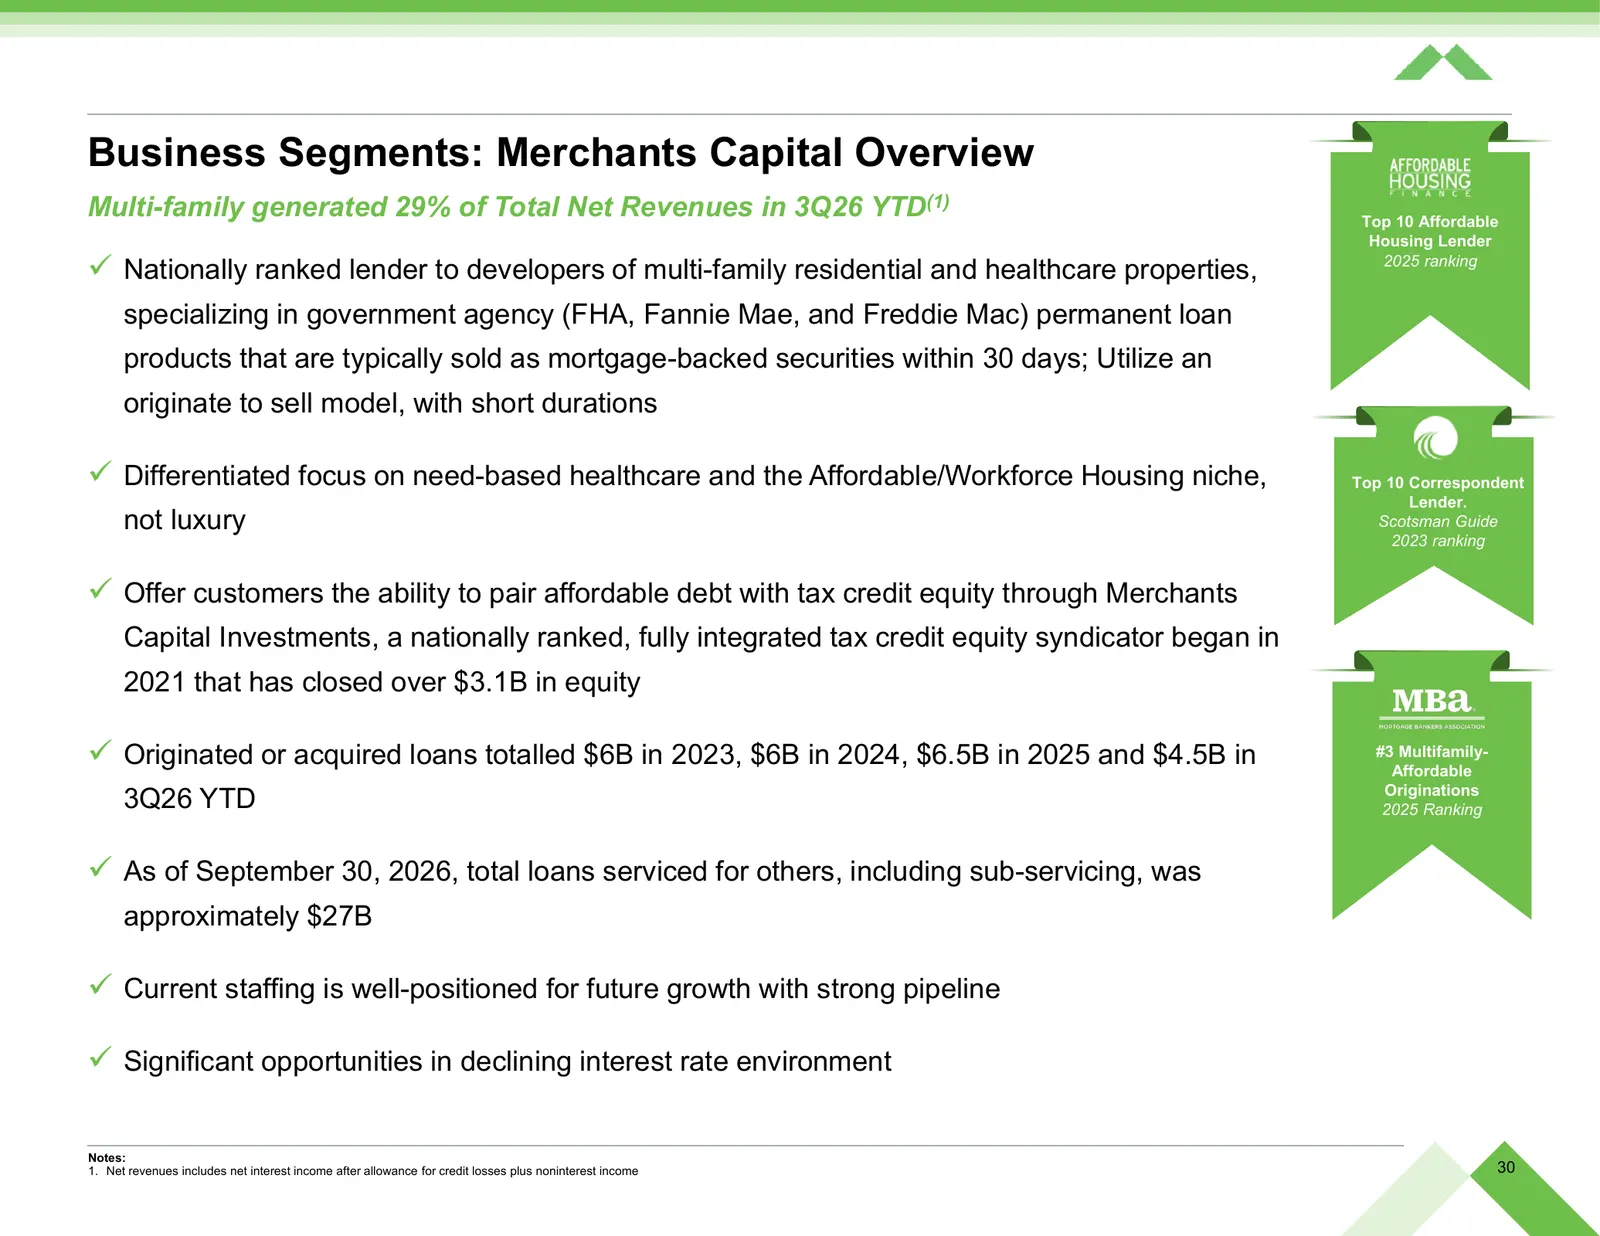
Slide 30: Business Segments: Merchants Capital Overview
Business Segments: Merchants Capital Overview Multi-family generated 29% of Total Net Revenues in 3Q26 YTD(1) Top 10 Affordable Housing Lender Nationally ranked lender to developers of multi-family residential and healthcare properties, 2025 ranking specializing in government agency (FHA, Fannie M
Slide 31: Business Segments: Warehouse Overview
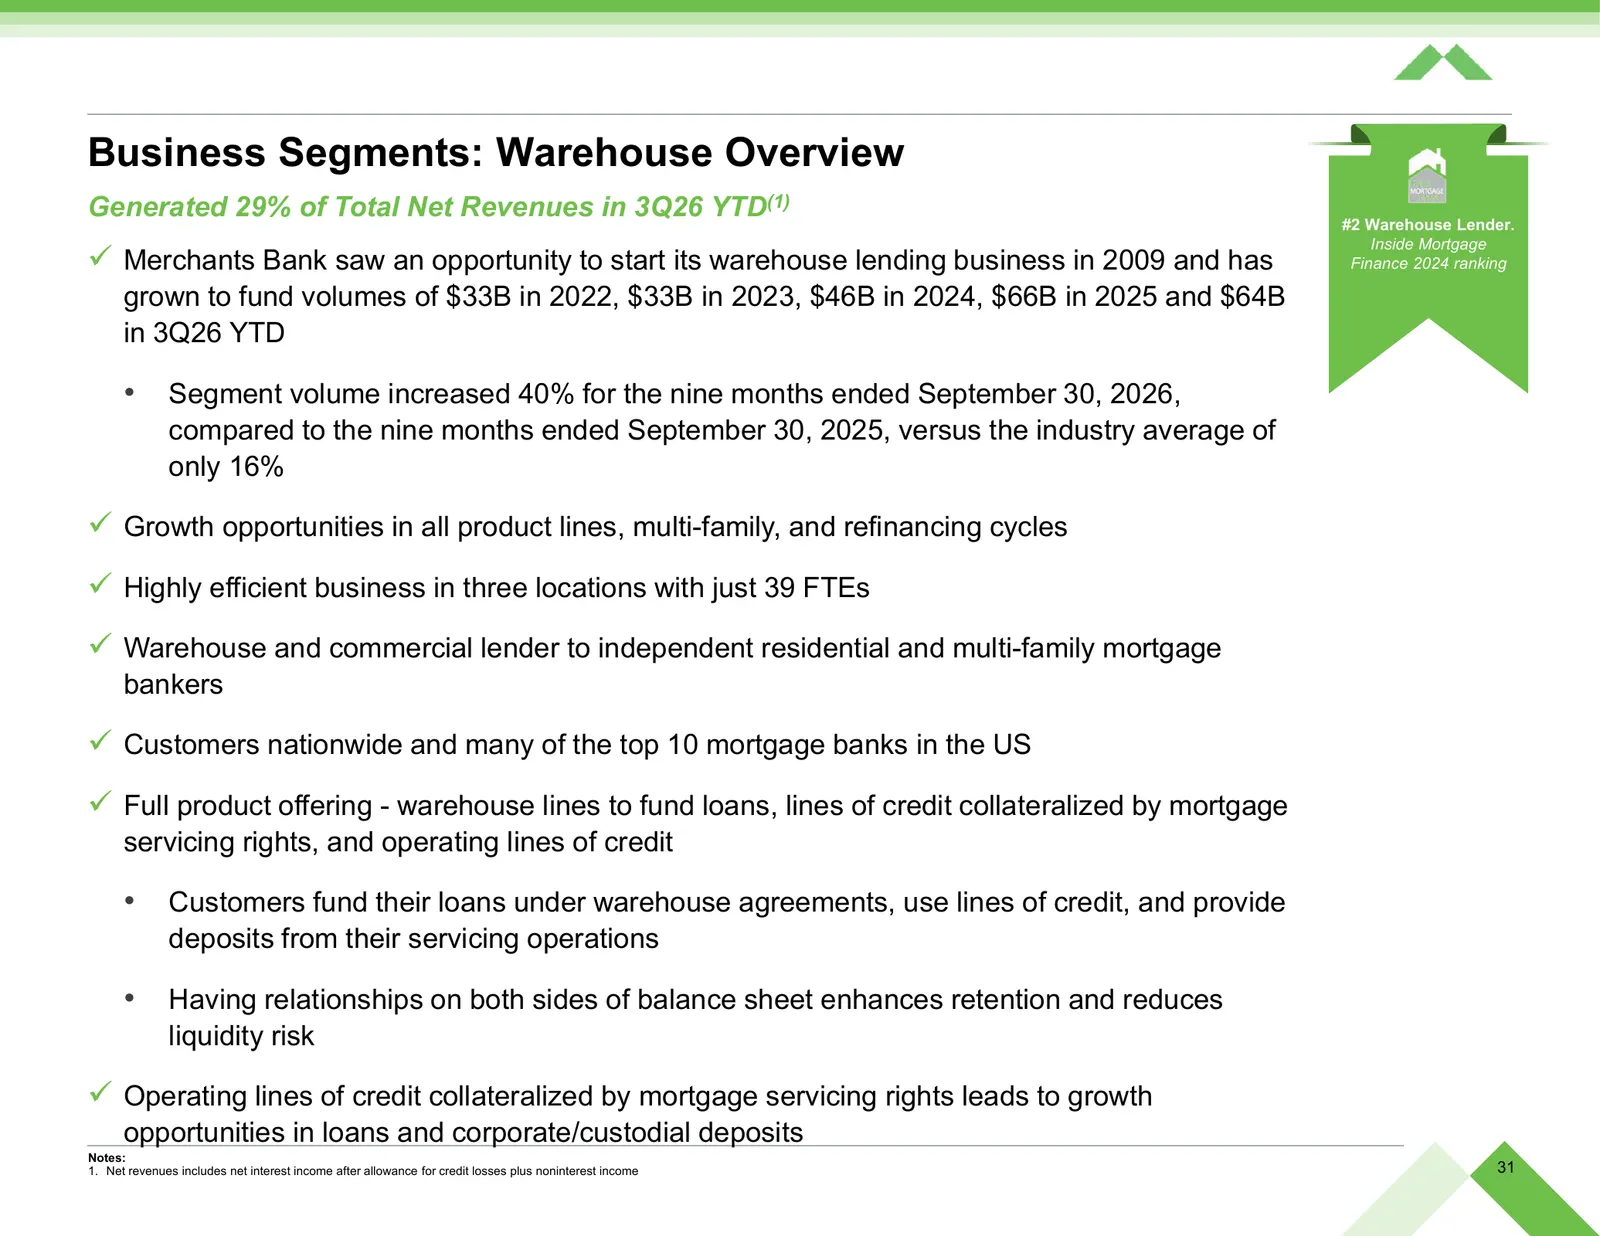
Business Segments: Warehouse Overview Generated 29% of Total Net Revenues in 3Q26 YTD(1) #2 Warehouse Lender. Inside Mortgage Merchants Bank saw an opportunity to start its warehouse lending business in 2009 and has Finance 2024 ranking grown to fund volumes of $33B in 2022, $33B in 2023, $46B in
Slide 32: Business Segments: Banking Overview (1 of 2)
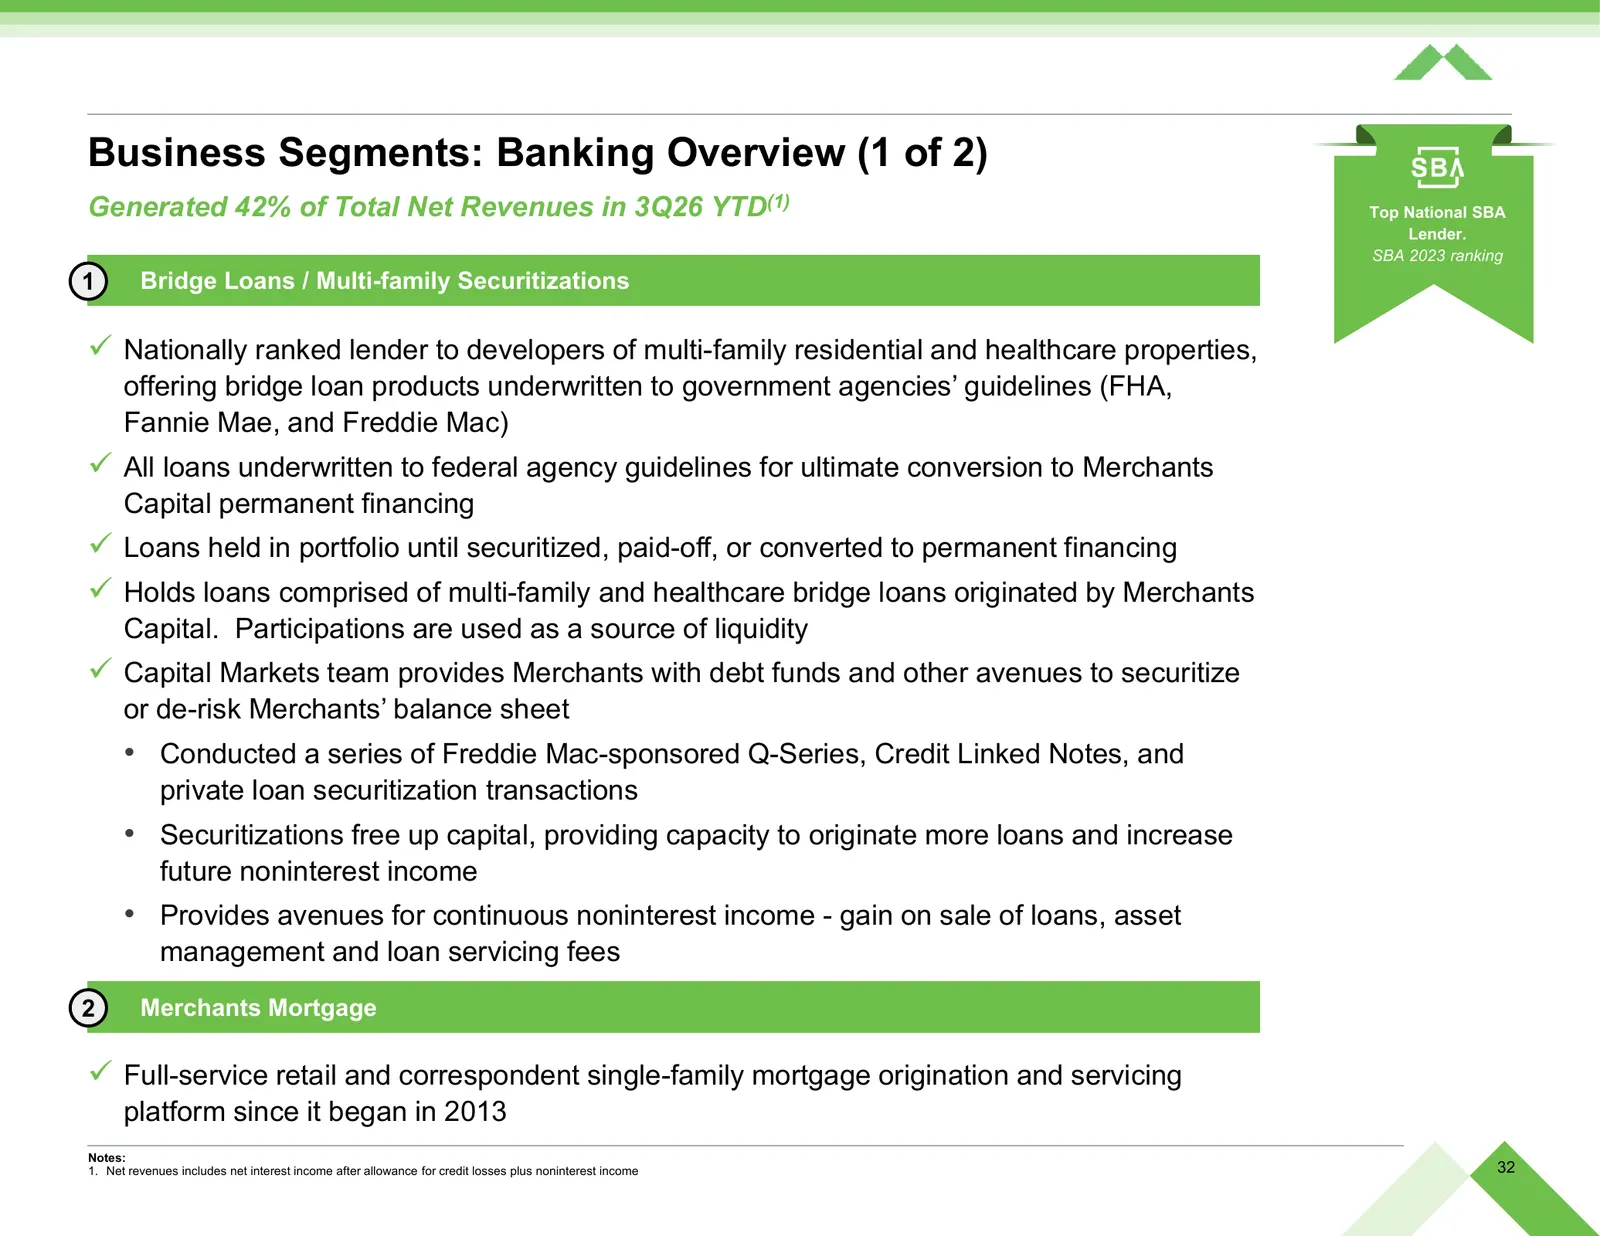
Business Segments: Banking Overview (1 of 2) Generated 42% of Total Net Revenues in 3Q26 YTD(1) Top National SBA Lender. SBA 2023 ranking 1 Bridge Loans / Multi-family Securitizations Nationally ranked lender to developers of multi-family residential and healthcare properties, offering bridge loan
Slide 33: Business Segments: Banking Overview (2 of 2)
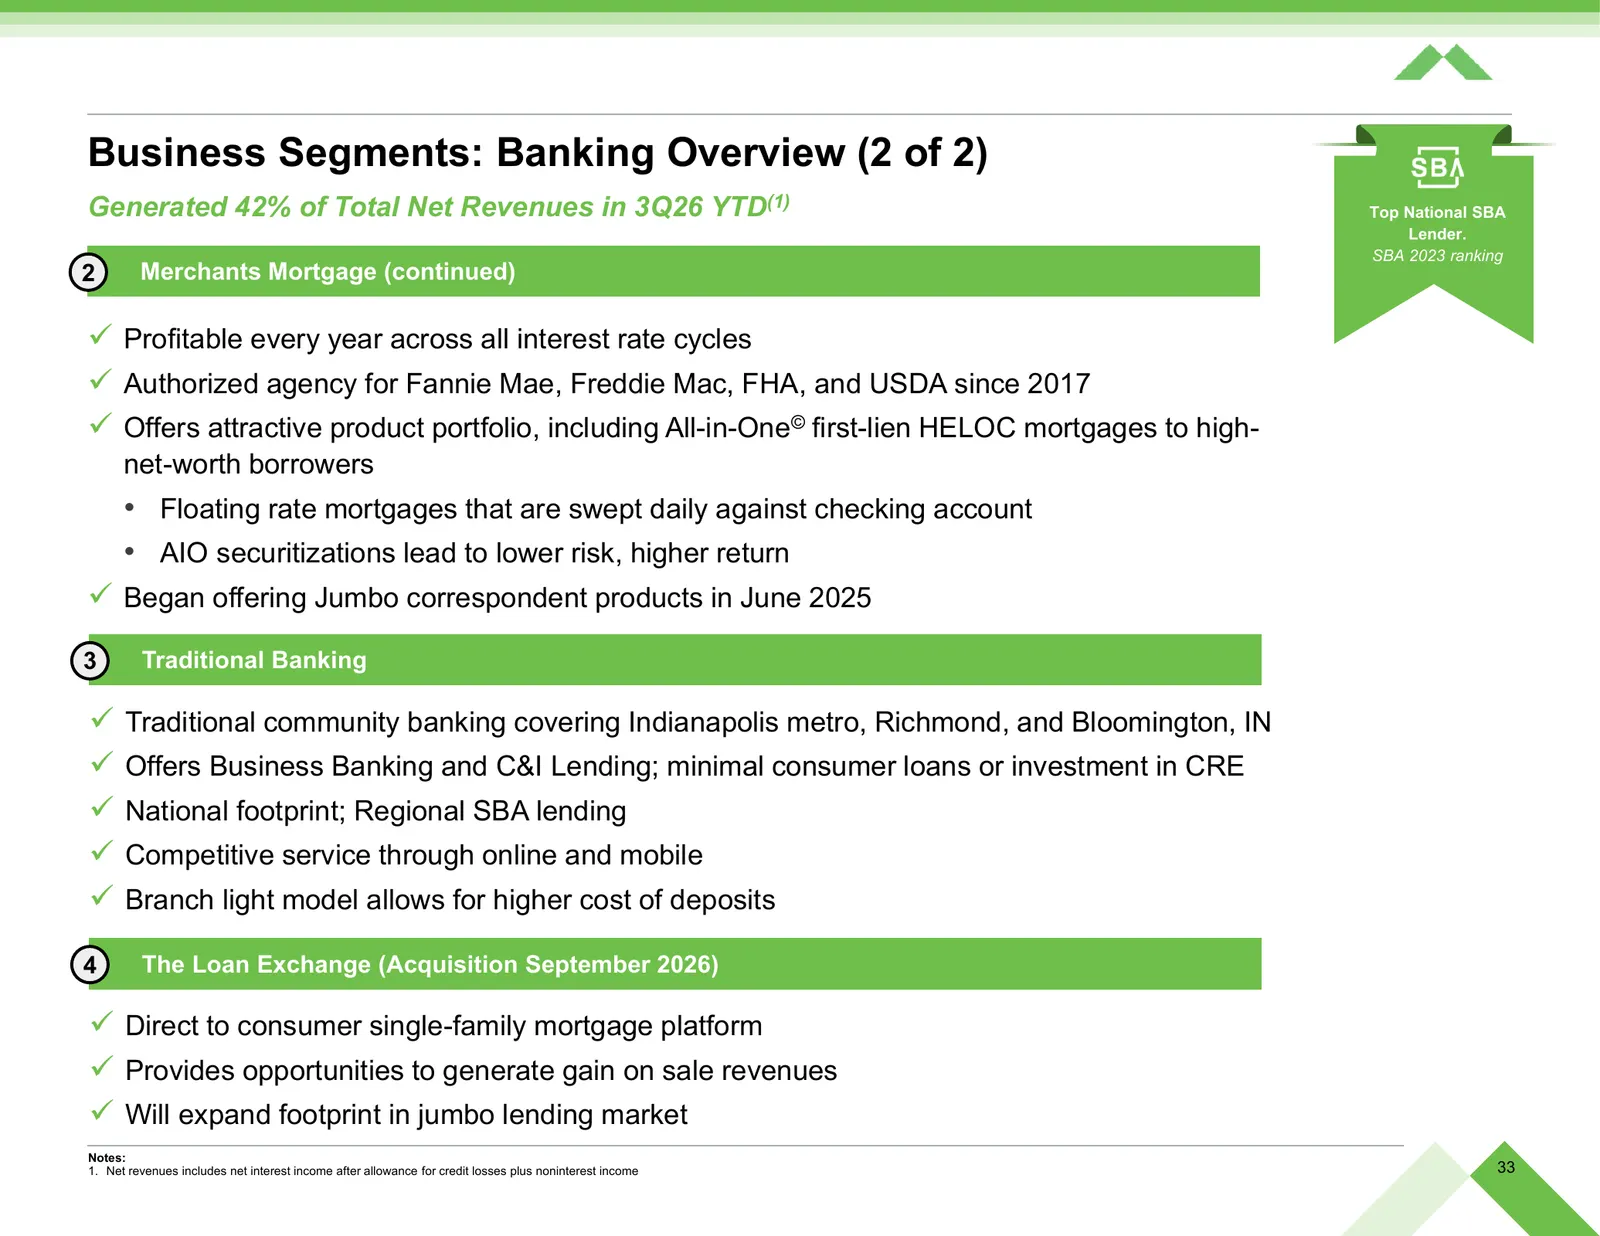
Business Segments: Banking Overview (2 of 2) Generated 42% of Total Net Revenues in 3Q26 YTD(1) Top National SBA Lender. SBA 2023 ranking 2 Merchants Mortgage (continued) Profitable every year across all interest rate cycles Authorized agency for Fannie Mae, Freddie Mac, FHA, and USDA since 2017
Slide 34: Non-GAAP Reconciliation
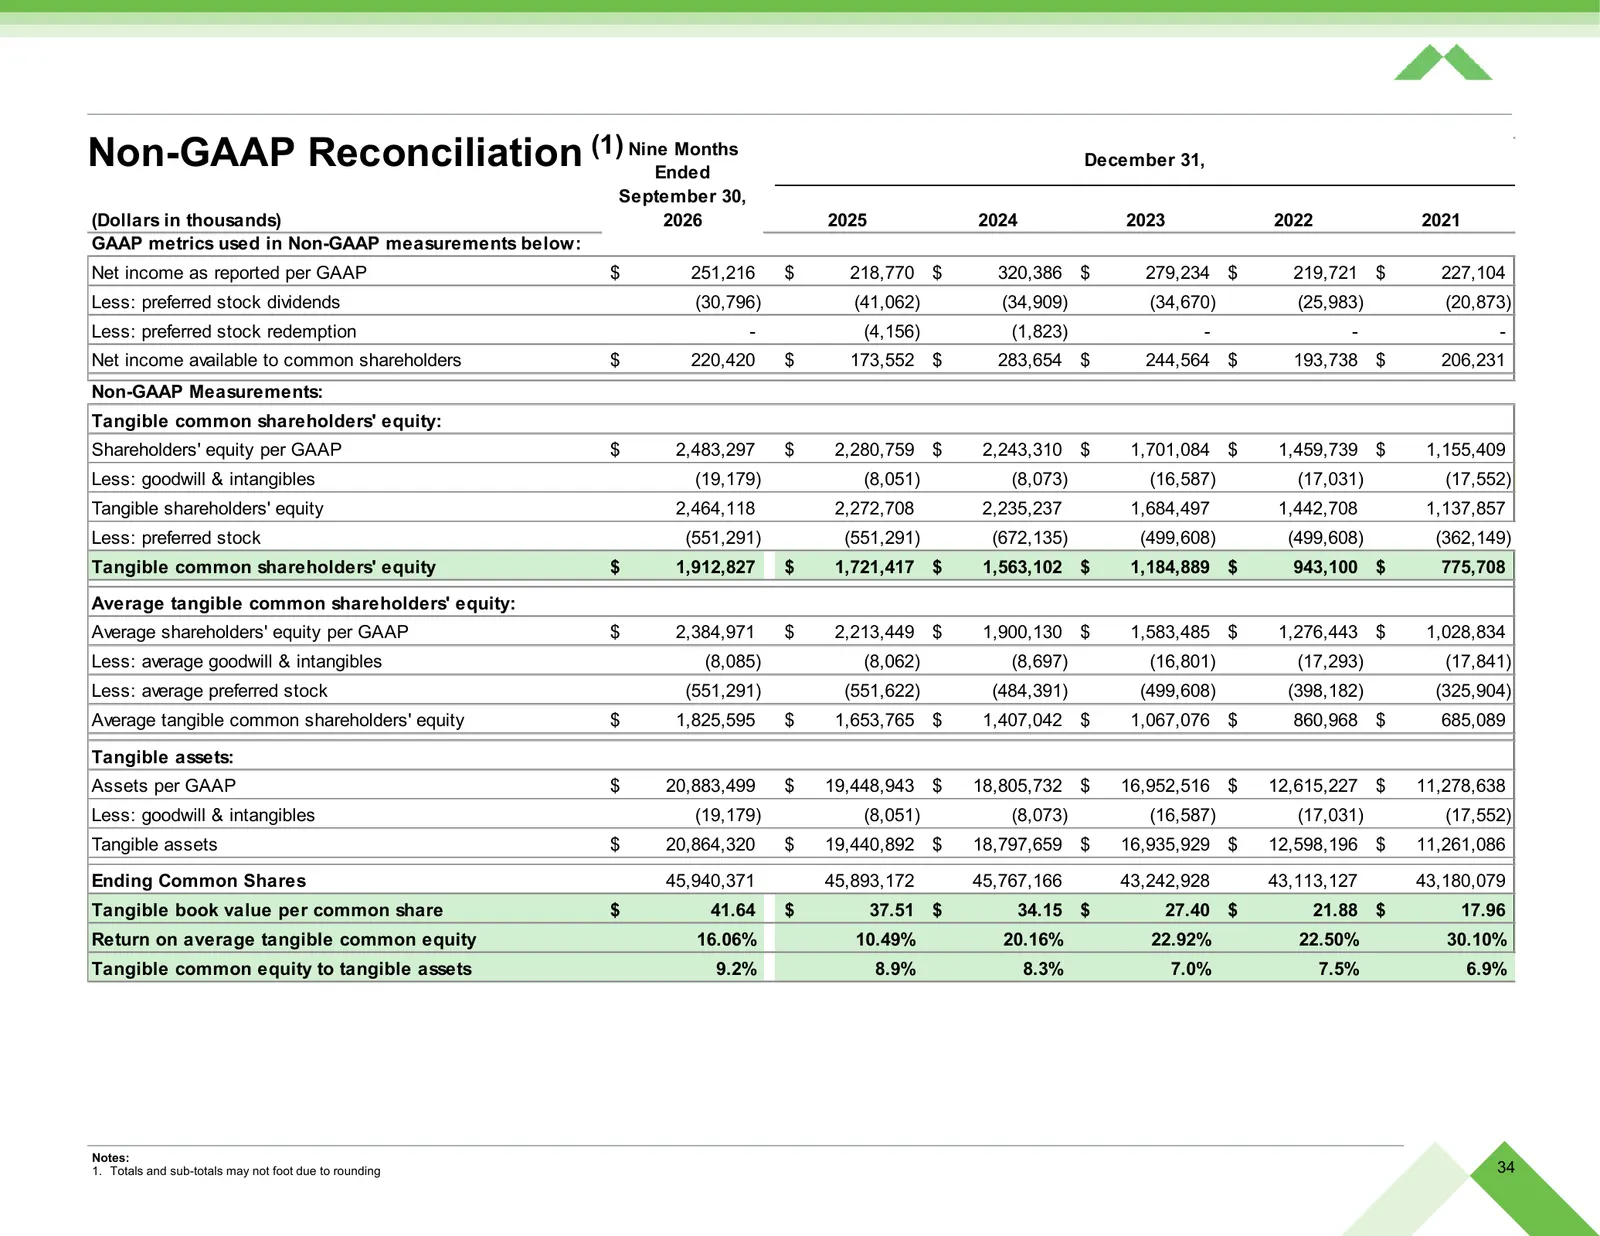
Non-GAAP Reconciliation (1) NineEnded Months December 31, September 30, (Dollars in thousands) 2026 2025 2024 2023 2022 2021 GAAP metrics used in Non-GAAP measurements below: Net income as reported per GAAP $ 251,216 $ 218,770 $ 320,386 $ 279,234 $ 219,721 $ 227,104 Less: preferred stock dividends (
Source: company website
More decks from Merchants Bancorp
 Morgan Stanley US Financials Conference 202532 slides · Jun 11, 2025
 Piper Sandler East Coast Financial Services Conference 202428 slides · Nov 14, 2024
 Raymond James U.S. Bank Conference 202340 slides · September 2023
 Q3 2022 Earnings Presentation41 slides · November 2022
 IPO Roadshow (September 2022)38 slides · Sep 22, 2022
 Truist Financial Services Conference 202136 slides · May 2021