Home Loan Servicing Solutions Ltd
Home Loan Servicing Solutions — Investor Presentation (May 2012)
18 slides from Home Loan Servicing Solutions's investor presentation, May 21, 2012
Slide 1: Investor Presentation May 2012
Investor Presentation May 2012
Slide 2: Forward-Looking Statement
2 FORWARD - LOOKING STATEMENT: Our presentation may contain certain forward - looking statements that are made pursuant to the Safe Harbor provisions of the federal securities laws. These forward - looking statements may be identified by a reference to a future period or by the use of forward - look
Slide 3: Leadership Team
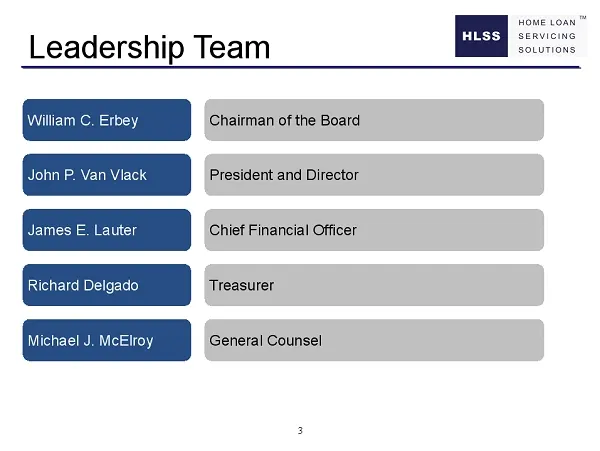
3 Leadership Team William C. Erbey Chairman of the Board John P. Van Vlack President and Director James E. Lauter Chief Financial Officer Richard Delgado Treasurer Michael J. McElroy General Counsel
Slide 4: HLSS Overview
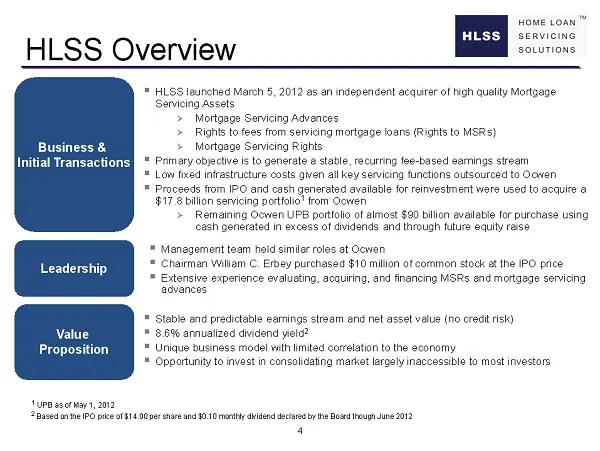
4 HLSS Overview ▪ HLSS launched March 5, 2012 as an independent acquirer of high quality Mortgage Servicing Assets » Mortgage Servicing Advances » Rights to fees from servicing mortgage loans (Rights to MSRs) » Mortgage Servicing Rights ▪ Primary objective is to generate a stable, recurring fee - ba
Slide 5: Investment Highlights
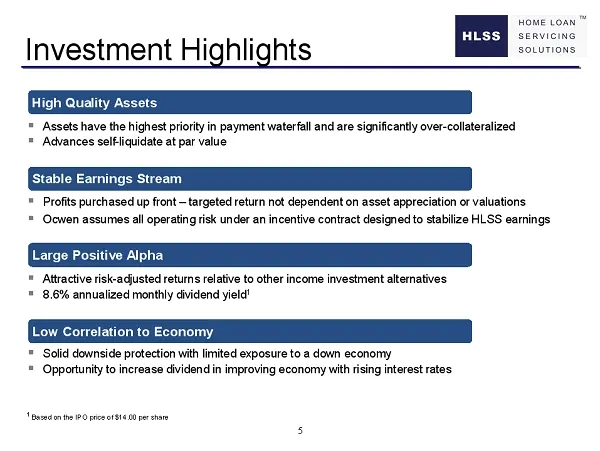
5 Investment Highlights ▪ Attractive risk - adjusted returns relative to other income investment alternatives ▪ 8.6% annualized monthly dividend yield 1 ▪ Assets have the highest priority in payment waterfall and are significantly over - collateralized ▪ Advances self - liquidate at par value ▪ Prof
Slide 6: Mortgage Servicing Primer
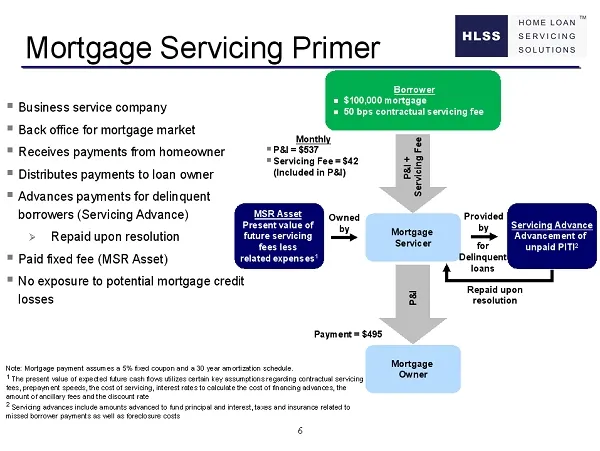
6 Mortgage Servicing Primer Borrower $100,000 mortgage 50 bps contractual servicing fee Mortgage Owner Monthly ▪ P&I = $537 ▪ Servicing Fee = $42 (Included in P&I) Mortgage Servicer P&I + Servicing Fee Payment = $495 MSR Asset Present value of future servicing fees less related expenses 1 Owned by ▪
Slide 7: High Quality Assets Reduce Risk
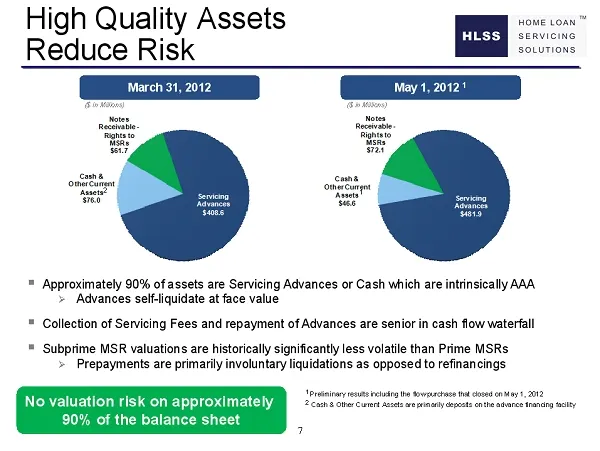
7 Cash & Other Current Assets $76.0 Notes Receivable - Rights to MSRs $61.7 Servicing Advances $408.6 Cash & Other Current Assets $46.6 Notes Receivable - Rights to MSRs $72.1 Servicing Advances $481.9 March 31, 2012 High Quality Assets Reduce Risk ▪ Approximately 90% of assets are Servicing Advance
Slide 8: Assets are Significantly Over Collateralized
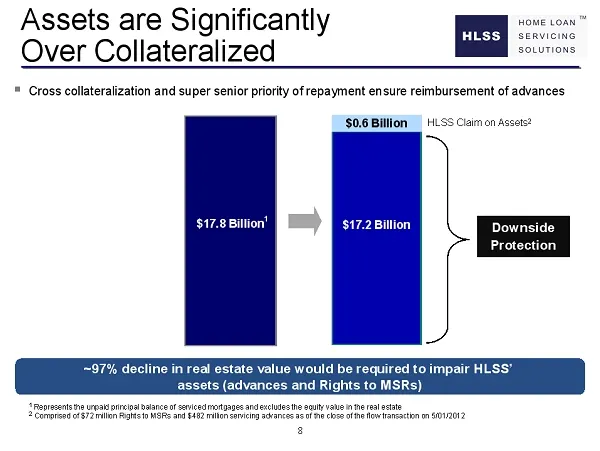
8 $17.8 Billion Assets are Significantly Over Collateralized $17.2 Billion $ 0.6 Billion ~97% decline in real estate value would be required to impair HLSS’ assets (advances and Rights to MSRs) ▪ Cross collateralization and super senior priority of repayment ensure reimbursement of advances HLSS Cla
Slide 9: Subprime MSRs Inherently More Stable Than Prime MSRs
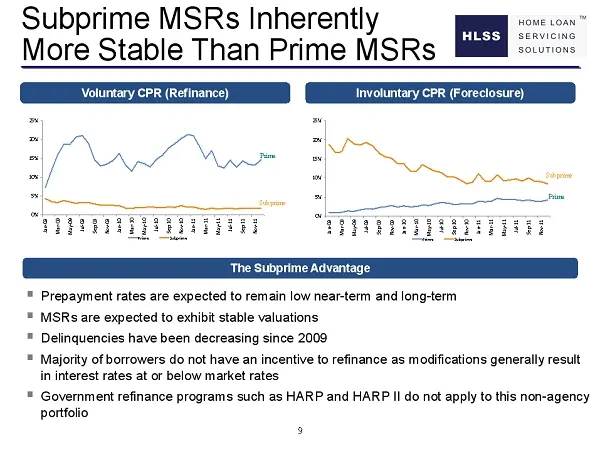
9 Subprime MSRs Inherently More Stable Than Prime MSRs ▪ Prepayment rates are expected to remain low near - term and long - term ▪ MSRs are expected to exhibit stable valuations ▪ Delinquencies have been decreasing since 2009 ▪ Majority of borrowers do not have an incentive to refinance as modificat
Slide 10: Subprime MSRs Inherently More Stable Than Prime MSRs
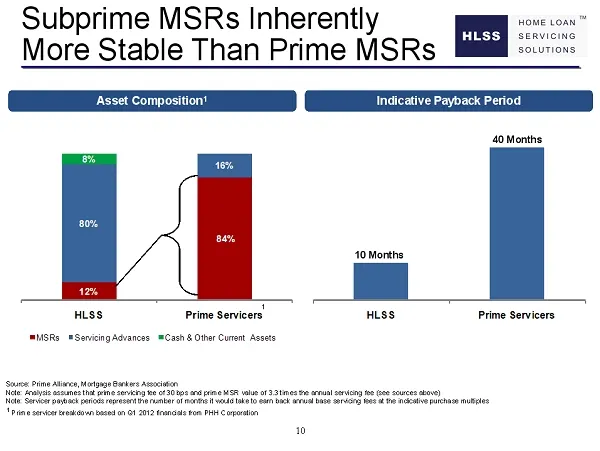
10 12% 84% 80% 16% 8% HLSS Prime Servicers MSRs Servicing Advances Cash & Other Current Assets HLSS Prime Servicers Indicative Payback Period Asset Composition 1 Source: Prime Alliance, Mortgage Bankers Association Note: Analysis assumes that prime servicing fee of 30 bps and prime MSR value of 3.3
Slide 11: Servicing Relationship With Ocwen Enhances Value
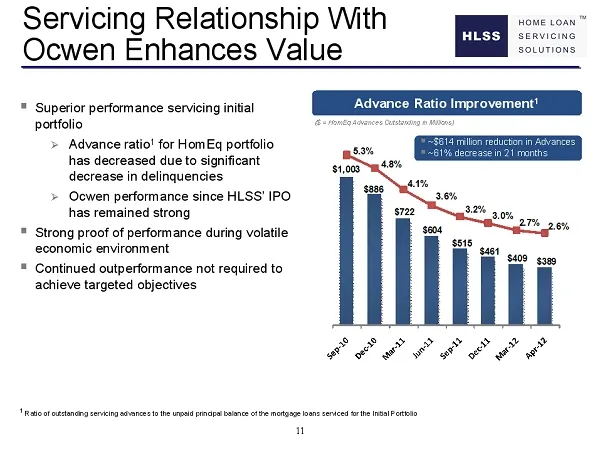
11 $1,003 $886 $722 $604 $515 $461 $409 $389 5.3% 4.8% 4.1% 3.6% 3.2% 3.0% 2.7% 2.6% - 0.5% 0.5% 1.5% 2.5% 3.5% 4.5% 5.5% $ - $200 $400 $600 $800 $1,000 $1,200 Servicing Relationship With Ocwen Enhances Value ▪ Superior performance servicing initial portfolio » Advance ratio 1 for HomEq portfolio ha
Slide 12: Business Model Designed to Stabilize Performance
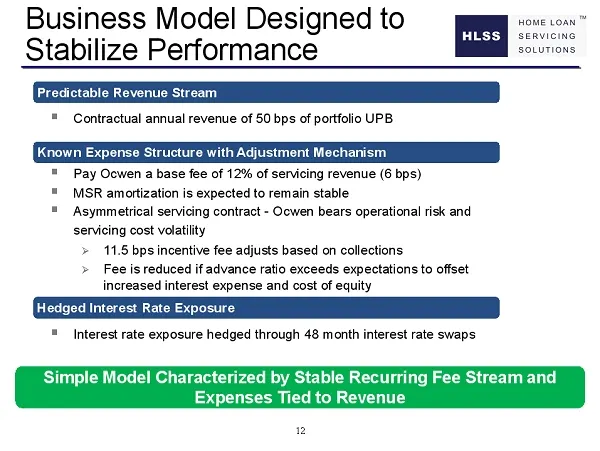
12 Business Model Designed to Stabilize Performance Simple Model Characterized by Stable Recurring Fee Stream and Expenses Tied to Revenue Predictable Revenue Stream Known Expense Structure with Adjustment Mechanism Hedged Interest Rate Exposure ▪ Contractual annual revenue of 50 bps of portfolio UP
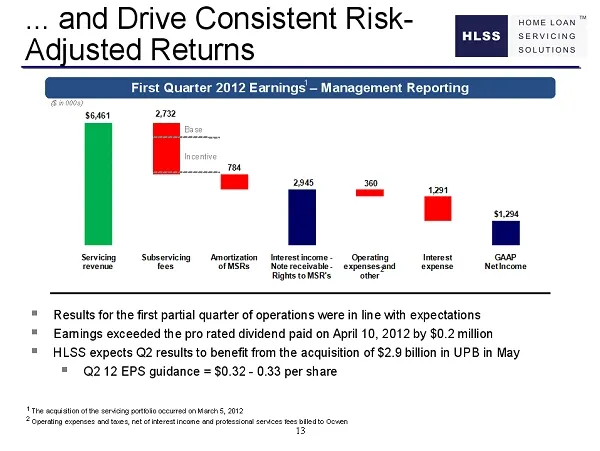
Slide 13: First Quarter 2012 Earnings – Management Reporting
13 $6,461 2,945 $1,294 2,732 784 360 1,291 Servicing revenue Subservicing fees Amortization of MSRs Interest income - Note receivable - Rights to MSR's Operating expenses and other Interest expense GAAP Net Income ... and Drive Consistent Risk - Adjusted Returns Incentive 1 The acquisition of the se
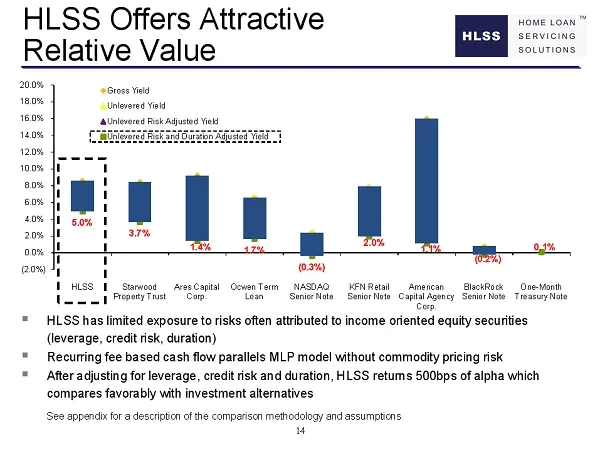
Slide 14: HLSS Offers Attractive Relative Value
14 HLSS Offers Attractive Relative Value 5.0% 3.7% 1.4% 1.7% (0.3%) 2.0% 1.1% (0.2%) 0.1% (2.0%) 0.0% 2.0% 4.0% 6.0% 8.0% 10.0% 12.0% 14.0% 16.0% 18.0% 20.0% HLSS Starwood Property Trust Ares Capital Corp. Ocwen Term Loan NASDAQ Senior Note KFN Retail Senior Note American Capital Agency Corp. BlackR
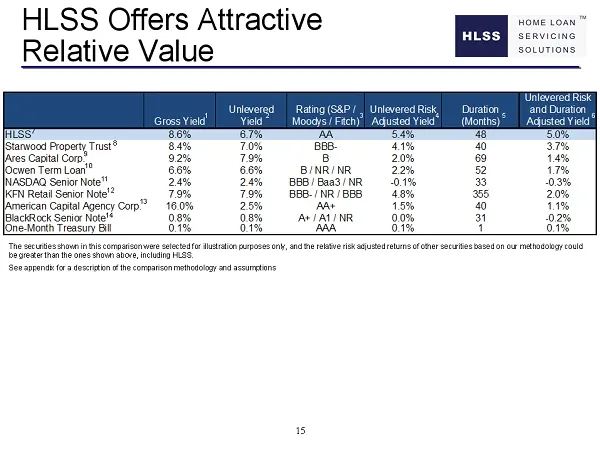
Slide 15: HLSS Offers Attractive Relative Value
15 Gross Yield Unlevered Yield Rating (S&P / Moodys / Fitch) Unlevered Risk Adjusted Yield Duration (Months) Unlevered Risk and Duration Adjusted Yield HLSS 8.6% 6.7% AA 5.4% 48 5.0% Starwood Property Trust 8.4% 7.0% BBB- 4.1% 40 3.7% Ares Capital Corp. 9.2% 7.9% B 2.0% 69 1.4% Ocwen Term Loan 6.6%
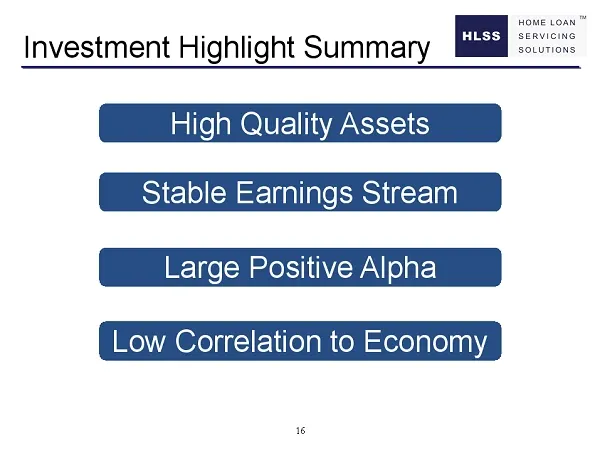
Slide 16: Investment Highlight Summary
16 Investment Highlight Summary High Quality Assets Stable Earnings Stream Large Positive Alpha Low Correlation to Economy
Slide 17: Appendix
HOME LOAN ™ SERVICING SOLUTIONS Appendix
Slide 18: Relative Return Assumptions
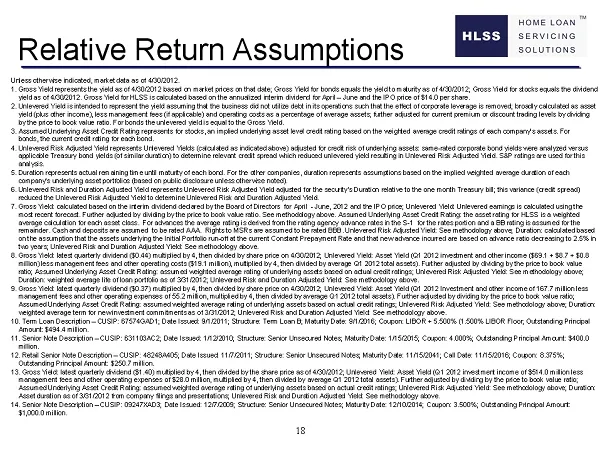
18 Relative Return Assumptions Unless otherwise indicated, market data as of 4/30/2012 . 1. Gross Yield represents the yield as of 4/30/2012 based on market prices on that date; Gross Yield for bonds equals the yield to maturity as of 4/30/2012; Gross Yield for stocks equals the dividend yield as of
Source: SEC EDGAR · 8-K filed May 21, 2012
More decks from Home Loan Servicing Solutions Ltd
 Merger or Acquisition (February 2015)6 slides · Feb 23, 2015
 Q3 2014 Earnings Presentation15 slides · Oct 21, 2014
 Debt Investor Presentation (September 2014)40 slides · Sep 22, 2014
 Investor Presentation (September 2014)14 slides · Sep 8, 2014
 Investor Presentation (May 2014)17 slides · May 20, 2014
 Debt Investor Presentation (January 2014)45 slides · Jan 23, 2014