Chaparral Energy — Wells Fargo Annual Energy Symposium December 2015
49 slides from Chaparral Energy's conference presentation, Dec 8, 2015
Slide 1: Wells Fargo Annual Energy Symposium December 2015
Wells Fargo Annual Energy Symposium December 2015 Exhibit 99.1
Slide 2: Forward-looking Statements
Forward-looking Statements This presentation contains "forward-looking statements" within the meaning of Section 27A of the Securities Act of 1933, as amended, and Section 21E of the Securities Exchange Act of 1934, as amended. These forward-looking statements are subject to certain risks, trends an
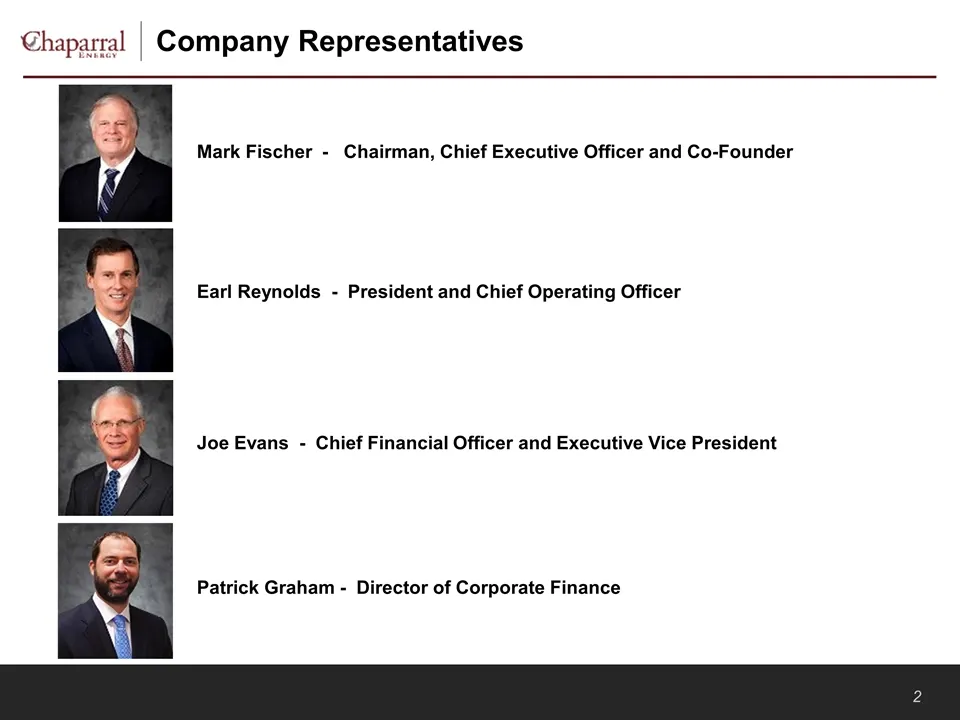
Slide 3: Company Representatives
Company Representatives Earl Reynolds - President and Chief Operating Officer Joe Evans - Chief Financial Officer and Executive Vice President Mark Fischer - Chairman, Chief Executive Officer and Co-Founder Patrick Graham - Director of Corporate Finance
Slide 4: Agenda
Agenda Company Overview & Strategy Response to Commodity Weakness Asset Discussion E&P EOR Financial Overview
Slide 5: Company Overview & Strategy
Company Overview & Strategy Chaparral
Slide 6: Pure Mid-Continent Player
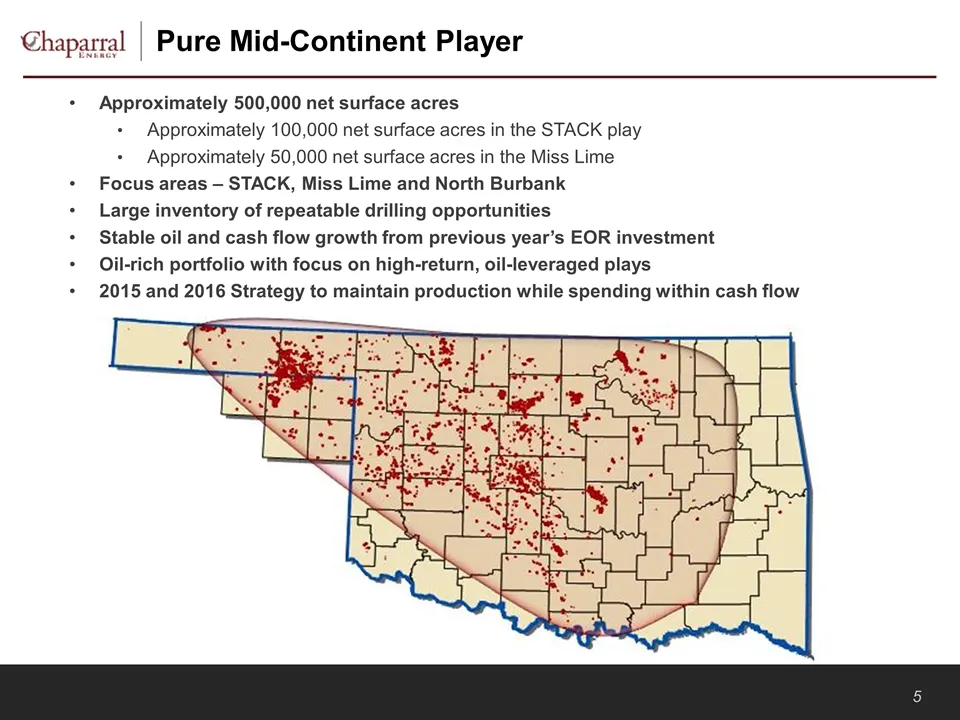
Pure Mid-Continent Player Approximately 500,000 net surface acres Approximately 100,000 net surface acres in the STACK play Approximately 50,000 net surface acres in the Miss Lime Focus areas – STACK, Miss Lime and North Burbank Large inventory of repeatable drilling opportunities Stable oil and cas
Slide 7: Third Quarter 2015 Results
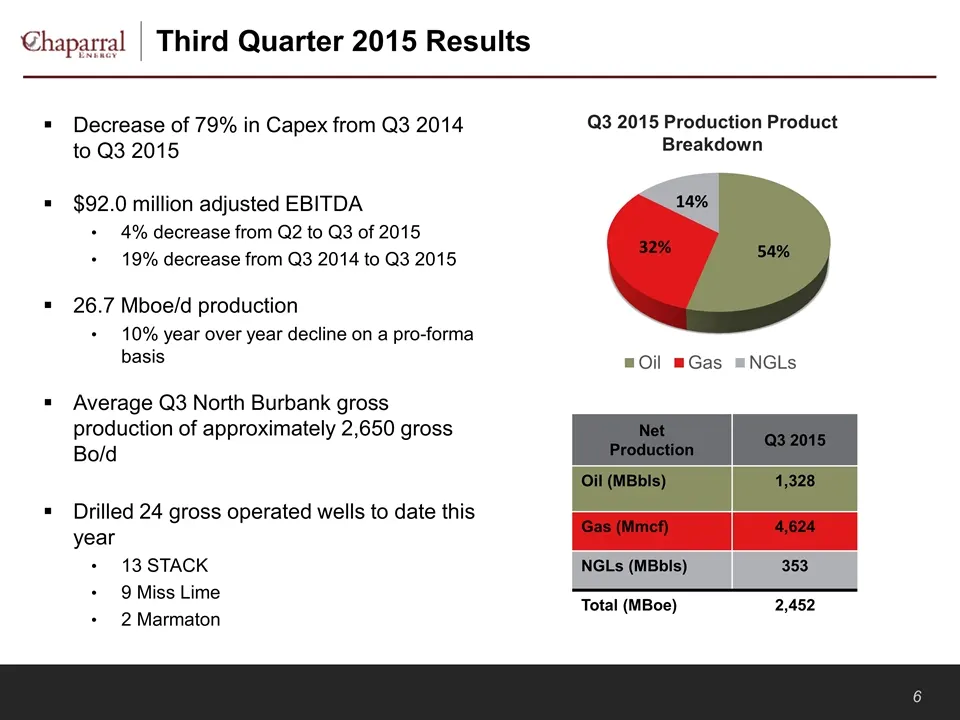
Third Quarter 2015 Results Decrease of 79% in Capex from Q3 2014 to Q3 2015 $92.0 million adjusted EBITDA 4% decrease from Q2 to Q3 of 2015 19% decrease from Q3 2014 to Q3 2015 26.7 Mboe/d production 10% year over year decline on a pro-forma basis Average Q3 North Burbank gross production of approxi
Slide 8: Strong Track Record of Execution
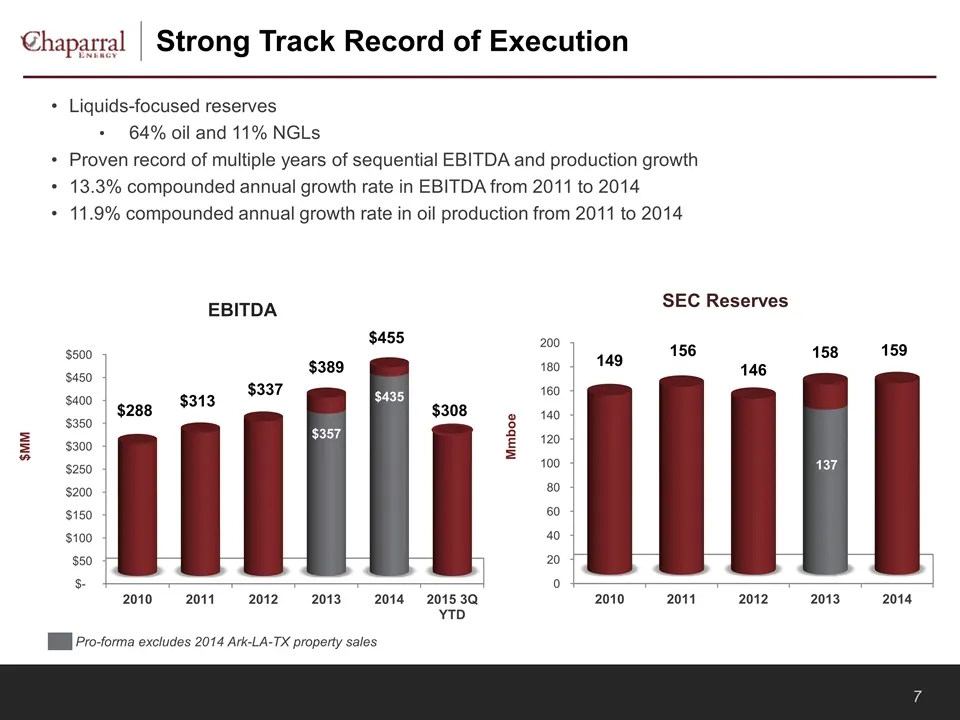
Strong Track Record of Execution EBITDA Liquids-focused reserves 64% oil and 11% NGLs Proven record of multiple years of sequential EBITDA and production growth 13.3% compounded annual growth rate in EBITDA from 2011 to 2014 11.9% compounded annual growth rate in oil production from 2011 to 2014 SEC
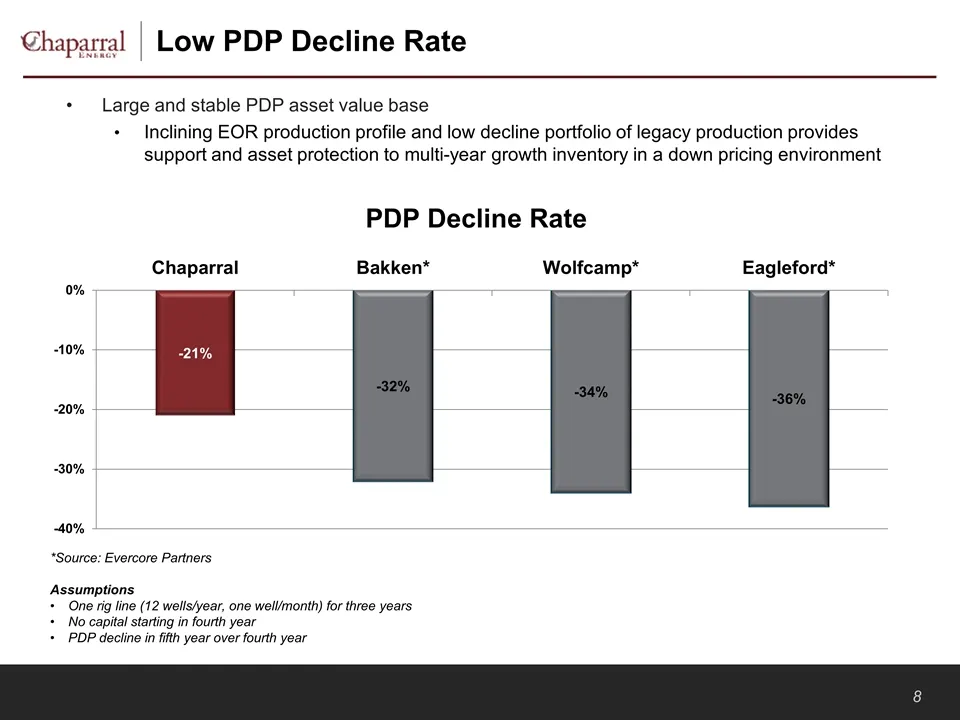
Slide 9: Low PDP Decline Rate
Low PDP Decline Rate Large and stable PDP asset value base Inclining EOR production profile and low decline portfolio of legacy production provides support and asset protection to multi-year growth inventory in a down pricing environment *Source: Evercore Partners Assumptions One rig line (12 wells/
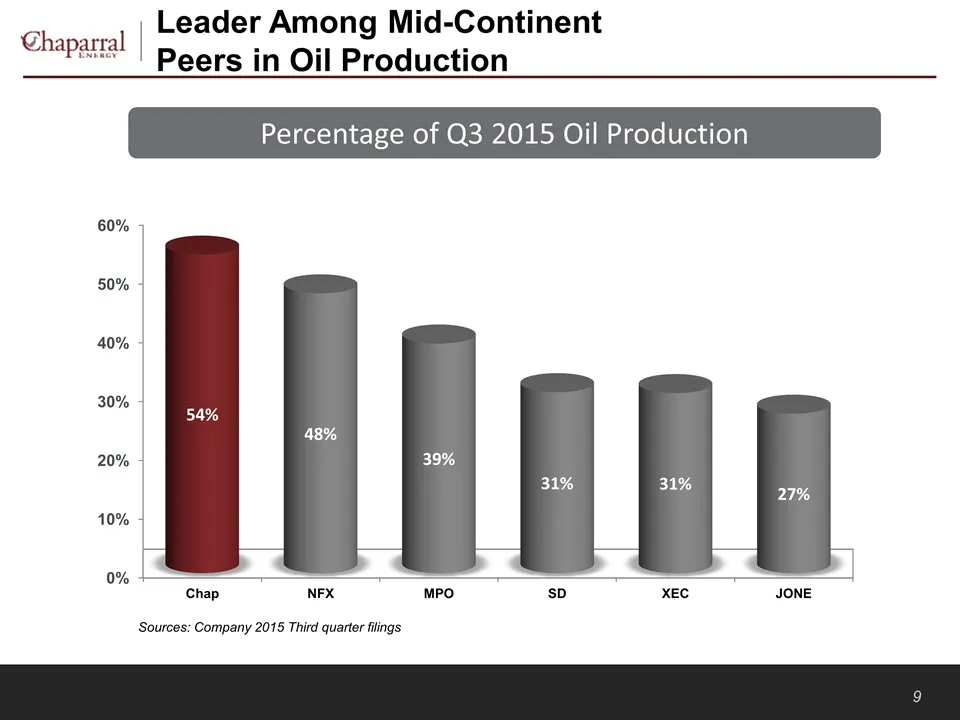
Slide 10: Leader Among Mid-Continent Peers in Oil Production
Leader Among Mid-Continent Peers in Oil Production Percentage of Q3 2015 Oil Production Sources: Company 2015 Third quarter filings
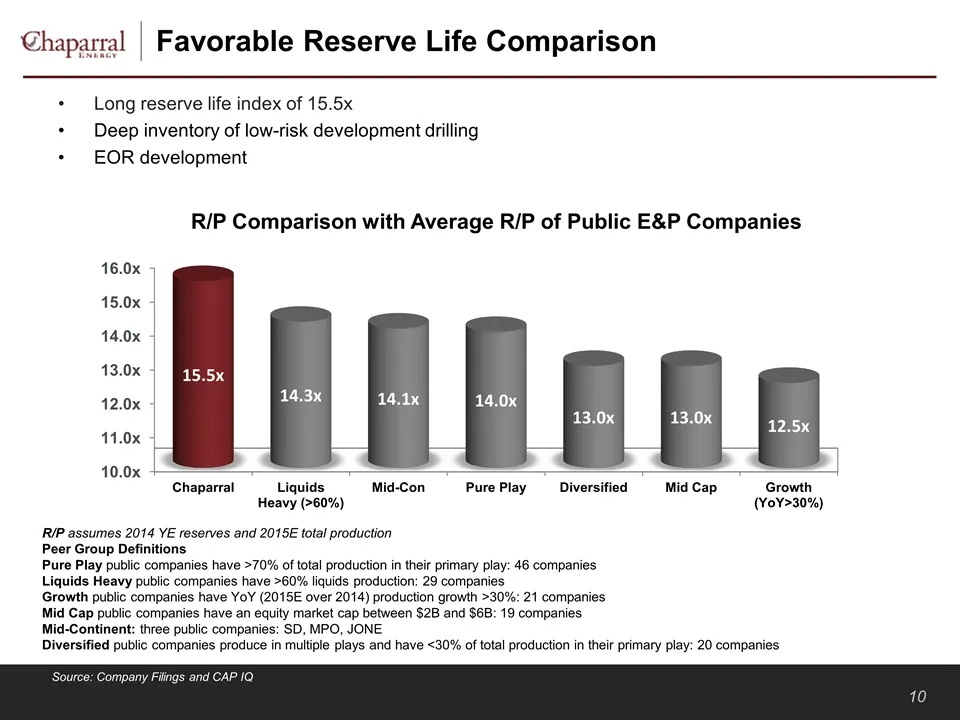
Slide 11: Favorable Reserve Life Comparison
Favorable Reserve Life Comparison Source: Company Filings and CAP IQ Long reserve life index of 15.5x Deep inventory of low-risk development drilling EOR development R/P Comparison with Average R/P of Public E&P Companies R/P assumes 2014 YE reserves and 2015E total production Peer Group Definitions
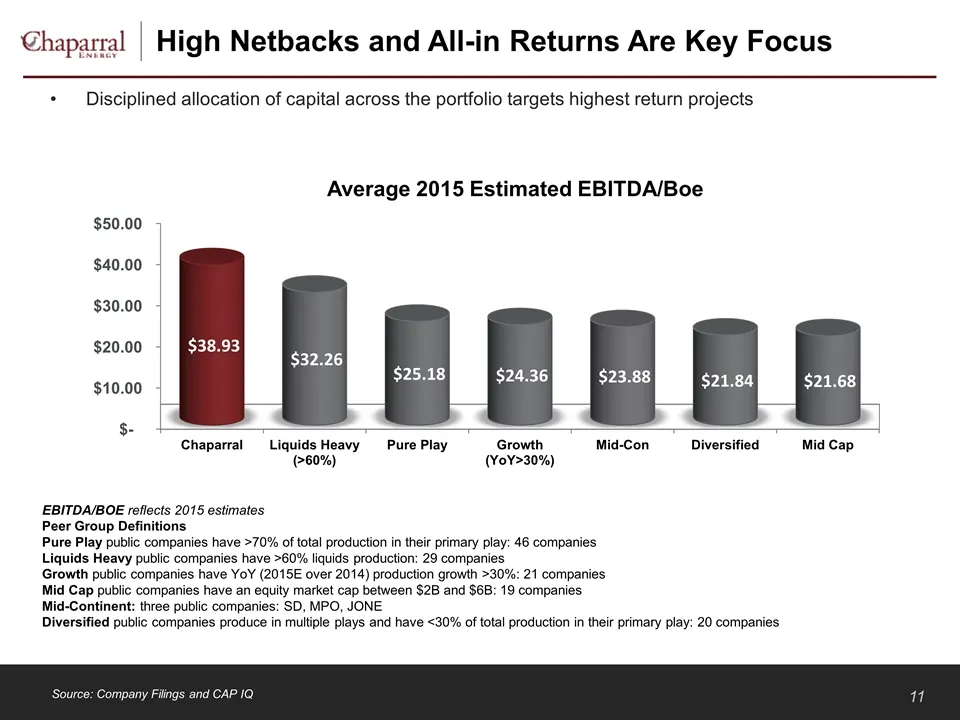
Slide 12: High Netbacks and All-in Returns Are Key Focus
High Netbacks and All-in Returns Are Key Focus Source: Company Filings and CAP IQ Disciplined allocation of capital across the portfolio targets highest return projects EBITDA/BOE reflects 2015 estimates Peer Group Definitions Pure Play public companies have >70% of total production in their primary
Slide 13: 2015 Revised Capital Budget
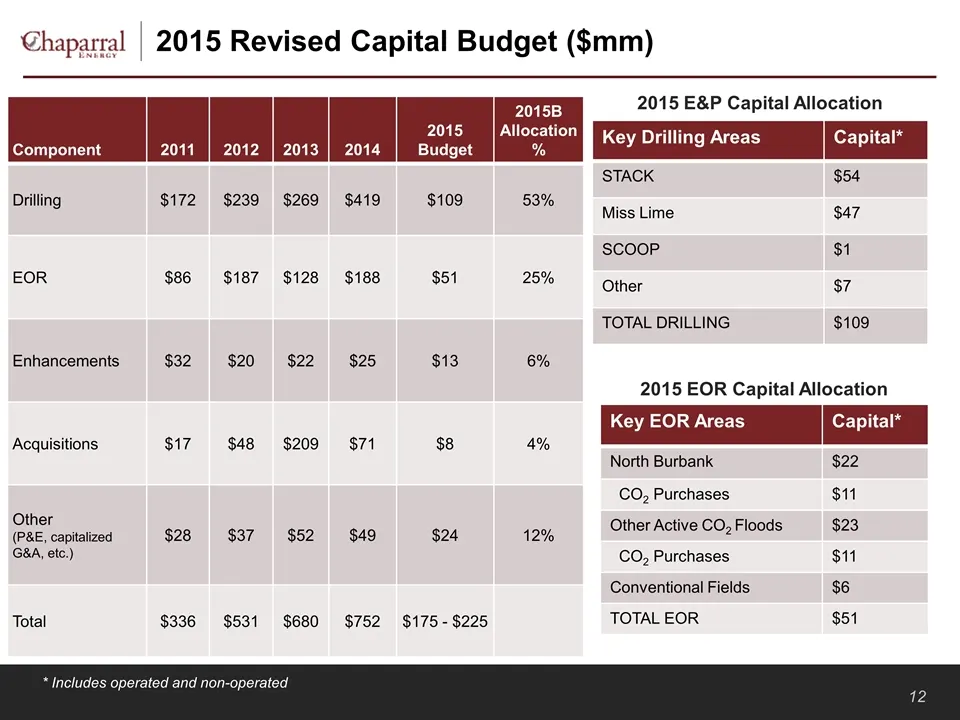
2015 Revised Capital Budget ($mm) Key EOR Areas Capital* North Burbank $22 CO2 Purchases $11 Other Active CO2 Floods $23 CO2 Purchases $11 Conventional Fields $6 TOTAL EOR $51 * Includes operated and non-operated 2015 E&P Capital Allocation Component 2011 2012 2013 2014 2015 Budget 2015B Allocation%

Slide 14: Response to Commodity Weakness
Response to Commodity Weakness
Slide 15: Commodity Weakness Response
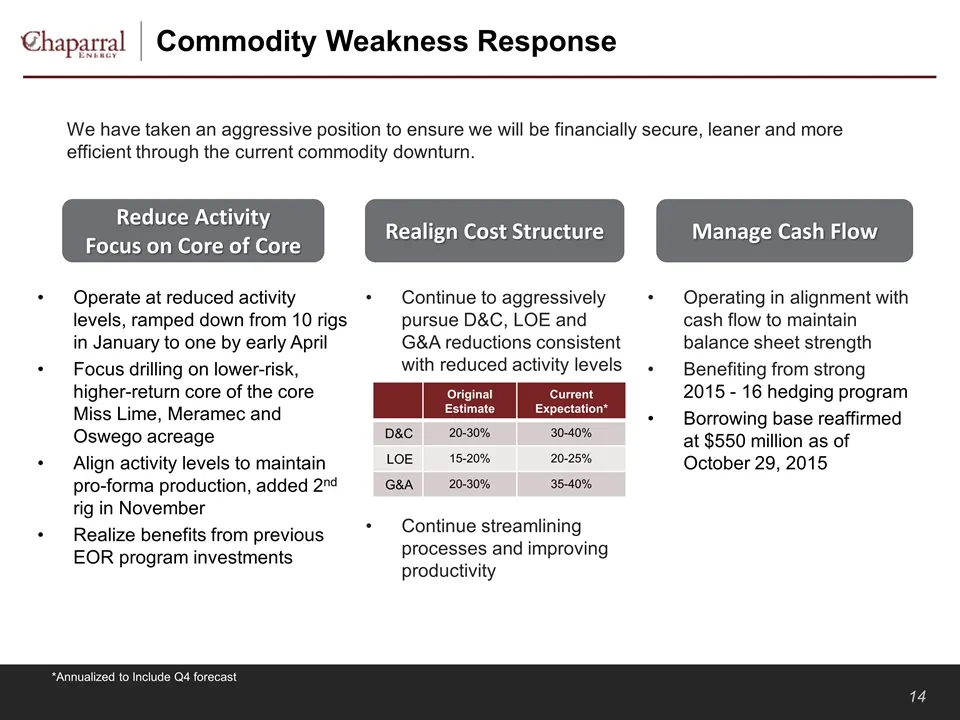
Commodity Weakness Response *Annualized to Include Q4 forecast We have taken an aggressive position to ensure we will be financially secure, leaner and more efficient through the current commodity downturn. Operating in alignment with cash flow to maintain balance sheet strength Benefiting from stro
Slide 16: Focusing on Core Areas and Maintaining Production
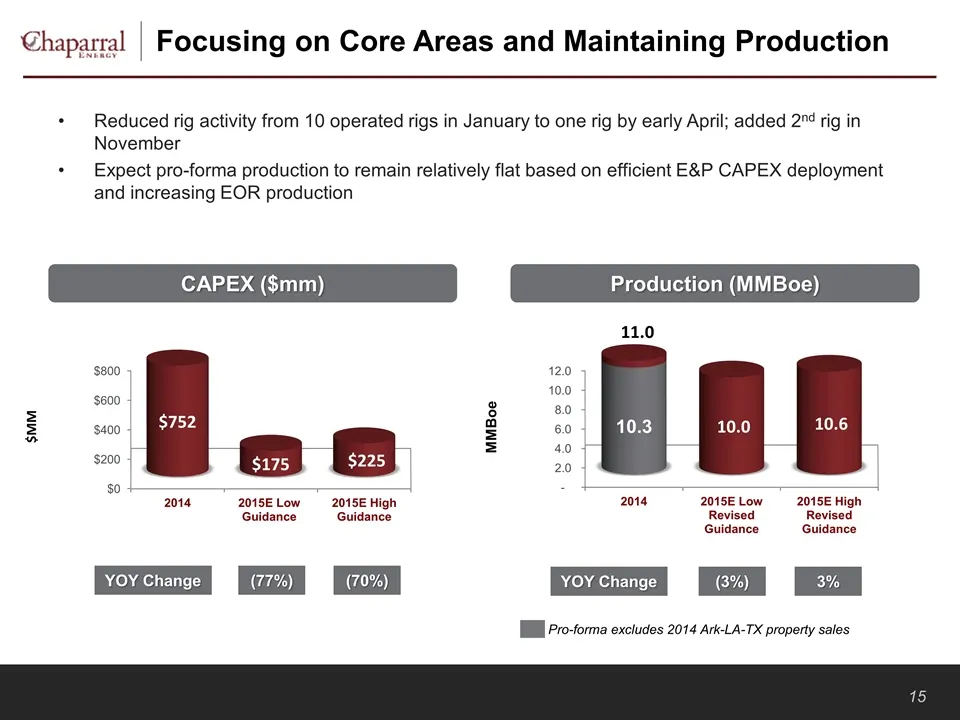
Focusing on Core Areas and Maintaining Production Reduced rig activity from 10 operated rigs in January to one rig by early April; added 2nd rig in November Expect pro-forma production to remain relatively flat based on efficient E&P CAPEX deployment and increasing EOR production Production (MMBoe)
Slide 17: Cost Reductions
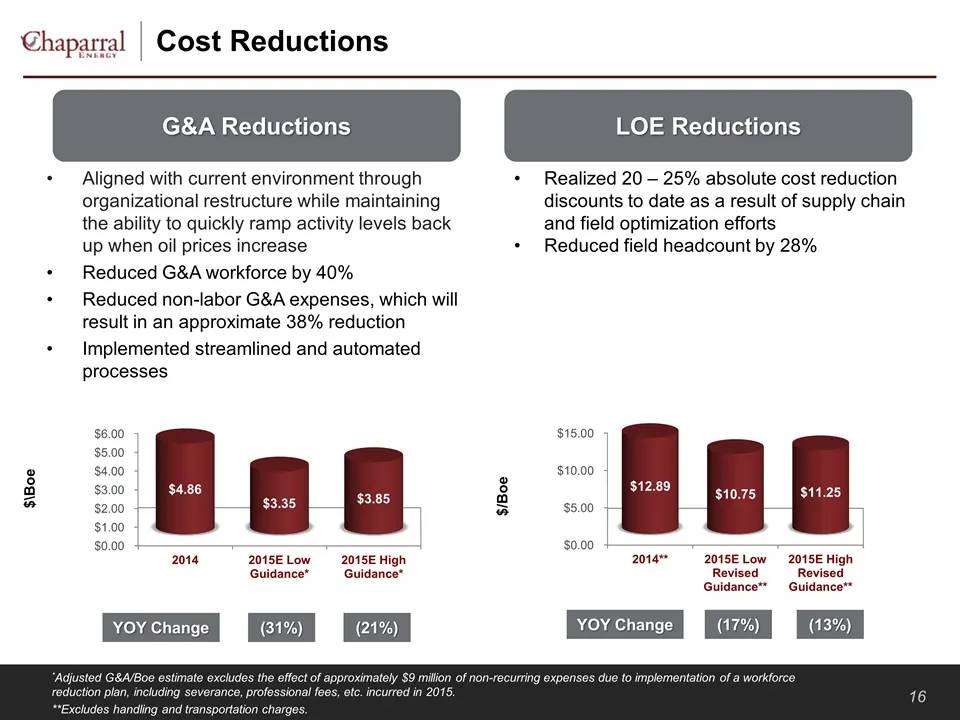
Cost Reductions *Adjusted G&A/Boe estimate excludes the effect of approximately $9 million of non-recurring expenses due to implementation of a workforce reduction plan, including severance, professional fees, etc. incurred in 2015. **Excludes handling and transportation charges. Aligned with curren
Slide 18: D&C Cost Reduction Summary
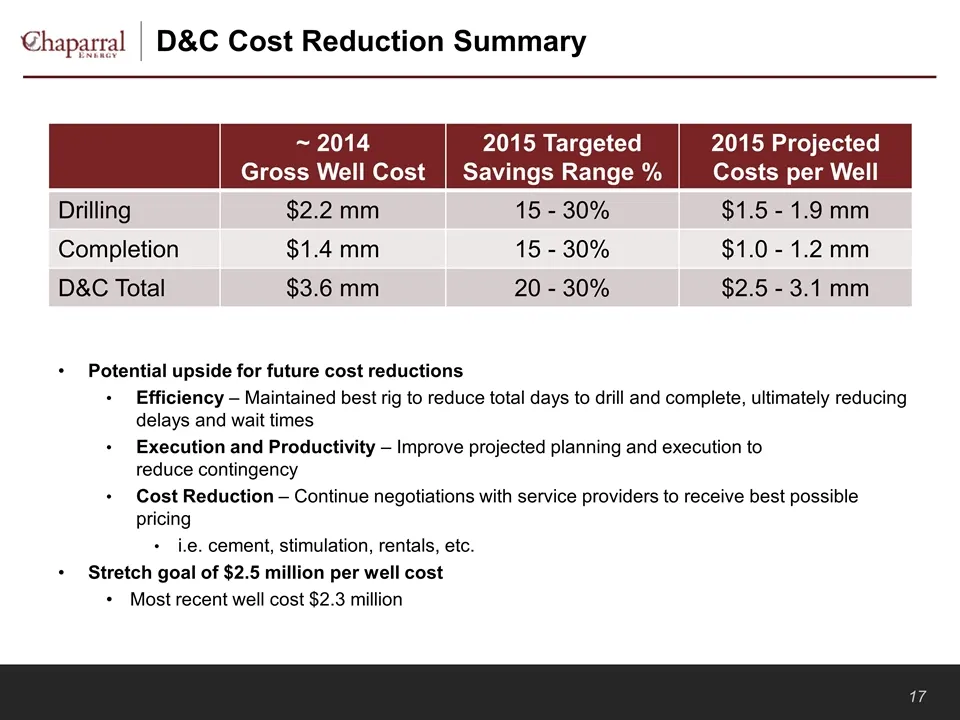
D&C Cost Reduction Summary Potential upside for future cost reductions Efficiency – Maintained best rig to reduce total days to drill and complete, ultimately reducing delays and wait times Execution and Productivity – Improve projected planning and execution to reduce contingency Cost Reduction – C
Slide 19: STACK - Oswego – Cost Reductions
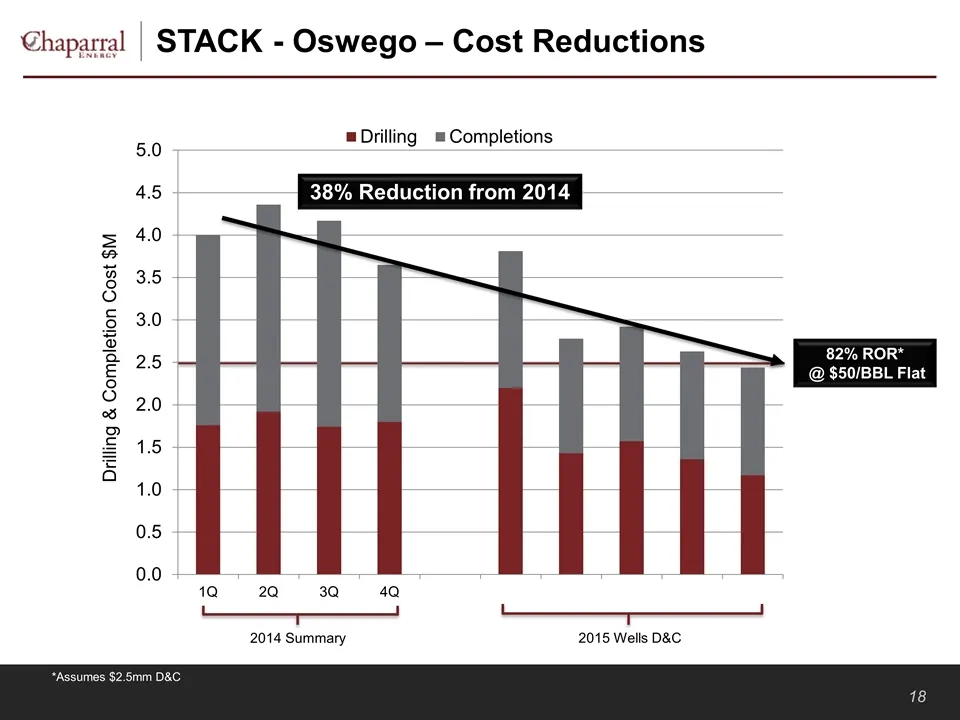
STACK - Oswego – Cost Reductions *Assumes $2.5mm D&C 82% ROR* @ $50/BBL Flat 2014 Summary 2015 Wells D&C
Slide 20: STACK-Osage/North Meramec - Cost Reductions
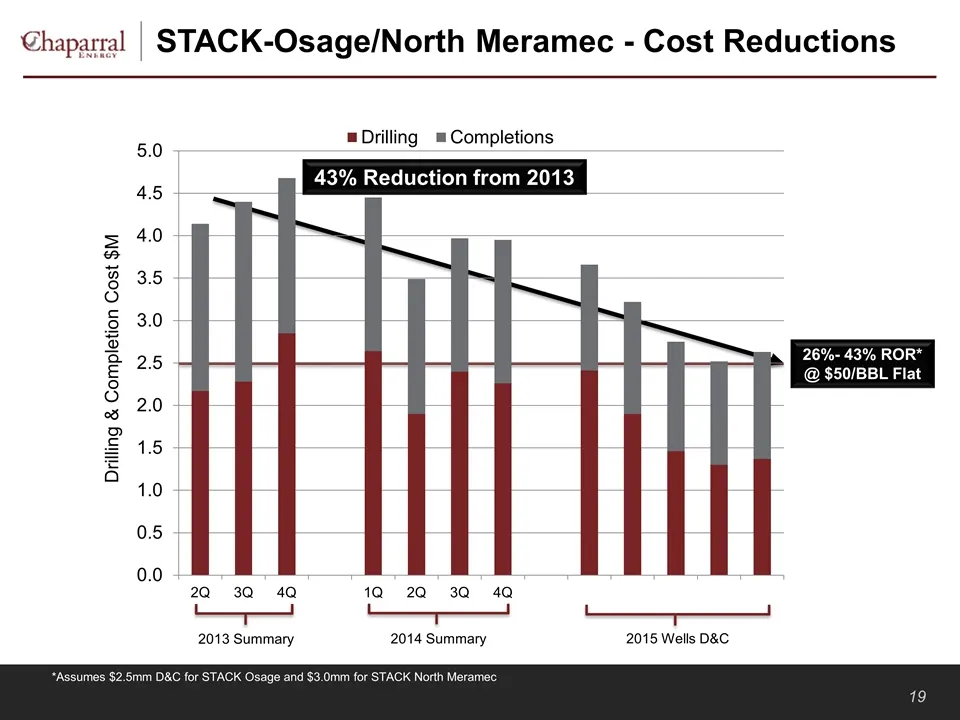
STACK-Osage/North Meramec - Cost Reductions *Assumes $2.5mm D&C for STACK Osage and $3.0mm for STACK North Meramec 26%- 43% ROR* @ $50/BBL Flat 2013 Summary 2014 Summary 2015 Wells D&C
Slide 21: Mississippi Lime – Cost Reductions
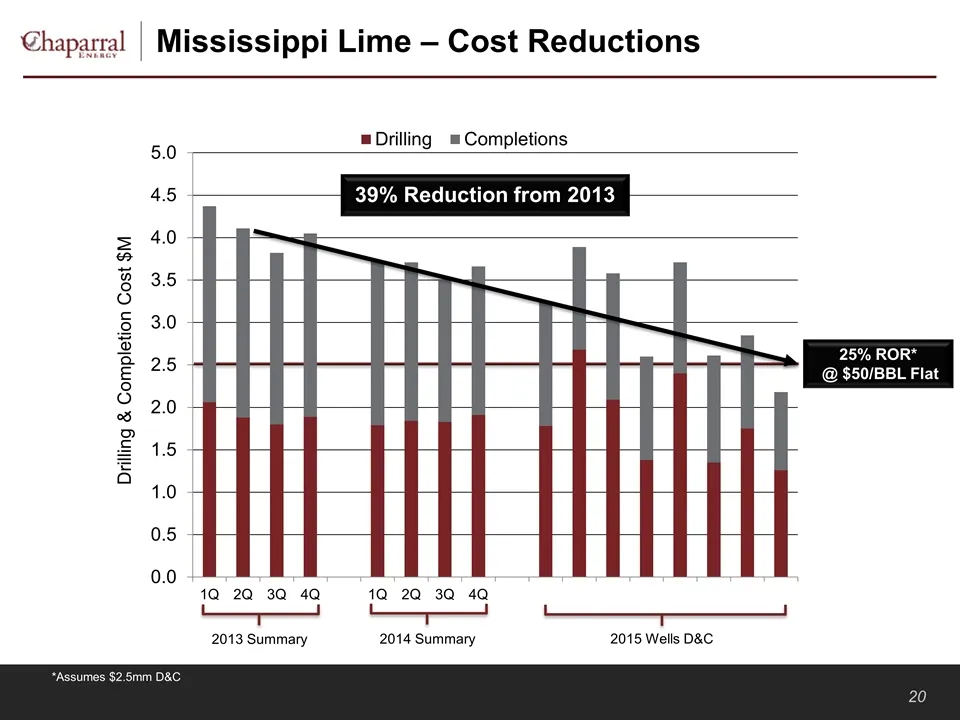
Mississippi Lime – Cost Reductions *Assumes $2.5mm D&C 25% ROR* @ $50/BBL Flat 2013 Summary 2014 Summary 2015 Wells D&C 39% Reduction from 2013
Slide 22: Summary
Summary Strong, pure play Mid-Continent E&P company Focused operations in EOR and the core of the core in the STACK and Miss Lime Proven record of execution Proactive resetting of cost structure Operations aligned with cash flow Well-hedged position
Slide 23: Core Focus Areas
Core Focus Areas
Slide 24: Core Focus Areas
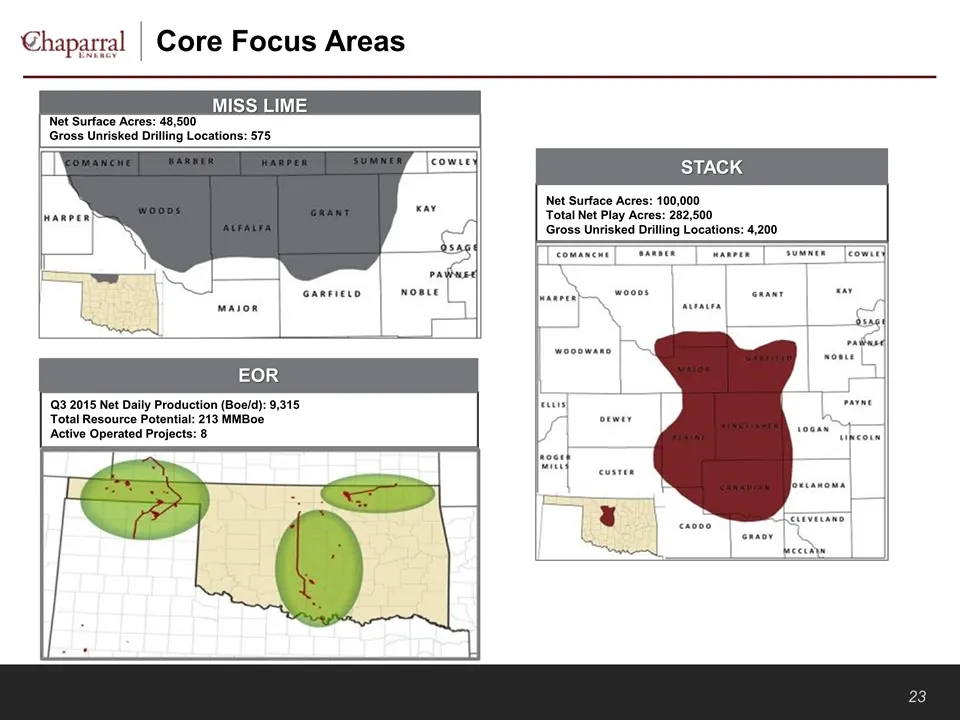
Core Focus Areas Q3 2015 Net Daily Production (Boe/d): 9,315 Total Resource Potential: 213 MMBoe Active Operated Projects: 8 EOR MISS LIME Net Surface Acres: 48,500 Gross Unrisked Drilling Locations: 575 Net Surface Acres: 100,000 Total Net Play Acres: 282,500 Gross Unrisked Drilling Locations: 4,20
Slide 25: Unrisked Horizontal Drilling Inventory and Play Resource Potential
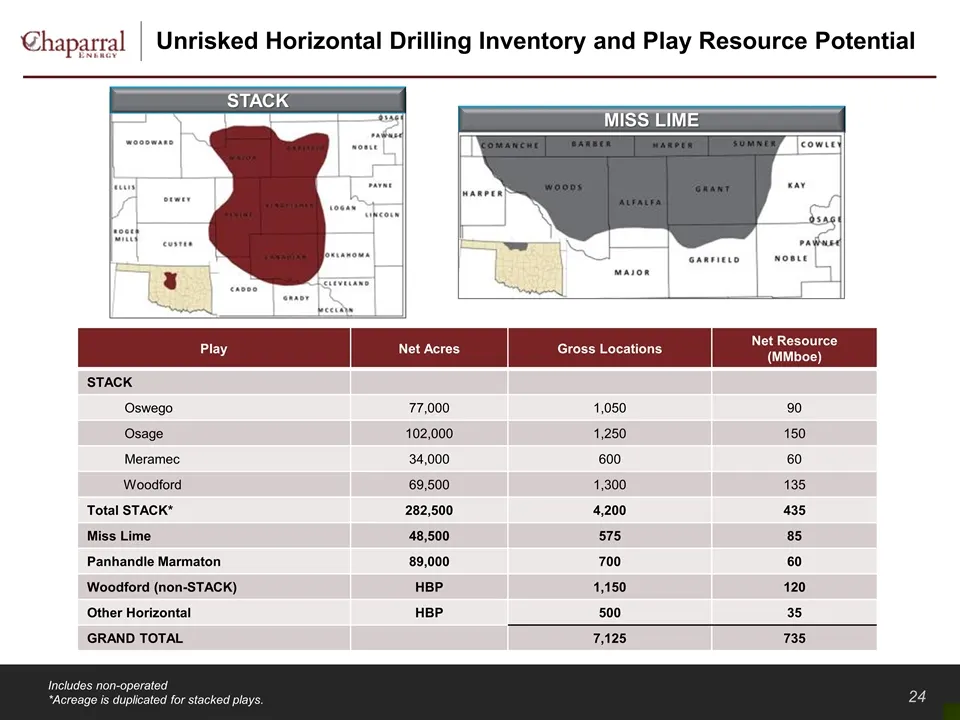
Unrisked Horizontal Drilling Inventory and Play Resource Potential Play Net Acres Gross Locations Net Resource (MMboe) STACK Oswego 77,000 1,050 90 Osage 102,000 1,250 150 Meramec 34,000 600 60 Woodford 69,500 1,300 135 Total STACK* 282,500 4,200 435 Miss Lime 48,500 575 85 Panhandle Marmaton 89,000
Slide 26: Multiple STACK Pay Zones
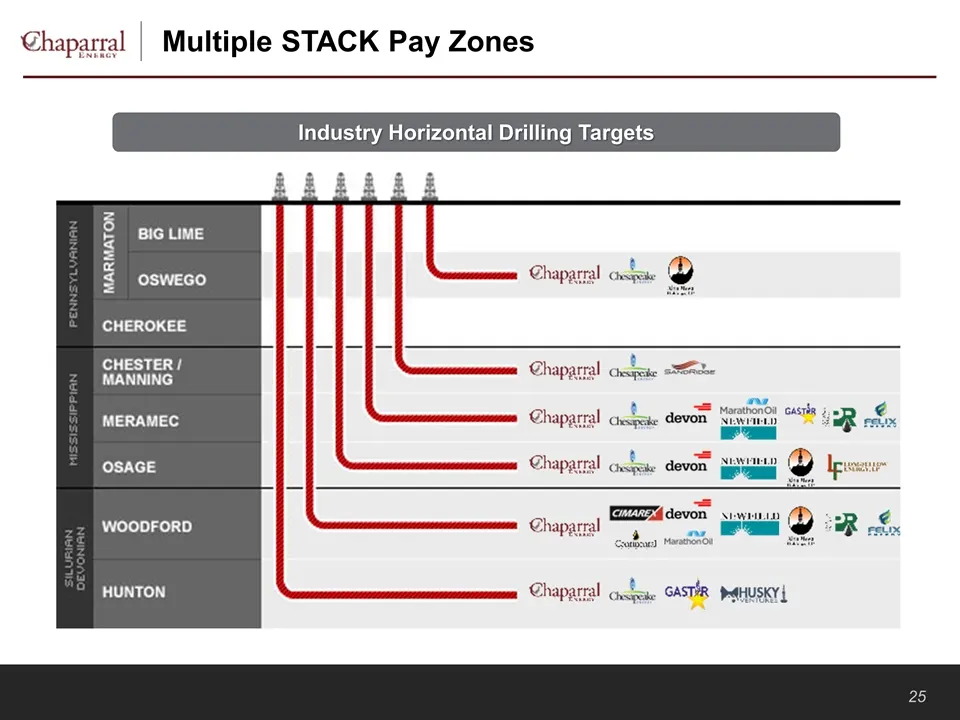
Multiple STACK Pay Zones Industry Horizontal Drilling Targets
Slide 27: About the STACK
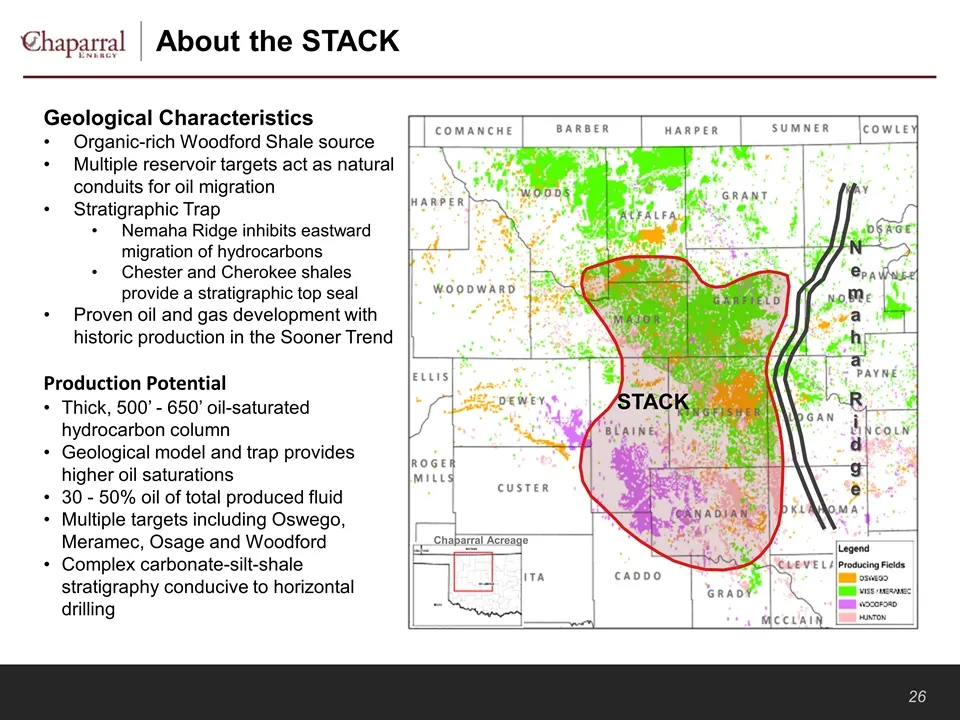
About the STACK Geological Characteristics Organic-rich Woodford Shale source Multiple reservoir targets act as natural conduits for oil migration Stratigraphic Trap Nemaha Ridge inhibits eastward migration of hydrocarbons Chester and Cherokee shales provide a stratigraphic top seal Proven oil and g
Slide 28: Our STACK Position
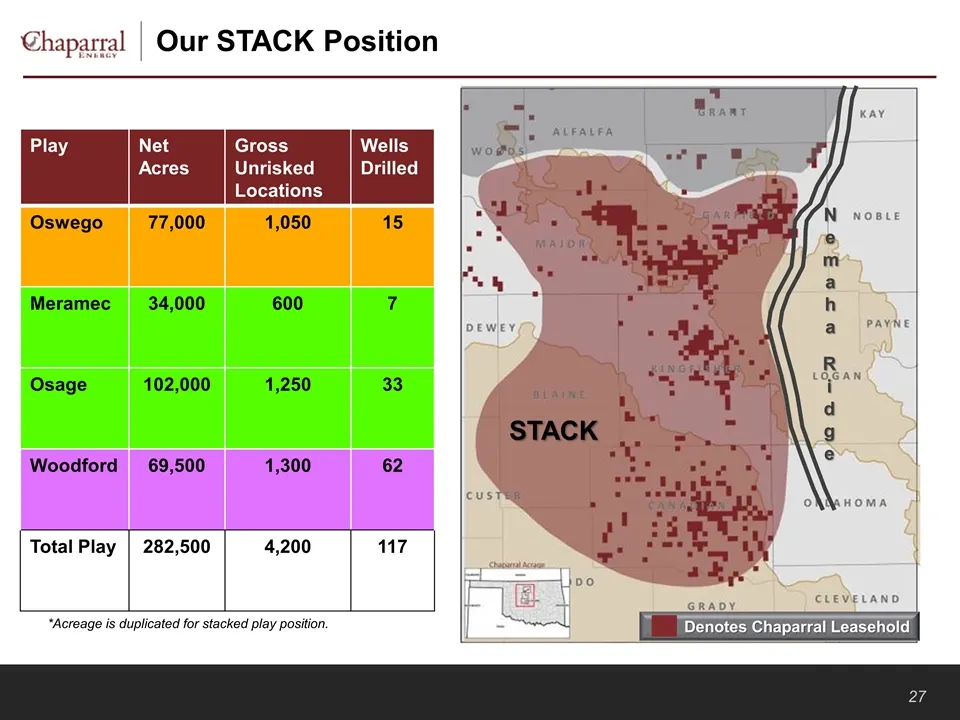
Our STACK Position Play Net Acres Gross Unrisked Locations Wells Drilled Oswego 77,000 1,050 15 Meramec 34,000 600 7 Osage 102,000 1,250 33 Woodford 69,500 1,300 62 Total Play 282,500 4,200 117 Denotes Chaparral Leasehold *Acreage is duplicated for stacked play position. Nemaha Ridge STACK
Slide 29: STACK Reservoir Targets
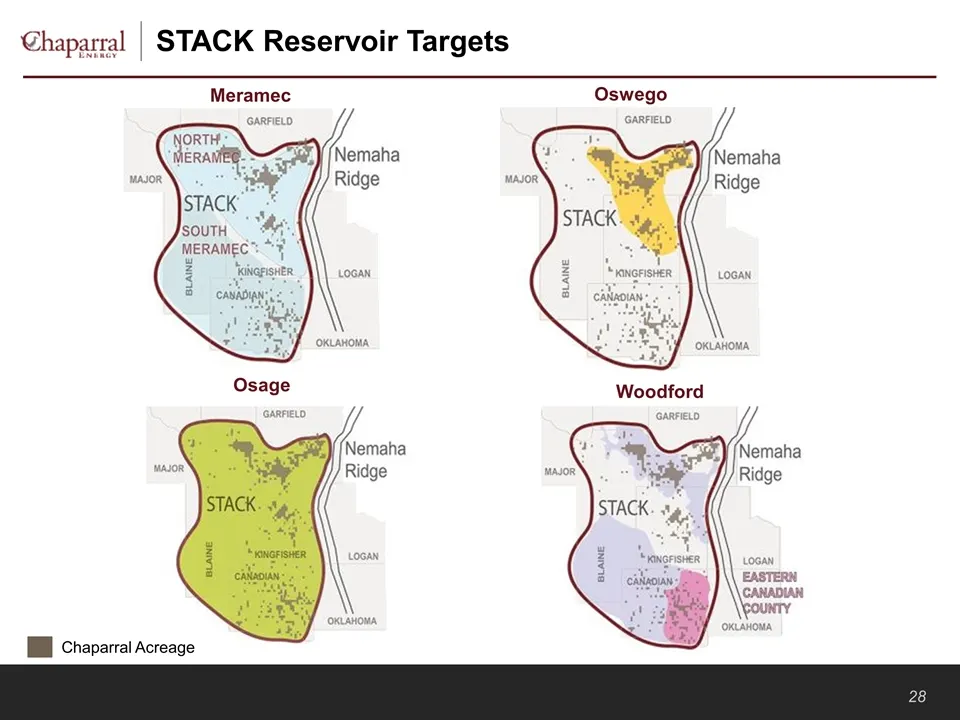
STACK Reservoir Targets Oswego Meramec Osage Woodford Chaparral Acreage
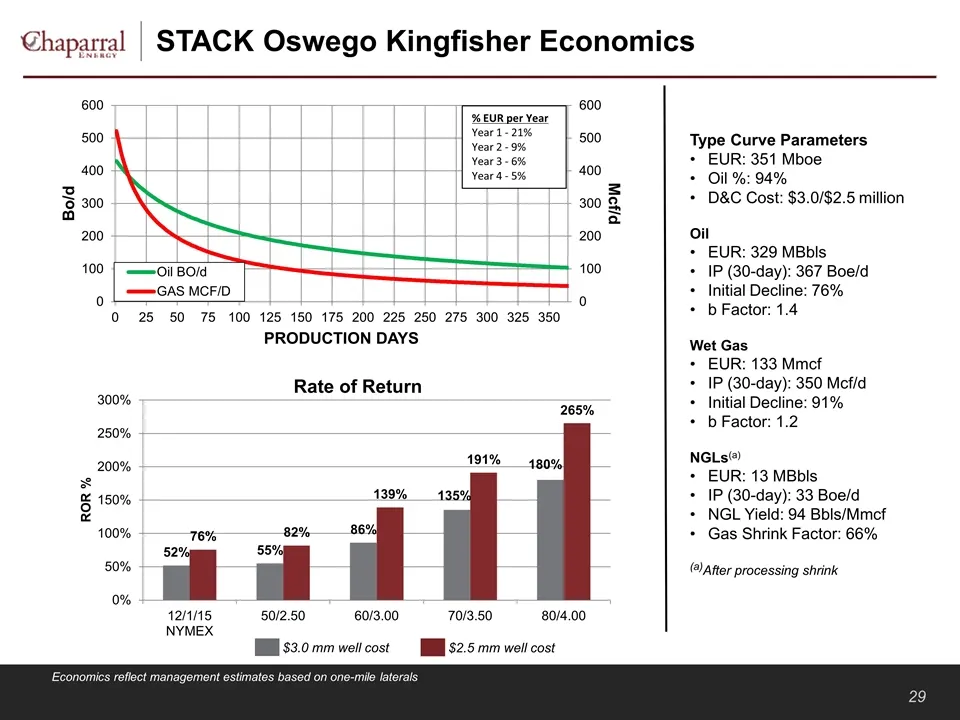
Slide 30: STACK Oswego Kingfisher Economics
STACK Oswego Kingfisher Economics Economics reflect management estimates based on one-mile laterals Type Curve Parameters EUR: 351 Mboe Oil %: 94% D&C Cost: $3.0/$2.5 million Oil EUR: 329 MBbls IP (30-day): 367 Boe/d Initial Decline: 76% b Factor: 1.4 Wet Gas EUR: 133 Mmcf IP (30-day): 350 Mcf/d Ini
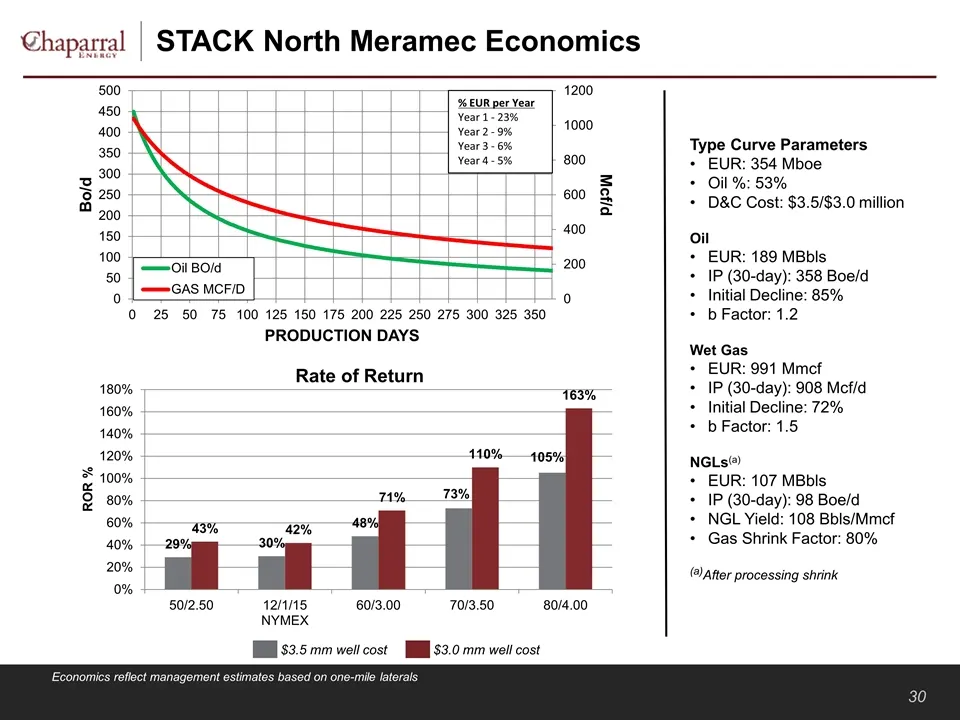
Slide 31: STACK North Meramec Economics
STACK North Meramec Economics Economics reflect management estimates based on one-mile laterals Type Curve Parameters EUR: 354 Mboe Oil %: 53% D&C Cost: $3.5/$3.0 million Oil EUR: 189 MBbls IP (30-day): 358 Boe/d Initial Decline: 85% b Factor: 1.2 Wet Gas EUR: 991 Mmcf IP (30-day): 908 Mcf/d Initial
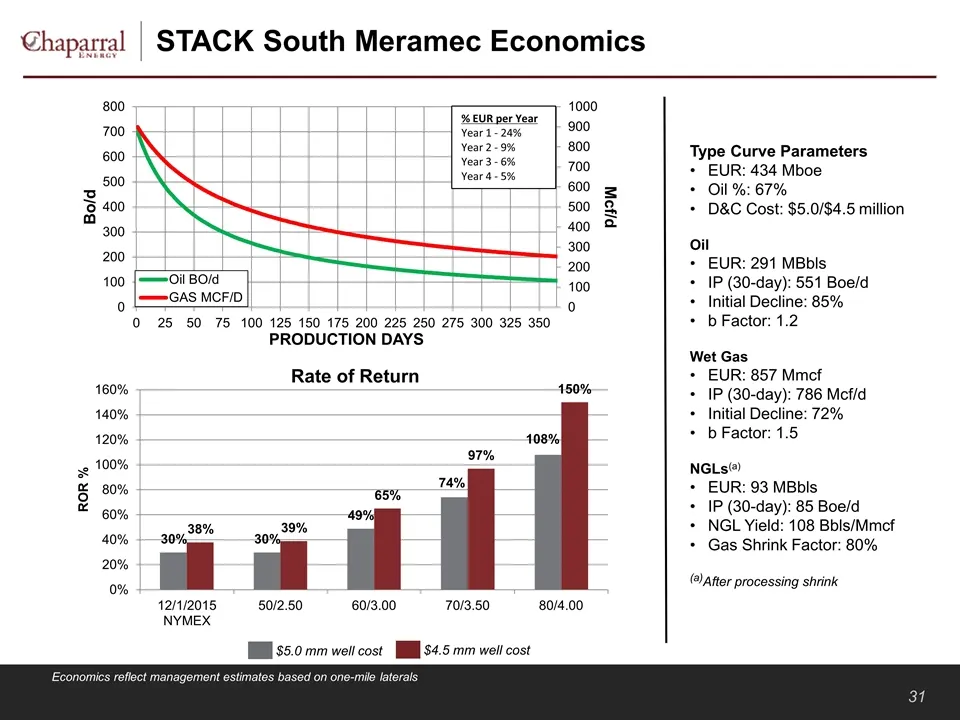
Slide 32: STACK South Meramec Economics
STACK South Meramec Economics Economics reflect management estimates based on one-mile laterals Type Curve Parameters EUR: 434 Mboe Oil %: 67% D&C Cost: $5.0/$4.5 million Oil EUR: 291 MBbls IP (30-day): 551 Boe/d Initial Decline: 85% b Factor: 1.2 Wet Gas EUR: 857 Mmcf IP (30-day): 786 Mcf/d Initial
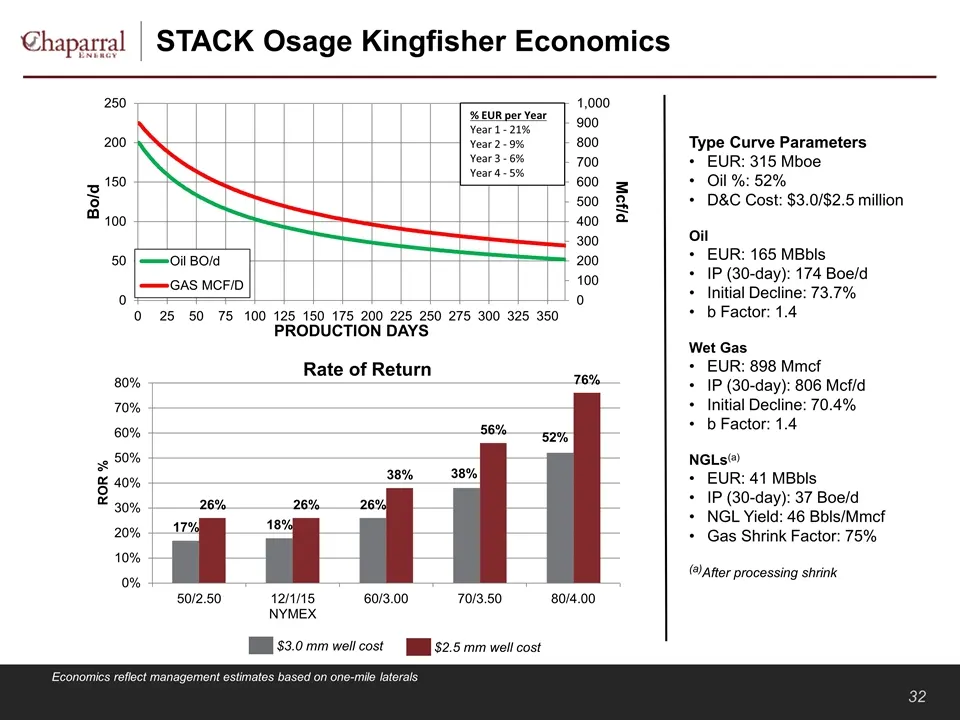
Slide 33: STACK Osage Kingfisher Economics
STACK Osage Kingfisher Economics Economics reflect management estimates based on one-mile laterals Type Curve Parameters EUR: 315 Mboe Oil %: 52% D&C Cost: $3.0/$2.5 million Oil EUR: 165 MBbls IP (30-day): 174 Boe/d Initial Decline: 73.7% b Factor: 1.4 Wet Gas EUR: 898 Mmcf IP (30-day): 806 Mcf/d In
Slide 34: STACK Osage Garfield Economics
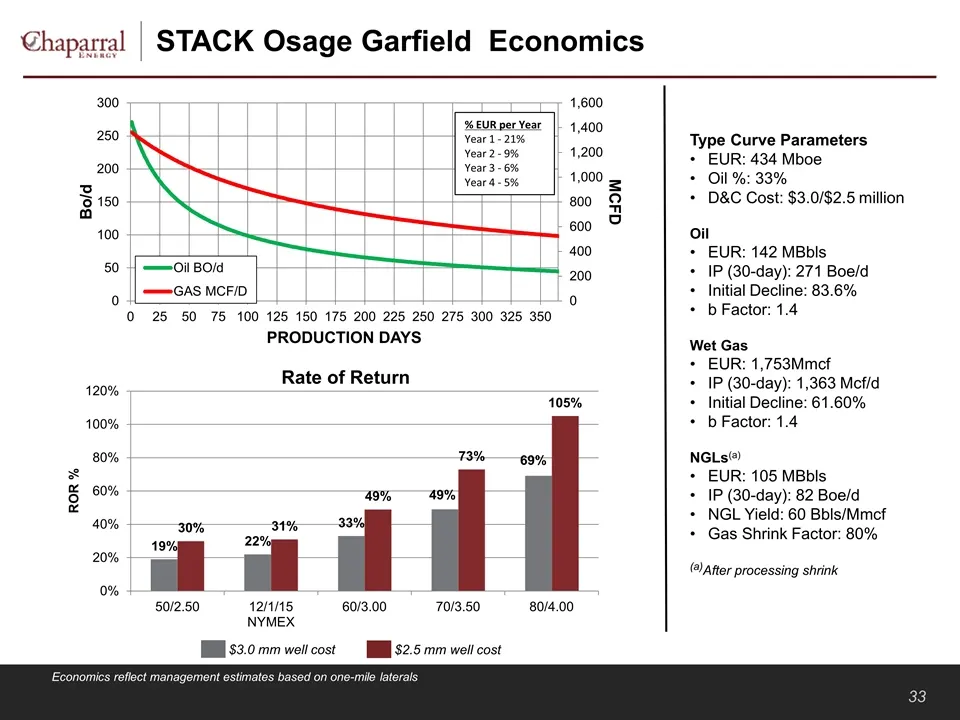
STACK Osage Garfield Economics Economics reflect management estimates based on one-mile laterals Type Curve Parameters EUR: 434 Mboe Oil %: 33% D&C Cost: $3.0/$2.5 million Oil EUR: 142 MBbls IP (30-day): 271 Boe/d Initial Decline: 83.6% b Factor: 1.4 Wet Gas EUR: 1,753Mmcf IP (30-day): 1,363 Mcf/d I
Slide 35: STACK East Canadian County Woodford Economics
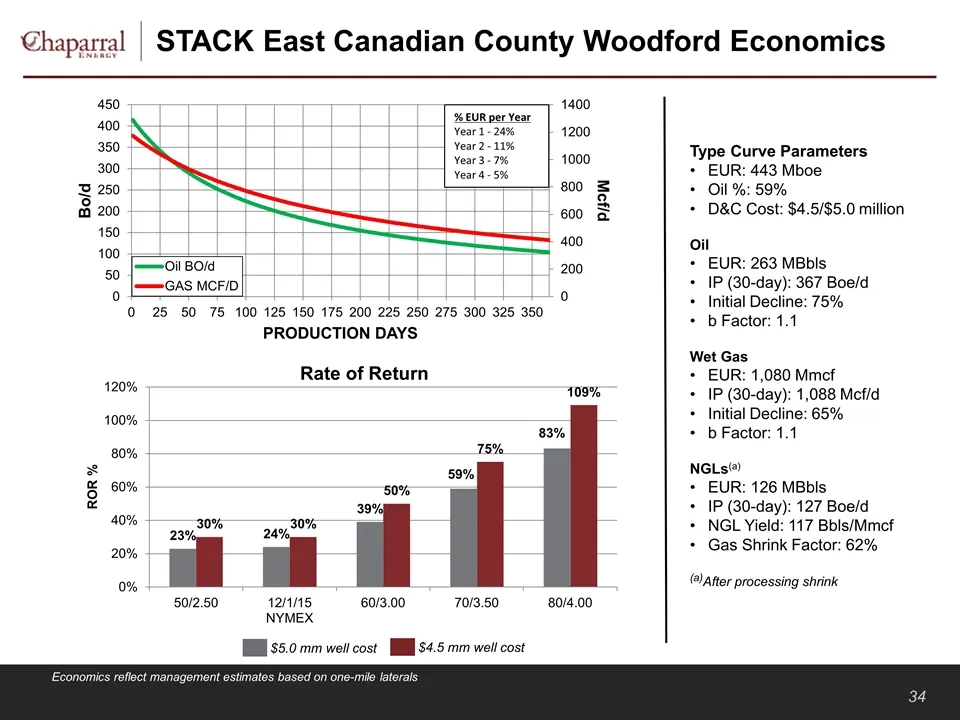
STACK East Canadian County Woodford Economics Economics reflect management estimates based on one-mile laterals Type Curve Parameters EUR: 443 Mboe Oil %: 59% D&C Cost: $4.5/$5.0 million Oil EUR: 263 MBbls IP (30-day): 367 Boe/d Initial Decline: 75% b Factor: 1.1 Wet Gas EUR: 1,080 Mmcf IP (30-day):
Slide 36: Mississippi Lime
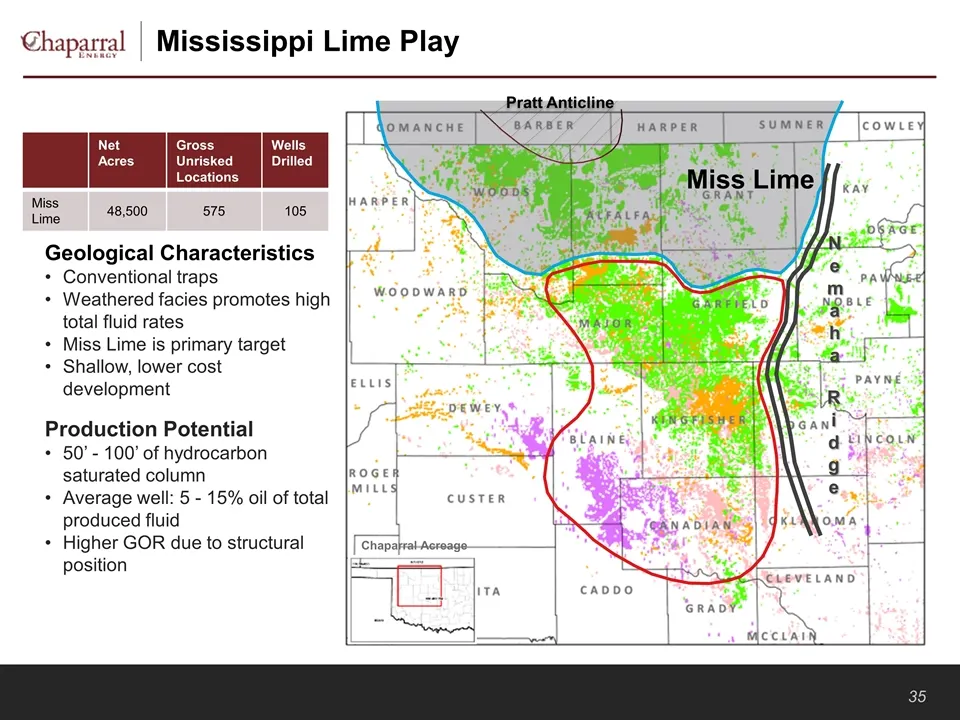
Mississippi Lime Play Net Acres Gross Unrisked Locations Wells Drilled Miss Lime 48,500 575 105 Geological Characteristics Conventional traps Weathered facies promotes high total fluid rates Miss Lime is primary target Shallow, lower cost development Production Potential 50’ - 100’ of hydrocarbon sa
Slide 37: Miss Lime Economics
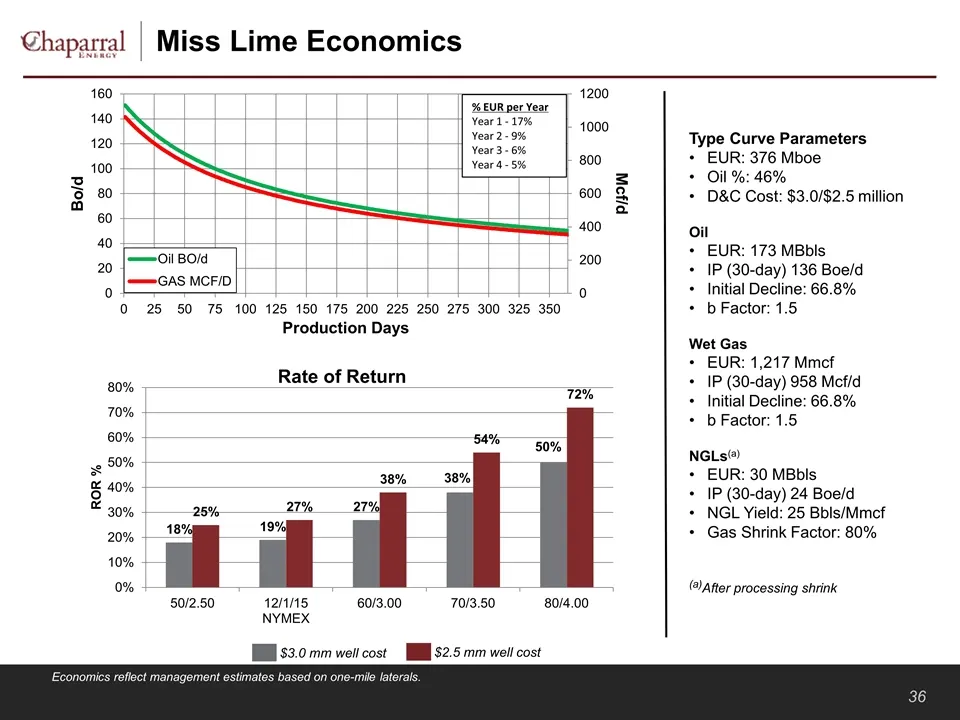
Miss Lime Economics Economics reflect management estimates based on one-mile laterals. Type Curve Parameters EUR: 376 Mboe Oil %: 46% D&C Cost: $3.0/$2.5 million Oil EUR: 173 MBbls IP (30-day) 136 Boe/d Initial Decline: 66.8% b Factor: 1.5 Wet Gas EUR: 1,217 Mmcf IP (30-day) 958 Mcf/d Initial Declin
Slide 38: CO2 EOR – Major Part of Growth Story
CO2 EOR – Major Part of Growth Story
Slide 39: Leader in the CO2 EOR Industry
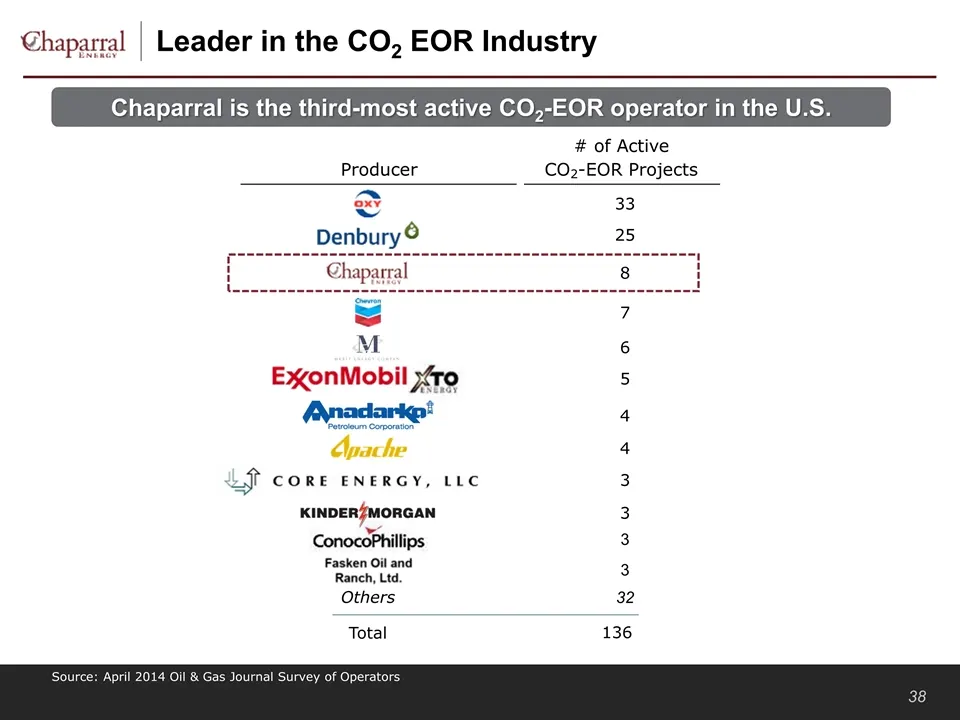
Leader in the CO2 EOR Industry Source: April 2014 Oil & Gas Journal Survey of Operators 3 32 # of Active Producer CO 2 -EOR Projects 33 25 7 6 5 4 4 3 3 Total 136 Others 3 8 Chaparral is the third-most active CO2-EOR operator in the U.S.
Slide 40: CO2 EOR-focused Areas
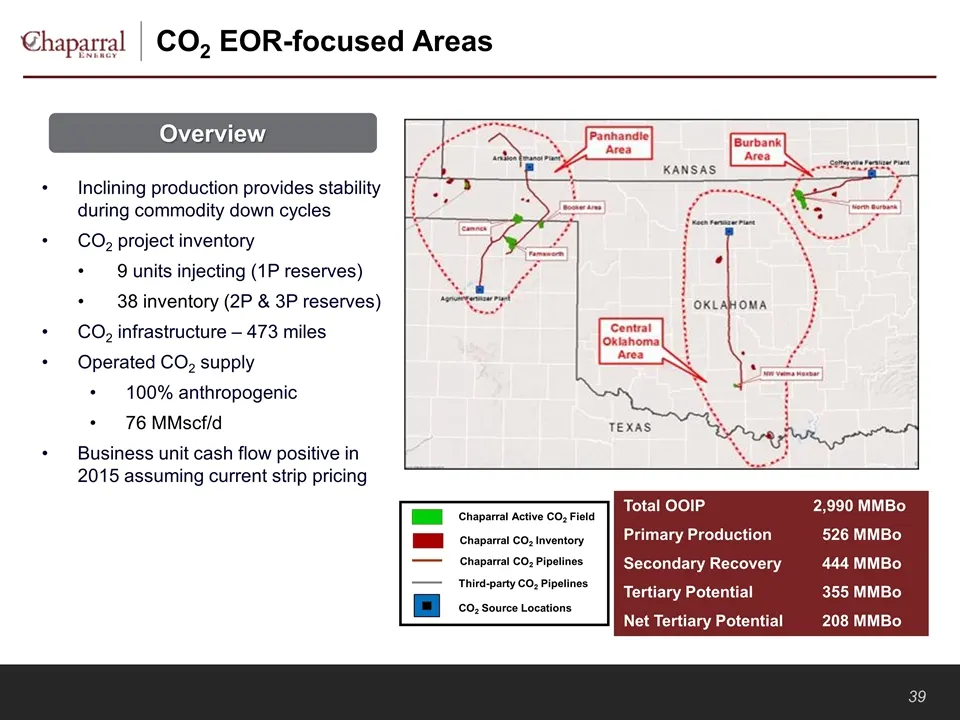
CO2 EOR-focused Areas Inclining production provides stability during commodity down cycles CO2 project inventory 9 units injecting (1P reserves) 38 inventory (2P & 3P reserves) CO2 infrastructure – 473 miles Operated CO2 supply 100% anthropogenic 76 MMscf/d Business unit cash flow positive in 2015 a
Slide 41: Proven Performance Record
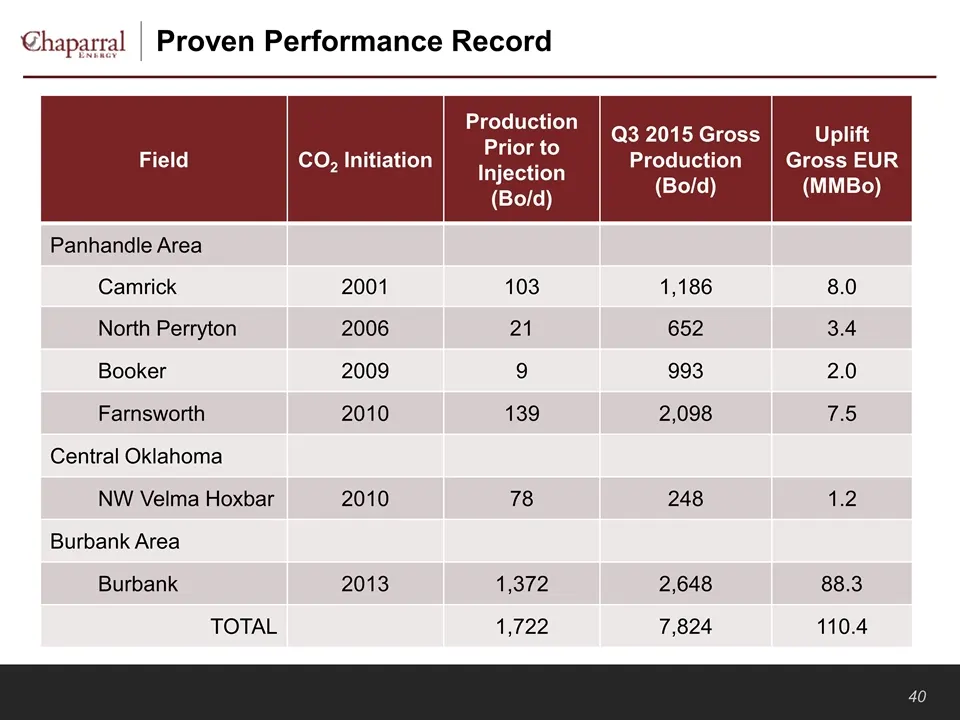
Proven Performance Record Field CO2 Initiation Production Prior to Injection (Bo/d) Q3 2015 Gross Production (Bo/d) Uplift Gross EUR (MMBo) Panhandle Area Camrick 2001 103 1,186 8.0 North Perryton 2006 21 652 3.4 Booker 2009 9 993 2.0 Farnsworth 2010 139 2,098 7.5 Central Oklahoma NW Velma Hoxbar 20
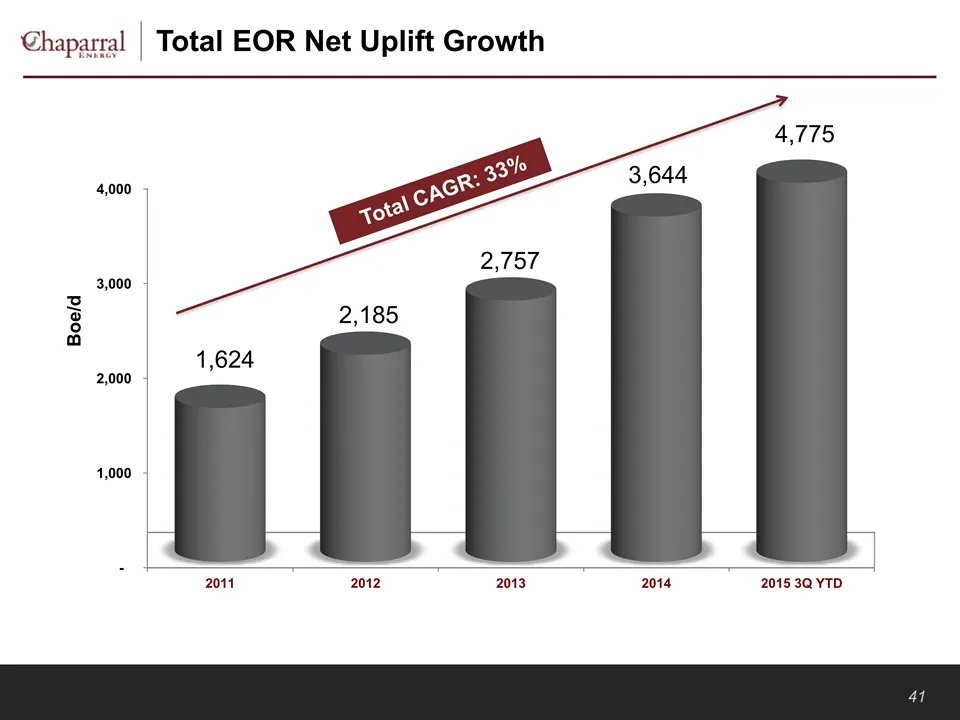
Slide 42: Total EOR Net Uplift Growth
Total EOR Net Uplift Growth Total CAGR: 33%
Slide 43: North Burbank
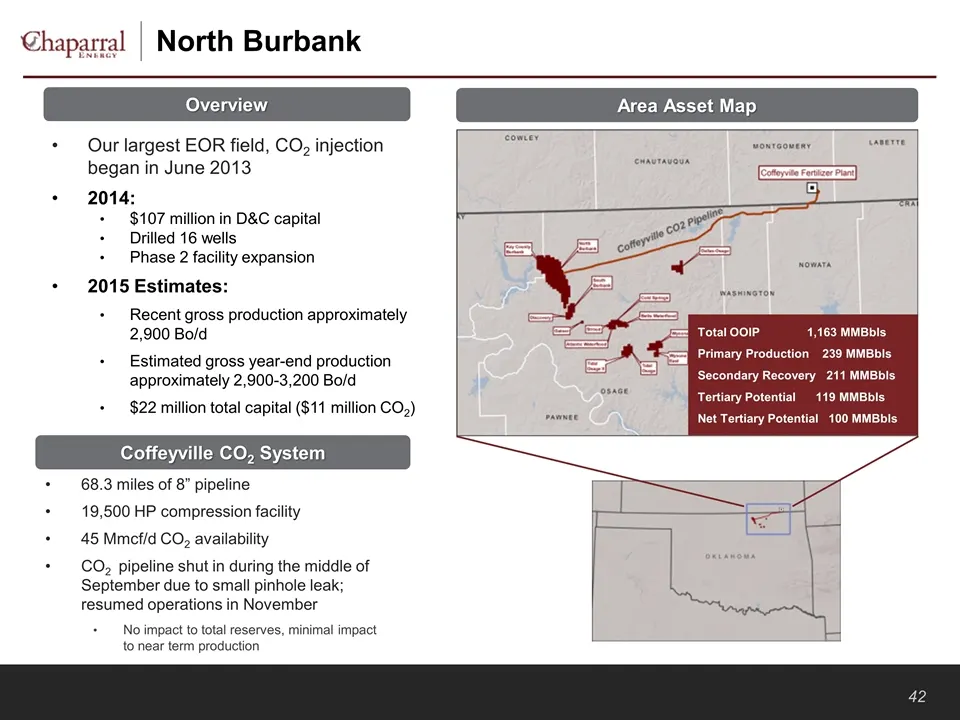
North Burbank Our largest EOR field, CO2 injection began in June 2013 2014: $107 million in D&C capital Drilled 16 wells Phase 2 facility expansion 2015 Estimates: Recent gross production approximately 2,900 Bo/d Estimated gross year-end production approximately 2,900-3,200 Bo/d $22 million total ca
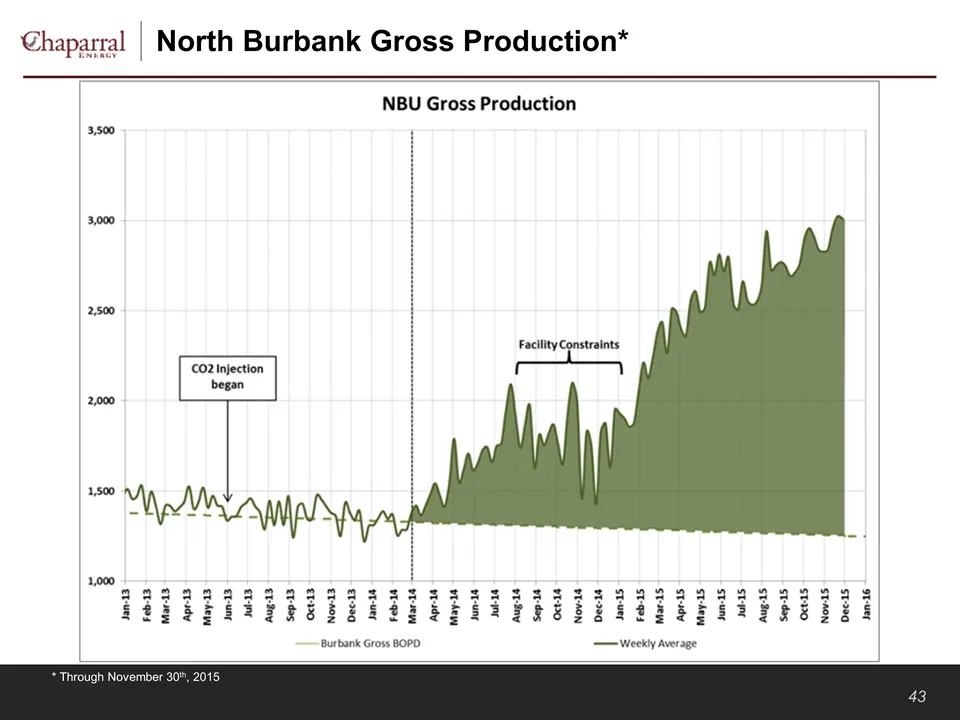
Slide 44: North Burbank Gross Production
North Burbank Gross Production* * Through November 30th, 2015

Slide 45: Financial Overview
Financial Overview
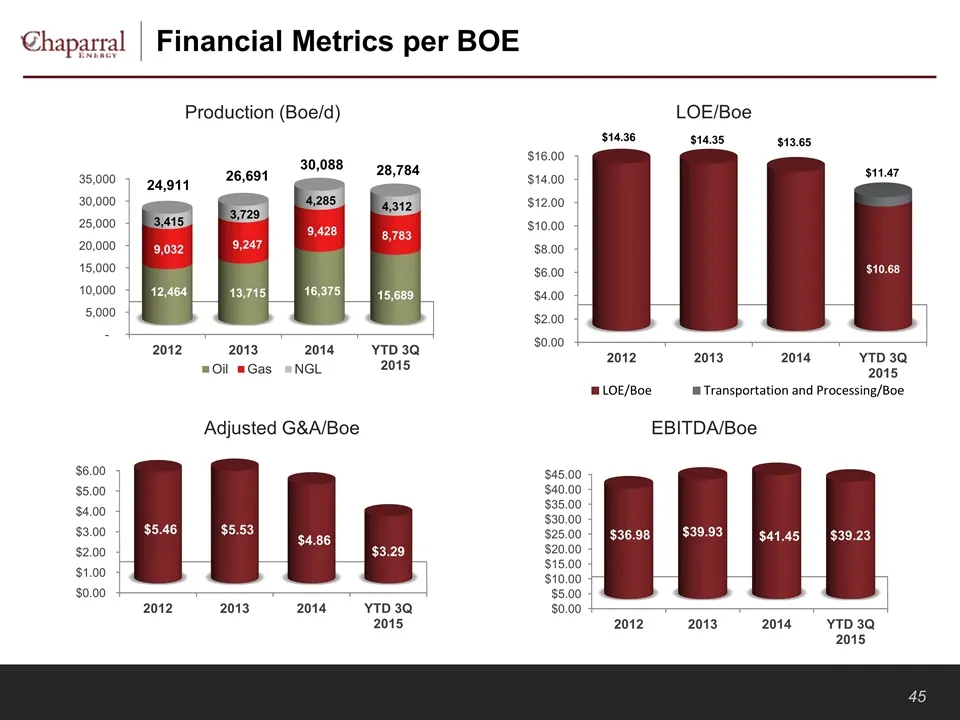
Slide 46: Financial Metrics per BOE
Financial Metrics per BOE Production (Boe/d) 28,784 $11.47 LOE/Boe EBITDA/Boe Adjusted G&A/Boe
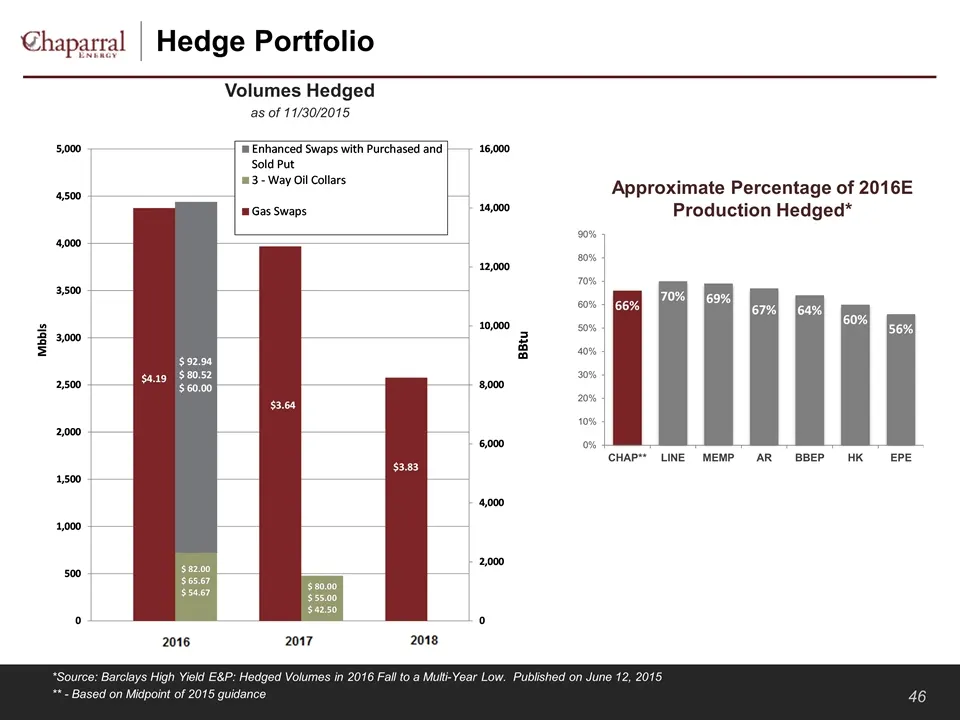
Slide 47: Hedge Portfolio
Hedge Portfolio Volumes Hedged as of 11/30/2015 Approximate Percentage of 2016E Production Hedged* *Source: Barclays High Yield E&P: Hedged Volumes in 2016 Fall to a Multi-Year Low. Published on June 12, 2015 ** - Based on Midpoint of 2015 guidance
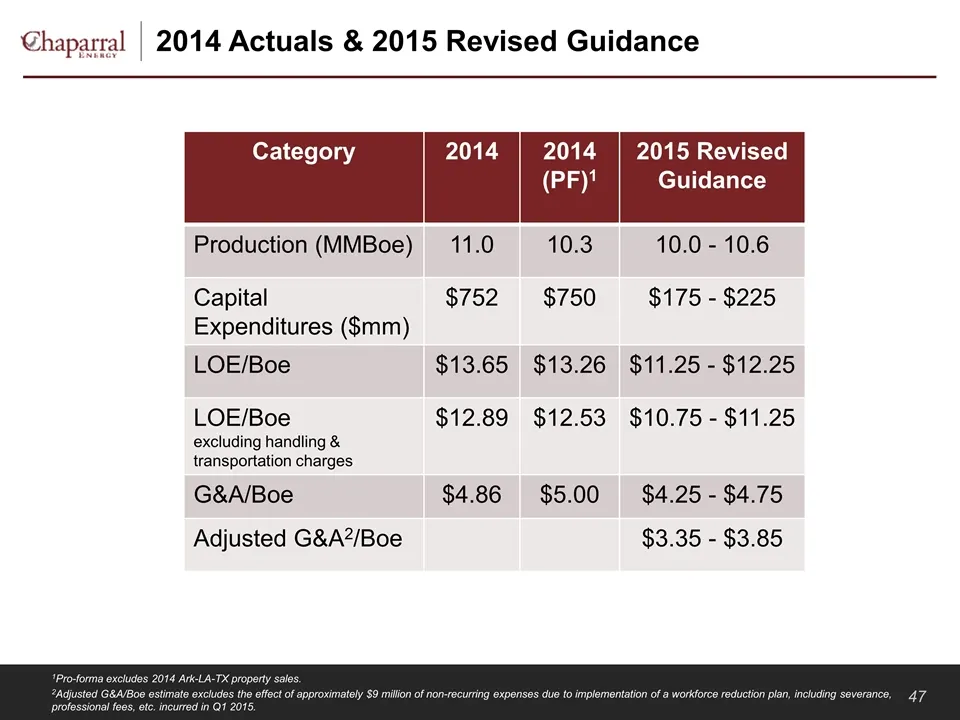
Slide 48: 2014 Actuals & 2015 Revised Guidance
2014 Actuals & 2015 Revised Guidance 1Pro-forma excludes 2014 Ark-LA-TX property sales. 2Adjusted G&A/Boe estimate excludes the effect of approximately $9 million of non-recurring expenses due to implementation of a workforce reduction plan, including severance, professional fees, etc. incurred in Q
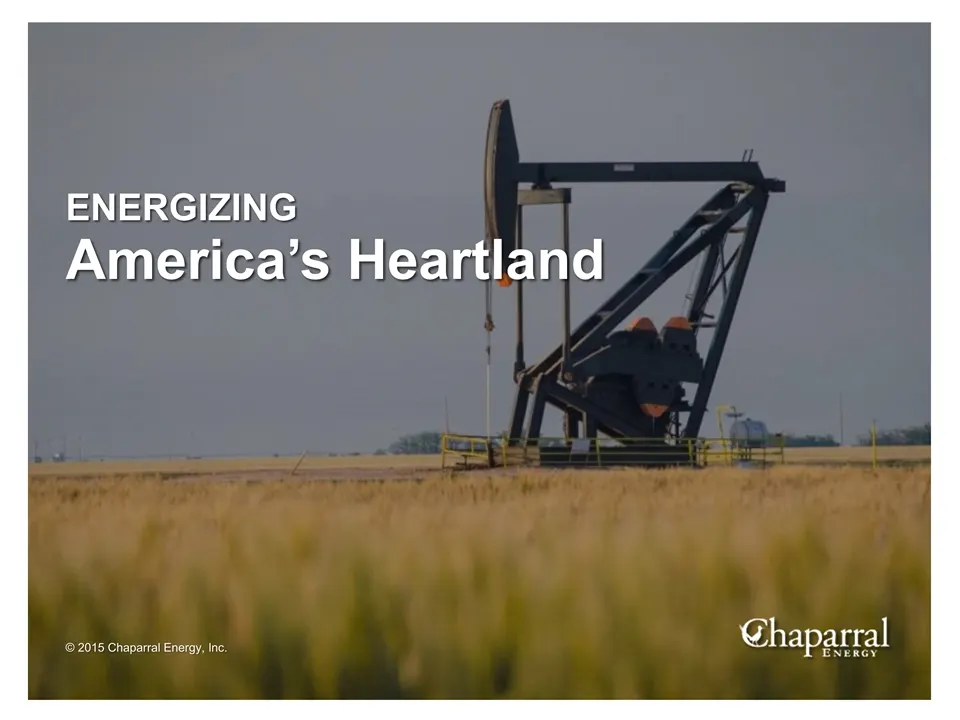
Slide 49: Energizing America's Heartland
ENERGIZING America’s Heartland Chaparral
Source: SEC EDGAR · 8-K filed Dec 8, 2015
More decks from Chaparral Energy Inc
 Debt Investor Presentation (August 2020)10 slides · Aug 17, 2020
 Q1 2020 Earnings Presentation26 slides · May 12, 2020
 Investor Presentation (March 2020)30 slides · Mar 12, 2020
 Q3 2019 Earnings Presentation31 slides · Nov 12, 2019
 Q2 2019 Earnings Presentation33 slides · Aug 8, 2019
 Investor Presentation (May 2019)41 slides · May 28, 2019