Sumitomo Mitsui Financial Group, Inc. · TSE:8316
Sumitomo Mitsui Financial — Investor Presentation (February 2025)
72 slides from Sumitomo Mitsui Financial's investor presentation, February 2025
Slide 1: Investor Presentation
Investor Presentation February, 2025 Copyright © 2025 Sumitomo Mitsui Financial Group. All Rights Reserved.
Slide 2: Agenda
Agenda Ⅰ Financial Result ////////////////////////////////////////////// 3 Ⅱ Enhance Corporate Value //////////////////// 23 Ⅲ Capital Policy ////////////////////////////////////////// 40 Appendix ////////////////////////////////////////// 47 Copyright © 2025 Sumitomo Mitsui Financial Group. All Rig

Slide 3: Financial Results
Financial Results
Slide 4: 1H results and target
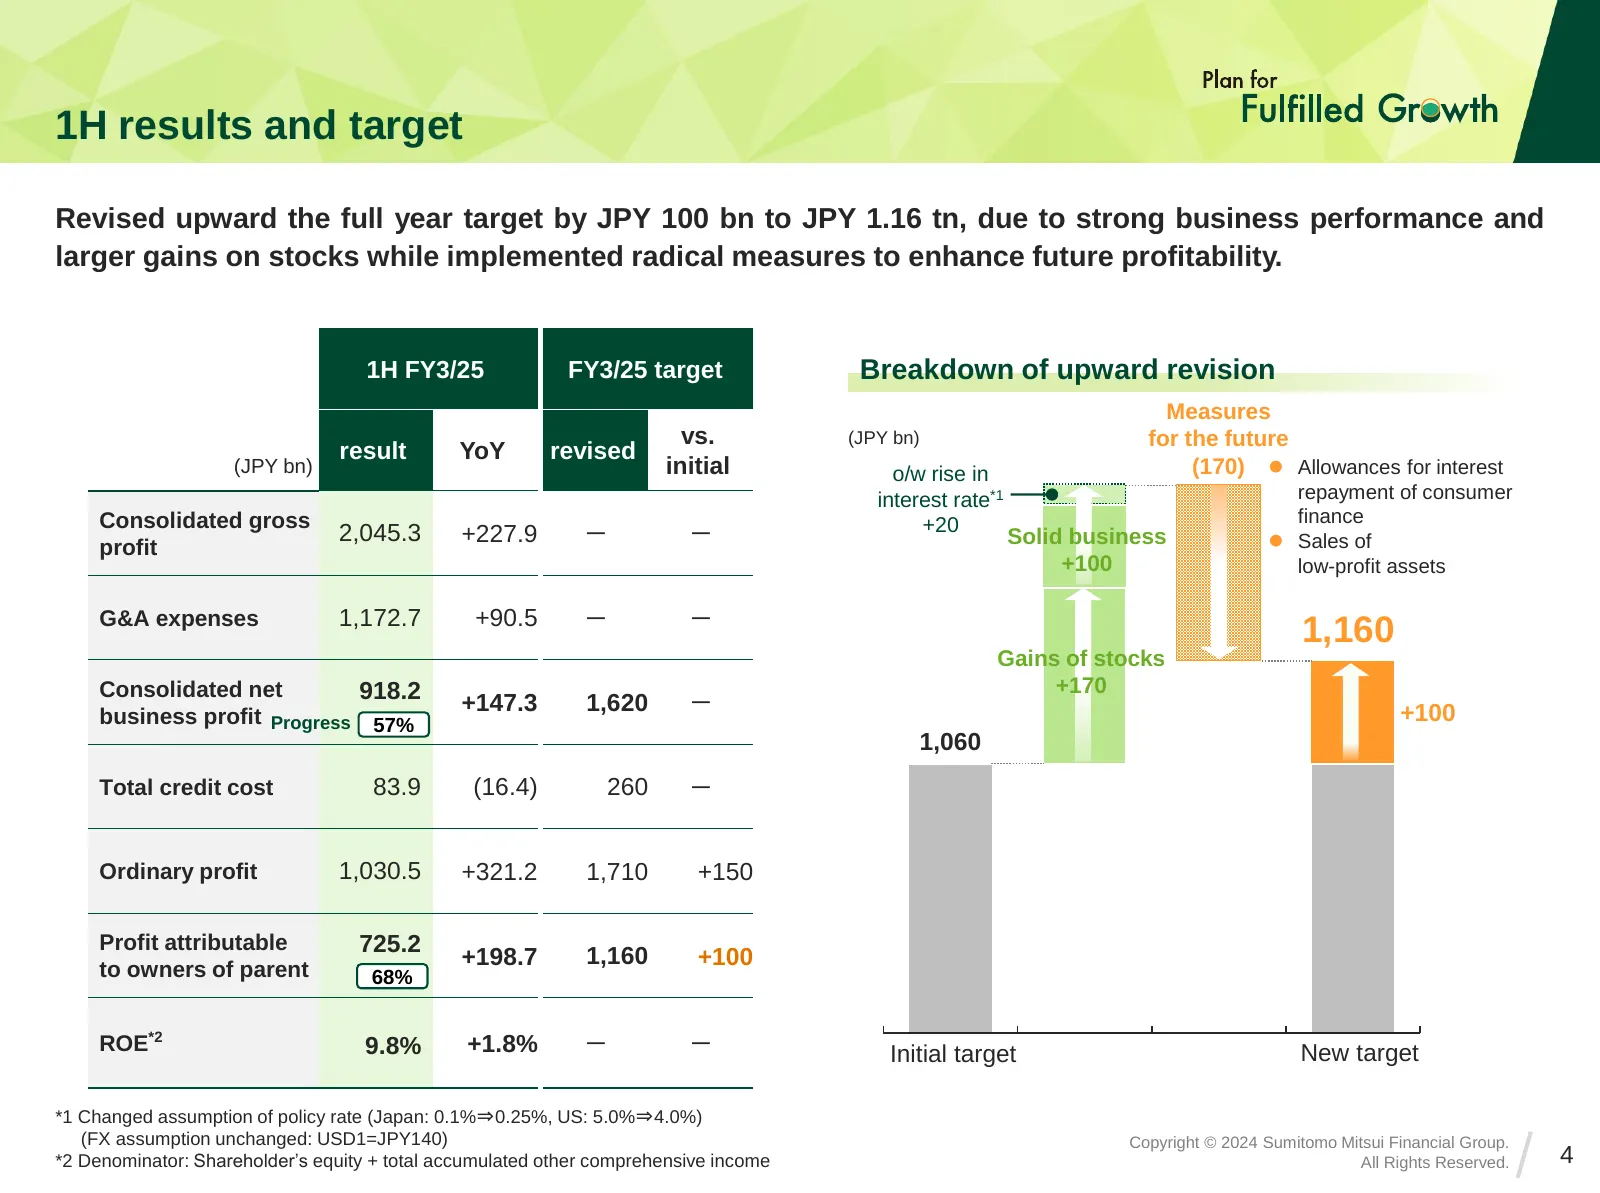
1H results and target Revised upward the full year target by JPY 100 bn to JPY 1.16 tn, due to strong business performance and larger gains on stocks while implemented radical measures to enhance future profitability. 1H FY3/25 FY3/25 target Breakdown of upward revision Measures vs. (JPY bn) for the
Slide 5: Radical allowance on interest repayment
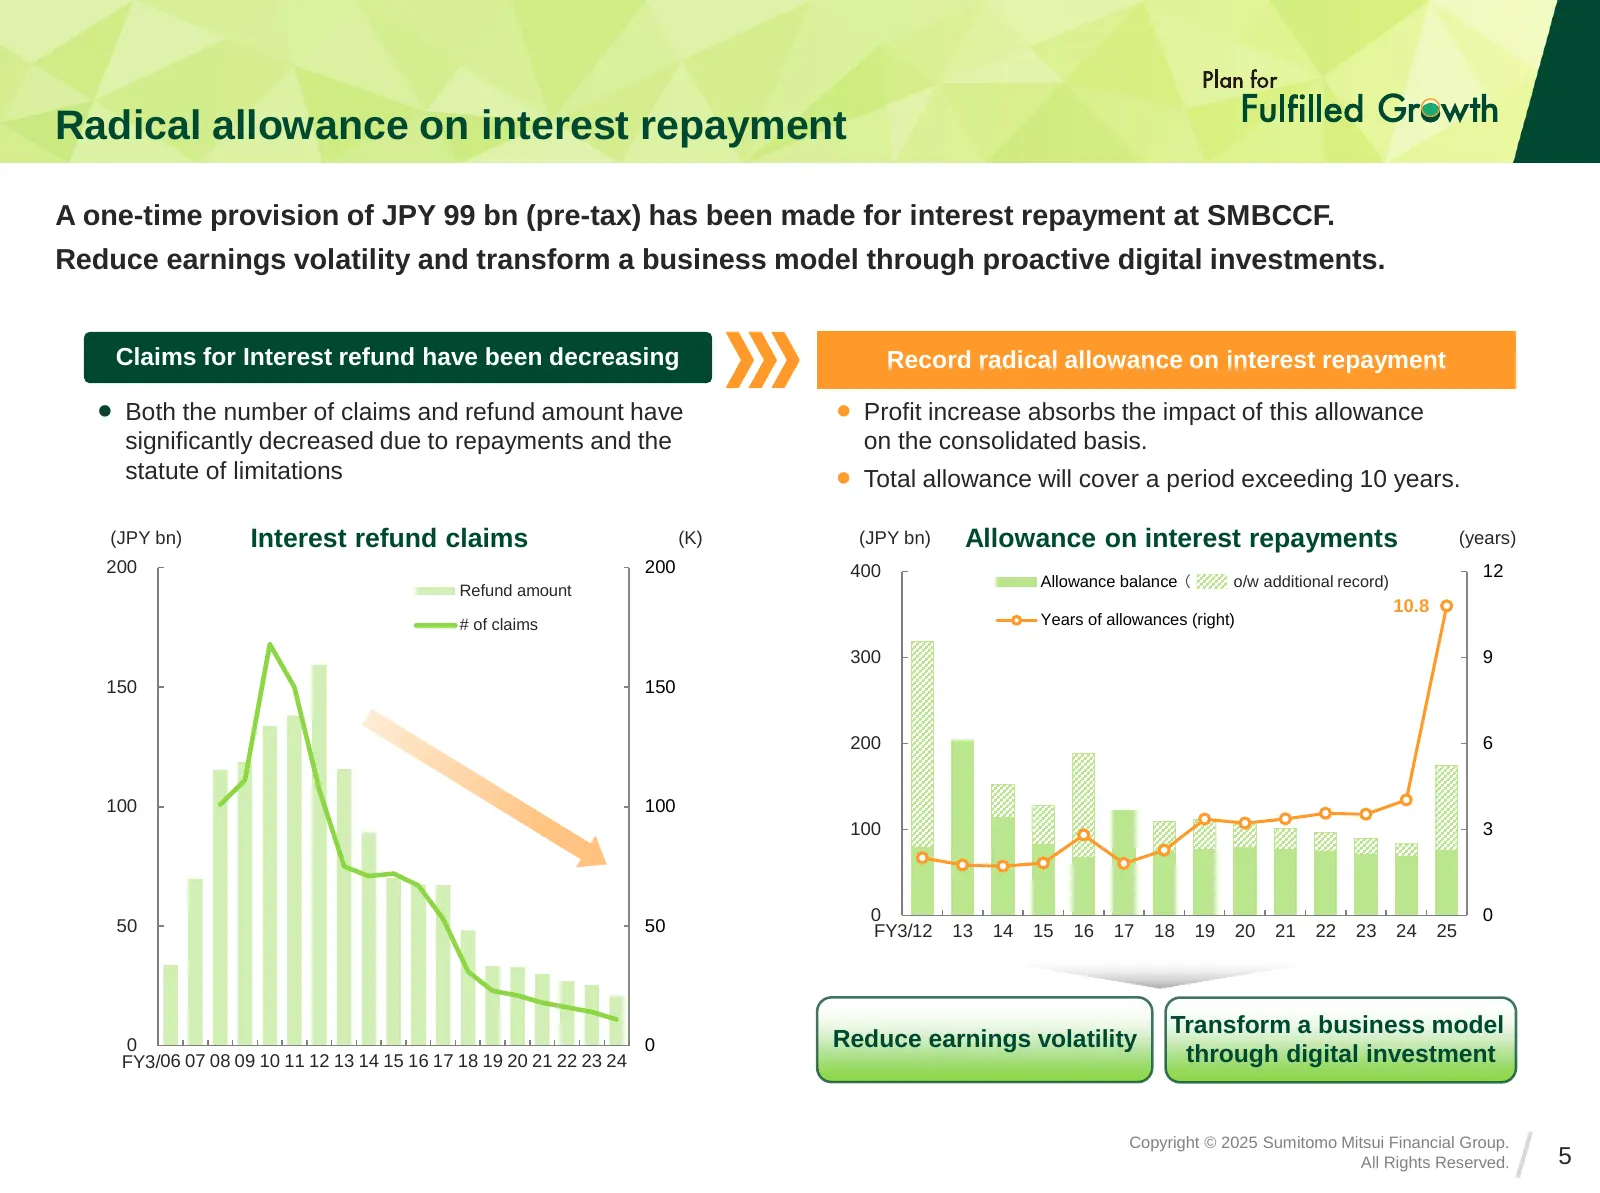
Radical allowance on interest repayment A one-time provision of JPY 99 bn (pre-tax) has been made for interest repayment at SMBCCF. Reduce earnings volatility and transform a business model through proactive digital investments. Claims for Interest refund have been decreasing Record radical allowanc
Slide 6: Estimated impact of JPY interest rate hike
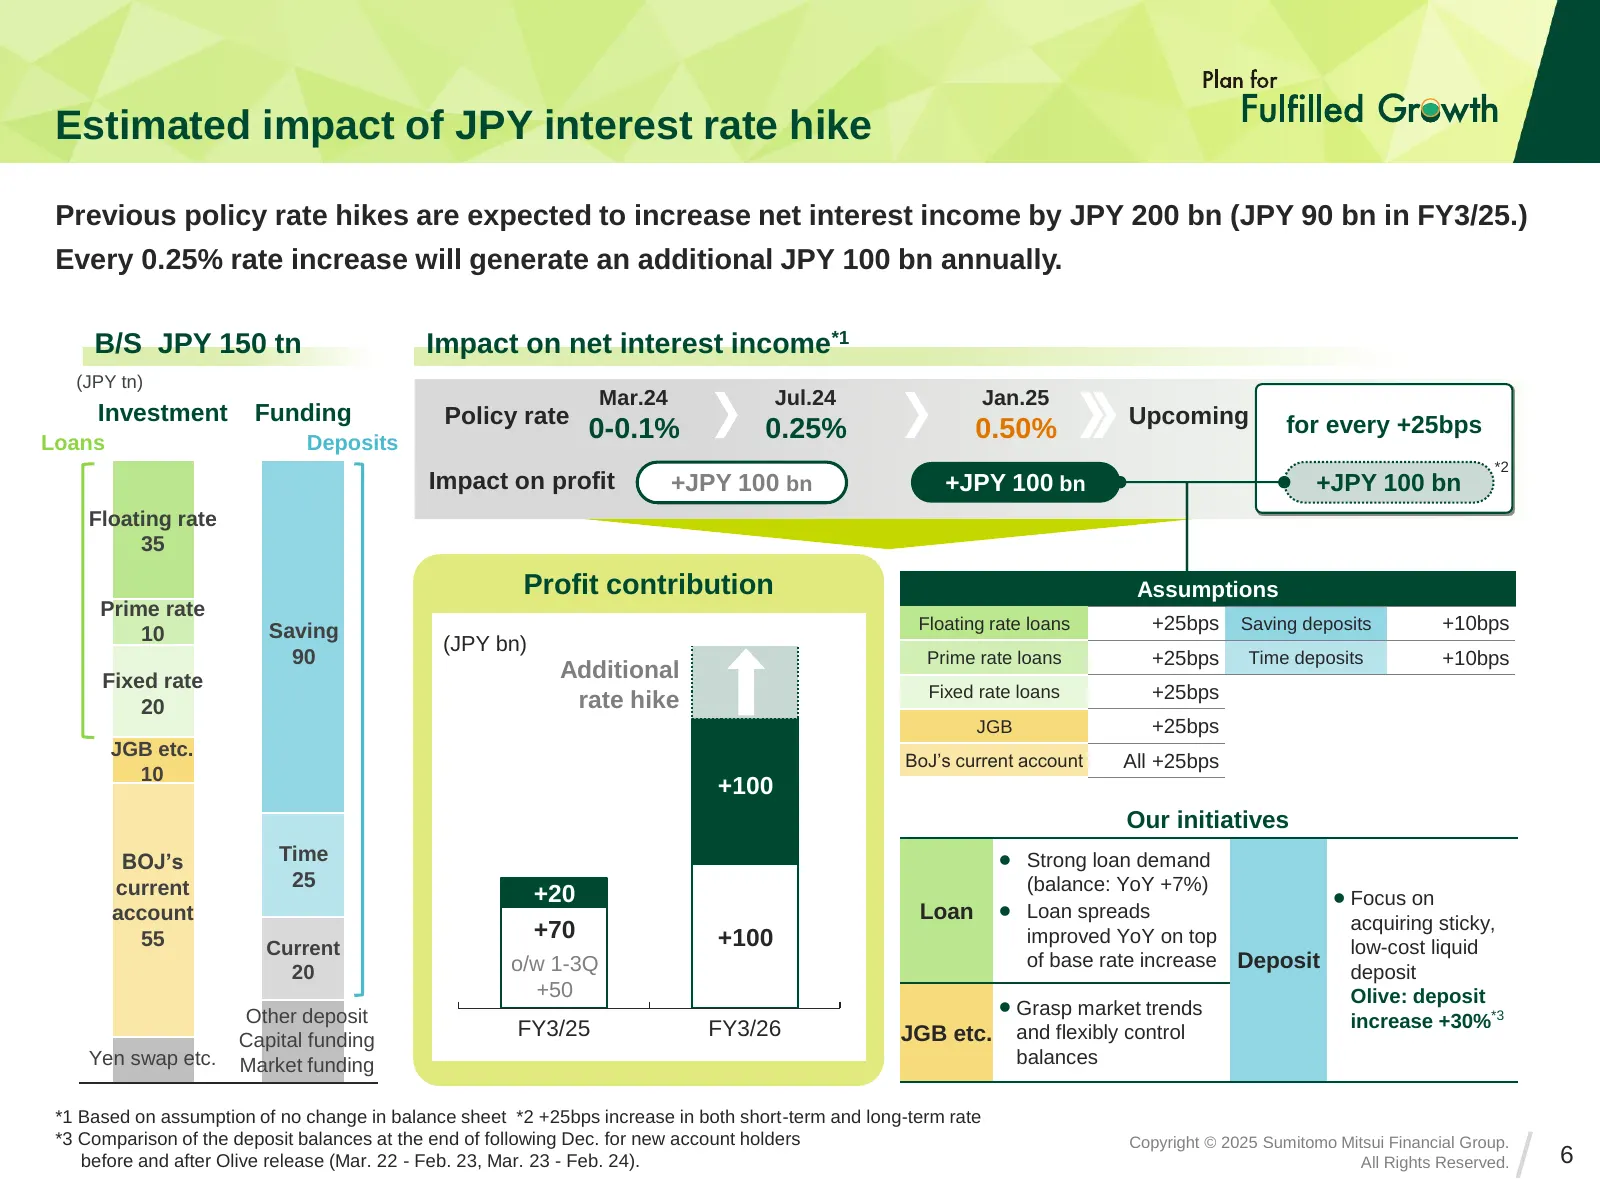
Estimated impact of JPY interest rate hike Previous policy rate hikes are expected to increase net interest income by JPY 200 bn (JPY 90 bn in FY3/25.) Every 0.25% rate increase will generate an additional JPY 100 bn annually. B/S JPY 150 tn Impact on net interest income*1 (JPY tn) Mar.24 Jul.24 Jan
Slide 7: Income statement
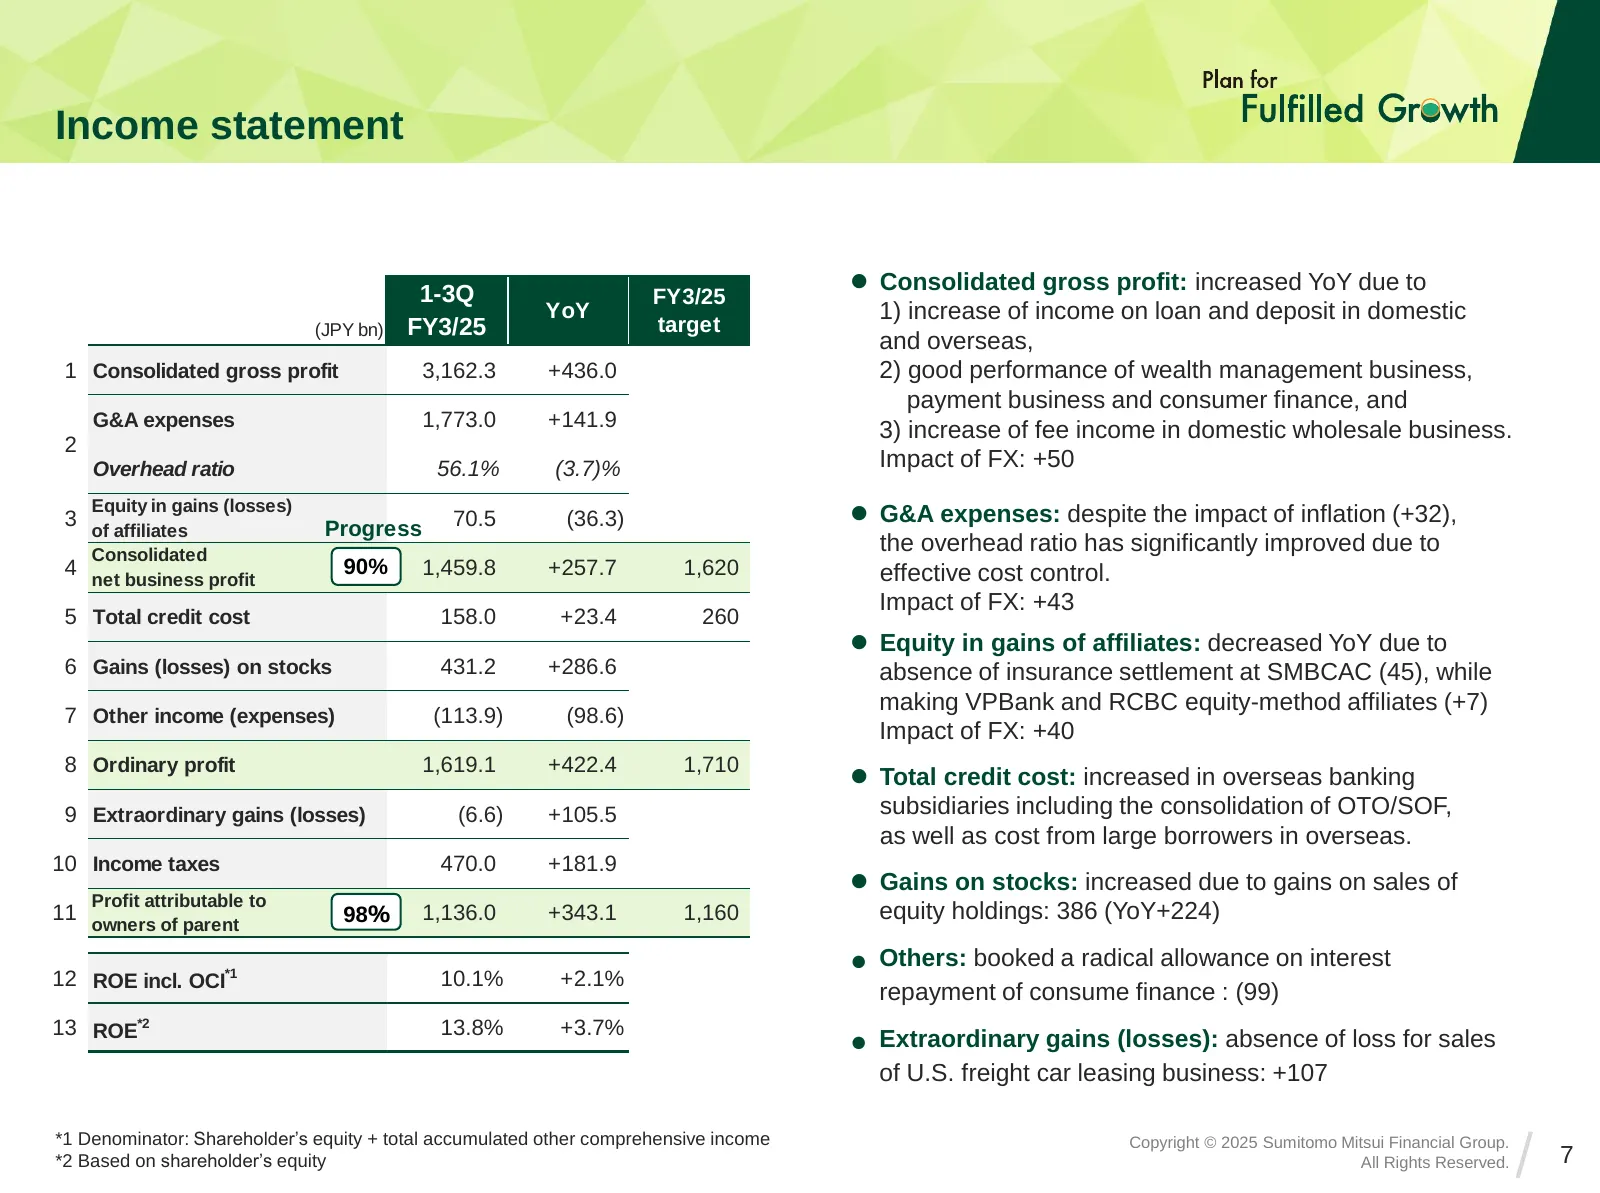
Income statement ⚫ Consolidated gross profit: increased YoY due to 1-3Q FY3/25 YoY 1) increase of income on loan and deposit in domestic (JPY bn) FY3/25 target and overseas, 1 Consolidated gross profit 3,162.3 +436.0 2) good performance of wealth management business, payment business and consumer fi
Slide 8: (Ref.) Group companies
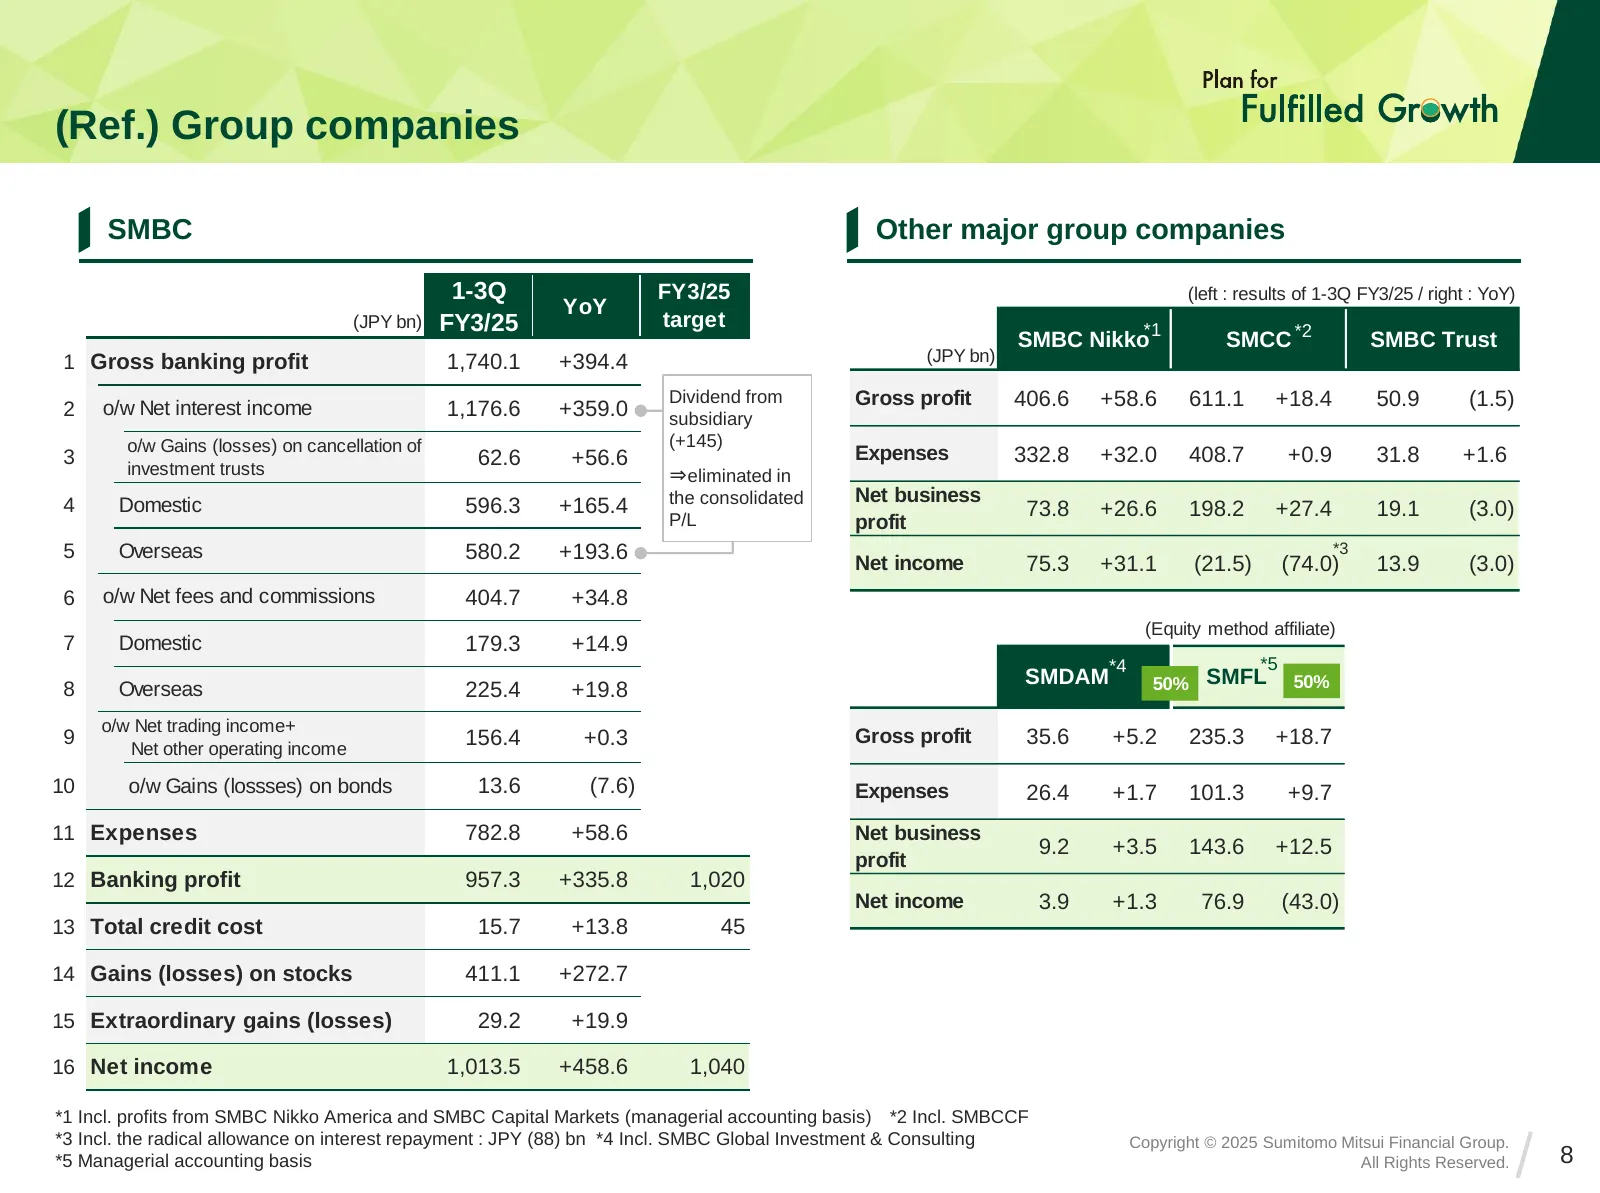
(Ref.) Group companies SMBC Other major group companies 1-3Q FY3/25 (left : results of 1-3Q FY3/25 / right : YoY) YoY (JPY bn) FY3/25 target SMBC Nikko*1 SMCC *2 SMBC Trust 1 Gross banking profit 1,740.1 +394.4 (JPY bn) Dividend from Gross profit 406.6 +58.6 611.1 +18.4 50.9 (1.5) 2 o/w Net interest
Slide 9: Breakdown of profit
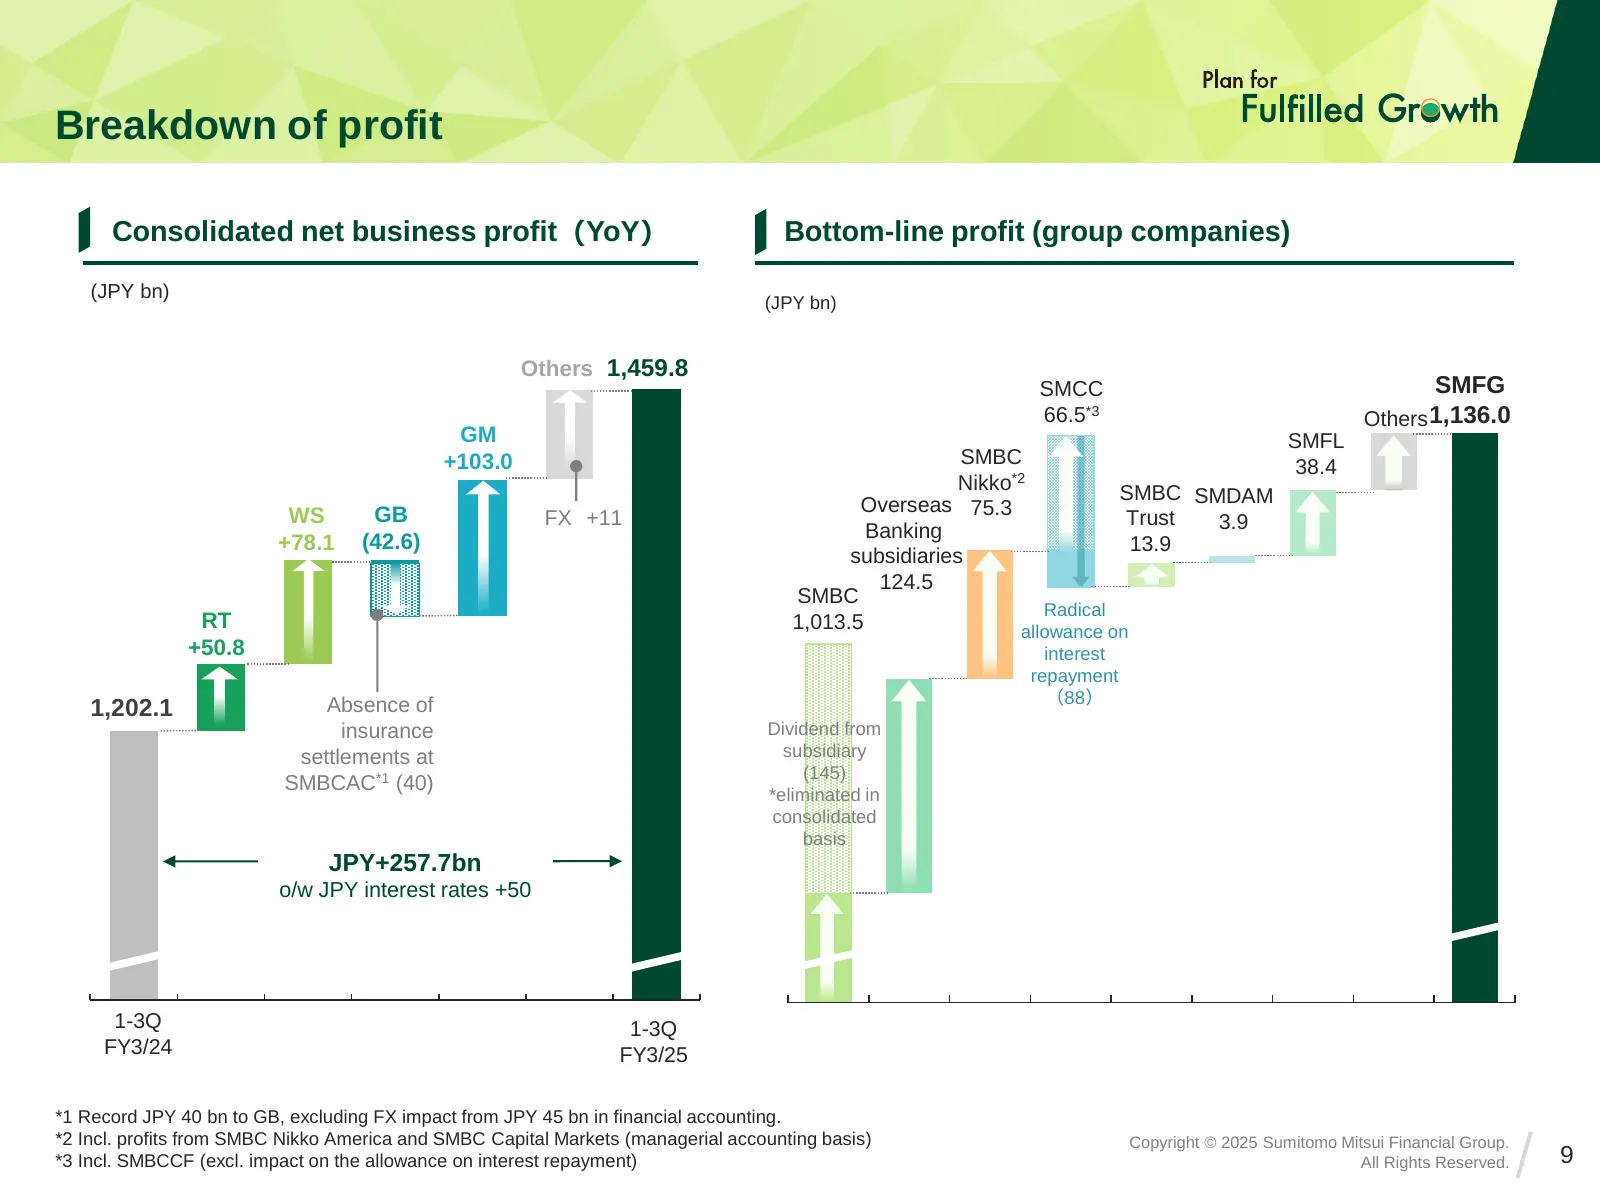
Breakdown of profit Consolidated net business profit(YoY) Bottom-line profit (group companies) (JPY bn) (JPY bn) Others 1,459.8 SMCC SMFG 66.5*3 Others 1,136.0 GM SMFL +103.0 SMBC 38.4 Nikko*2 SMBC SMDAM WS GB Overseas 75.3 FX +11 Trust 3.9 Banking +78.1 (42.6) 13.9 subsidiaries 124.5 SMBC Radical R
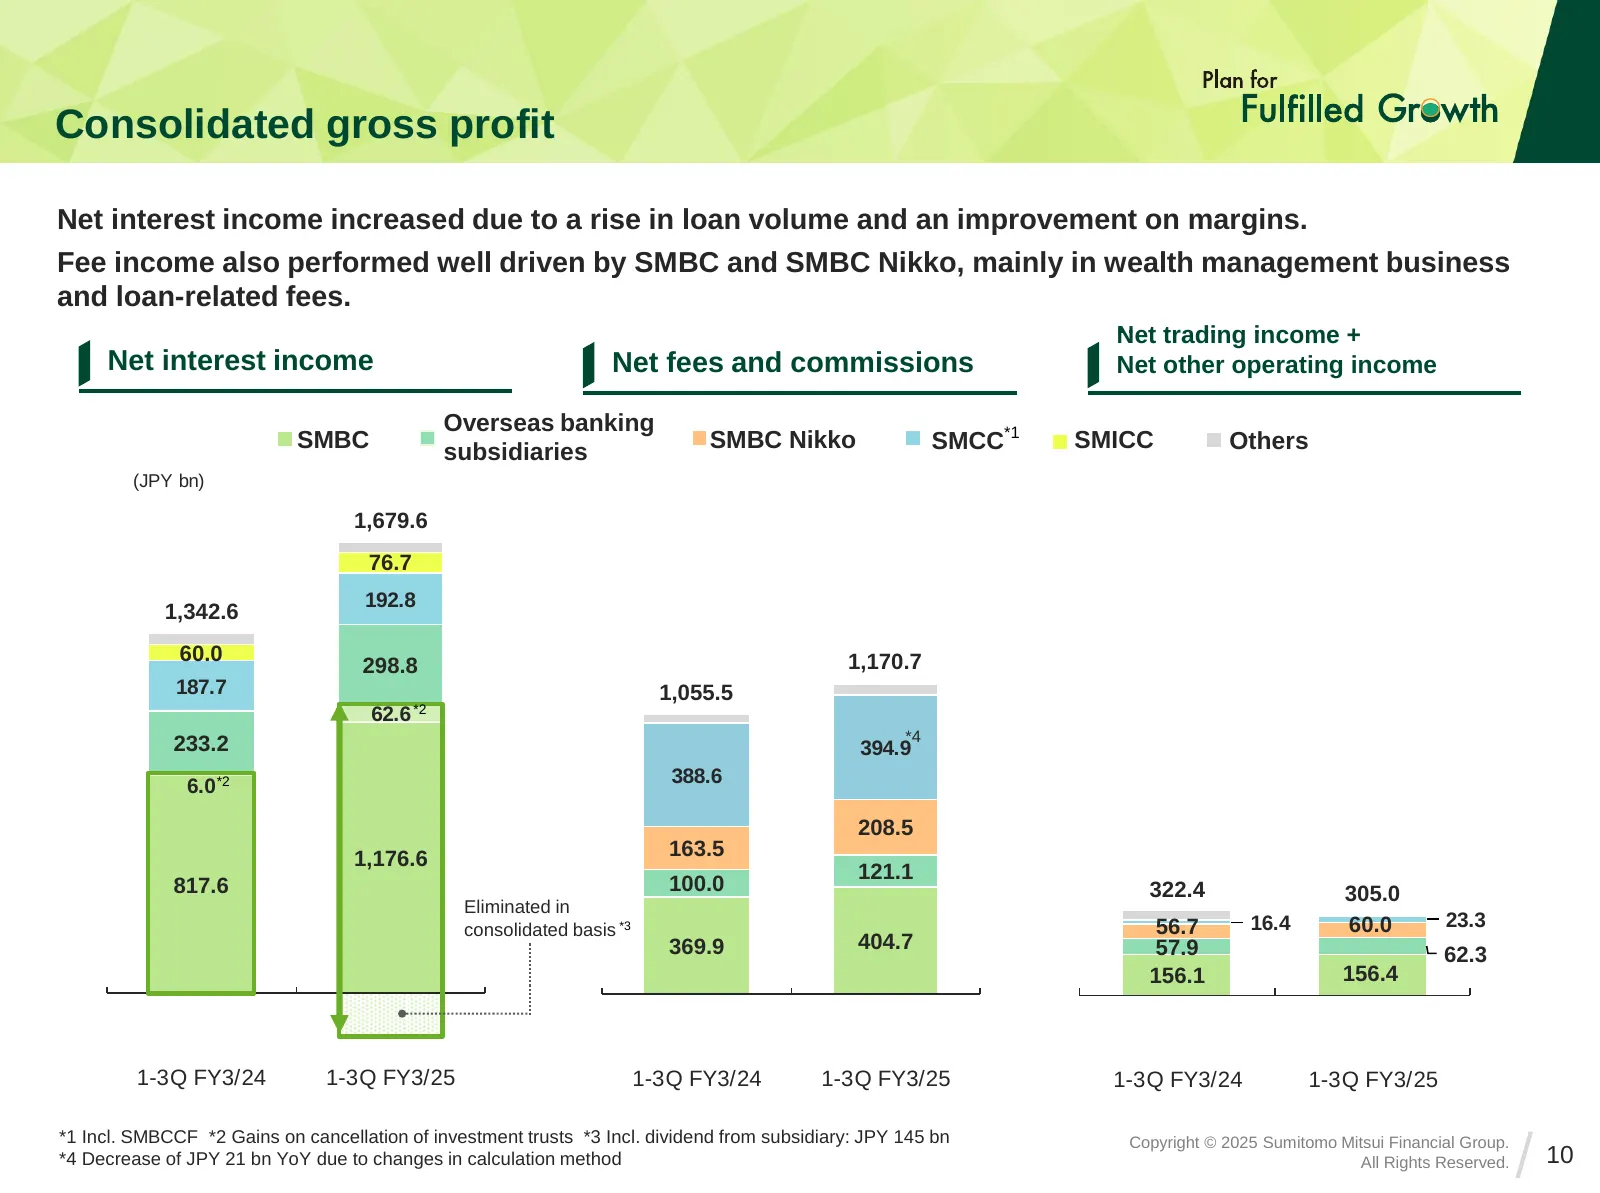
Slide 10: Consolidated gross profit
Consolidated gross profit Net interest income increased due to a rise in loan volume and an improvement on margins. Fee income also performed well driven by SMBC and SMBC Nikko, mainly in wealth management business and loan-related fees. Net trading income + Net interest income Net fees and commissi
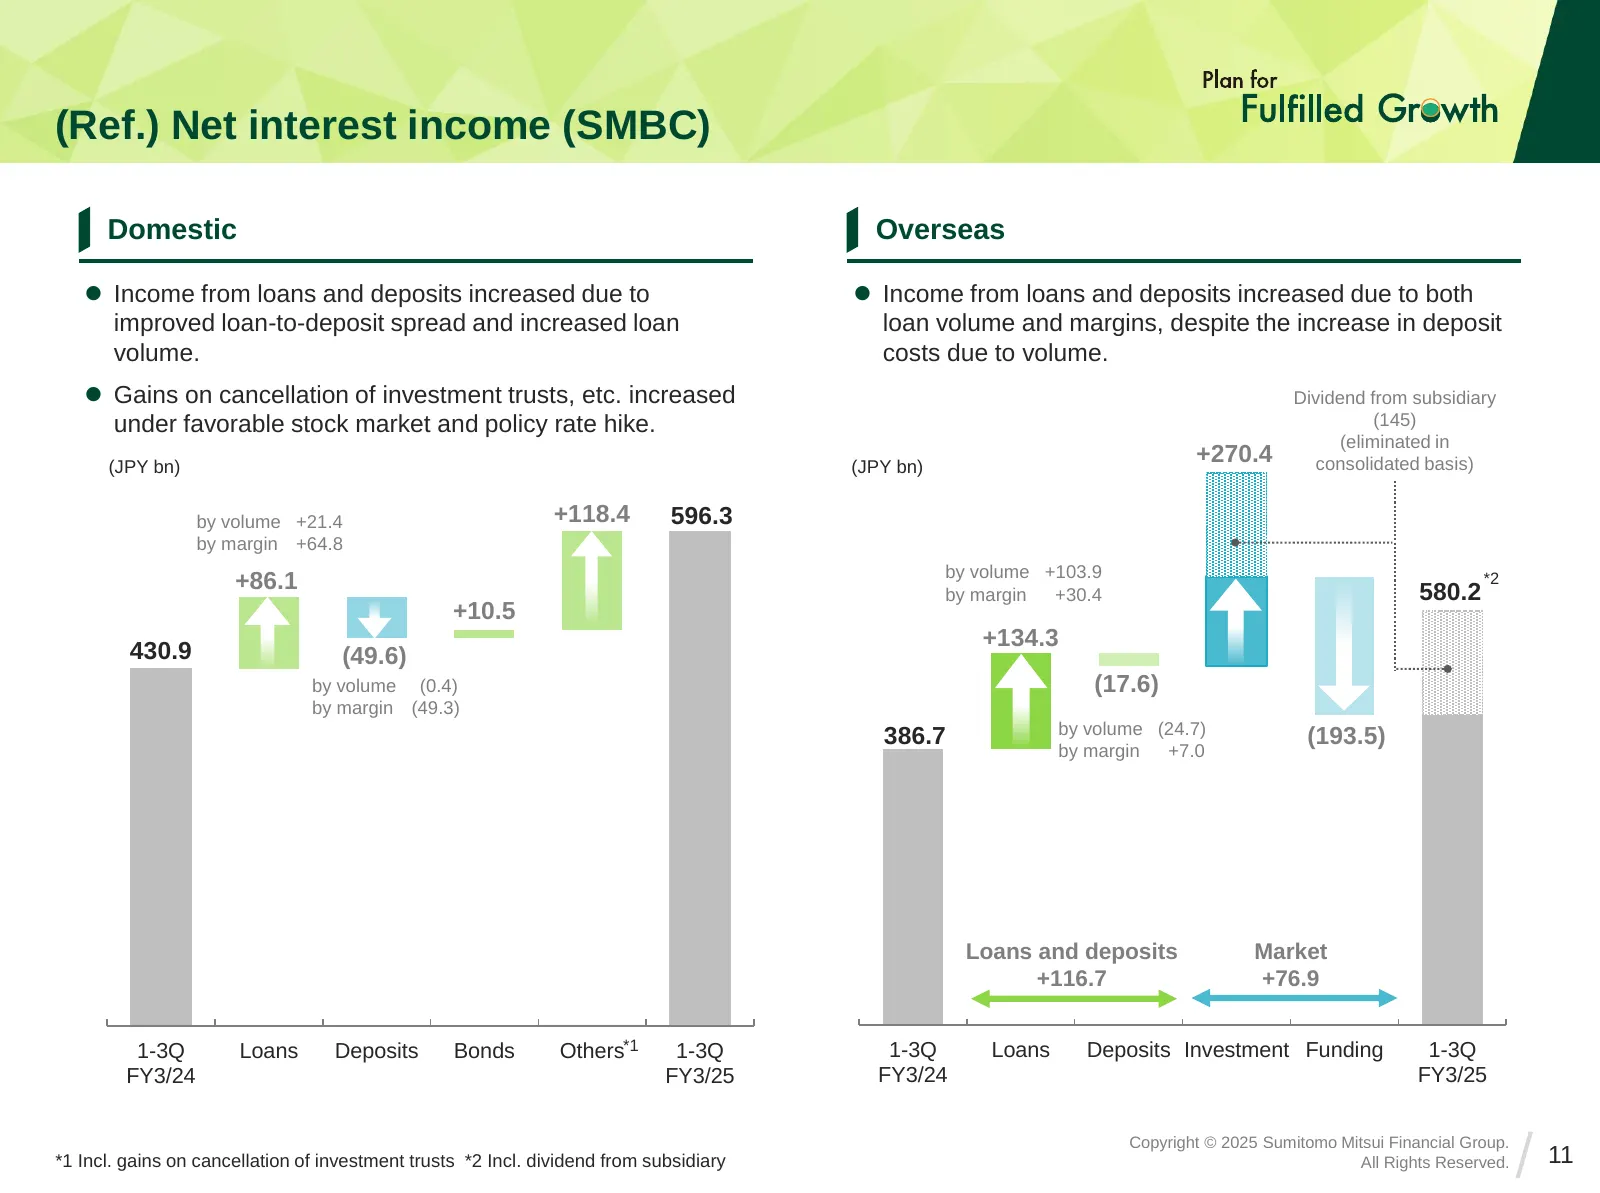
Slide 11: (Ref.) Net interest income (SMBC)
(Ref.) Net interest income (SMBC) Domestic Overseas ⚫ Income from loans and deposits increased due to ⚫ Income from loans and deposits increased due to both improved loan-to-deposit spread and increased loan loan volume and margins, despite the increase in deposit volume. costs due to volume. ⚫ Gain
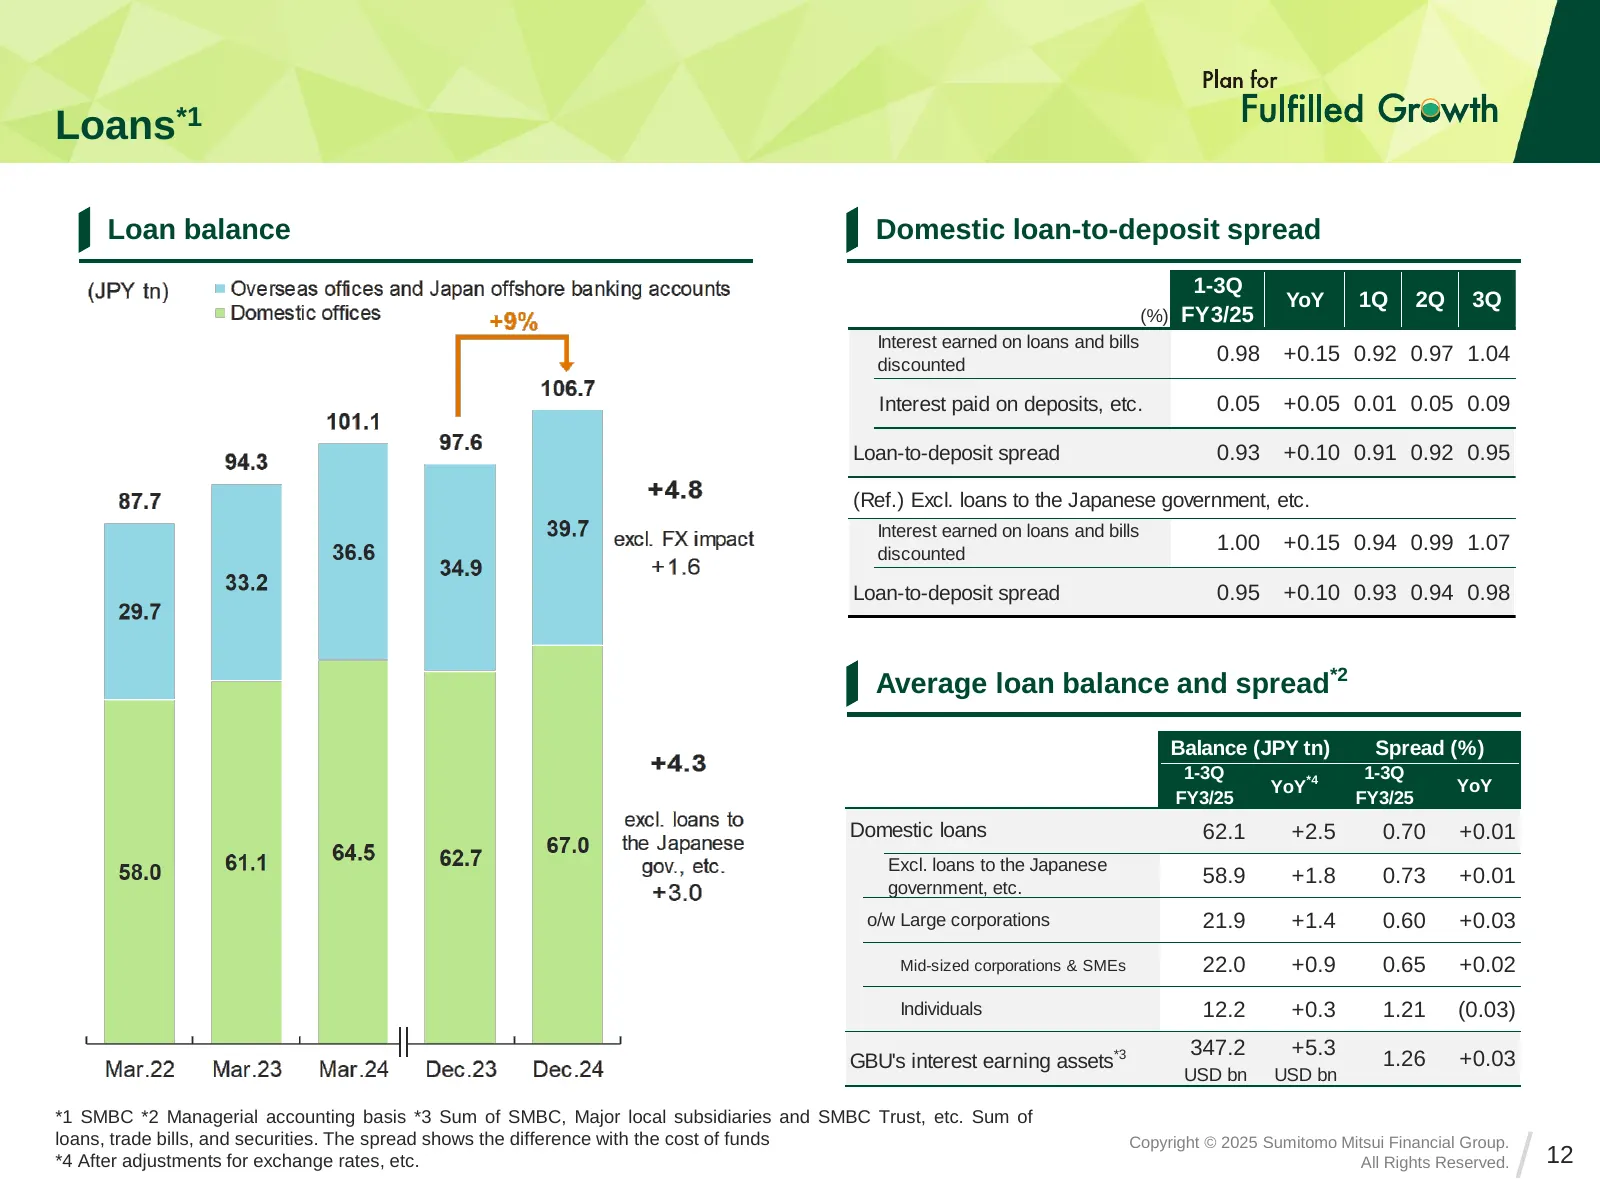
Slide 12: Loans
Loans*1 Loan balance Domestic loan-to-deposit spread 1-3Q YoY 1Q 2Q 3Q (%) FY3/25 Interest earned on loans and bills discounted 0.98 +0.15 0.92 0.97 1.04 Interest paid on deposits, etc. 0.05 +0.05 0.01 0.05 0.09 Loan-to-deposit spread 0.93 +0.10 0.91 0.92 0.95 (Ref.) Excl. loans to the Japanese gove
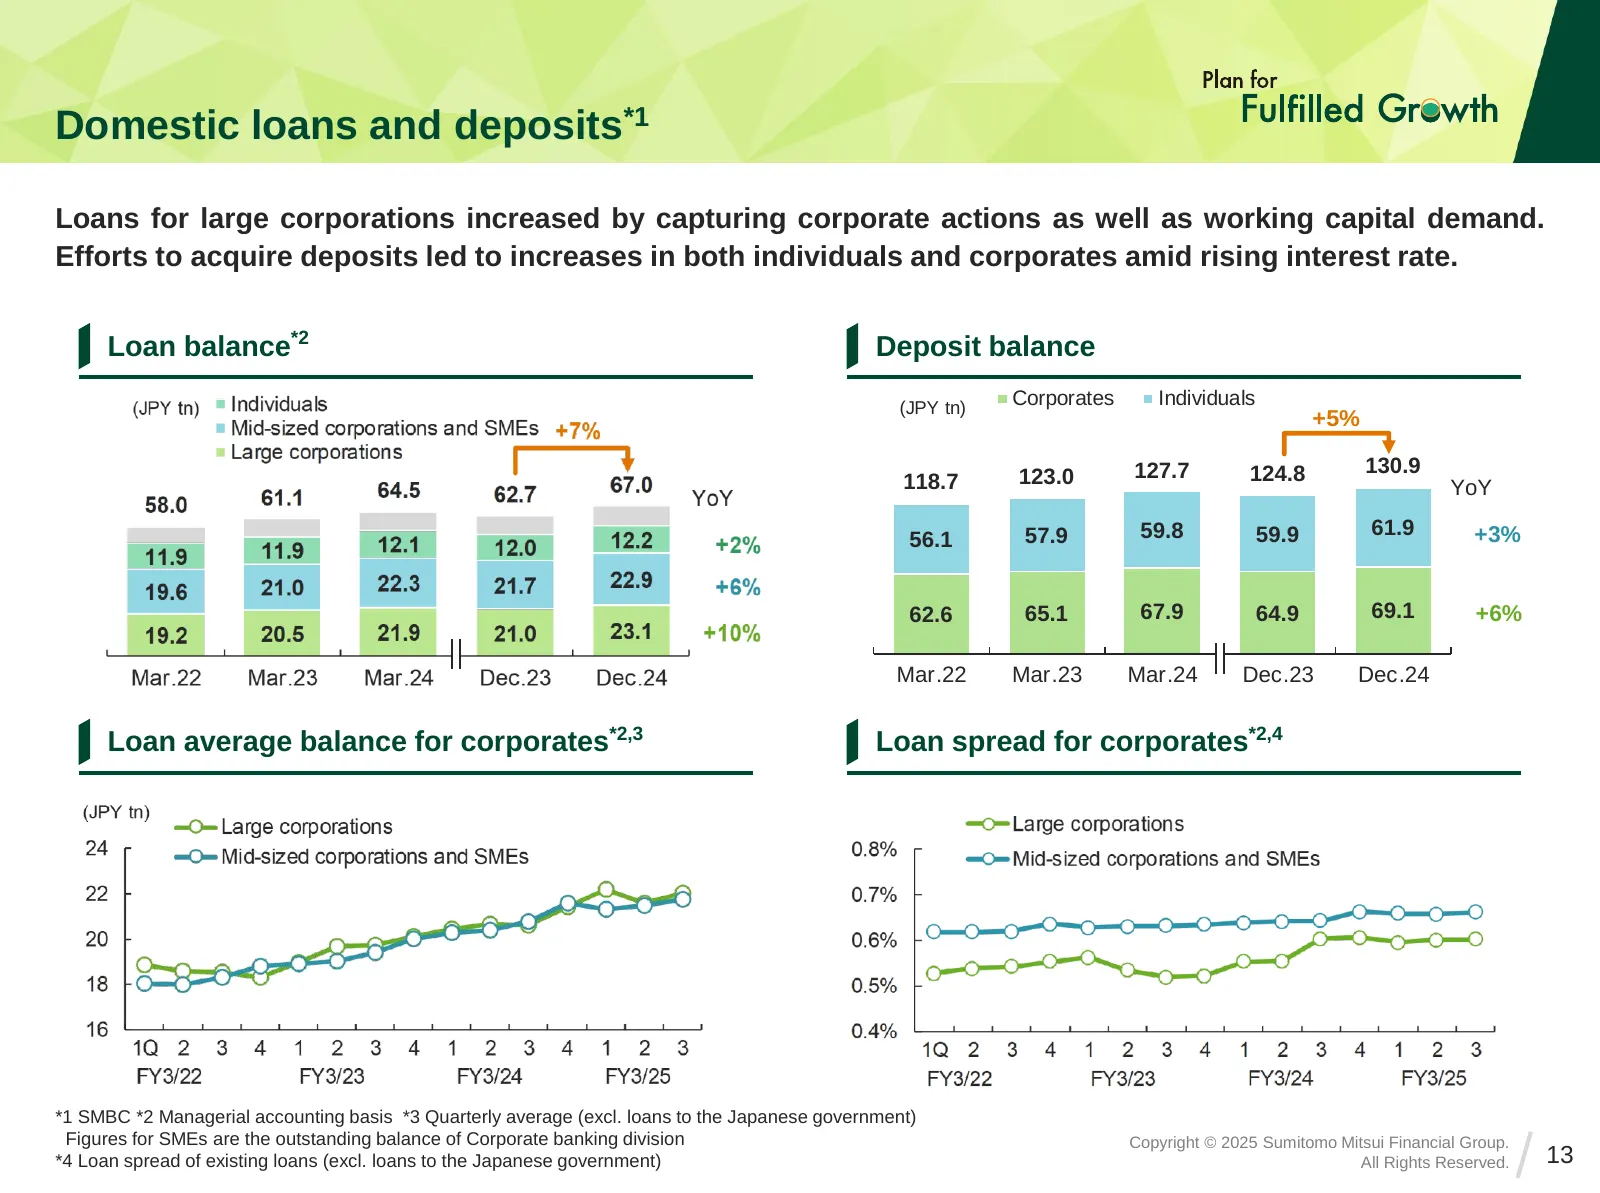
Slide 13: Domestic loans and deposits
Domestic loans and deposits*1 Loans for large corporations increased by capturing corporate actions as well as working capital demand. Efforts to acquire deposits led to increases in both individuals and corporates amid rising interest rate. Loan balance*2 Deposit balance (JPY tn) Corporates Individ
Slide 14: Overseas loans and deposits
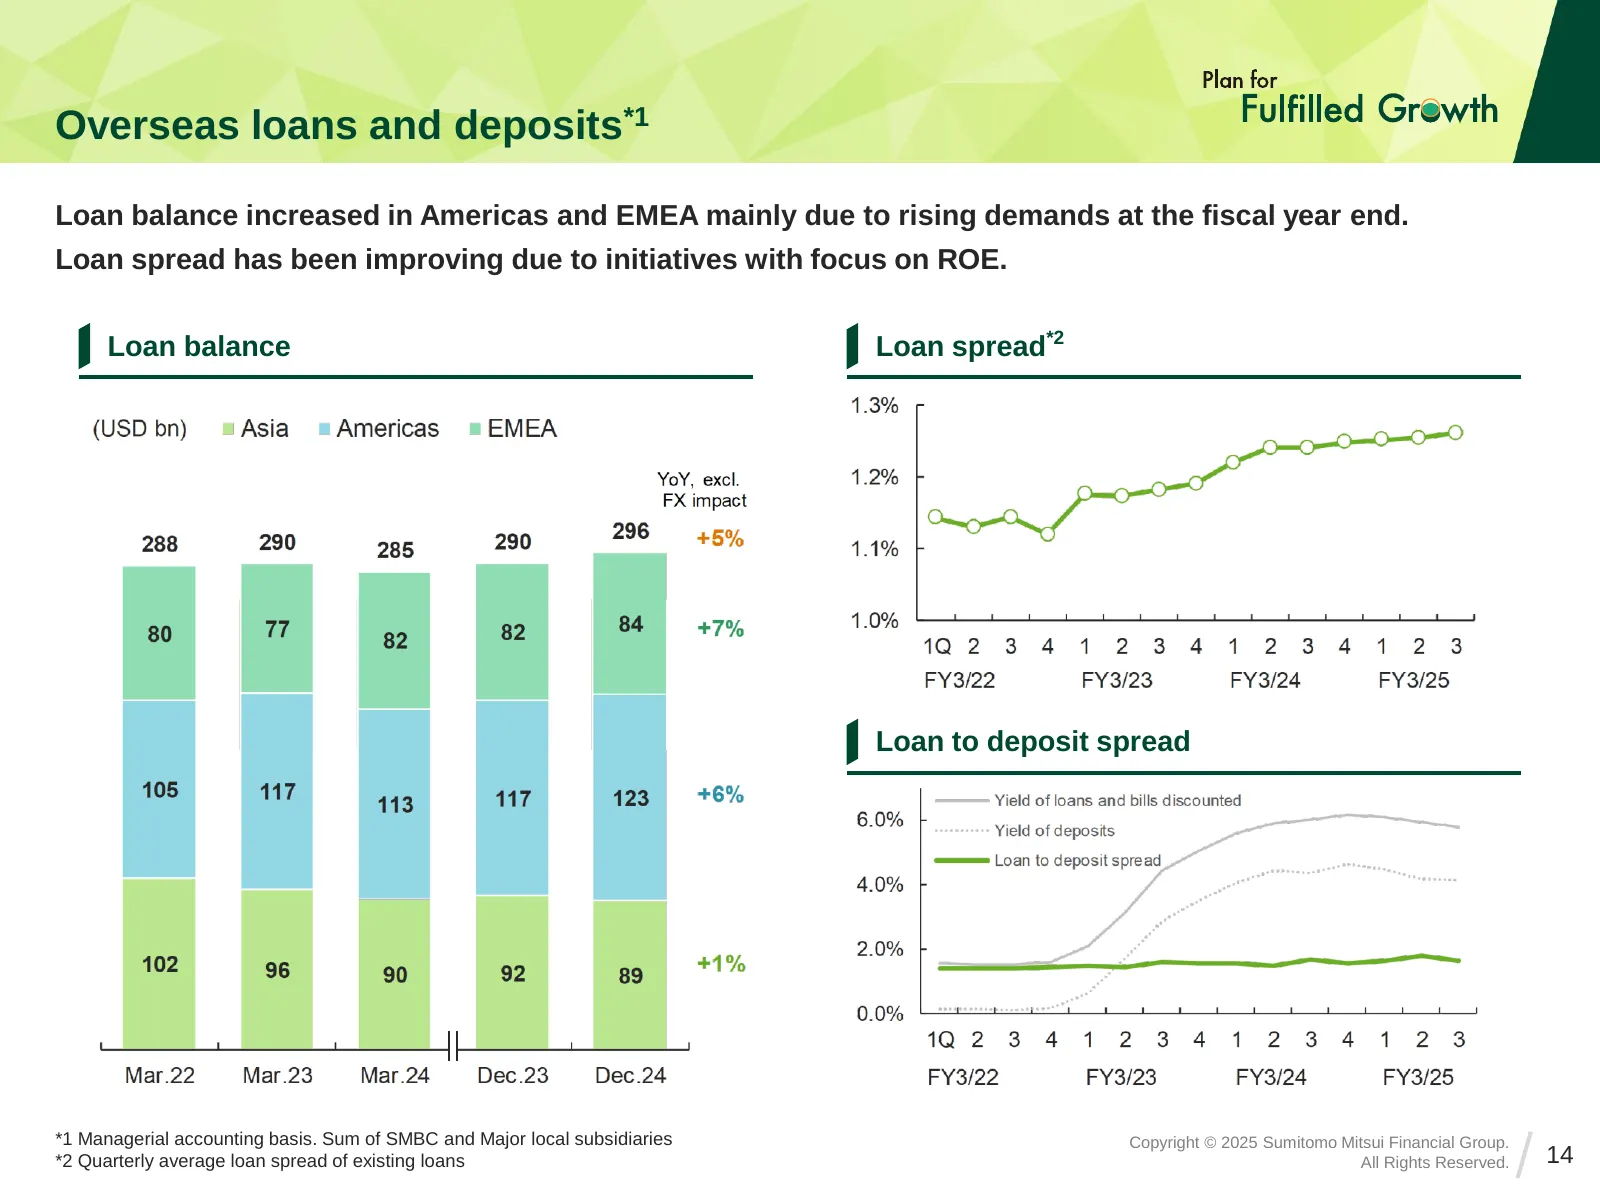
Overseas loans and deposits*1 Loan balance increased in Americas and EMEA mainly due to rising demands at the fiscal year end. Loan spread has been improving due to initiatives with focus on ROE. Loan balance Loan spread*2 Loan to deposit spread *1 Managerial accounting basis. Sum of SMBC and Major
Slide 15: Asset quality
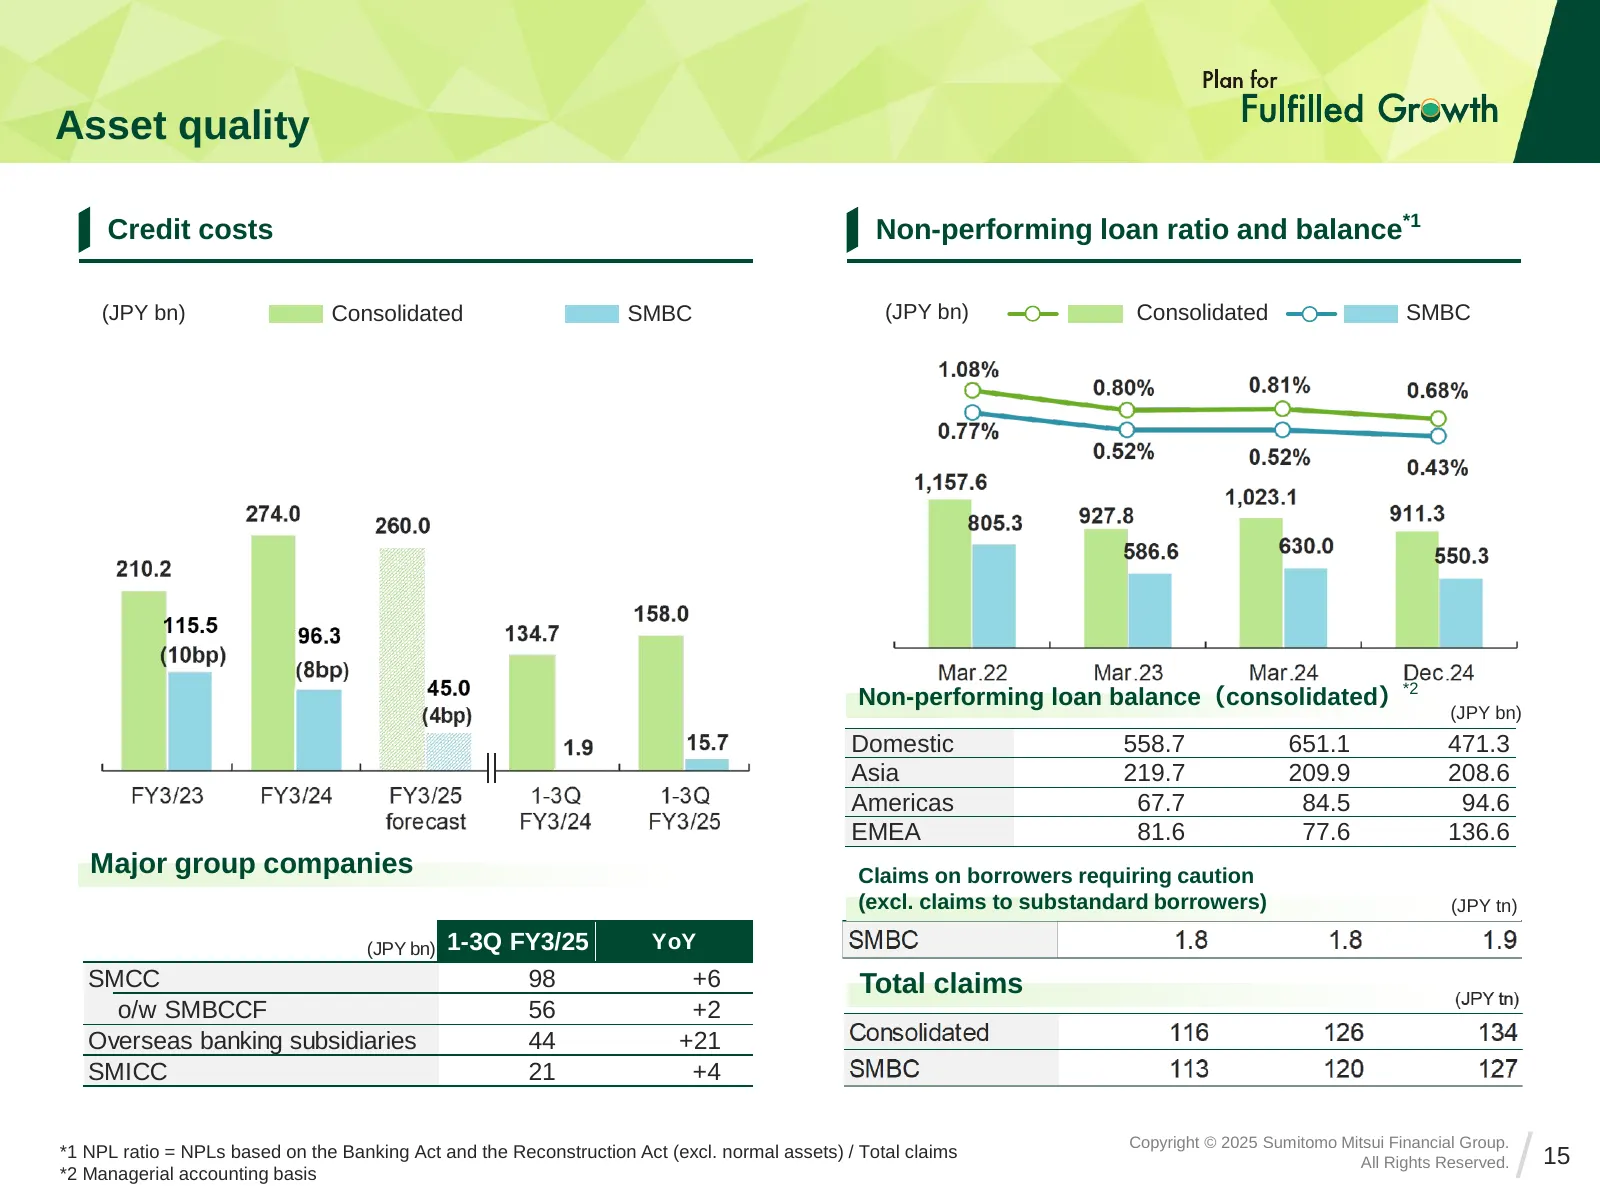
Asset quality Credit costs Non-performing loan ratio and balance*1 (JPY bn) Consolidated SMBC (JPY bn) Consolidated SMBC Non-performing loan balance(consolidated)*2 (JPY bn) Domestic 558.7 651.1 471.3 Asia 219.7 209.9 208.6 Americas 67.7 84.5 94.6 EMEA 81.6 77.6 136.6 Major group companies Claims on
Slide 16: Securities
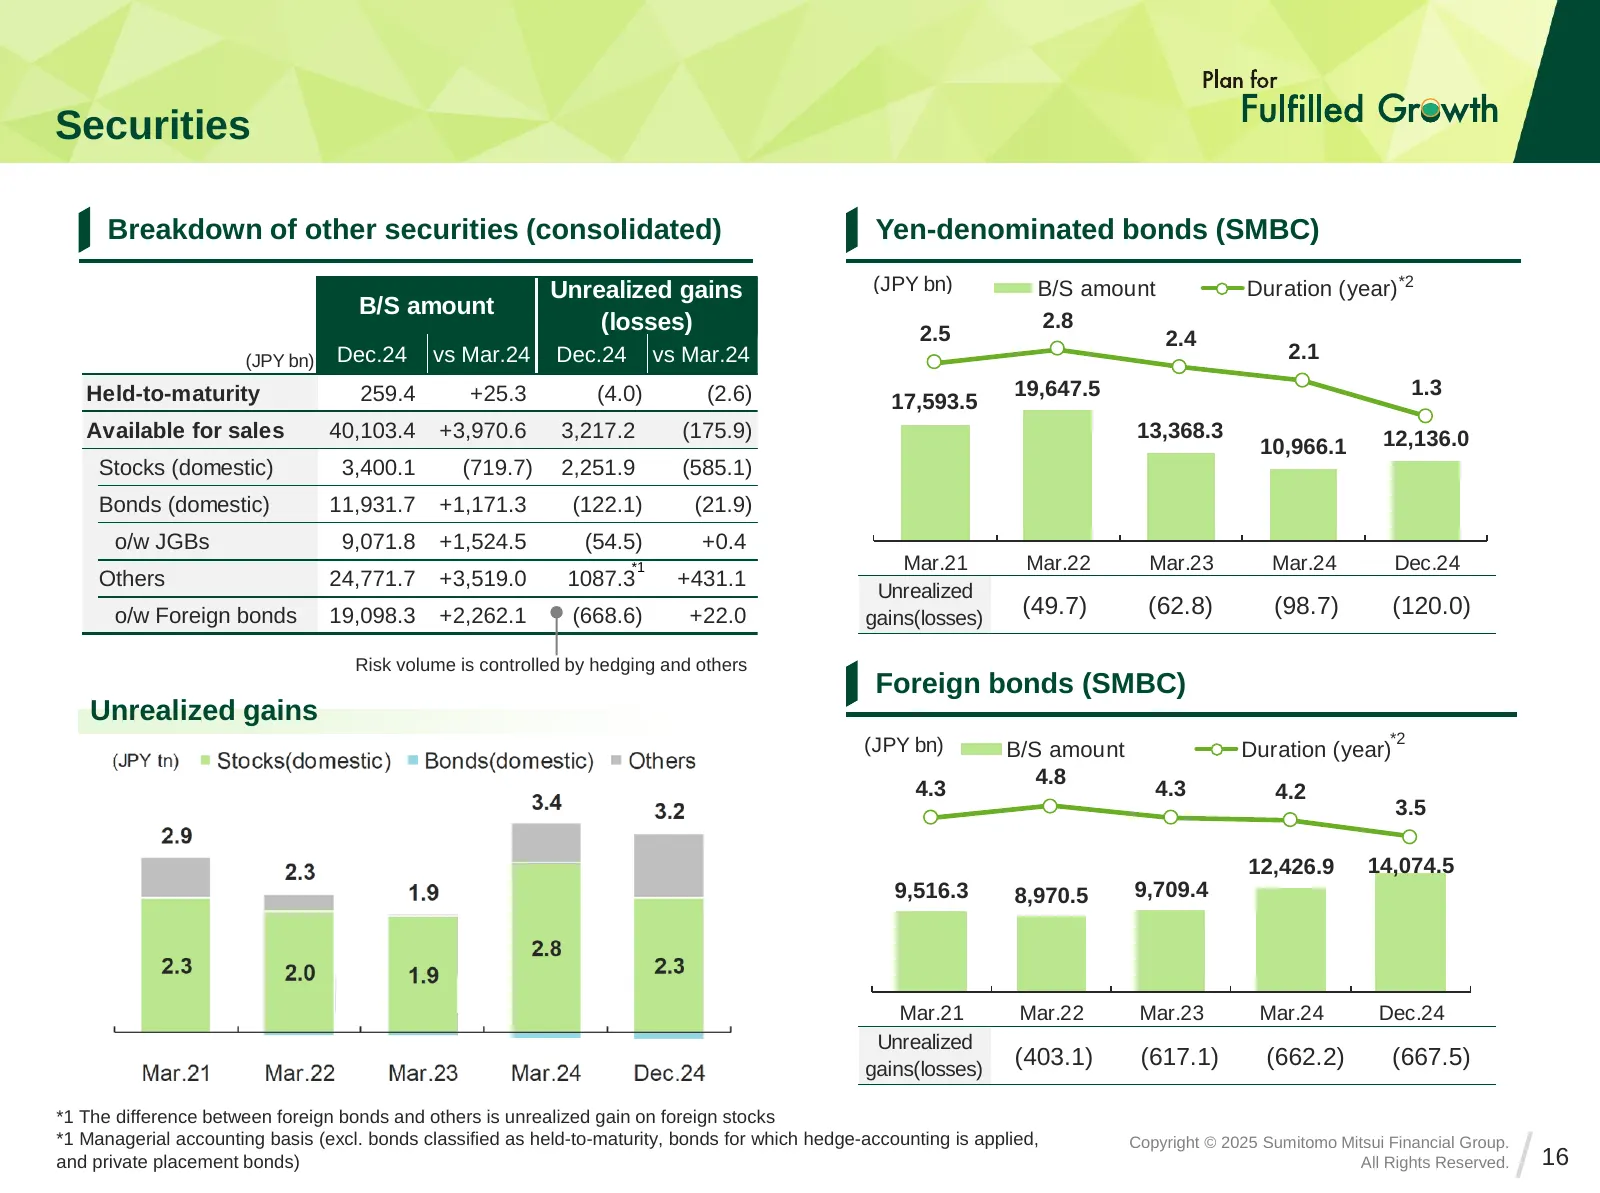
Securities Breakdown of other securities (consolidated) Yen-denominated bonds (SMBC) 定書ス 設トー 式 のテマ キス タ Unrealized gains (JPY bn) B/S amount Duration (year) *2 B/S amount (losses) 2.8 2.5 2.4 (JPY bn) Dec.24 vs Mar.24 Dec.24 vs Mar.24 2.1 Held-to-maturity 259.4 +25.3 (4.0) (2.6) 19,647.5 1.3 17,593.
Slide 17: Balance sheet
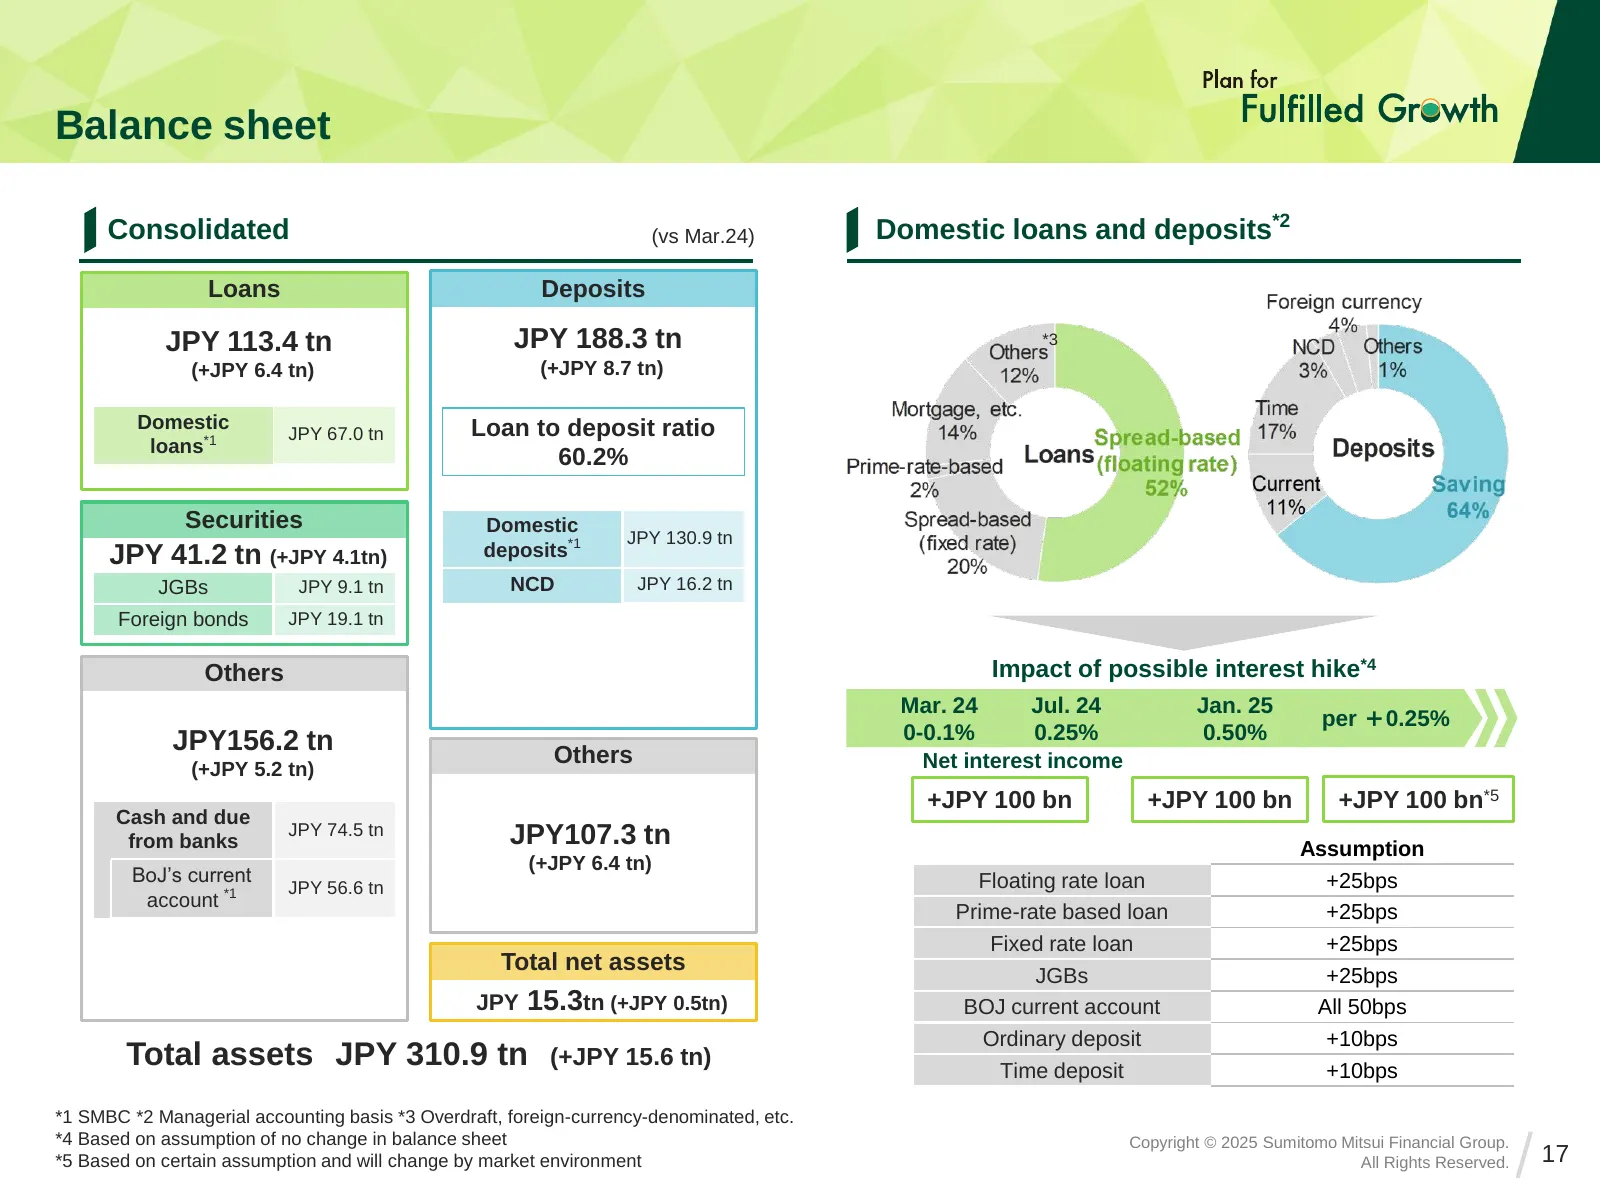
Balance sheet Consolidated (vs Mar.24) Domestic loans and deposits*2 Loans Deposits JPY 113.4 tn JPY 188.3 tn *3 (+JPY 6.4 tn) (+JPY 8.7 tn) Domestic Loan to deposit ratio JPY 67.0 tn loans*1 60.2% Securities Domestic JPY 130.9 tn JPY 41.2 tn (+JPY 4.1tn) deposits*1 JGBs JPY 9.1 tn NCD JPY 16.2 tn F
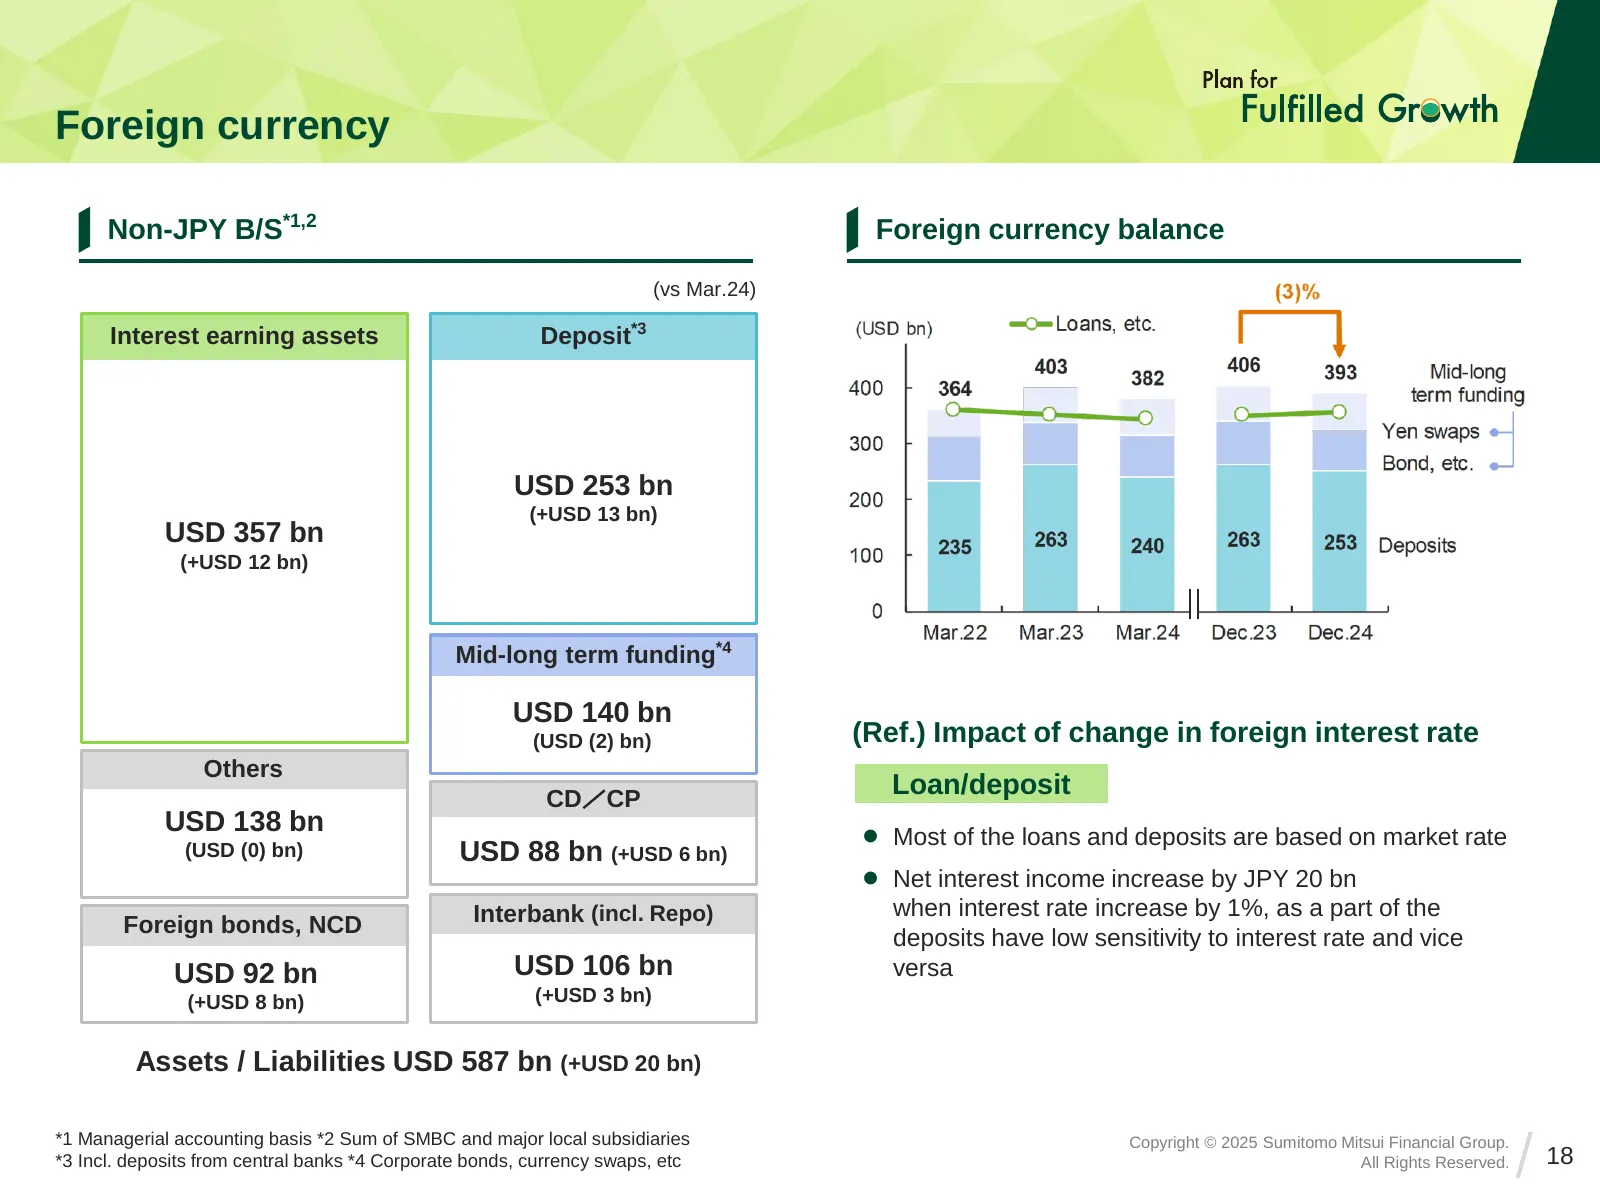
Slide 18: Foreign currency
Foreign currency Non-JPY B/S*1,2 Foreign currency balance rise interest of Impact (vs Mar.24) Interest earning assets Deposit*3 USD 253 bn (+USD 13 bn) USD 357 bn (+USD 12 bn) Mid-long term funding*4 USD 140 bn (USD (2) bn) (Ref.) Impact of change in foreign interest rate Others CD/CP Loan/deposit U
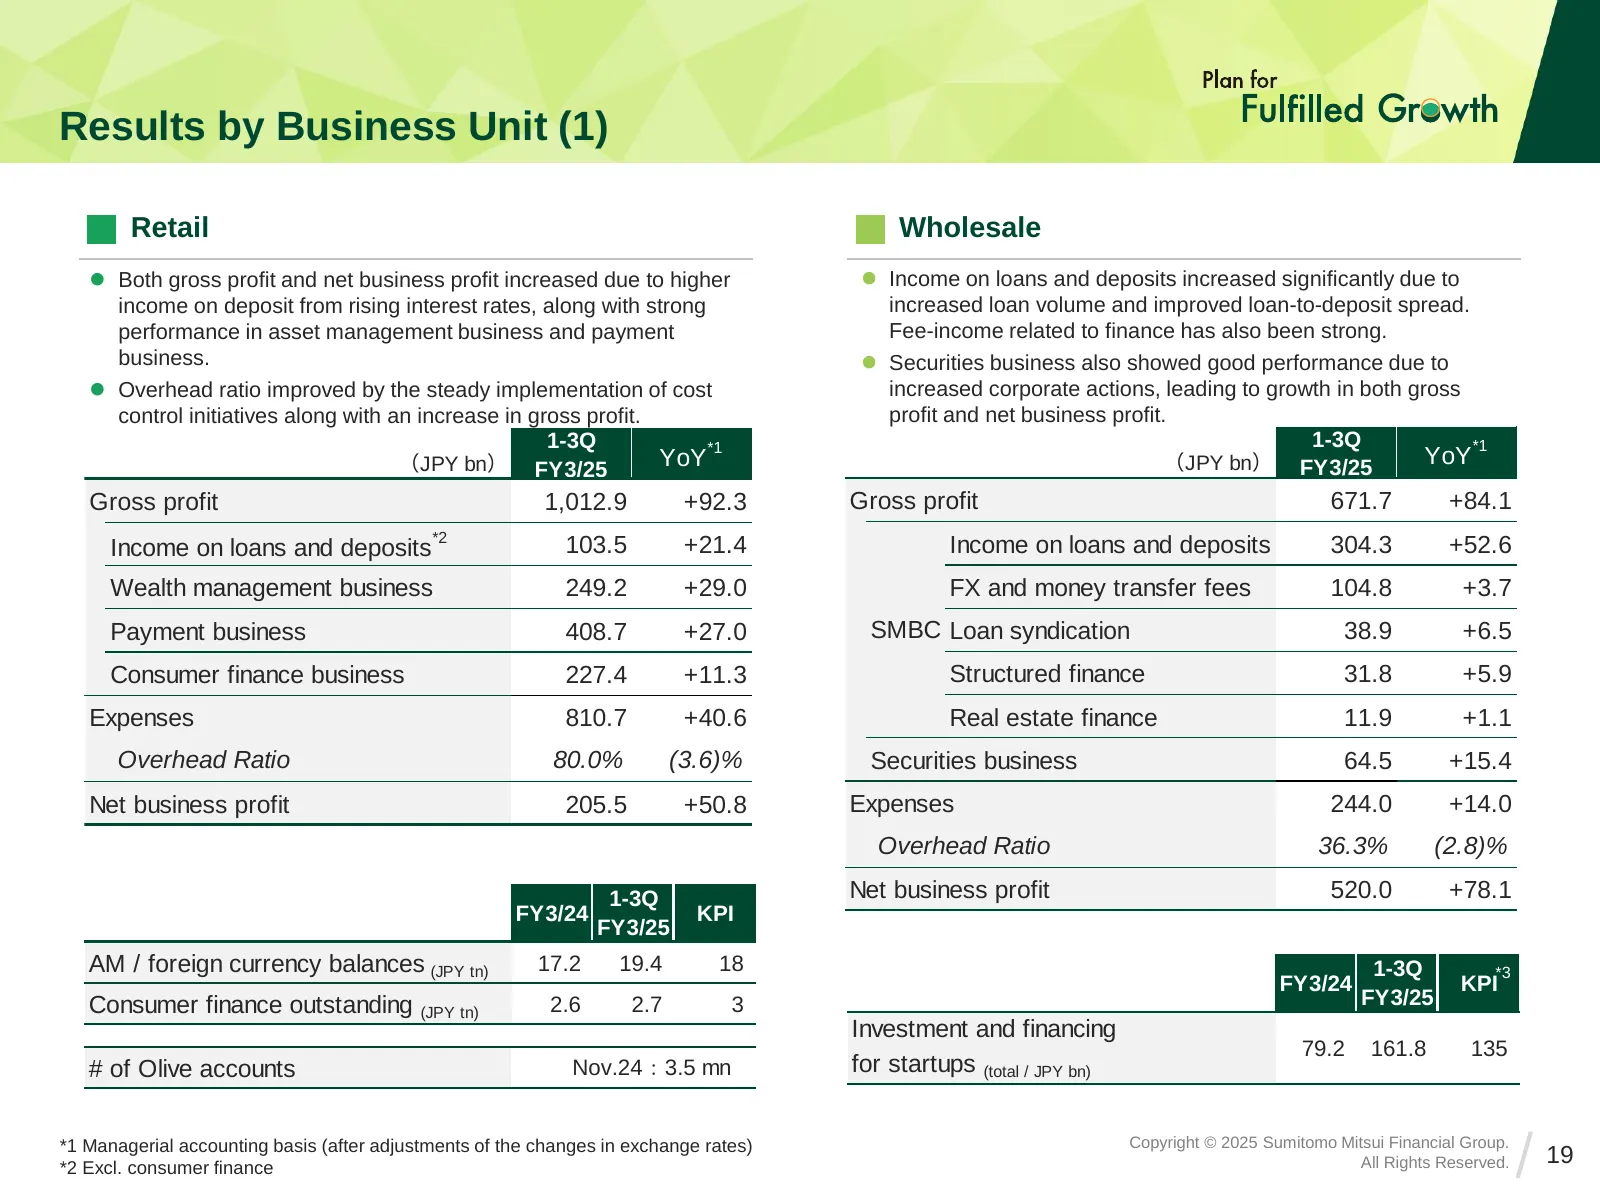
Slide 19: Results by Business Unit (1)
Results by Business Unit (1) Retail Wholesale ⚫ Both gross profit and net business profit increased due to higher ⚫ Income on loans and deposits increased significantly due to income on deposit from rising interest rates, along with strong increased loan volume and improved loan-to-deposit spread. p
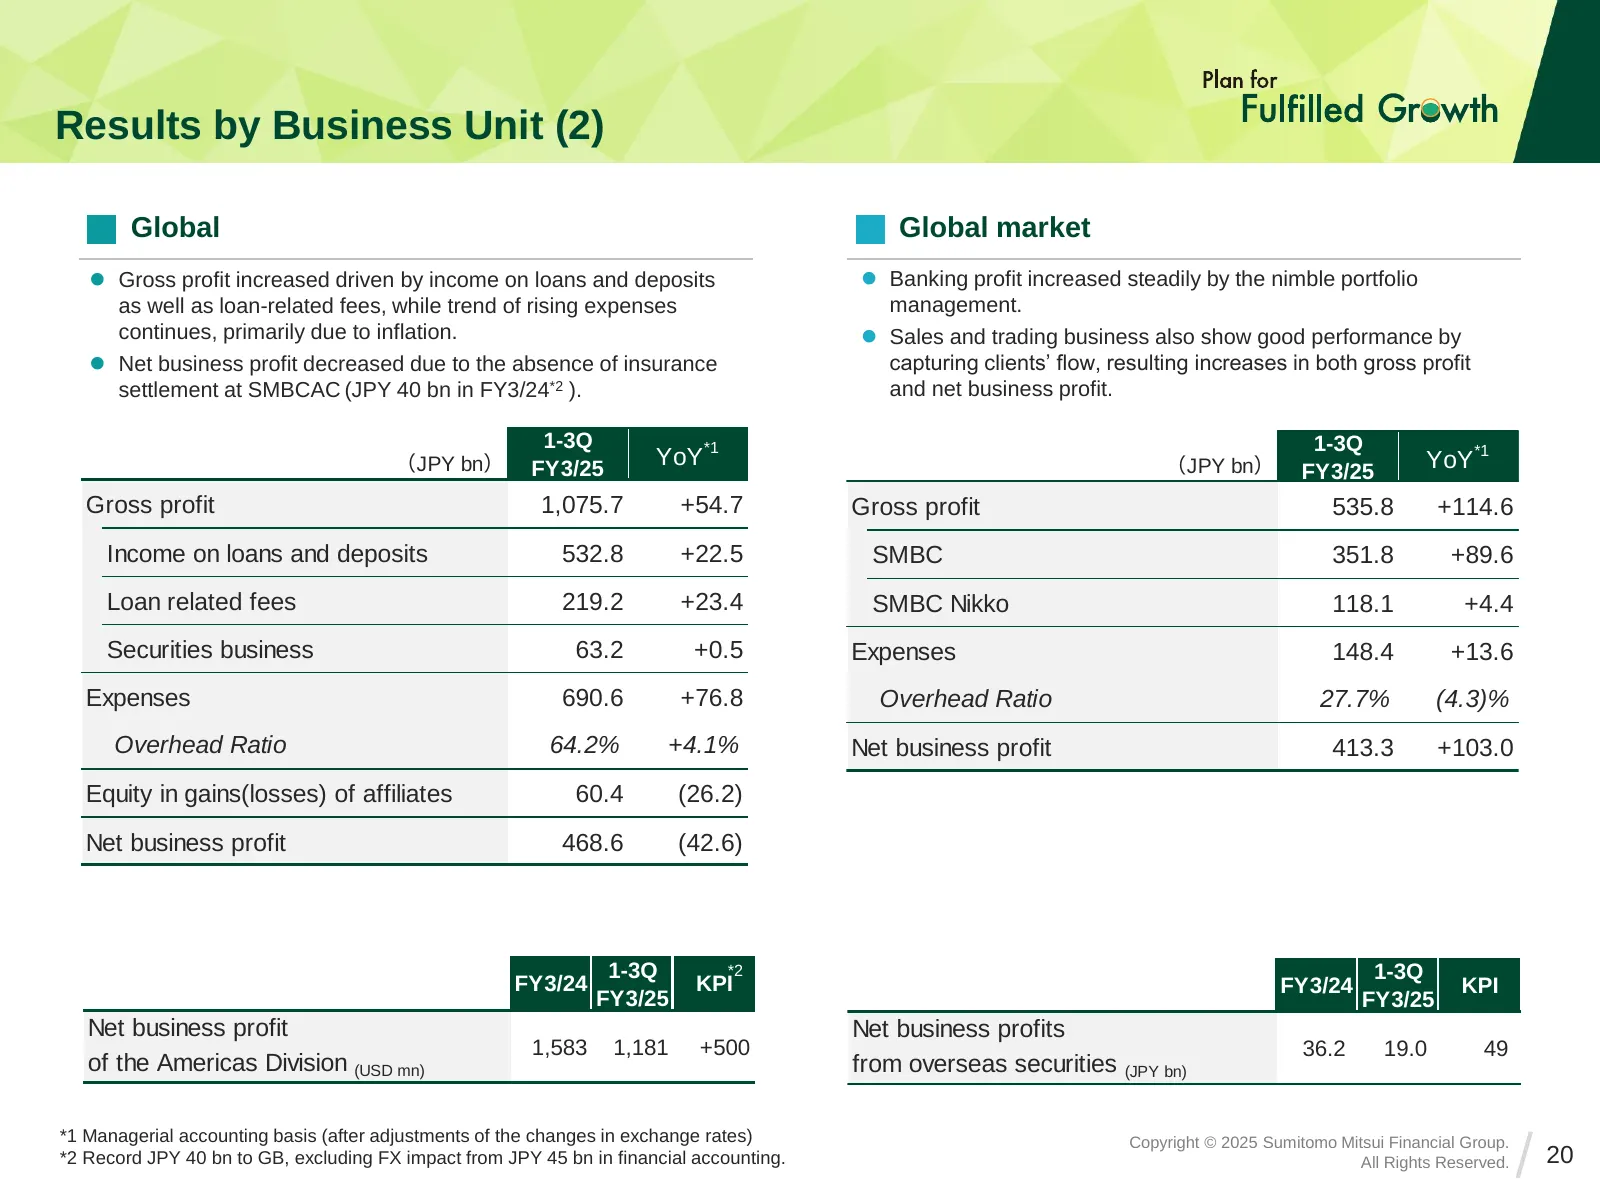
Slide 20: Results by Business Unit (2)
Results by Business Unit (2) Global Global market ⚫ Gross profit increased driven by income on loans and deposits ⚫ Banking profit increased steadily by the nimble portfolio as well as loan-related fees, while trend of rising expenses management. continues, primarily due to inflation. ⚫ Sales and tr
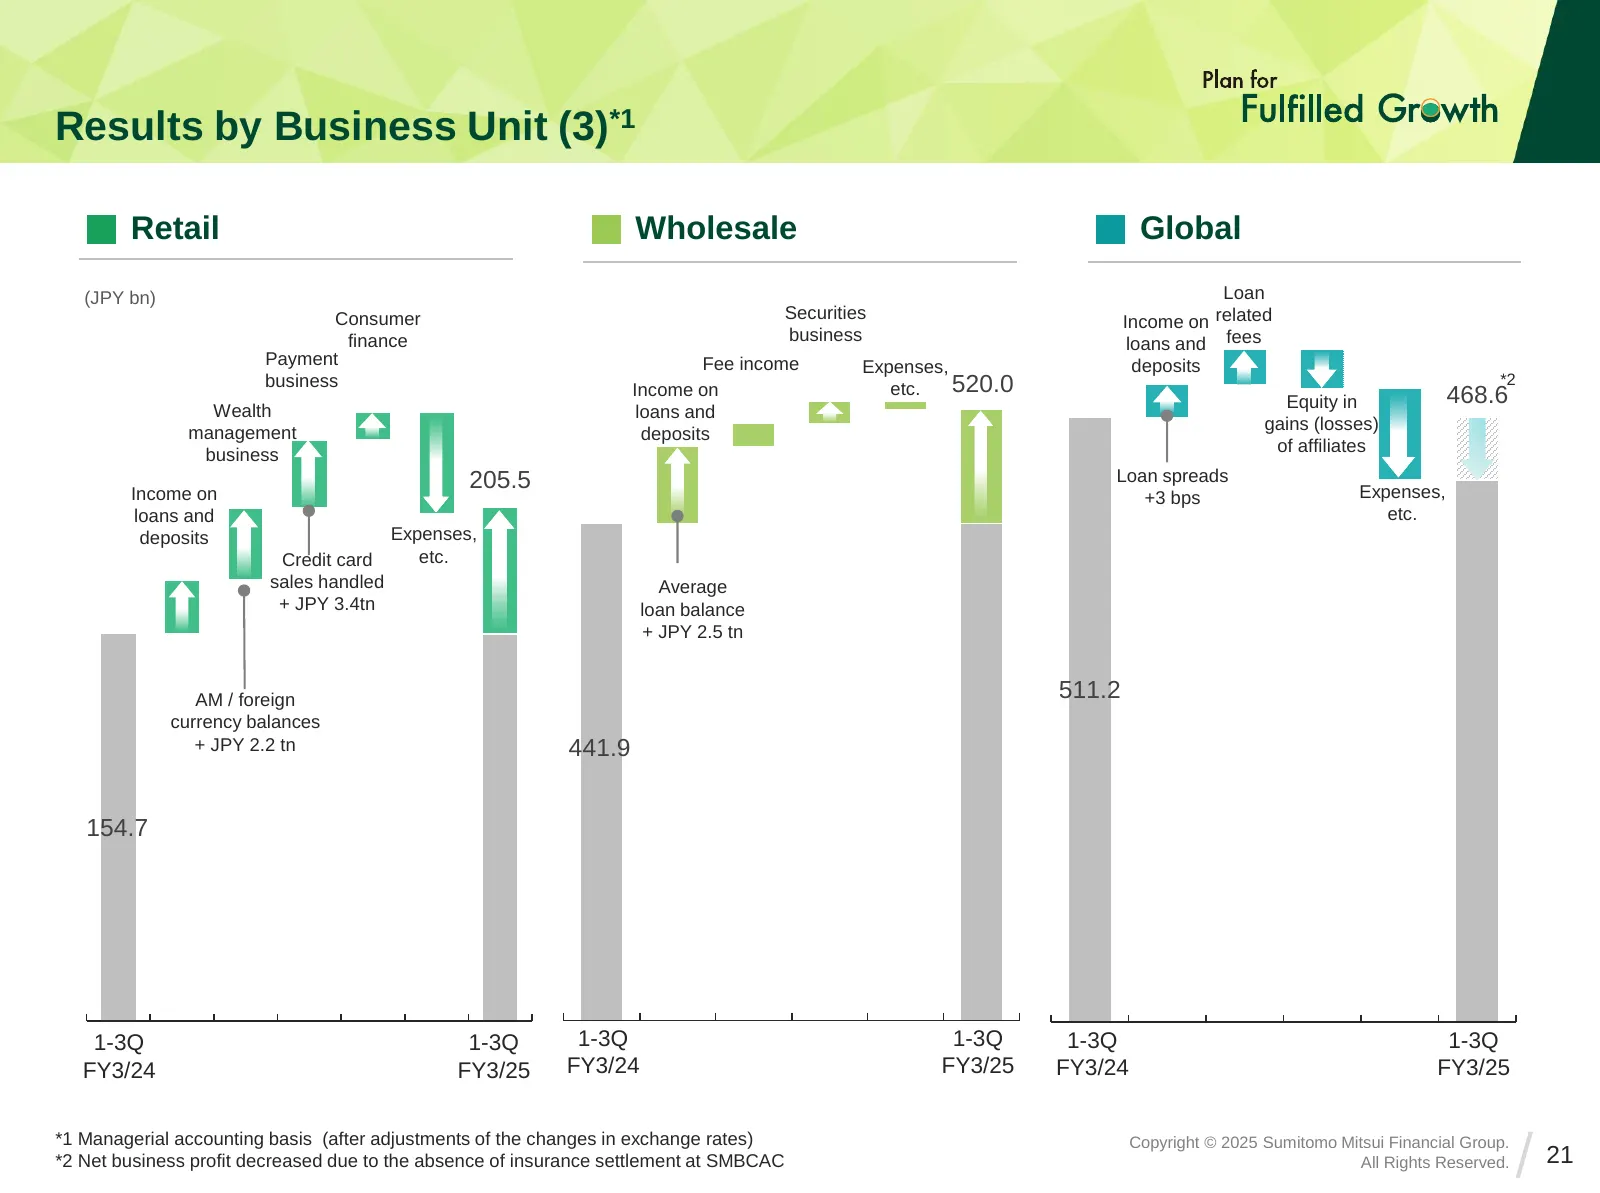
Slide 21: Results by Business Unit (3)
Results by Business Unit (3)*1 Retail Wholesale Global (JPY bn) Loan Consumer Securities Income on related finance business loans and fees Payment Fee income Expenses, deposits business 520.0 *2 Income on etc. 468.6 Wealth Equity in loans and management gains (losses) deposits business of affiliates
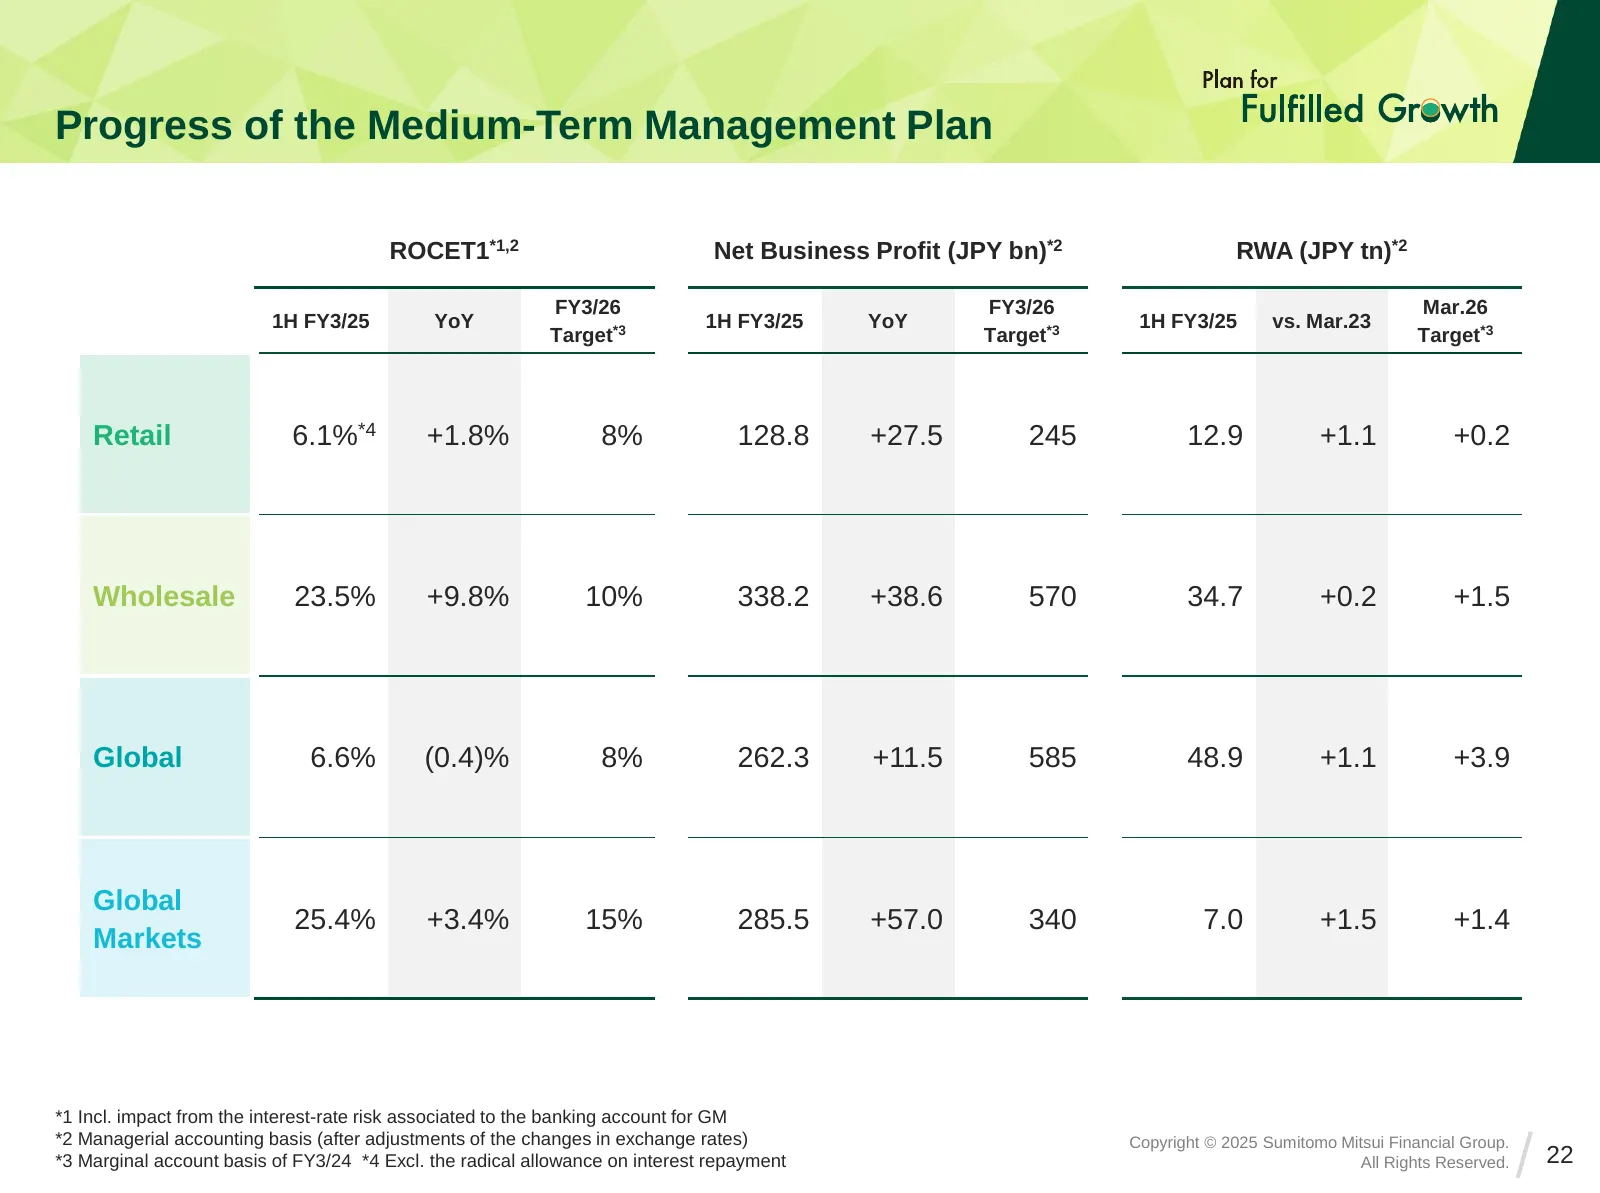
Slide 22: Progress of the Medium-Term Management Plan
Progress of the Medium-Term Management Plan ROCET1*1,2 Net Business Profit (JPY bn)*2 RWA (JPY tn)*2 FY3/26 FY3/26 Mar.26 1H FY3/25 YoY 1H FY3/25 YoY 1H FY3/25 vs. Mar.23 Target*3 Target*3 Target*3 Retail 6.1%*4 +1.8% 8% 128.8 +27.5 245 12.9 +1.1 +0.2 Wholesale 23.5% +9.8% 10% 338.2 +38.6 570 34.7 +
Slide 23: Enhance Corporate Value
Enhance Corporate Value
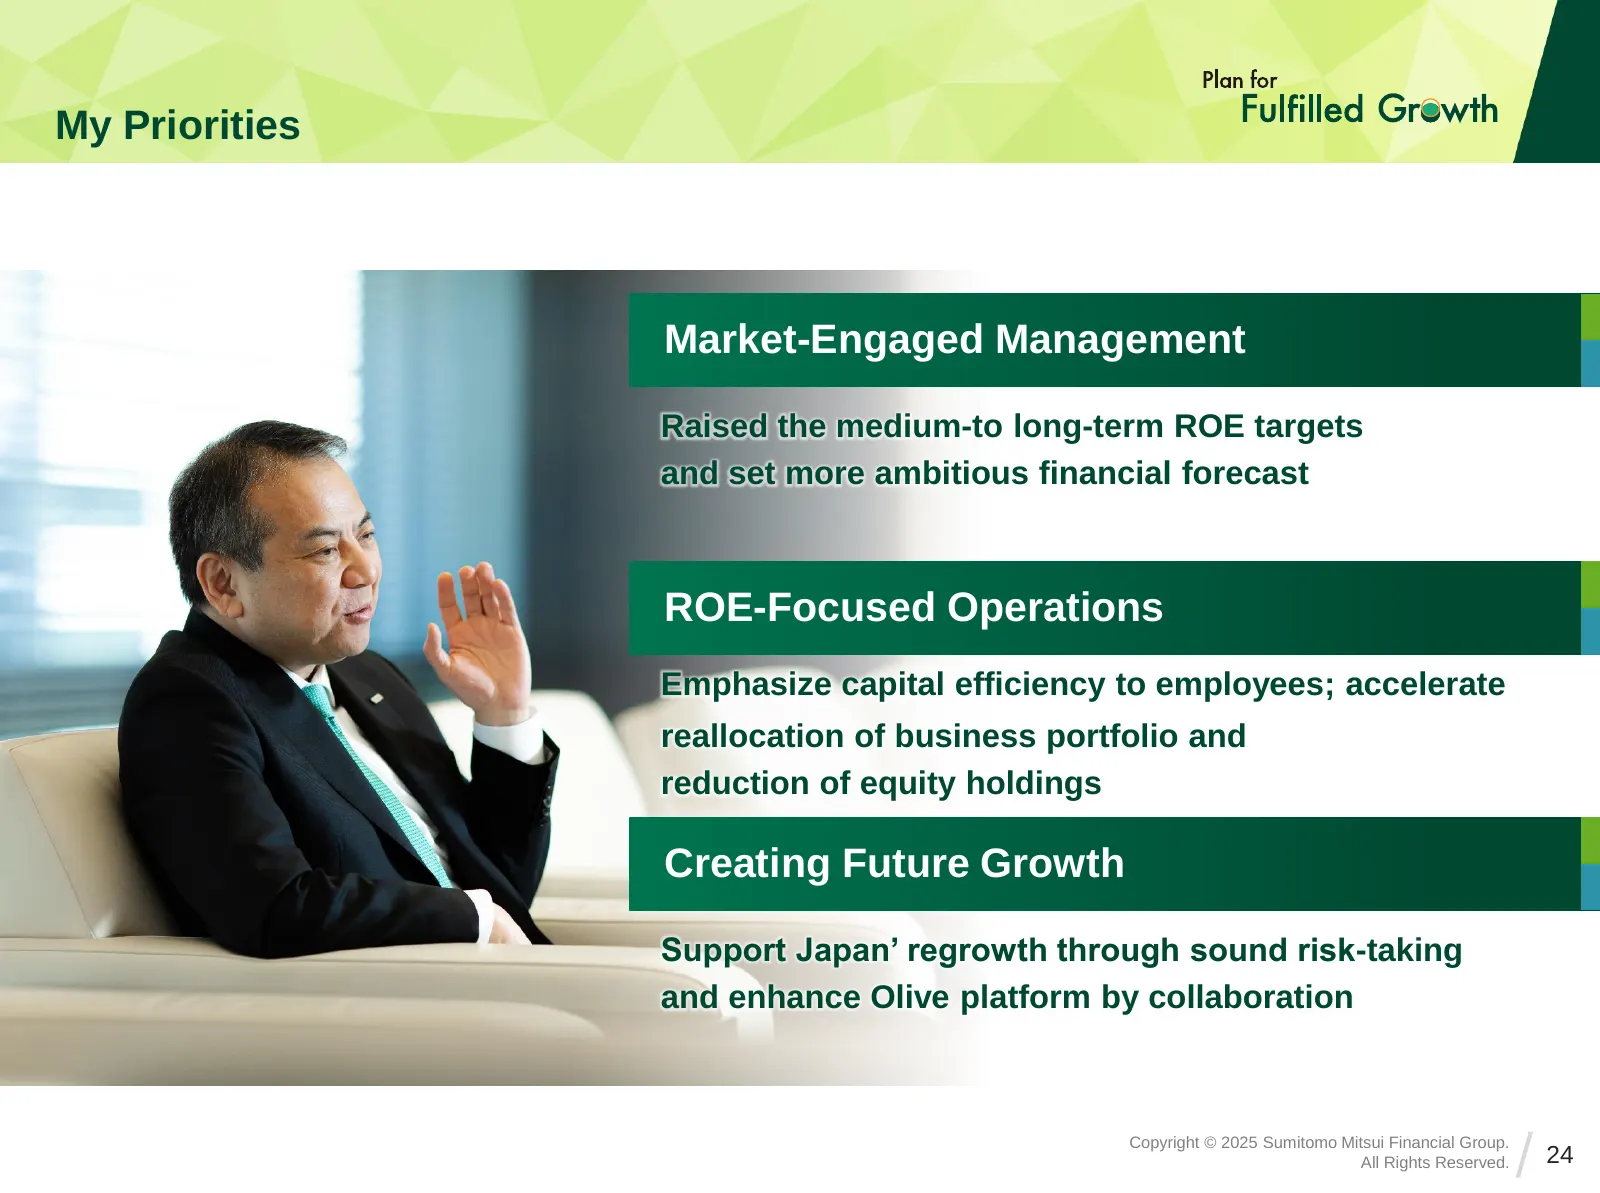
Slide 24: My Priorities
My Priorities Market-Engaged Management Raised the medium-to long-term ROE targets and set more ambitious financial forecast ROE-Focused Operations Emphasize capital efficiency to employees; accelerate reallocation of business portfolio and reduction of equity holdings Creating Future Growth Support
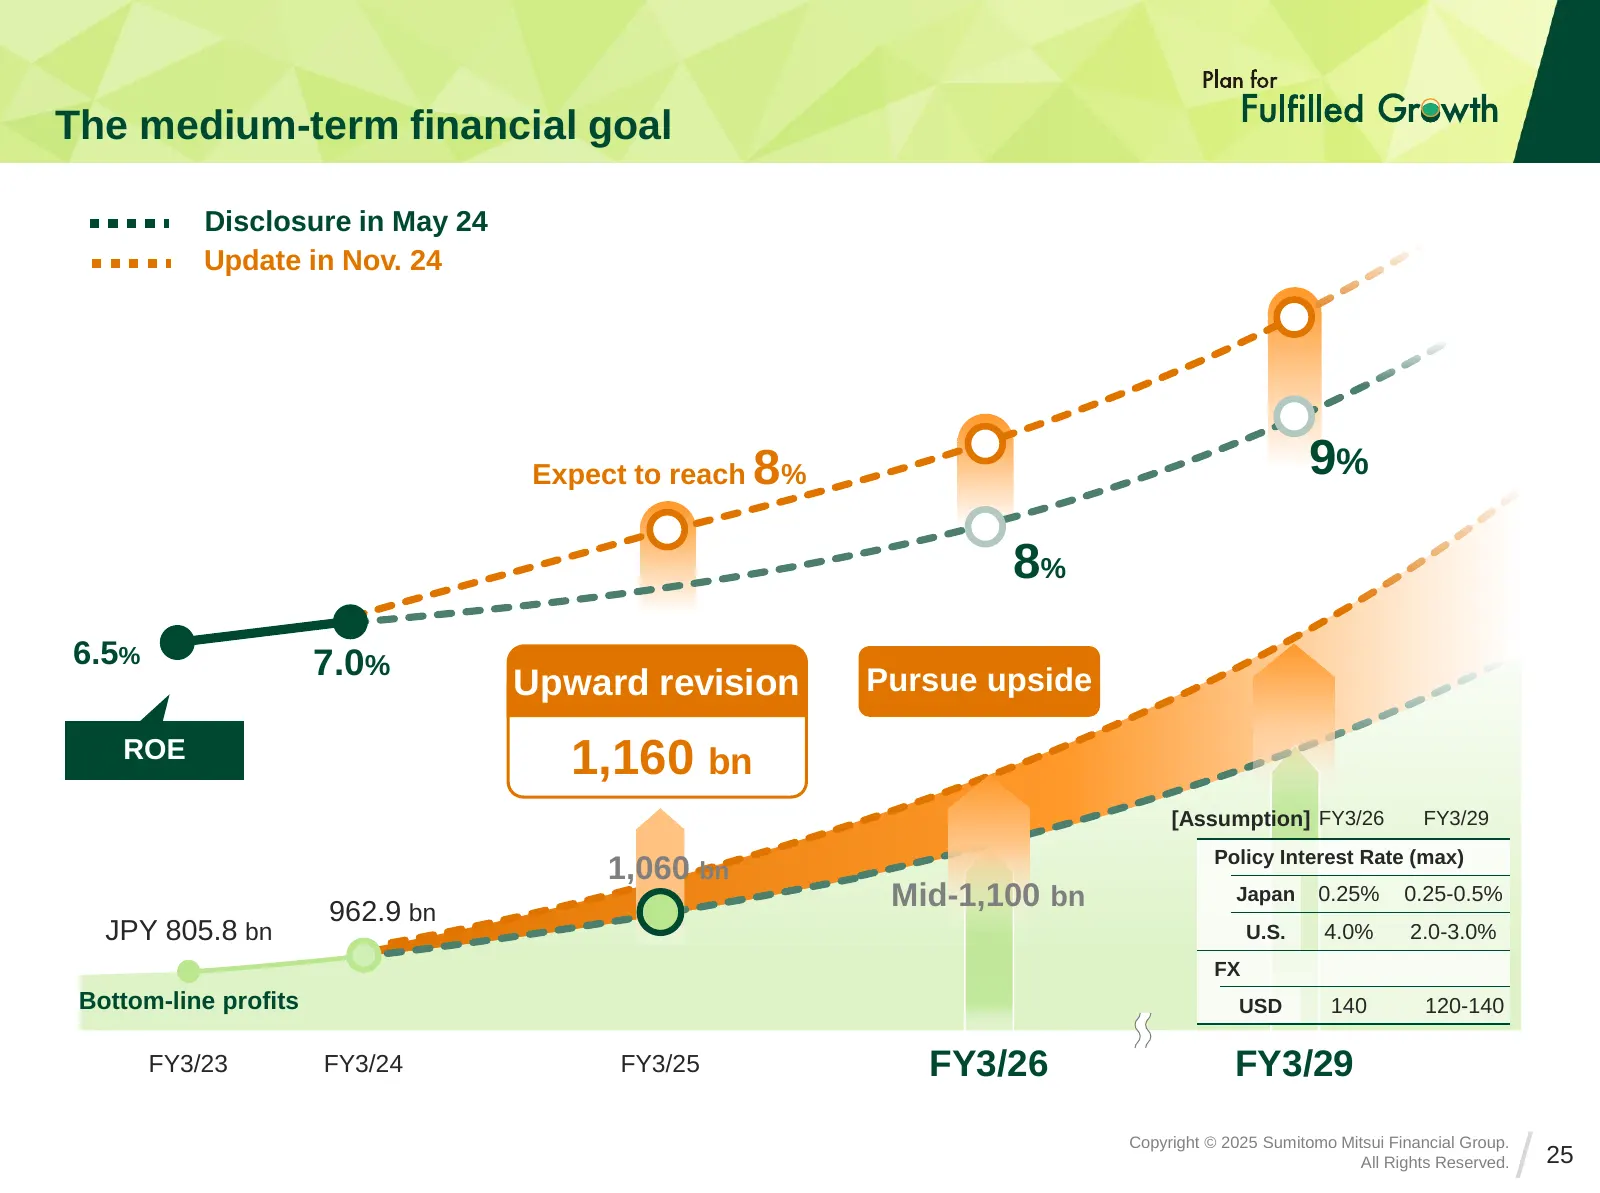
Slide 25: The medium-term financial goal
The medium-term financial goal Disclosure in May 24 Update in Nov. 24 Expect to reach 8% 9% 8% 6.5% 7.0% Upward revision Pursue upside ROE 1,160 bn [Assumption] FY3/26 FY3/29 Policy Interest Rate (max) 1,060 bn 962.9 bn Mid-1,100 bn Japan 0.25% 0.25-0.5% JPY 805.8 bn U.S. 4.0% 2.0-3.0% FX Bottom-lin
Slide 26: Initiatives to enhance corporate value
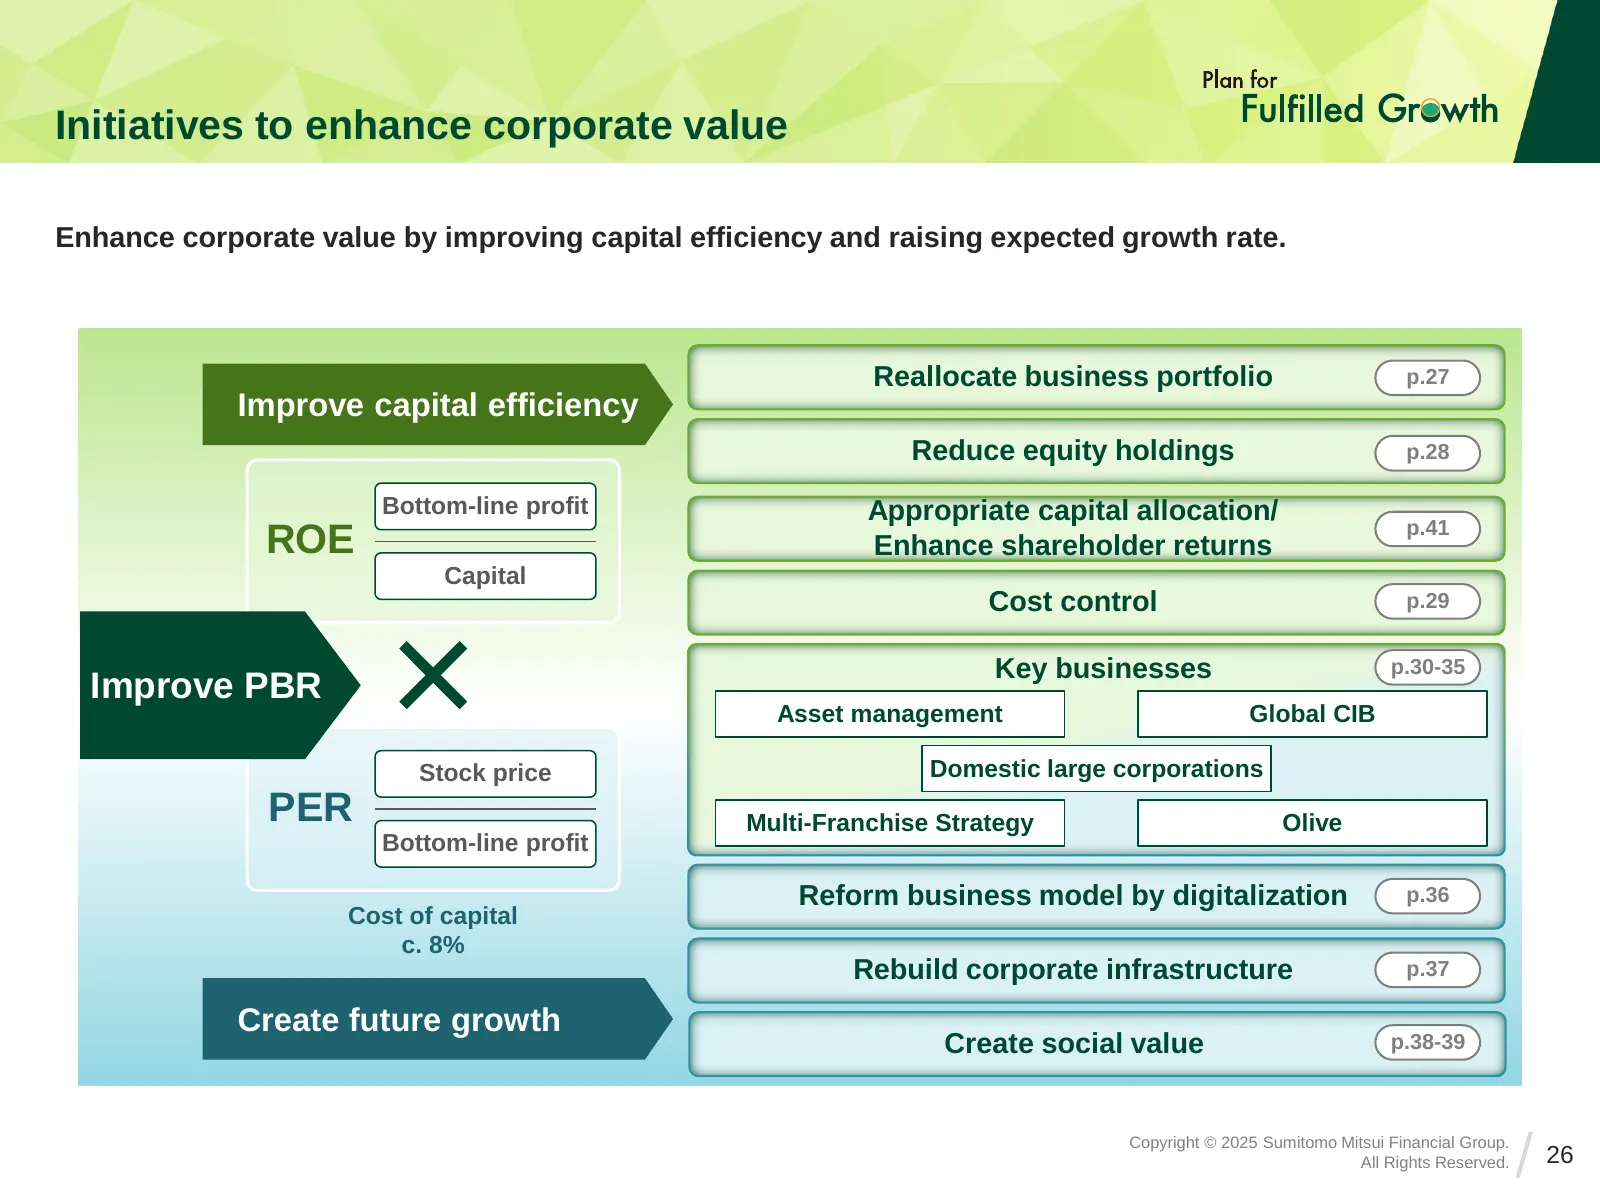
Initiatives to enhance corporate value Enhance corporate value by improving capital efficiency and raising expected growth rate. Reallocate business portfolio p.27 Improve capital efficiency Reduce equity holdings p.28 Bottom-line profit Appropriate capital allocation/ p.41 ROE Enhance shareholder r
Slide 27: Reallocate business portfolio
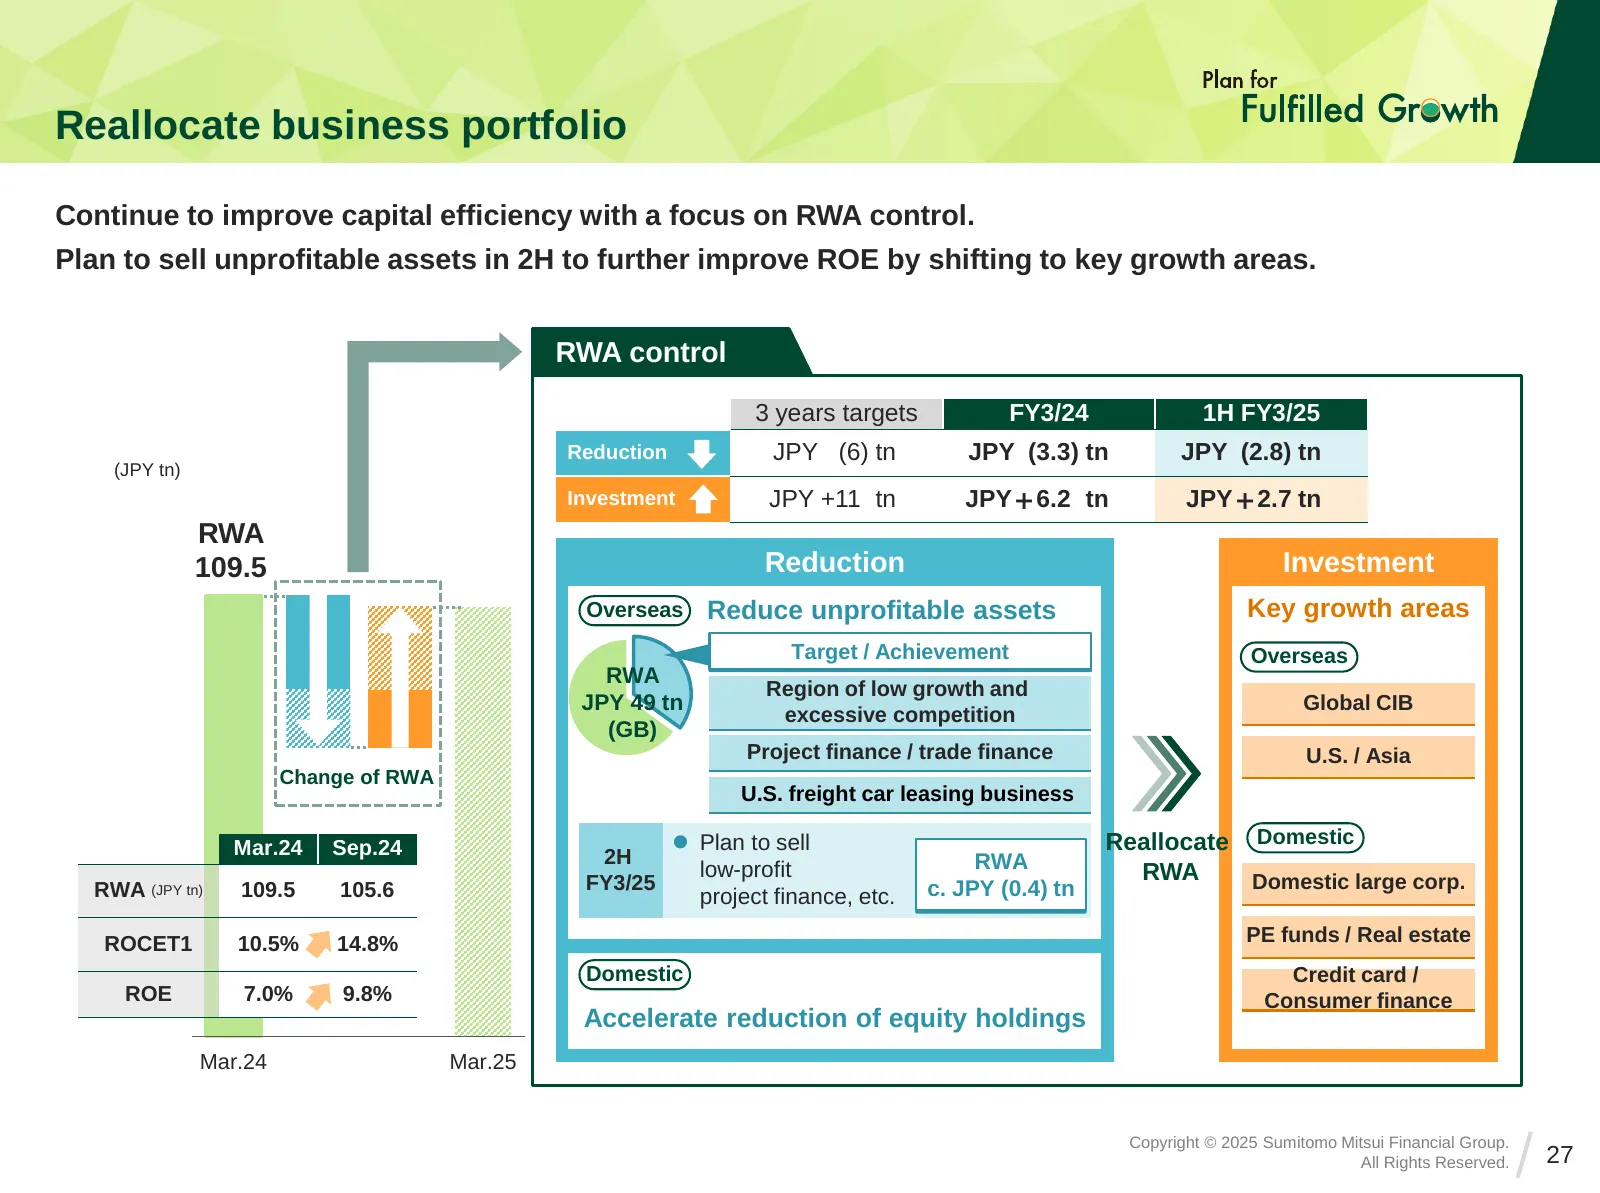
Reallocate business portfolio Continue to improve capital efficiency with a focus on RWA control. Plan to sell unprofitable assets in 2H to further improve ROE by shifting to key growth areas. RWA control 3 years targets FY3/24 1H FY3/25 Reduction JPY (6) tn JPY (3.3) tn JPY (2.8) tn (JPY tn) Invest
Slide 28: Reduction of equity holdings
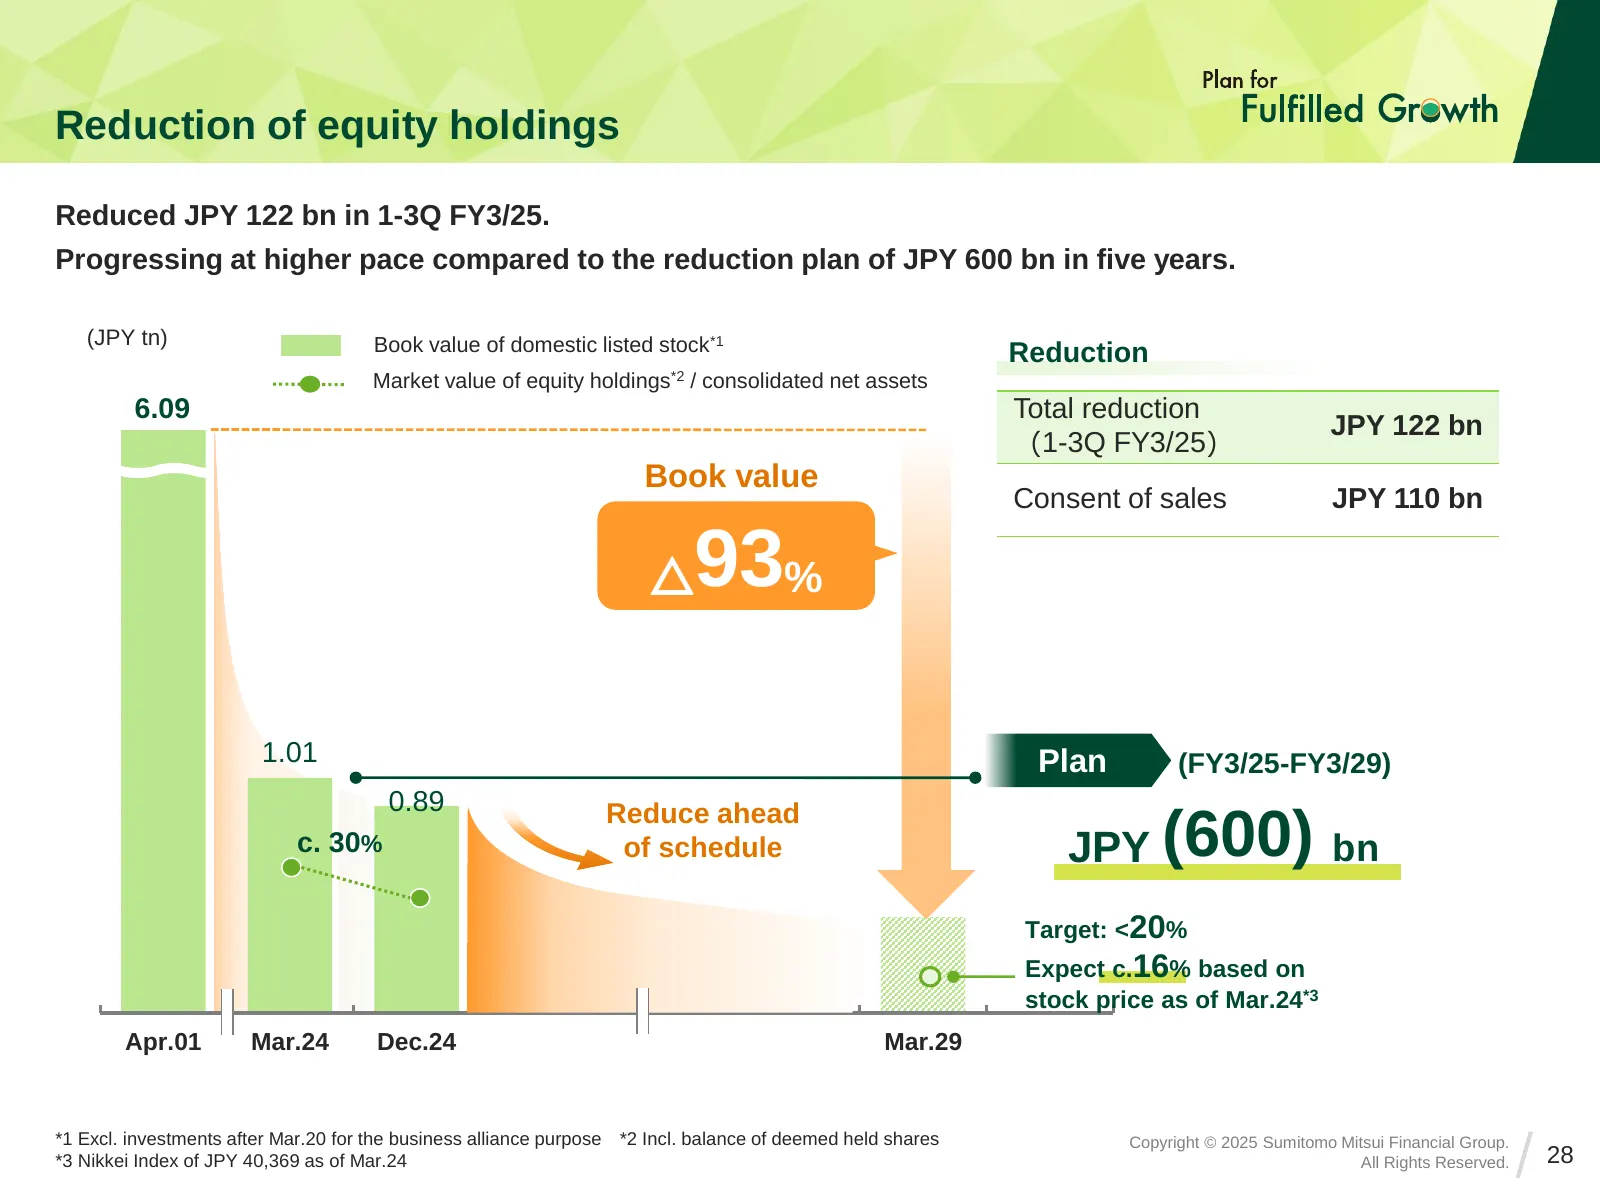
Reduction of equity holdings Reduced JPY 122 bn in 1-3Q FY3/25. Progressing at higher pace compared to the reduction plan of JPY 600 bn in five years. (JPY tn) Book value of domestic listed stock*1 Reduction Market value of equity holdings*2 / consolidated net assets 6.09 Total reduction JPY 122 bn
Slide 29: Cost control
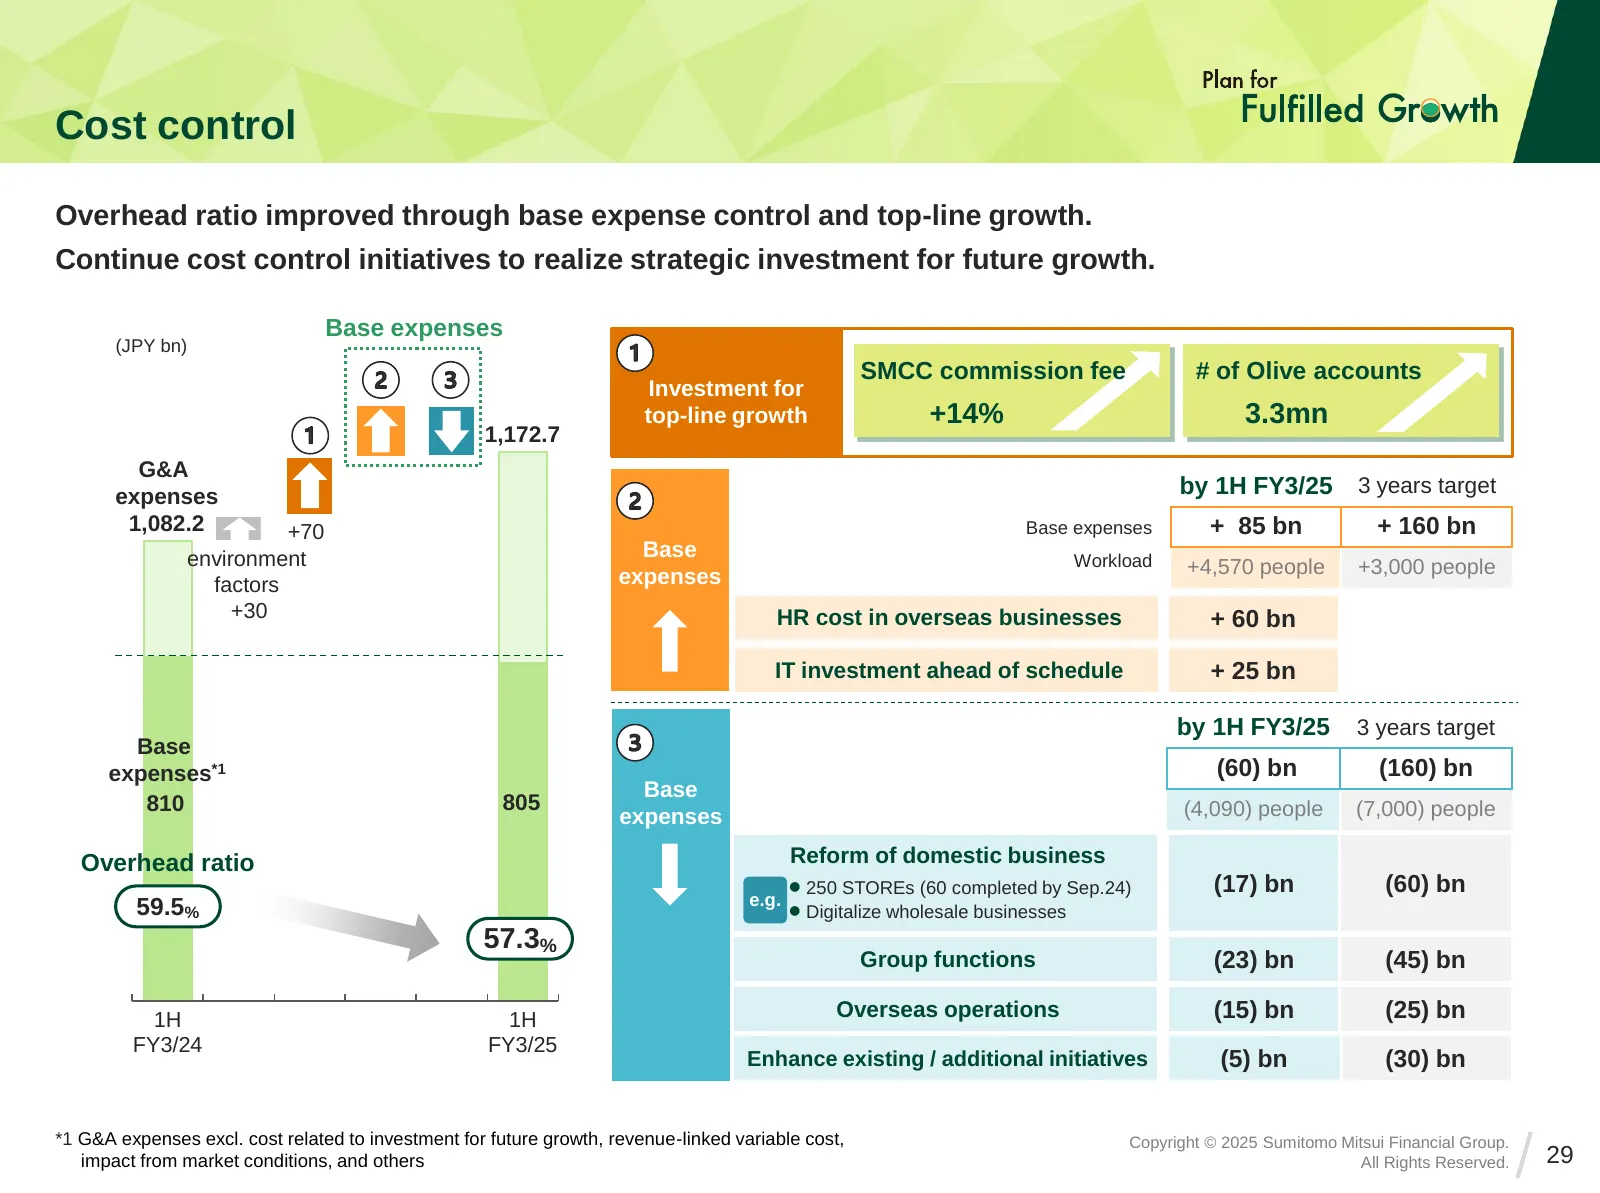
Cost control Overhead ratio improved through base expense control and top-line growth. Continue cost control initiatives to realize strategic investment for future growth. Base expenses (JPY bn) SMCC commission fee # of Olive accounts Investment for top-line growth +14% 3.3mn 1,172.7 G&A expenses by
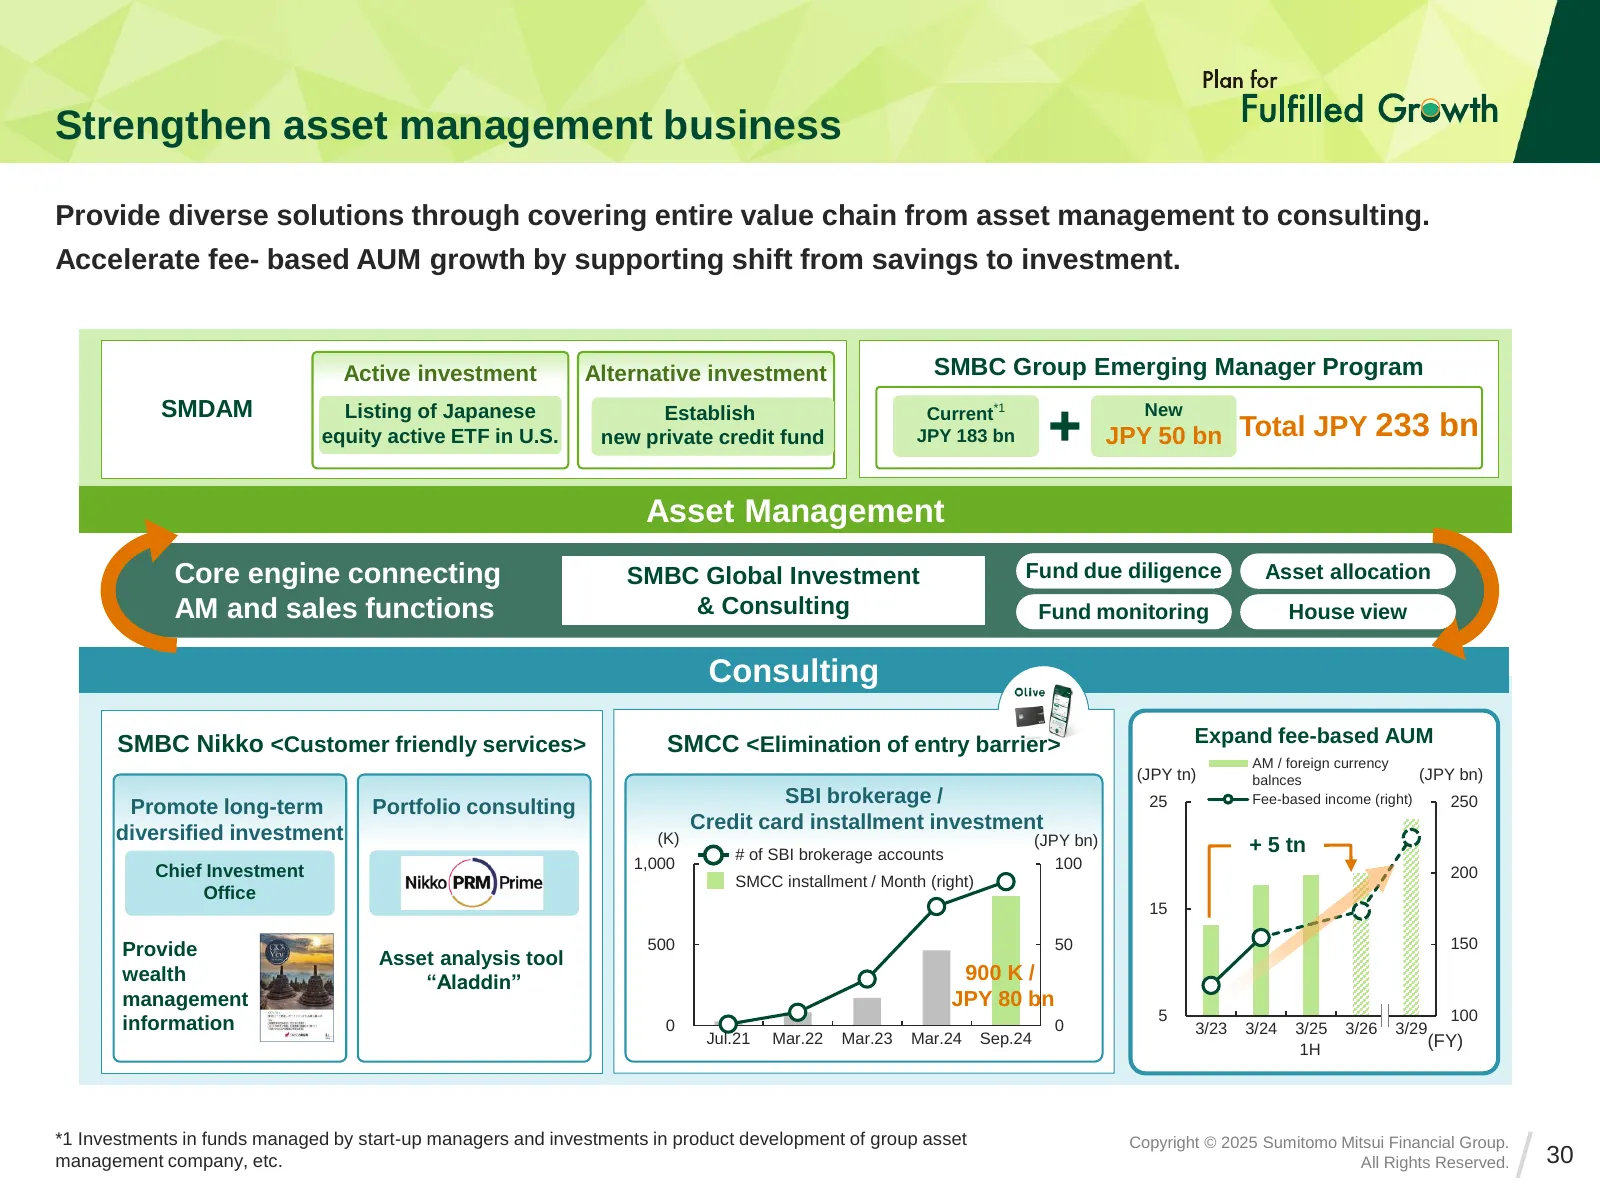
Slide 30: Strengthen asset management business
Strengthen asset management business Provide diverse solutions through covering entire value chain from asset management to consulting. Accelerate fee- based AUM growth by supporting shift from savings to investment. Active investment Alternative investment SMBC Group Emerging Manager Program SMDAM
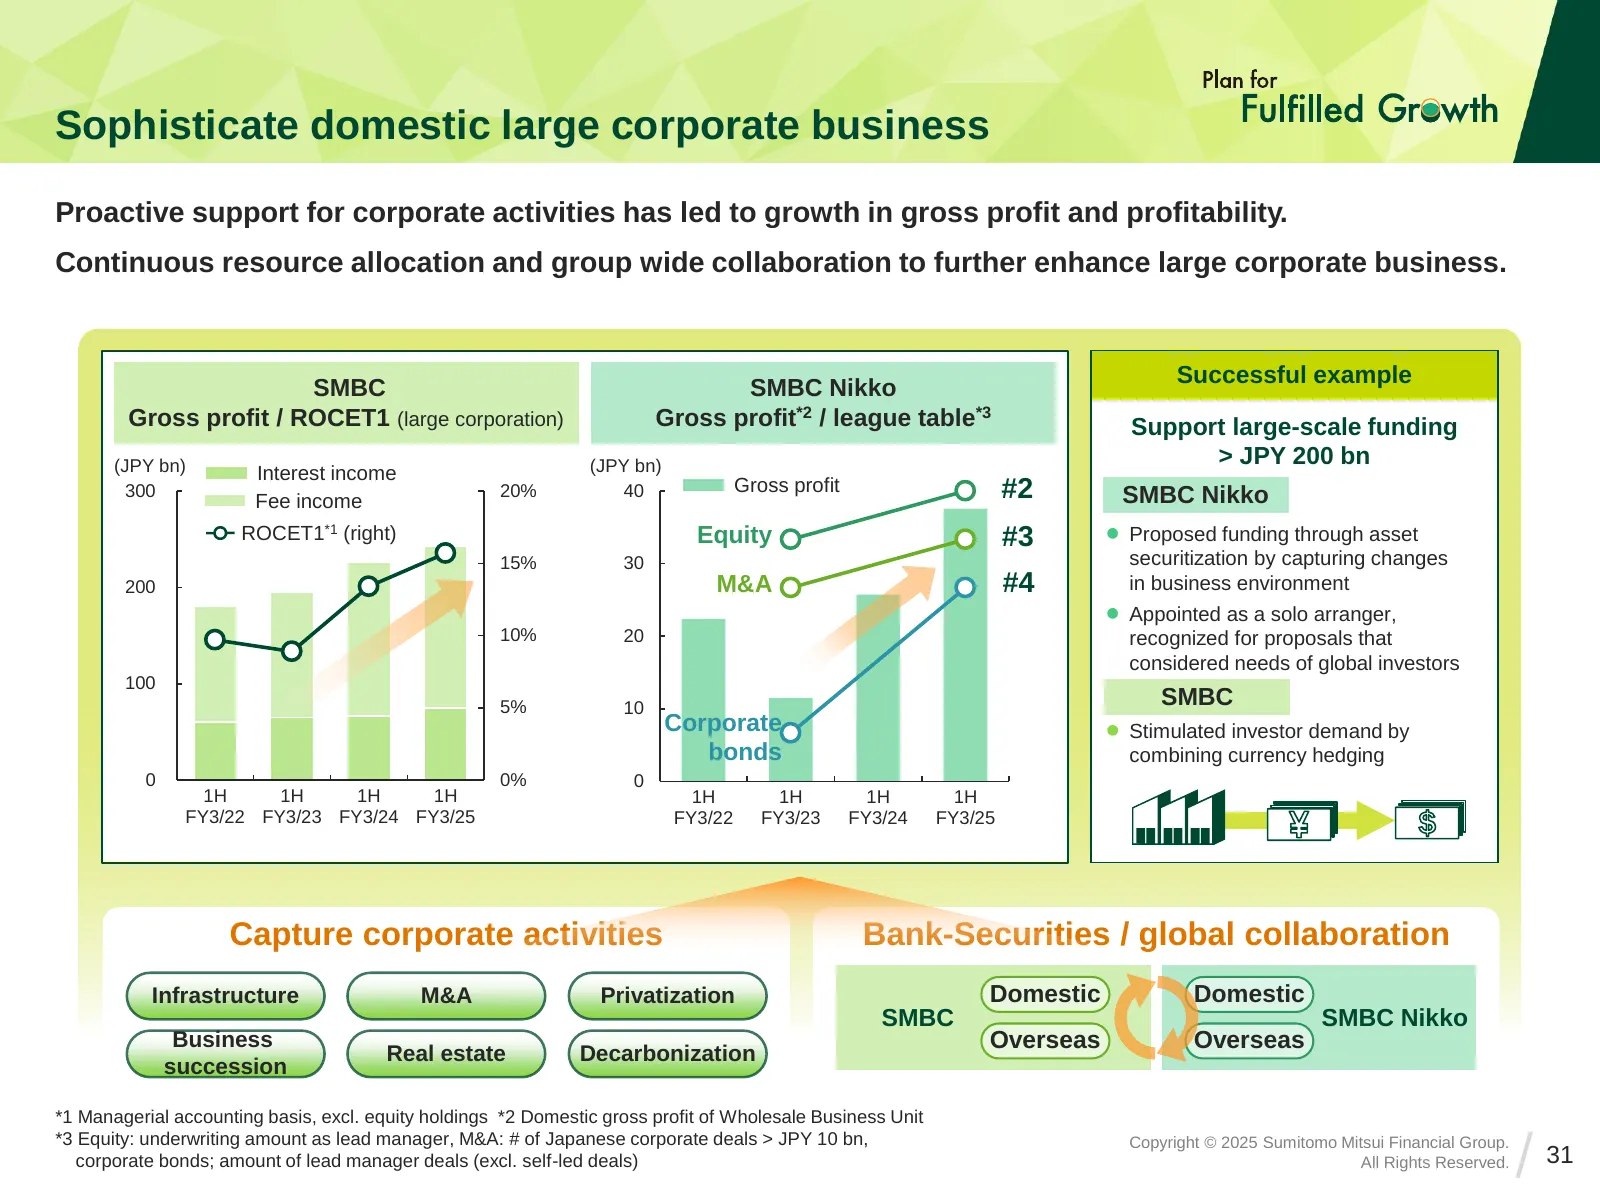
Slide 31: Sophisticate domestic large corporate business
Sophisticate domestic large corporate business Proactive support for corporate activities has led to growth in gross profit and profitability. Continuous resource allocation and group wide collaboration to further enhance large corporate business. Successful example SMBC SMBC Nikko Gross profit / RO
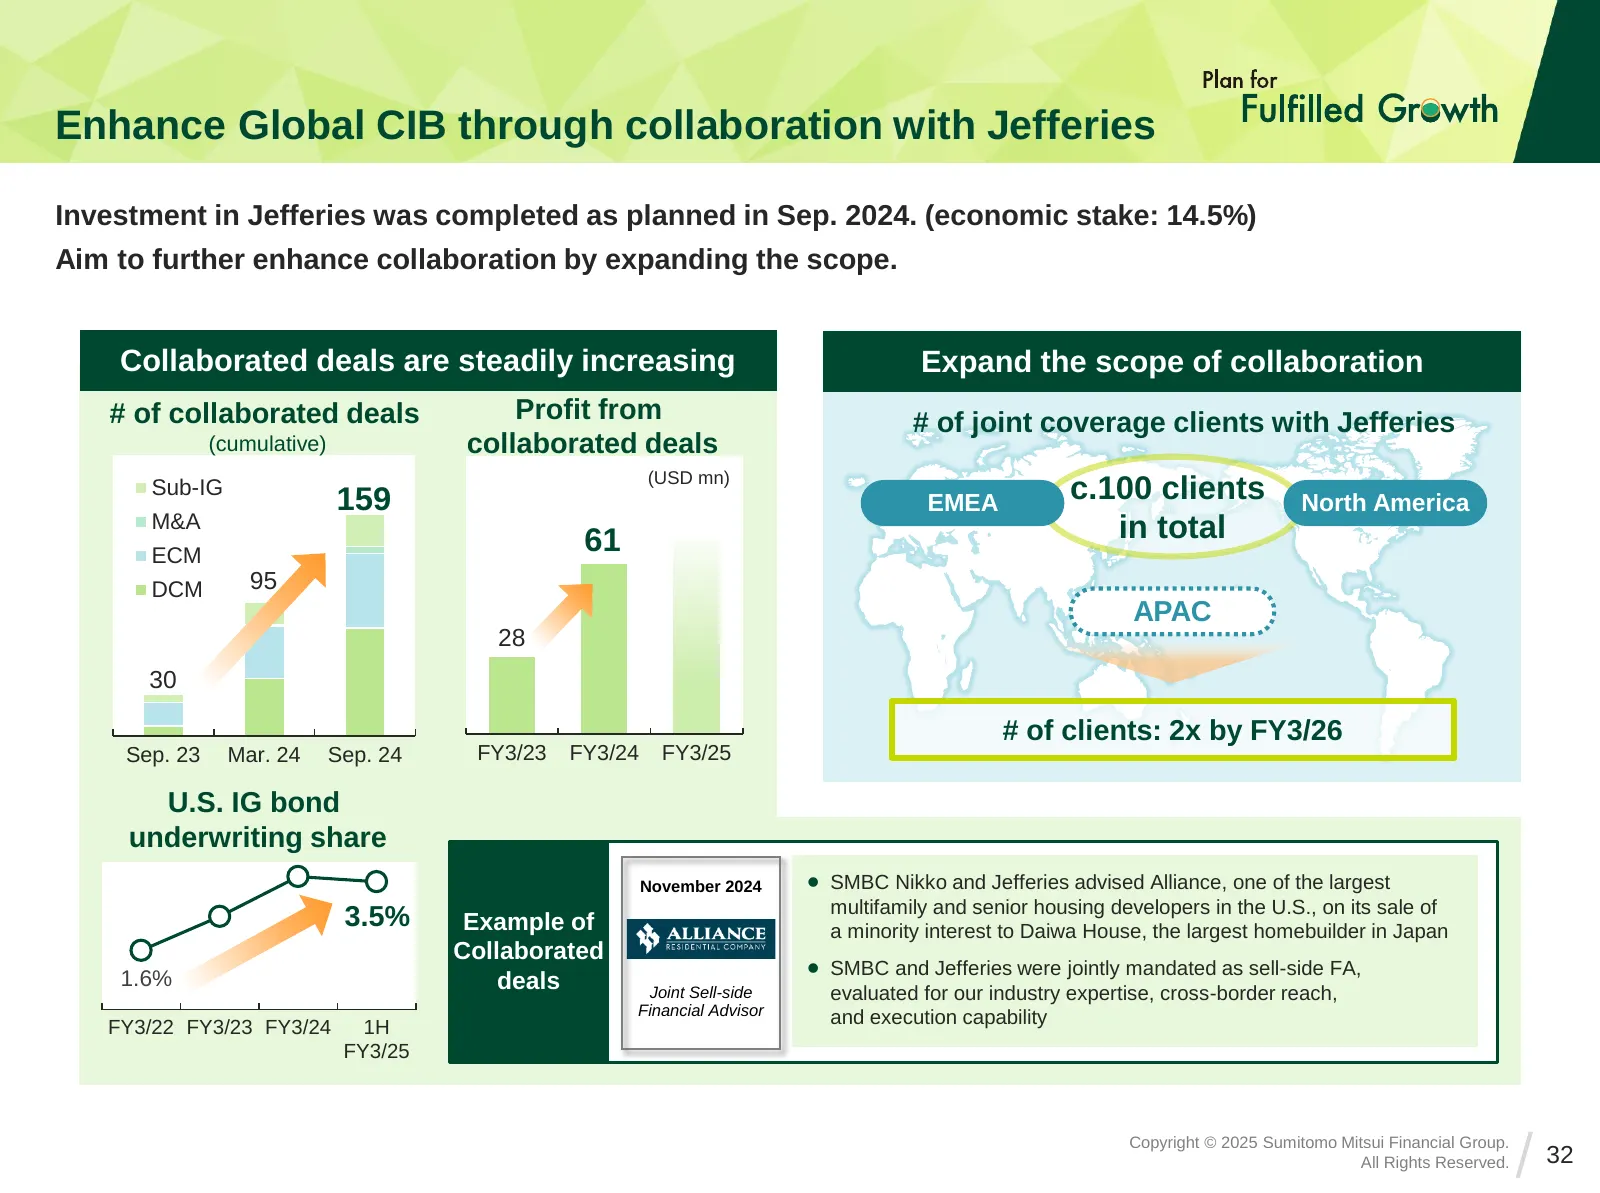
Slide 32: Enhance Global CIB through collaboration with Jefferies
Enhance Global CIB through collaboration with Jefferies Investment in Jefferies was completed as planned in Sep. 2024. (economic stake: 14.5%) Aim to further enhance collaboration by expanding the scope. Collaborated deals are steadily increasing Expand the scope of collaboration # of collaborated d
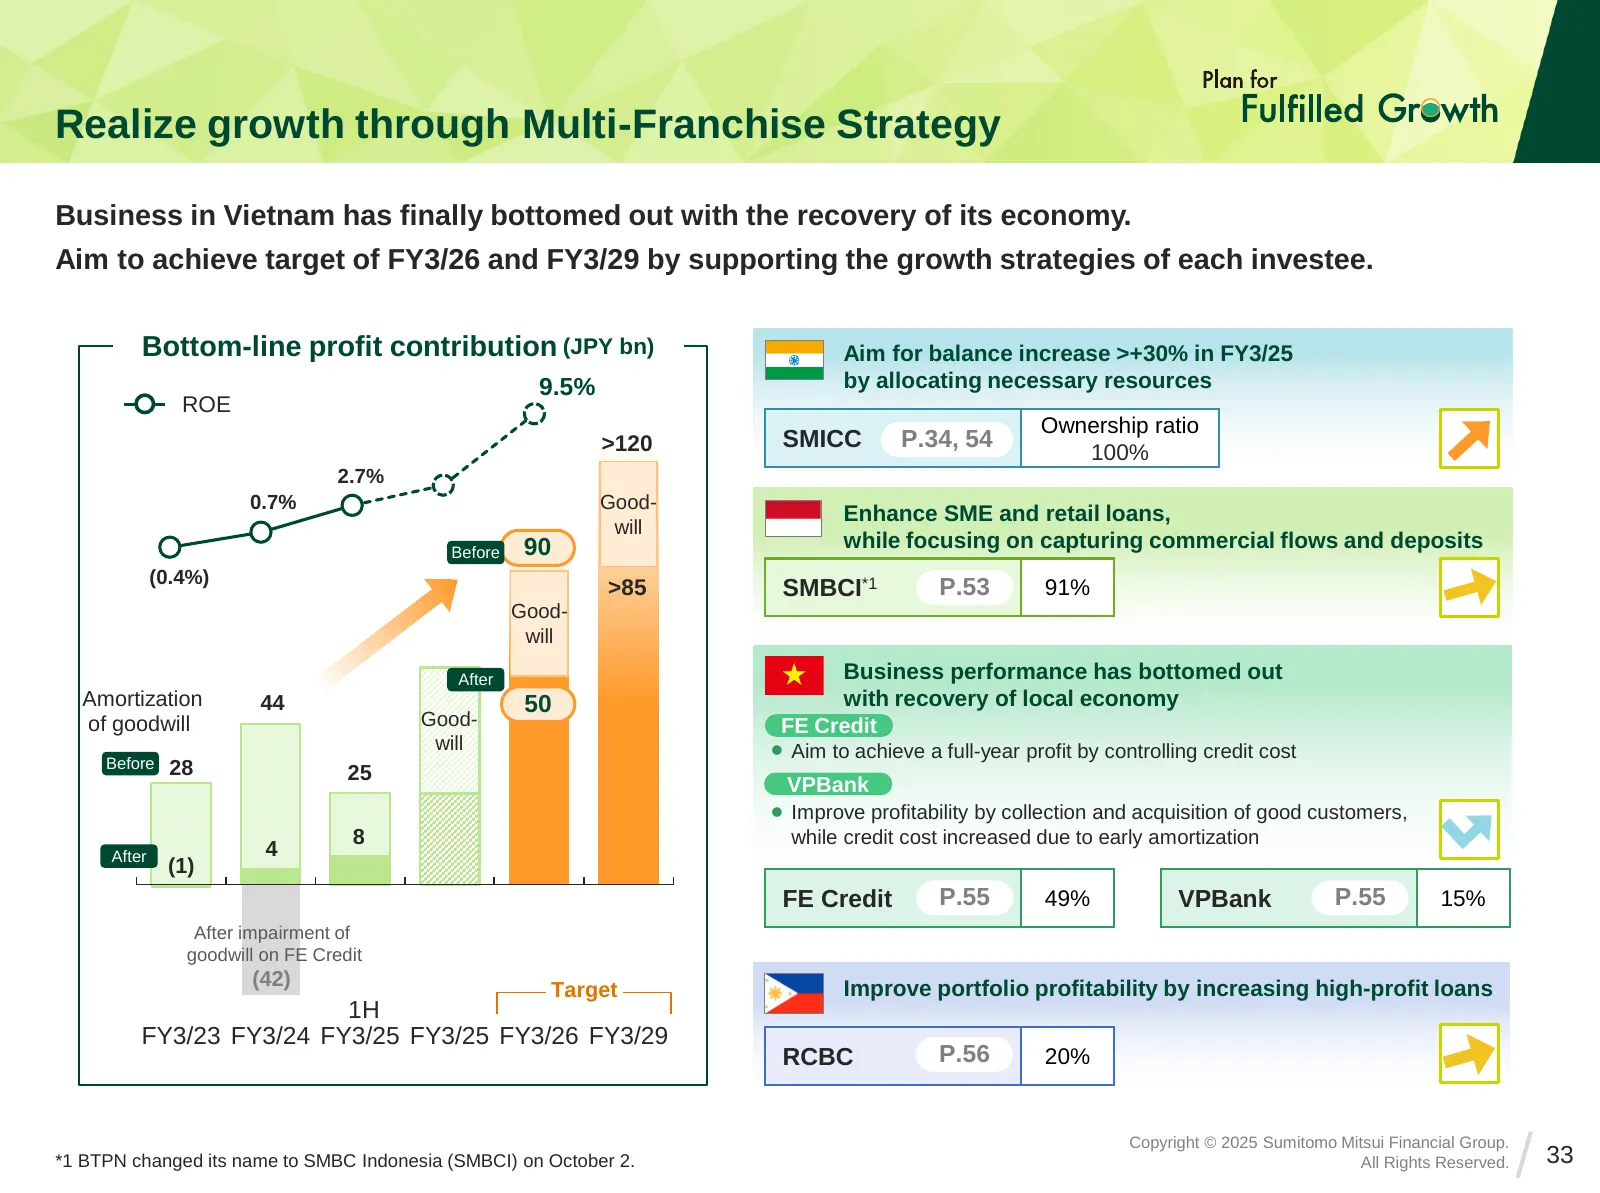
Slide 33: Realize growth through Multi-Franchise Strategy
Realize growth through Multi-Franchise Strategy Business in Vietnam has finally bottomed out with the recovery of its economy. Aim to achieve target of FY3/26 and FY3/29 by supporting the growth strategies of each investee. Bottom-line profit contribution (JPY bn) Aim for balance increase >+30% in F
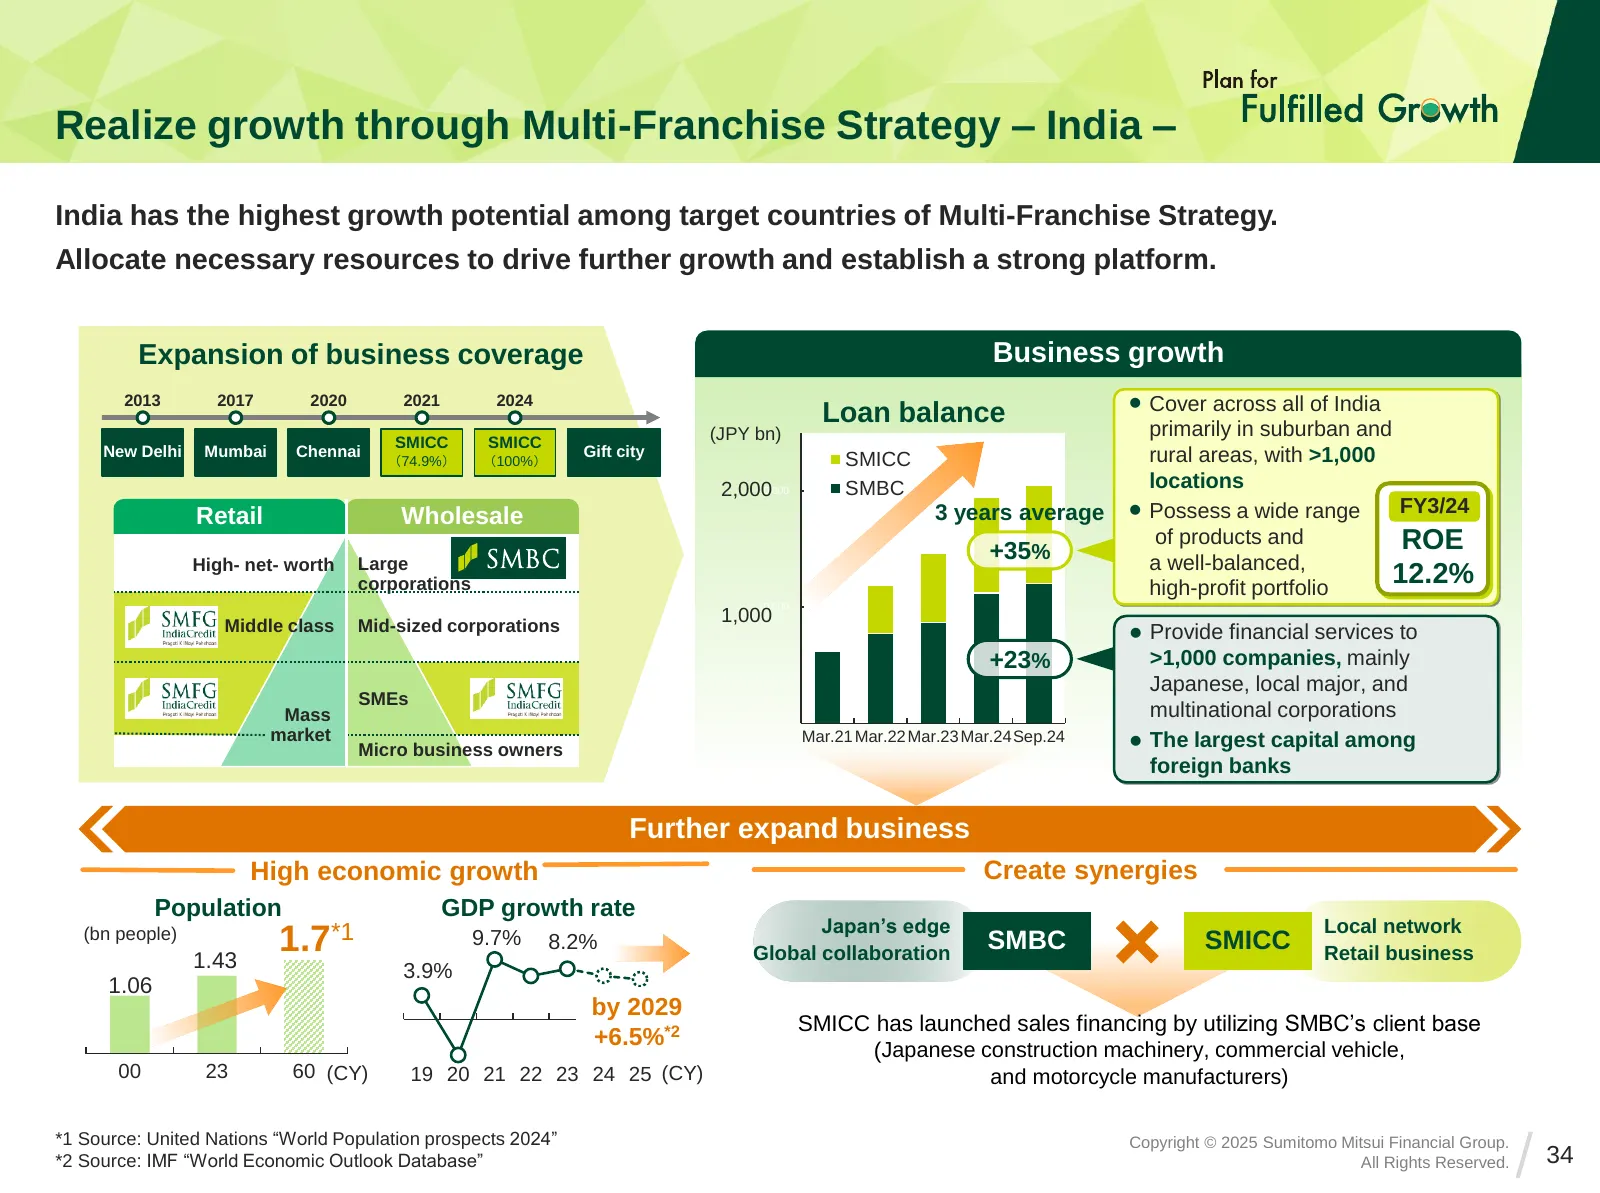
Slide 34: Realize growth through Multi-Franchise Strategy – India –
Realize growth through Multi-Franchise Strategy – India – India has the highest growth potential among target countries of Multi-Franchise Strategy. Allocate necessary resources to drive further growth and establish a strong platform. Expansion of business coverage Business growth 2013 2017 2020 202
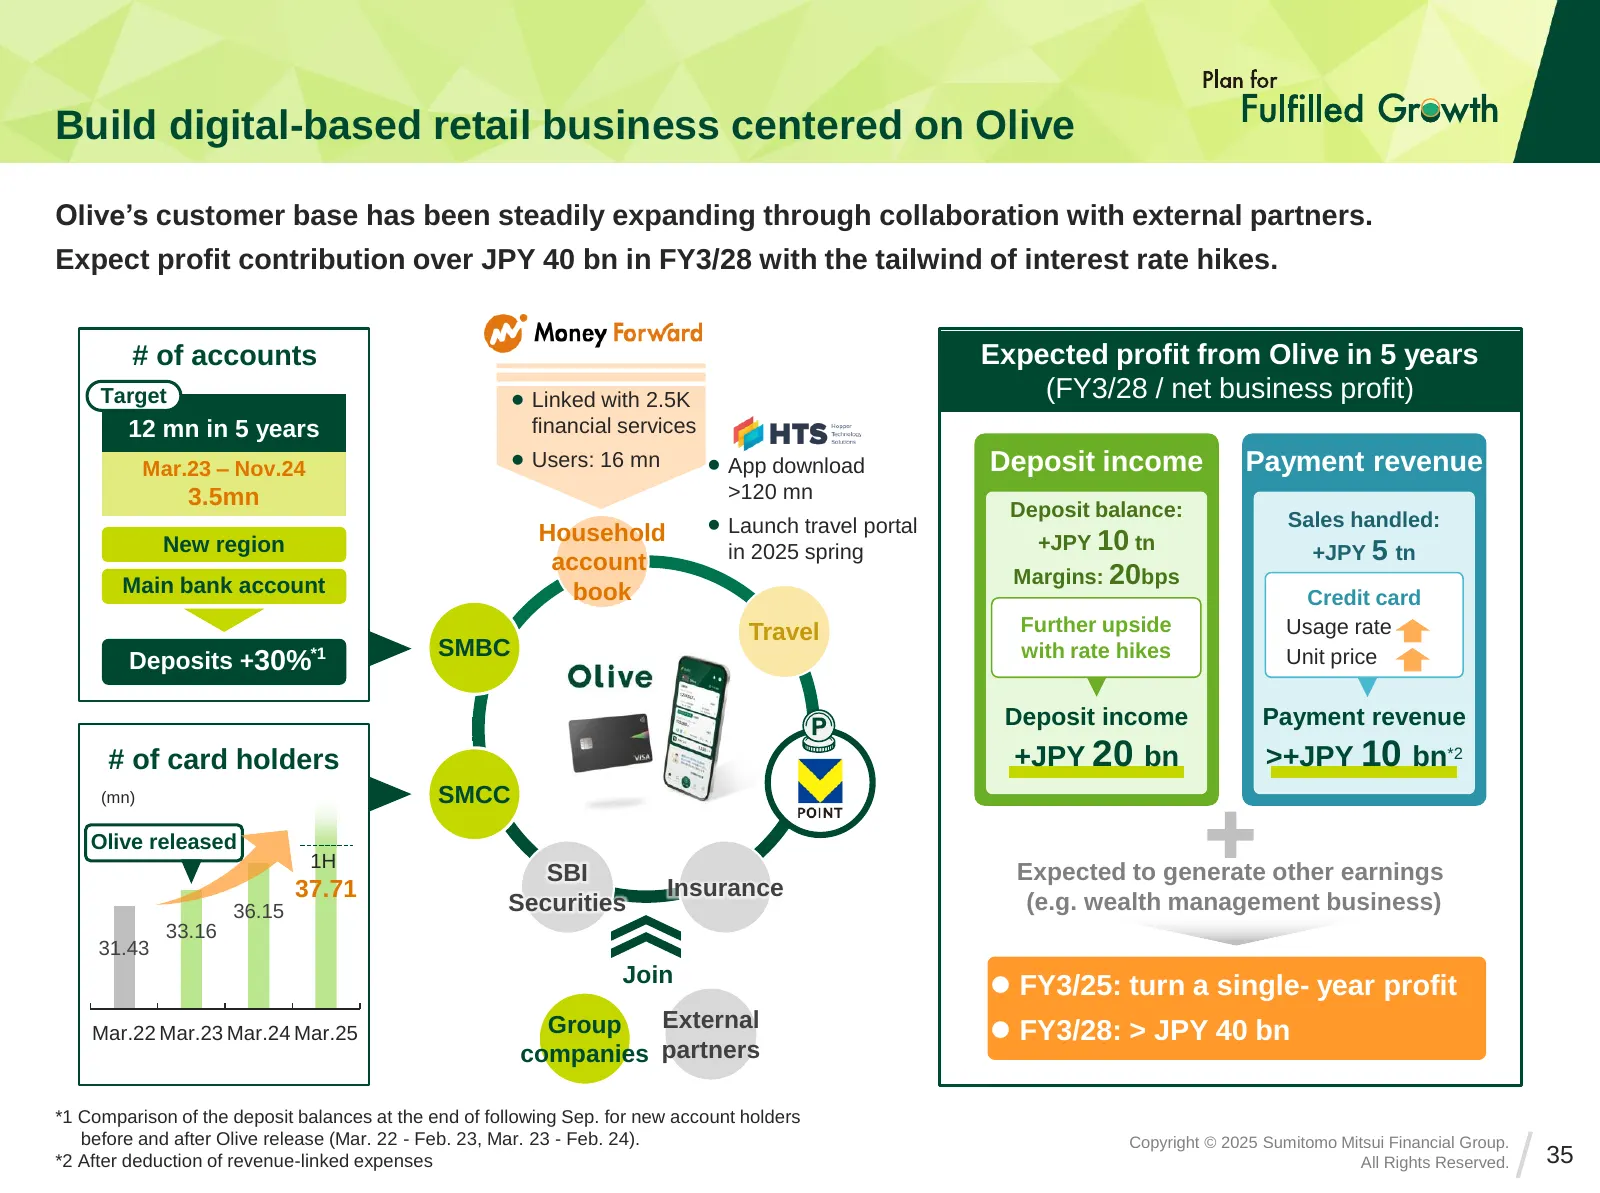
Slide 35: Build digital-based retail business centered on Olive
Build digital-based retail business centered on Olive Olive’s customer base has been steadily expanding through collaboration with external partners. Expect profit contribution over JPY 40 bn in FY3/28 with the tailwind of interest rate hikes. # of accounts Expected profit from Olive in 5 years Targ
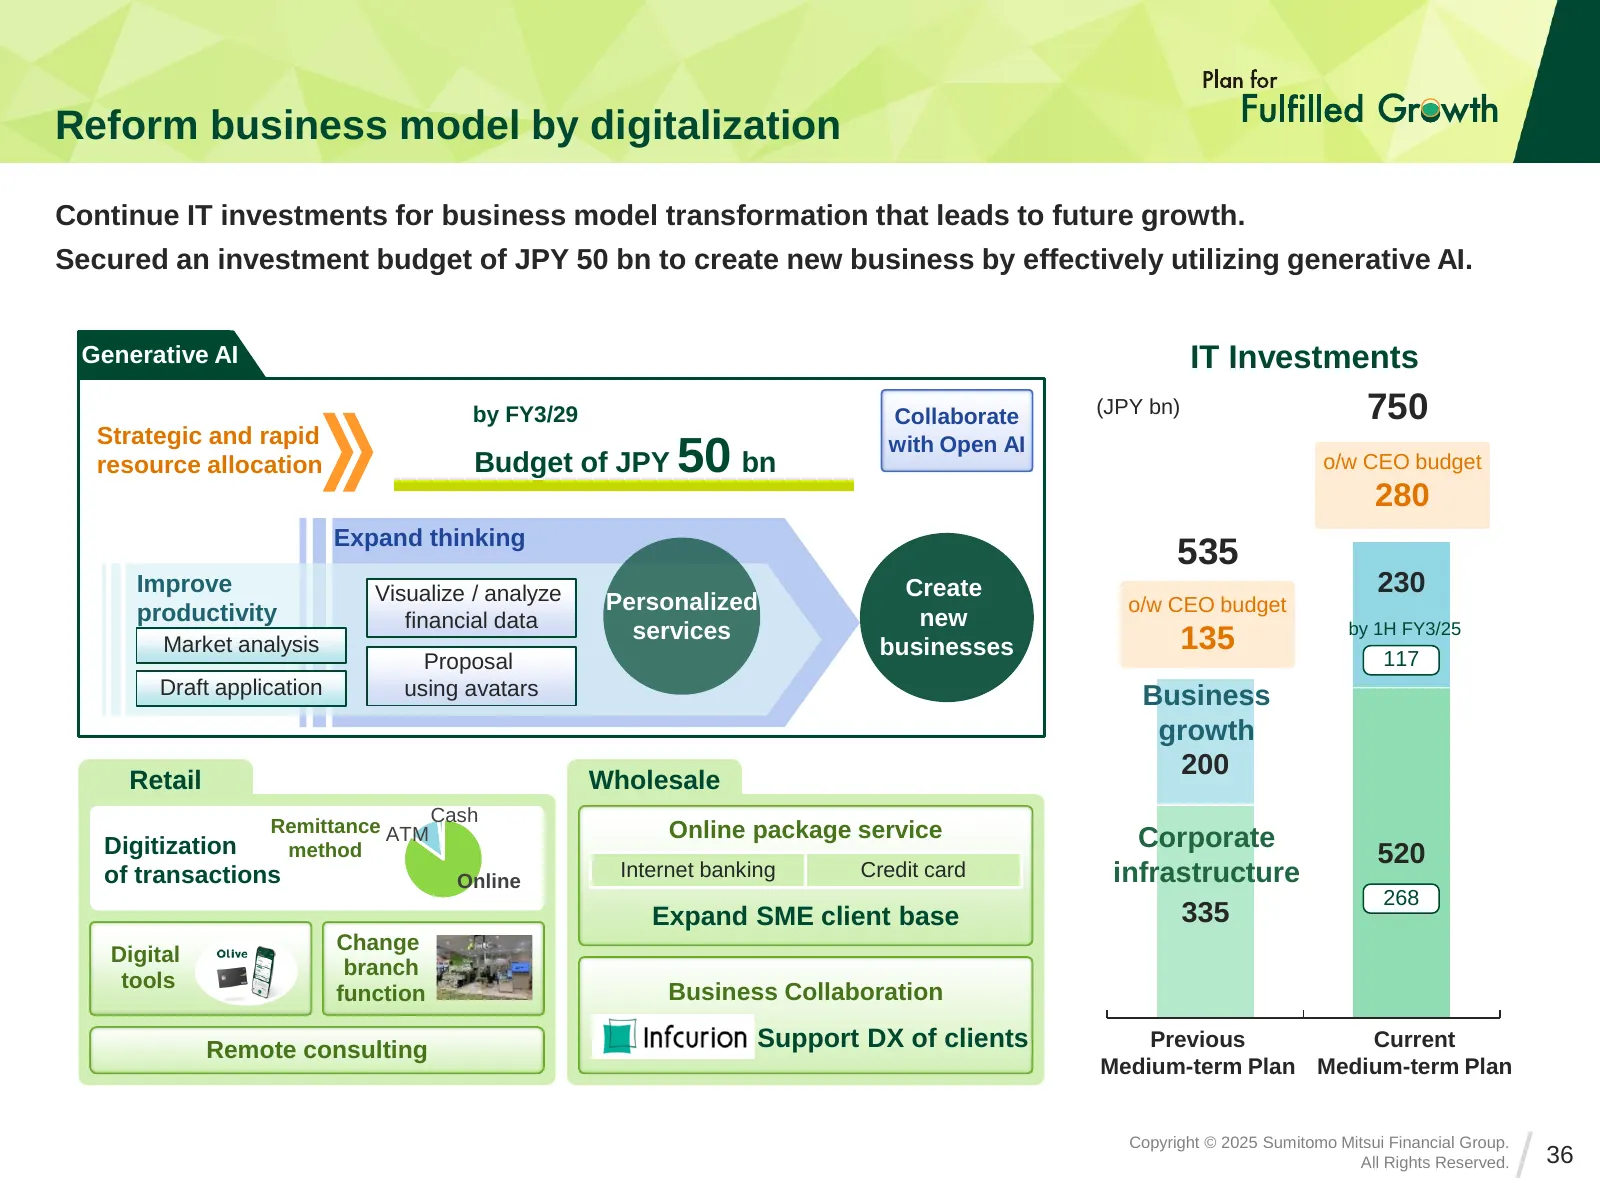
Slide 36: Reform business model by digitalization
Reform business model by digitalization Continue IT investments for business model transformation that leads to future growth. Secured an investment budget of JPY 50 bn to create new business by effectively utilizing generative AI. Generative AI IT Investments by FY3/29 Collaborate (JPY bn) 750 Stra
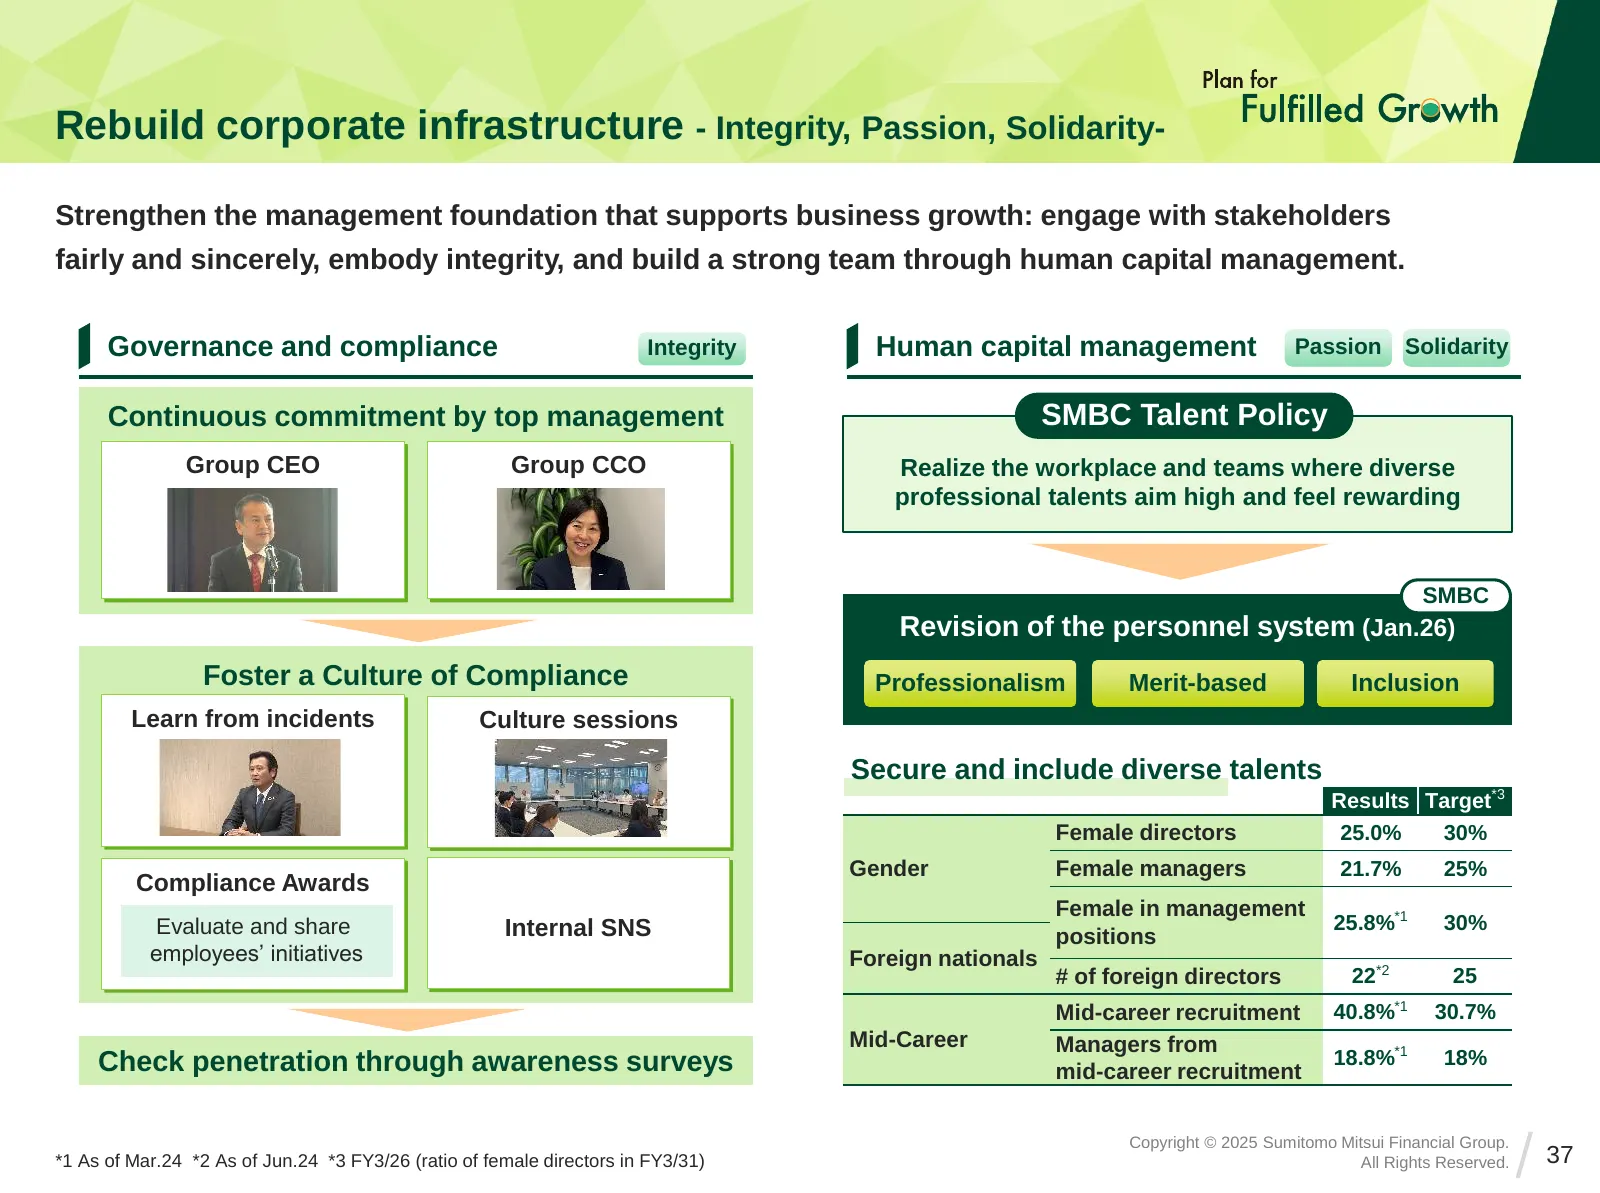
Slide 37: Rebuild corporate infrastructure
Rebuild corporate infrastructure - Integrity, Passion, Solidarity- Strengthen the management foundation that supports business growth: engage with stakeholders fairly and sincerely, embody integrity, and build a strong team through human capital management. Governance and compliance Integrity Human
Slide 38: Create social value
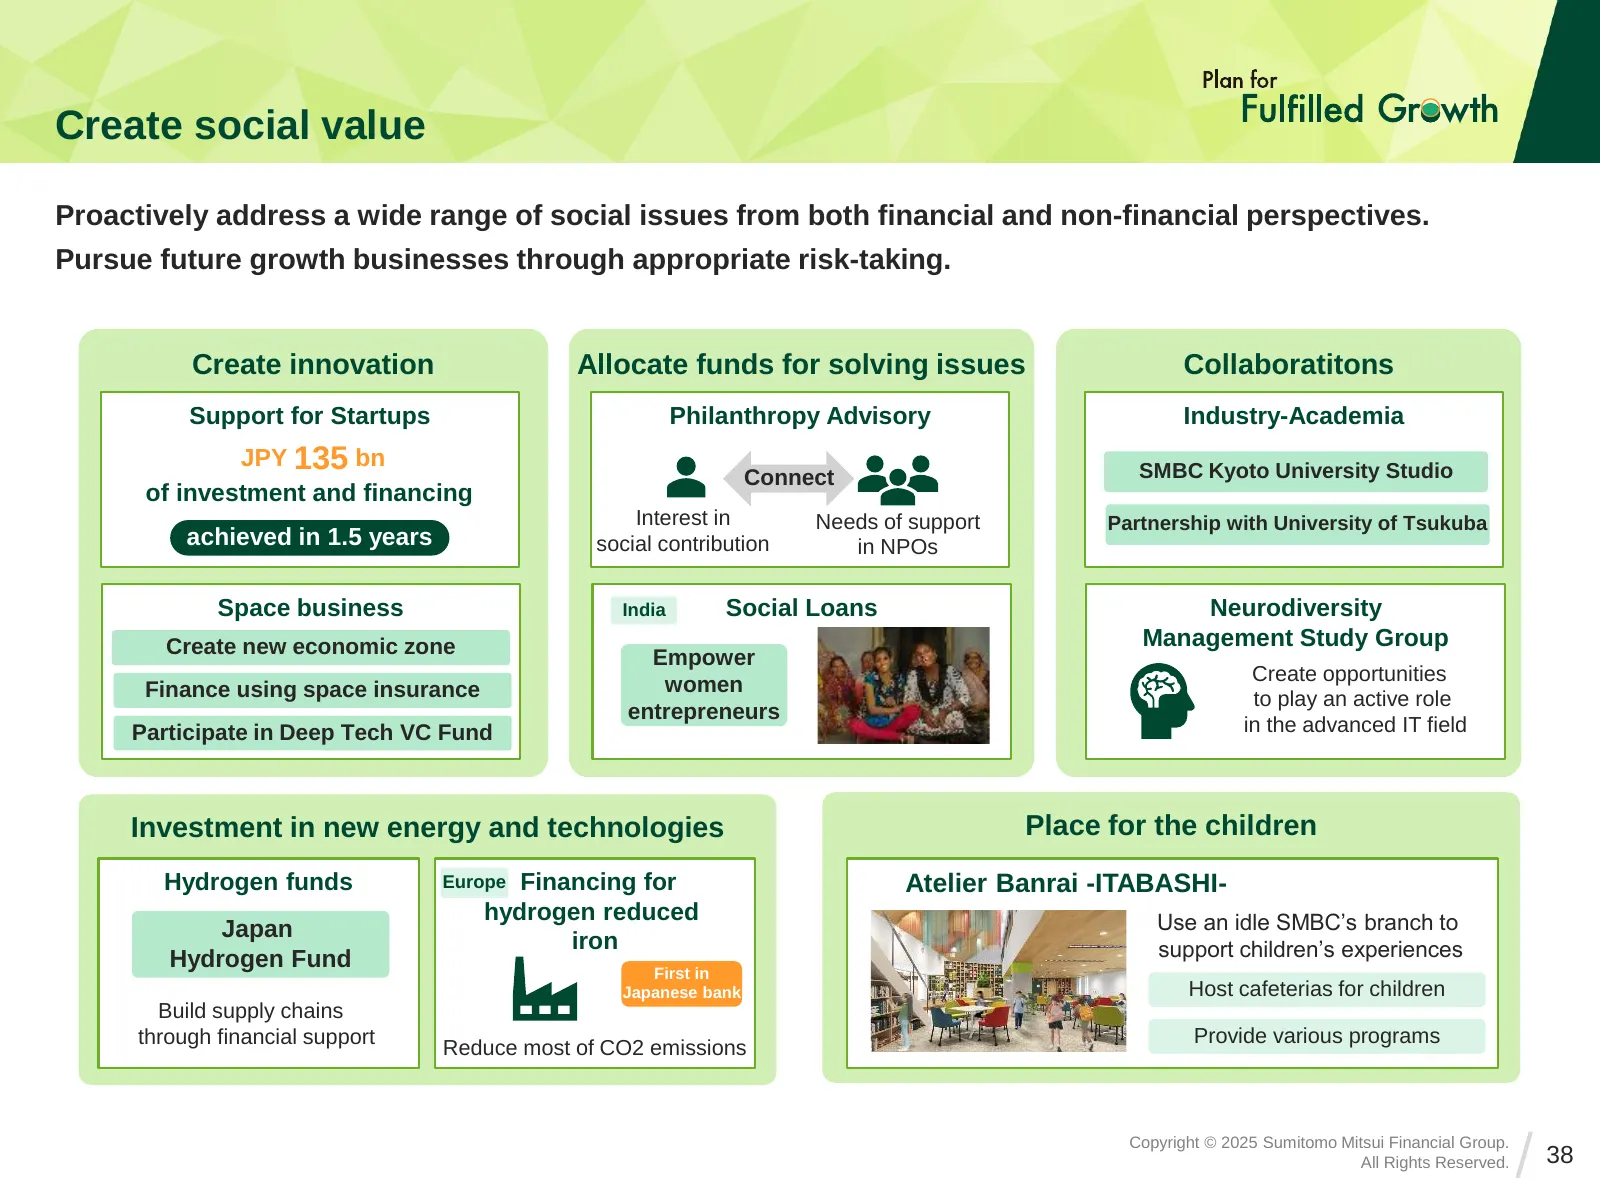
Create social value Proactively address a wide range of social issues from both financial and non-financial perspectives. Pursue future growth businesses through appropriate risk-taking. Create innovation Allocate funds for solving issues Collaboratitons Support for Startups Philanthropy Advisory In
Slide 39: (Ref.) Enhance non-financial disclosure
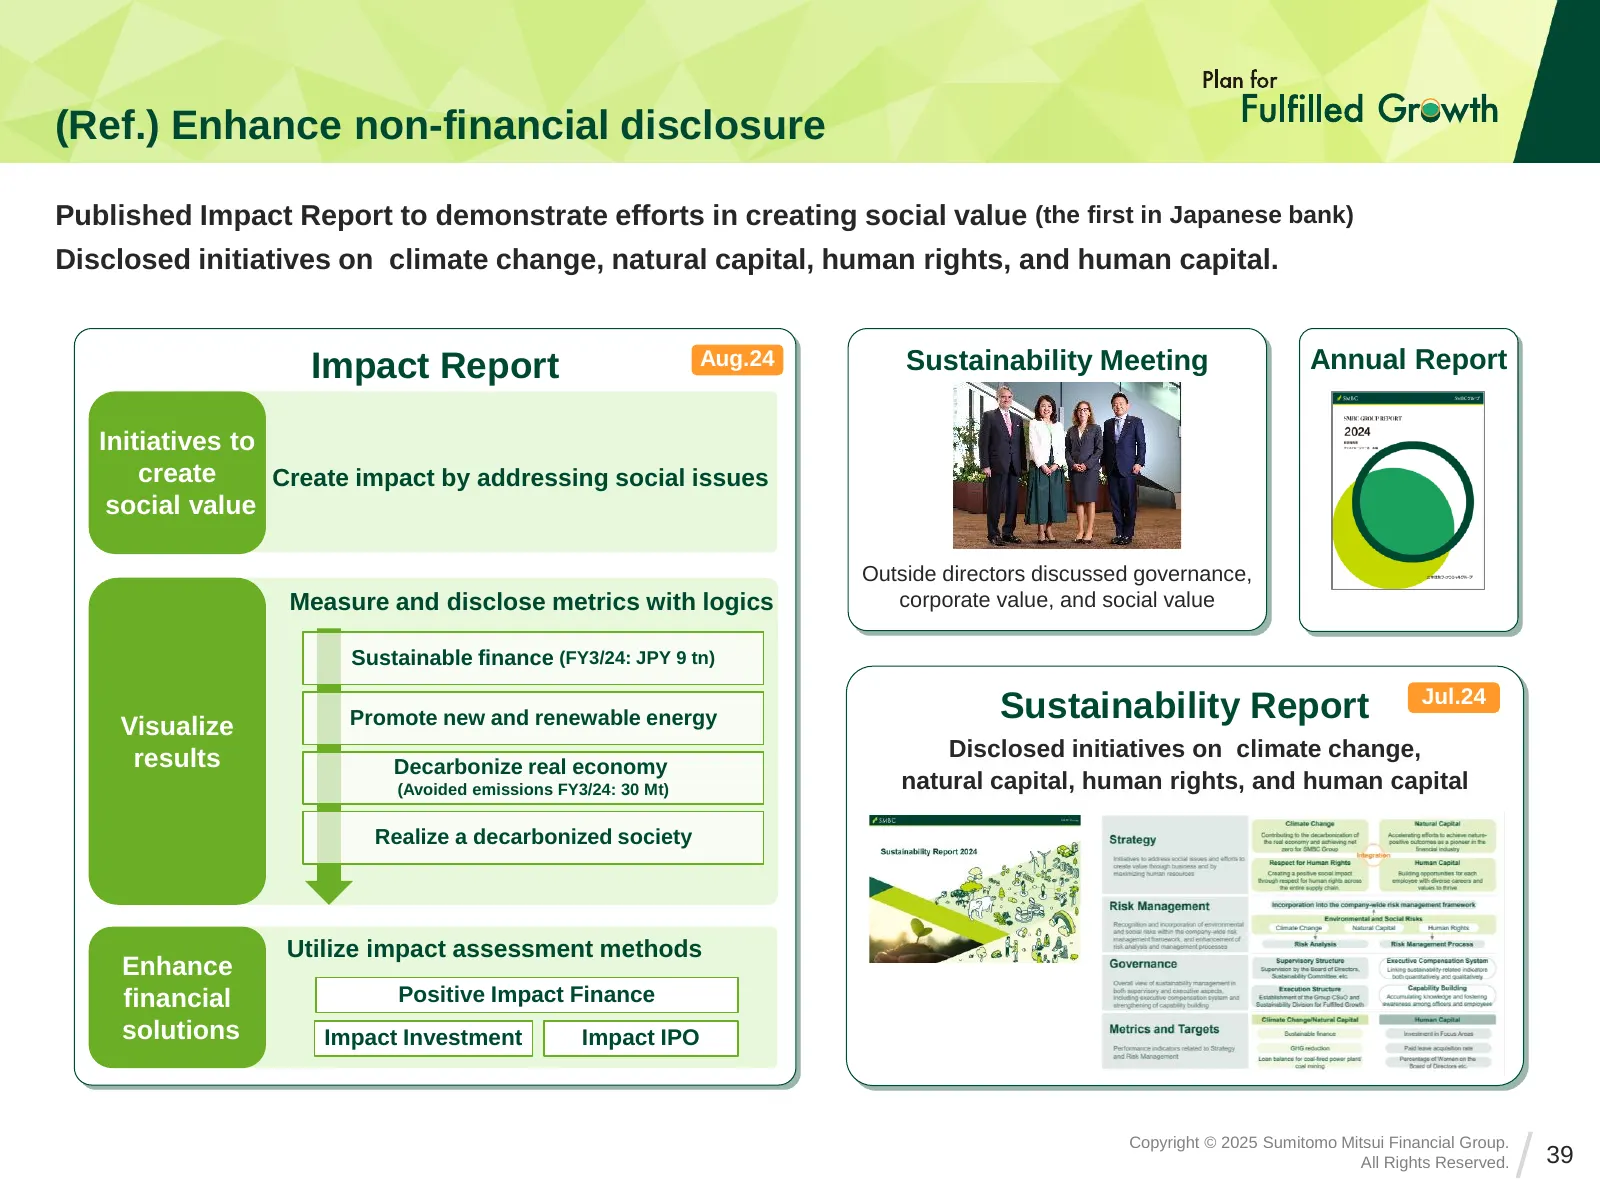
(Ref.) Enhance non-financial disclosure Published Impact Report to demonstrate efforts in creating social value (the first in Japanese bank) Disclosed initiatives on climate change, natural capital, human rights, and human capital. Impact Report Aug.24 Sustainability Meeting Annual Report Initiative

Slide 40: Capital Policy
Capital Policy
Slide 41: Shareholders return
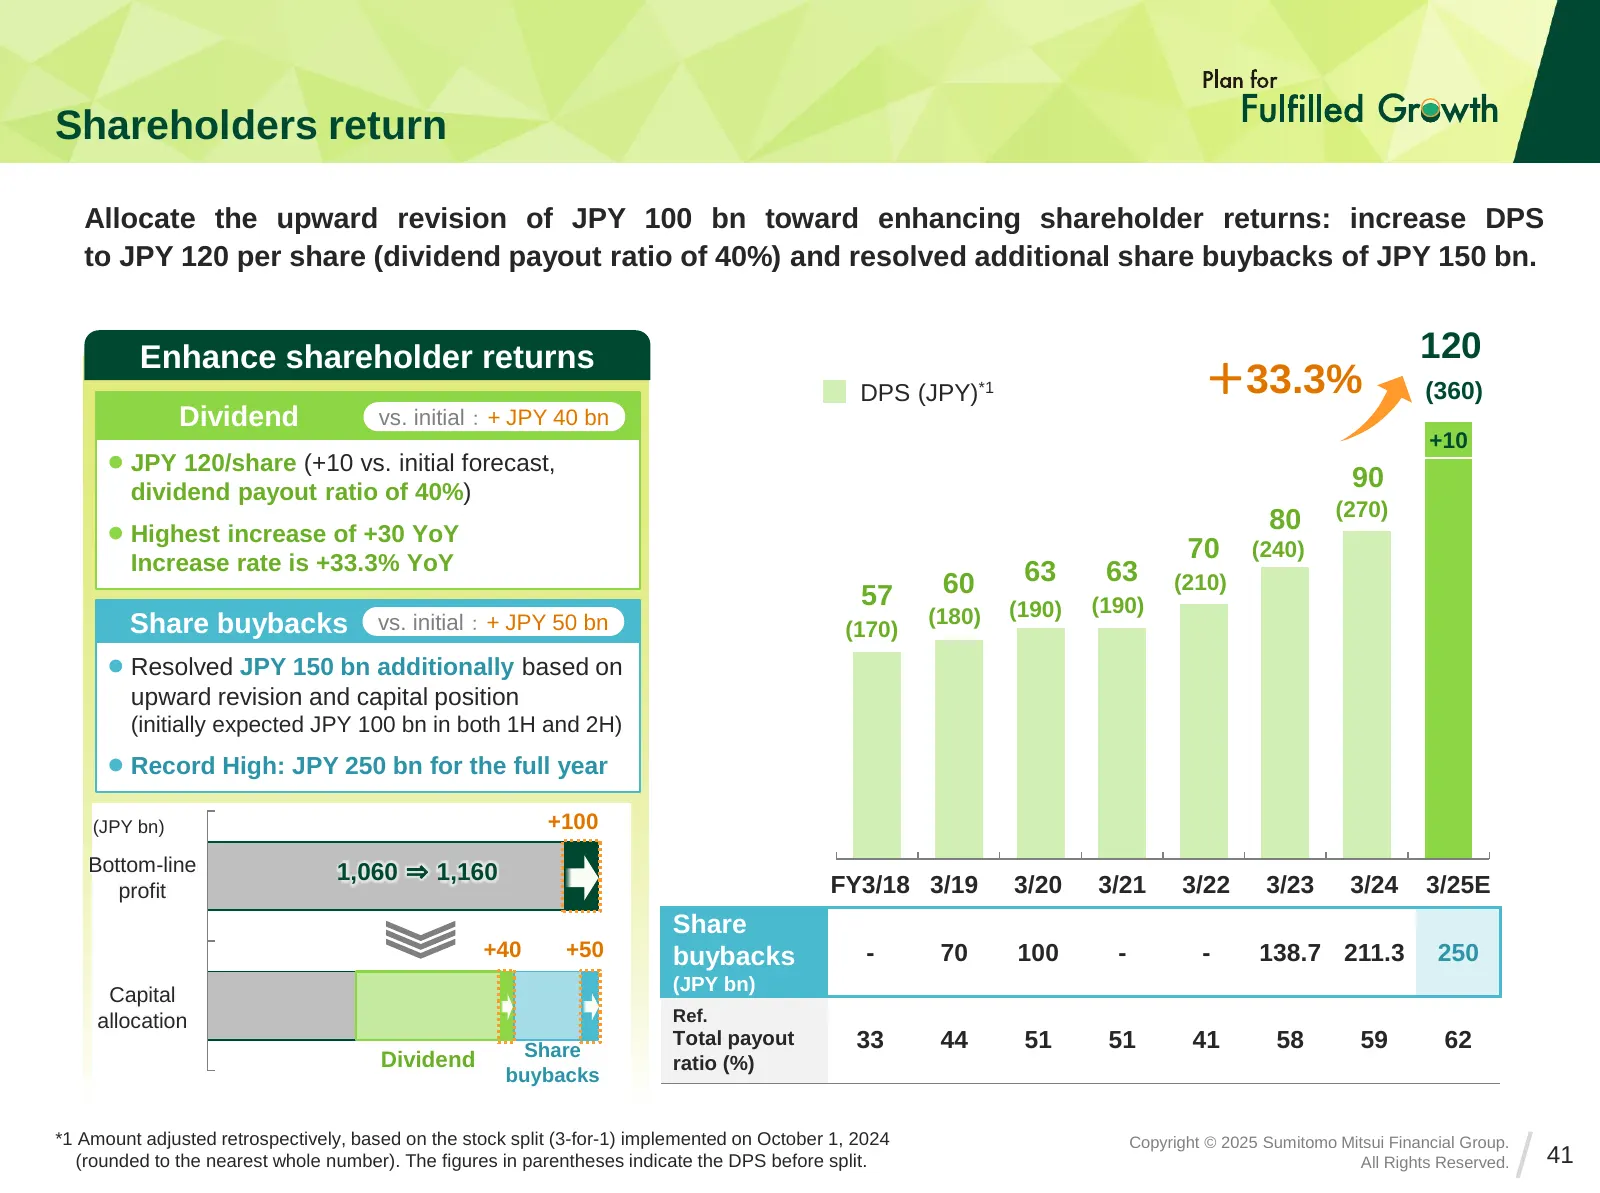
Shareholders return Allocate the upward revision of JPY 100 bn toward enhancing shareholder returns: increase DPS to JPY 120 per share (dividend payout ratio of 40%) and resolved additional share buybacks of JPY 150 bn. Enhance shareholder returns 120 DPS (JPY)*1 +33.3% (360) Dividend vs. initial:+
Slide 42: Basic capital policy
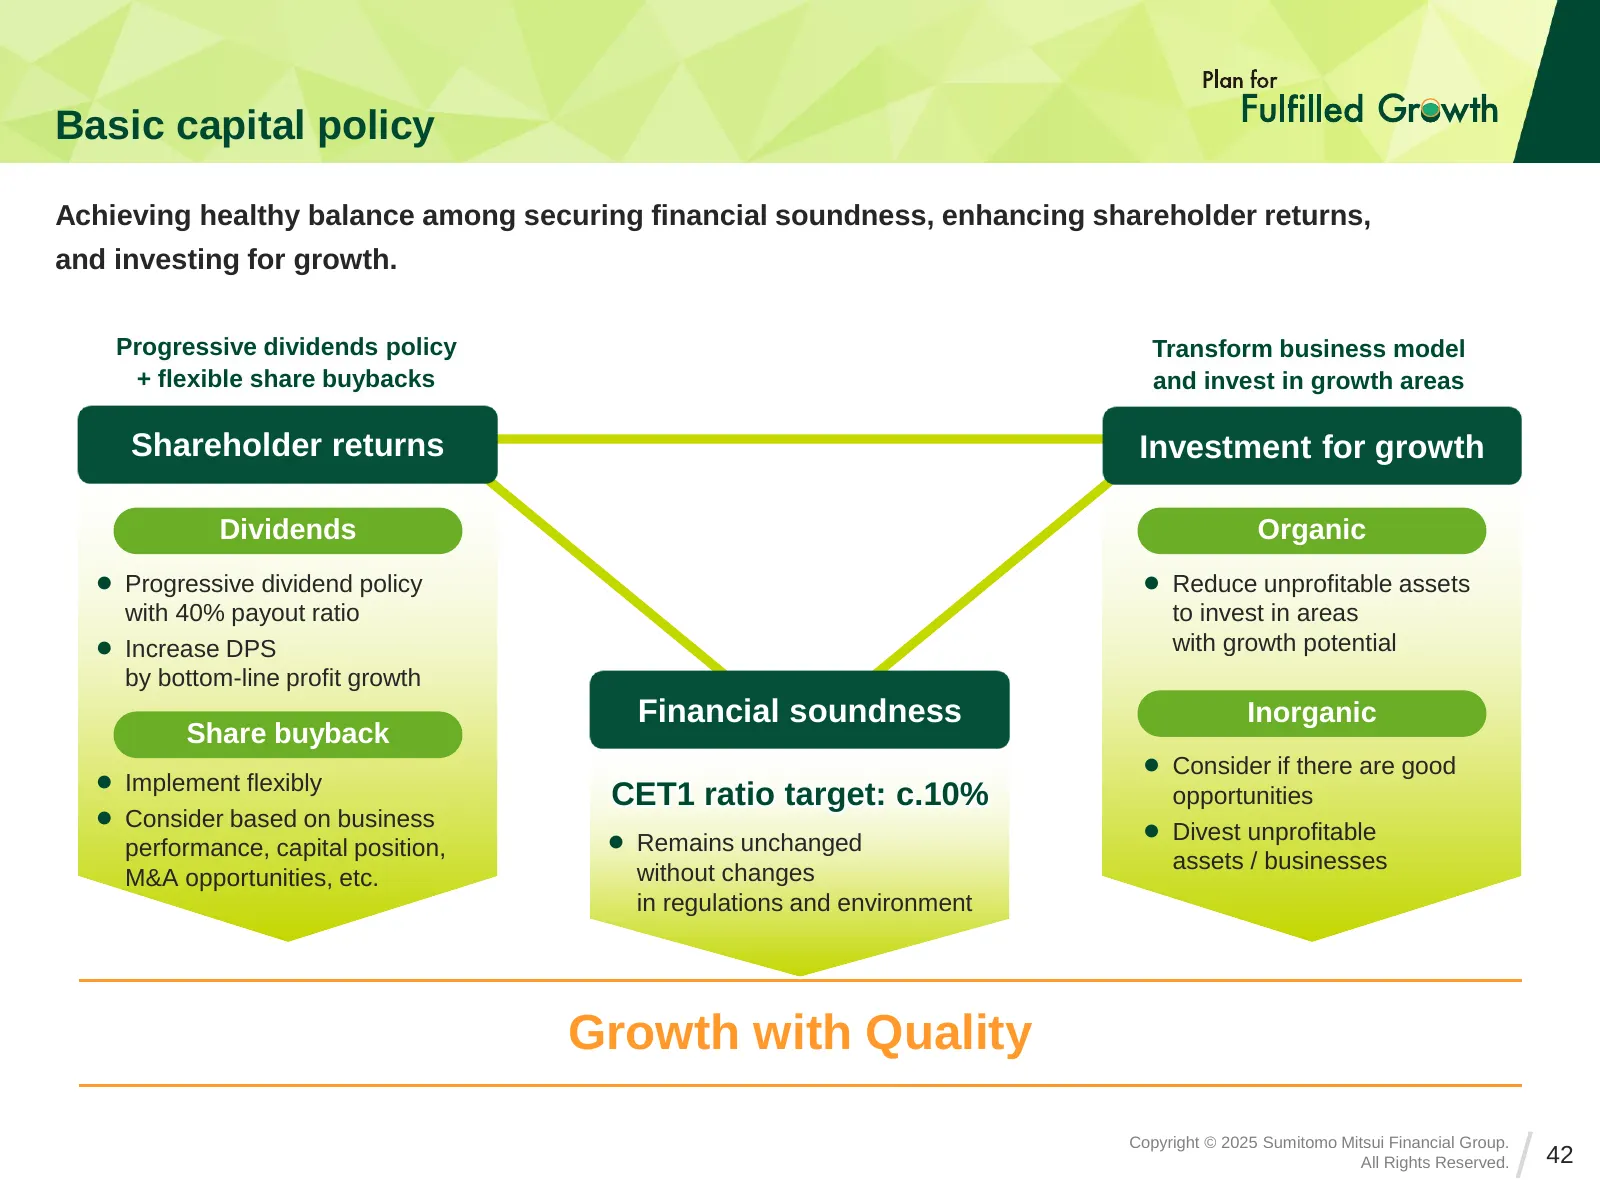
Basic capital policy Achieving healthy balance among securing financial soundness, enhancing shareholder returns, and investing for growth. Progressive dividends policy Transform business model + flexible share buybacks and invest in growth areas Shareholder returns Investment for growth Dividends O
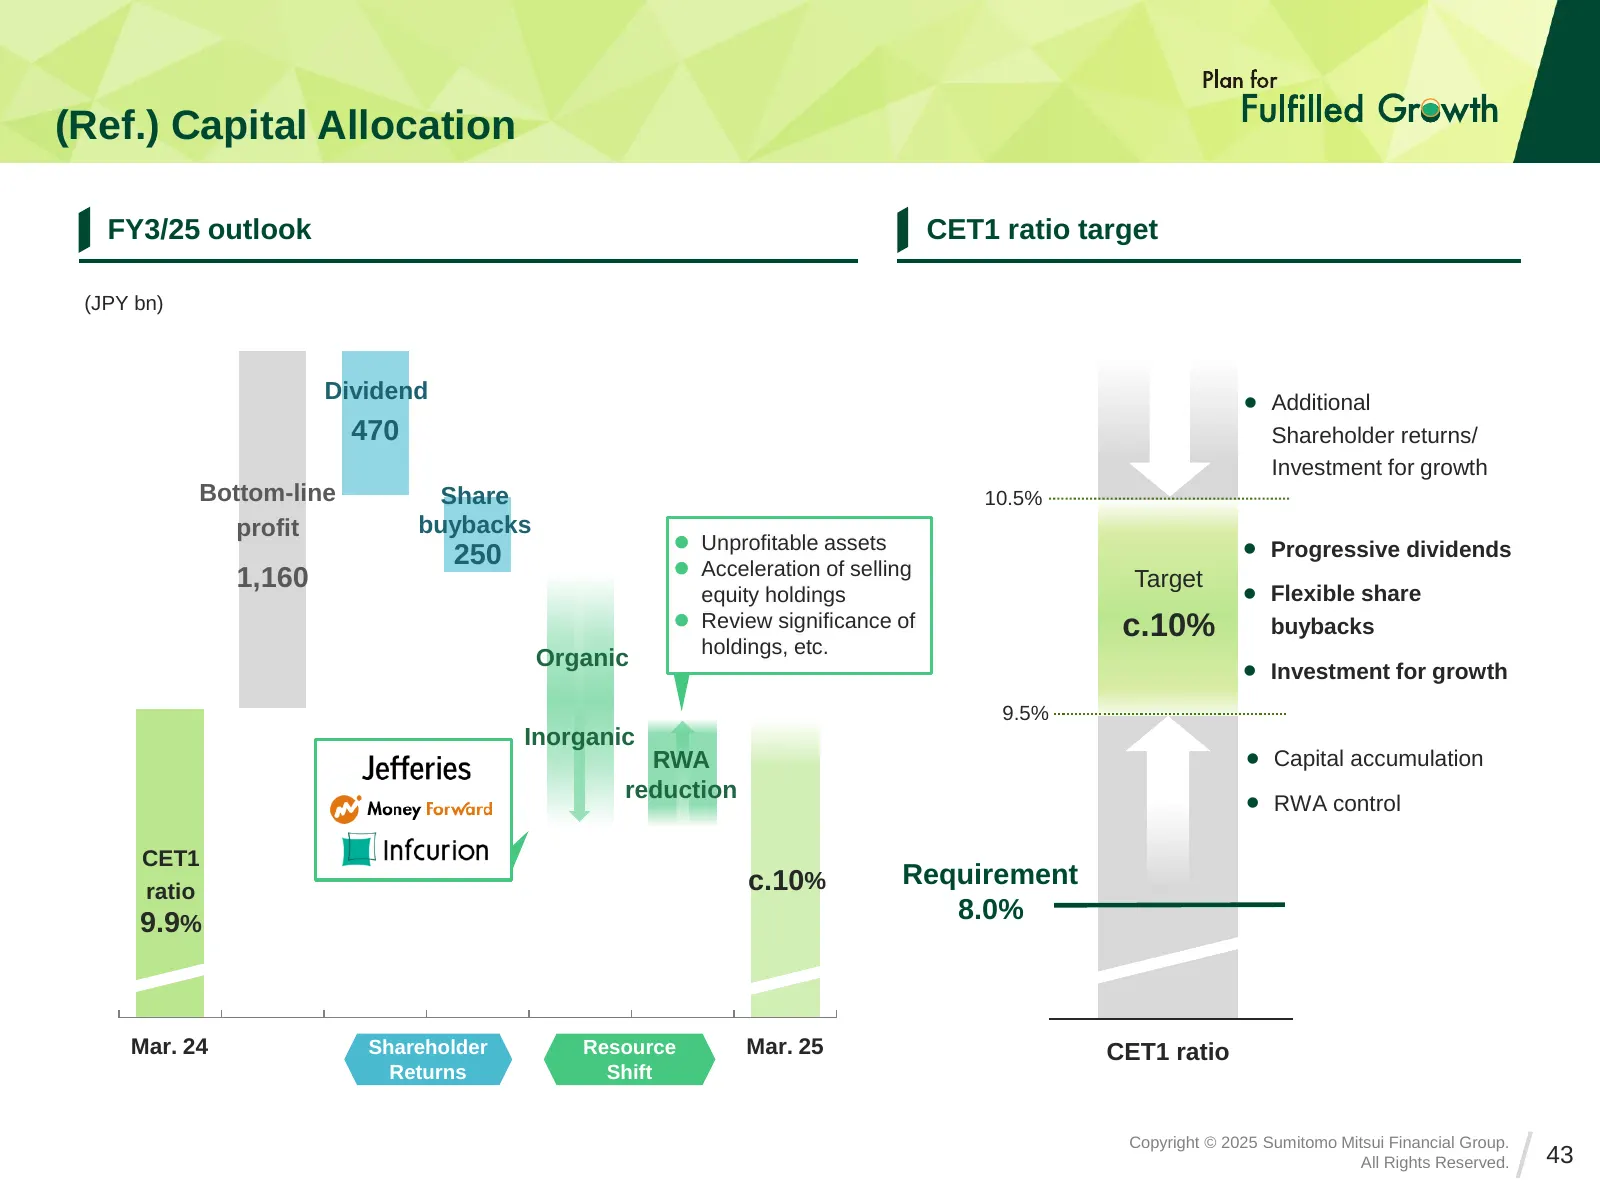
Slide 43: (Ref.) Capital Allocation
(Ref.) Capital Allocation FY3/25 outlook CET1 ratio target ンシ ョロピ度 ールキ年 ケ タ の 23 アャ (JPY bn) Dividend ⚫ Additional 470 Shareholder returns/ Investment for growth Bottom-line Share 10.5% profit buybacks ⚫ Unprofitable assets ⚫ Progressive dividends 250 ⚫ Acceleration of selling 1,160 Target ⚫ equity
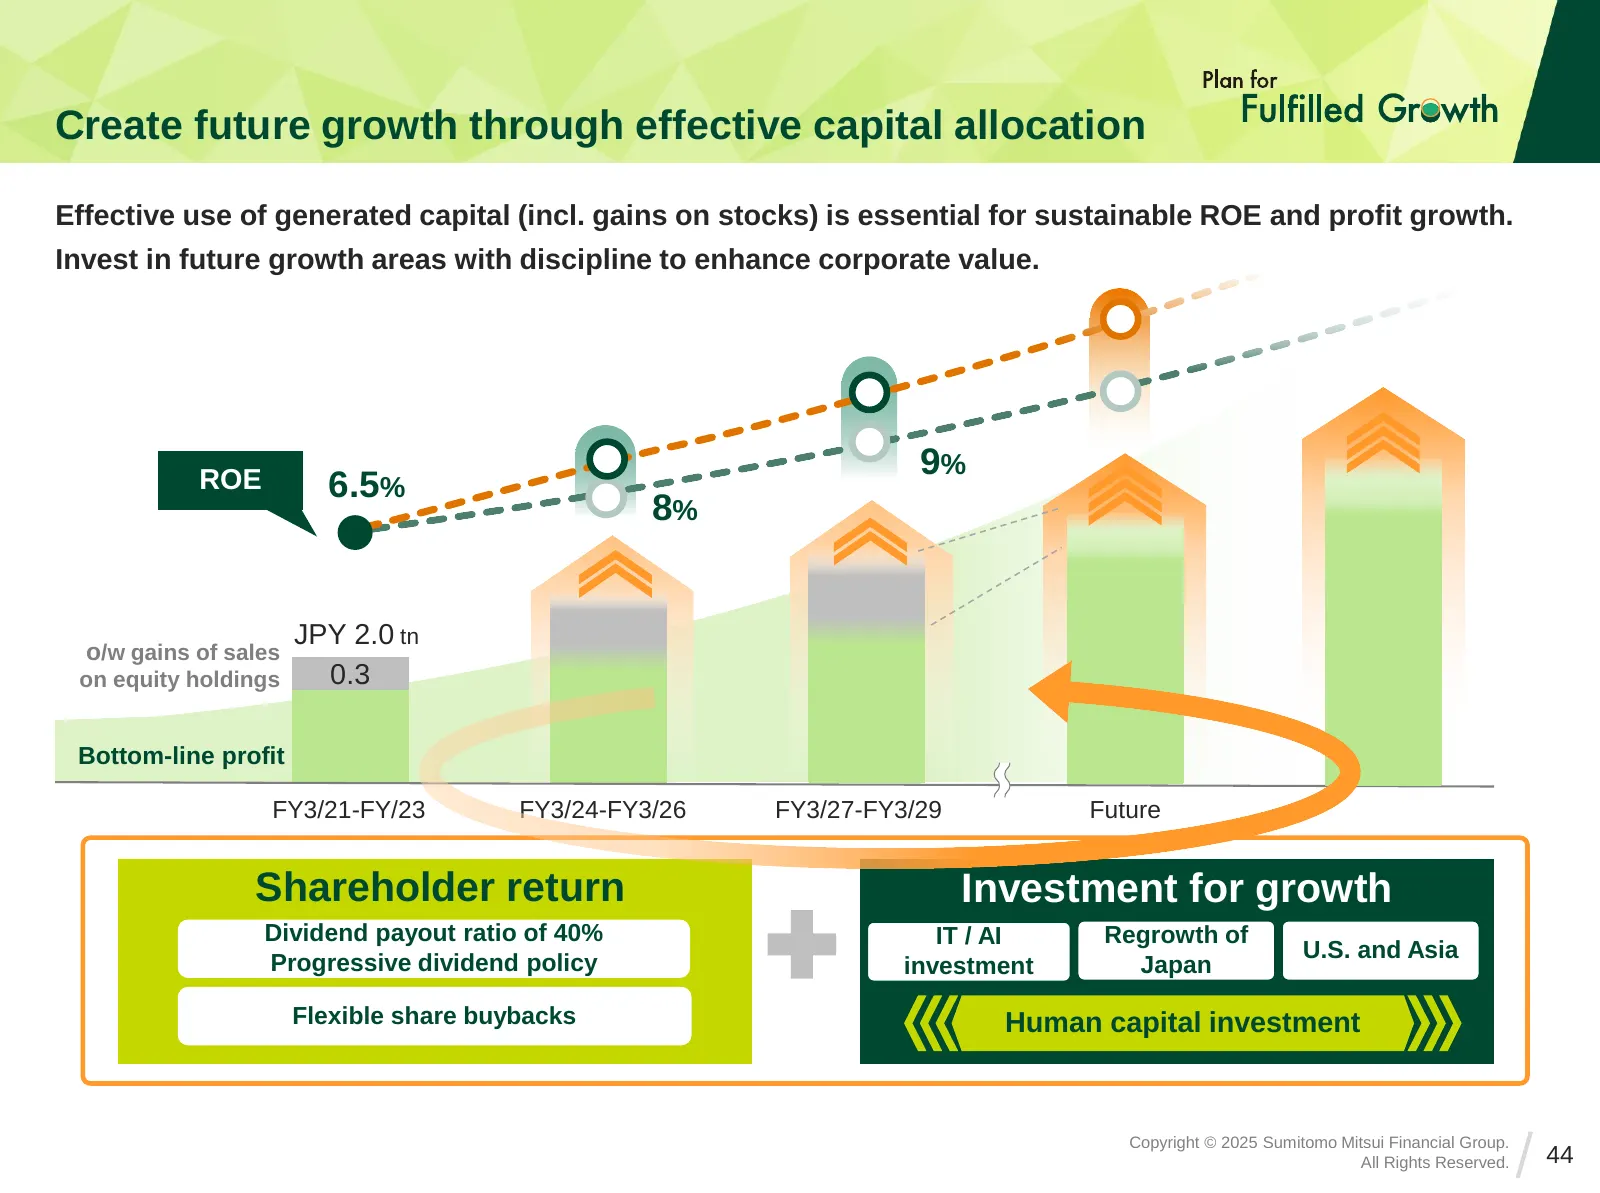
Slide 44: Create future growth through effective capital allocation
Create future growth through effective capital allocation Effective use of generated capital (incl. gains on stocks) is essential for sustainable ROE and profit growth. Invest in future growth areas with discipline to enhance corporate value. ROE 9% 6.5% 8% JPY 2.0 tn o/w gains of sales on equity ho
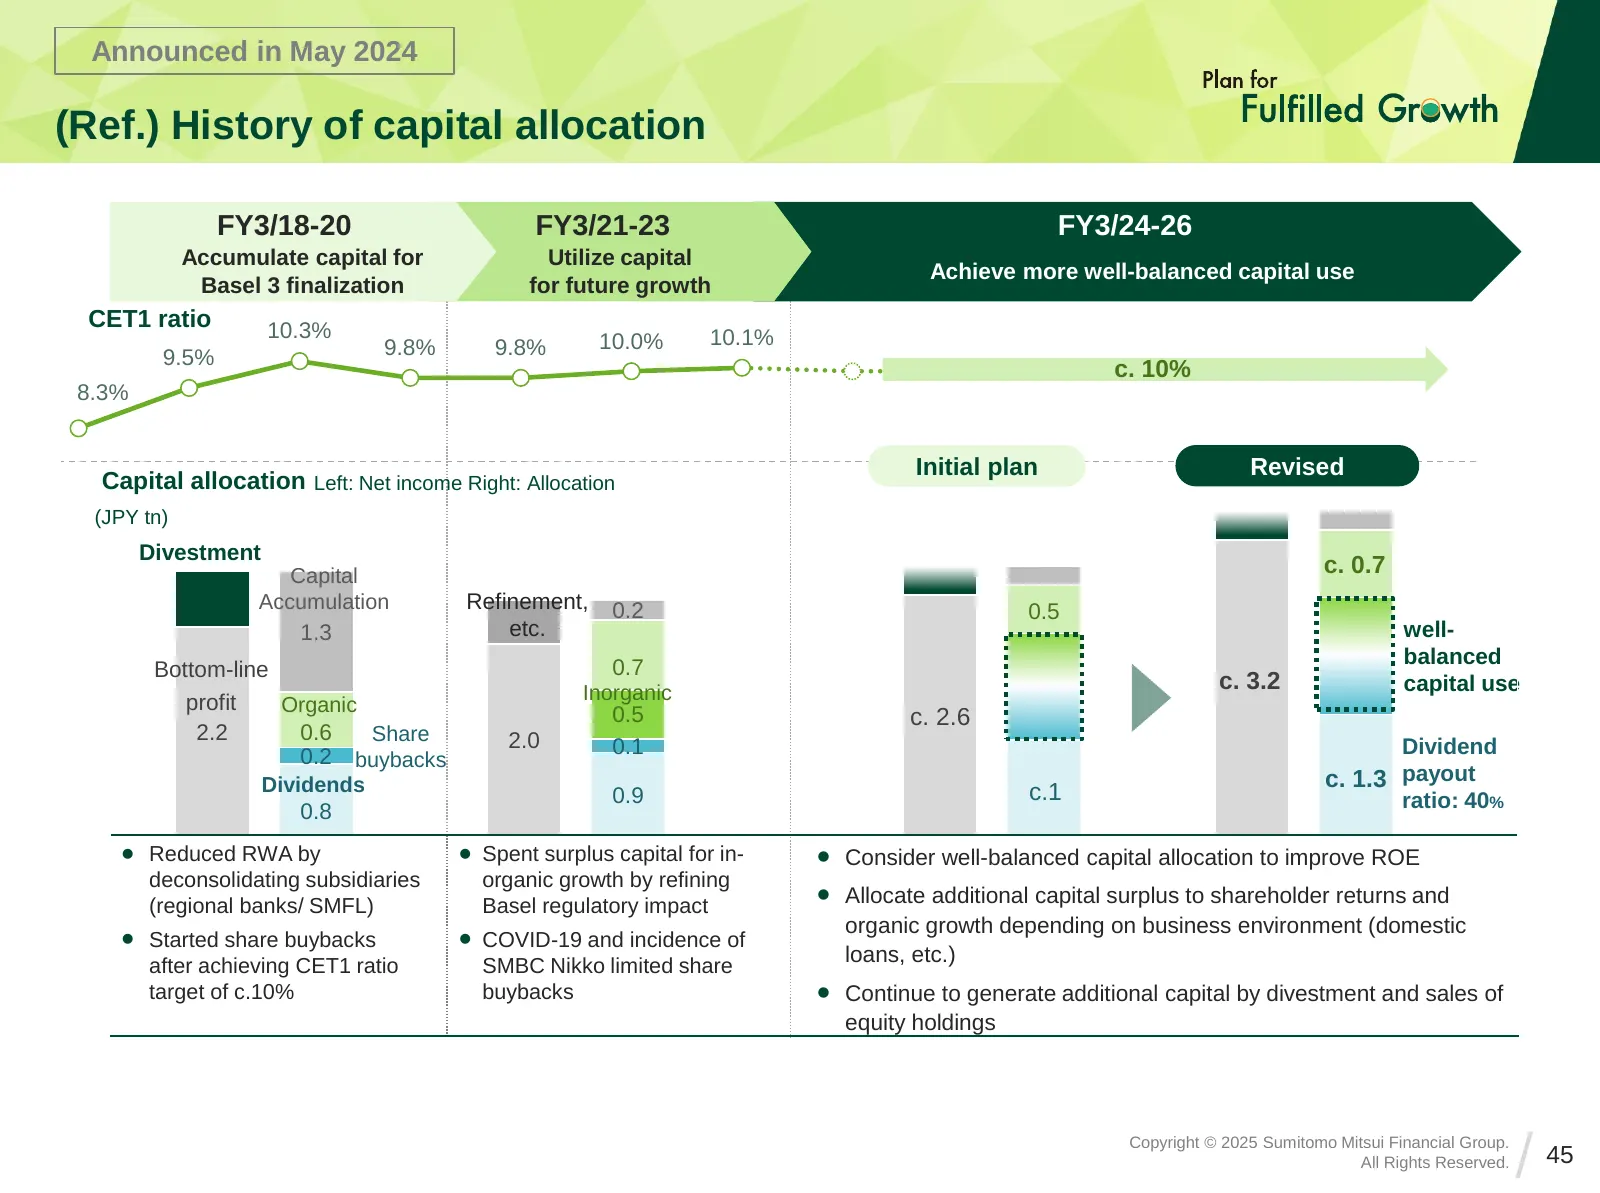
Slide 45: (Ref.) History of capital allocation
Announced in May 2024 (Ref.) History of capital allocation FY3/18-20 FY3/21-23 FY3/24-26 Accumulate capital for Utilize capital Achieve more well-balanced capital use Basel 3 finalization for future growth CET1 ratio 10.3% 100 % 9.8% 9.8% 10.0% 10.1% 11.0% 9.5% 90% 10.5% c. 10% 80% 10.0% 70% 8.3% 9.
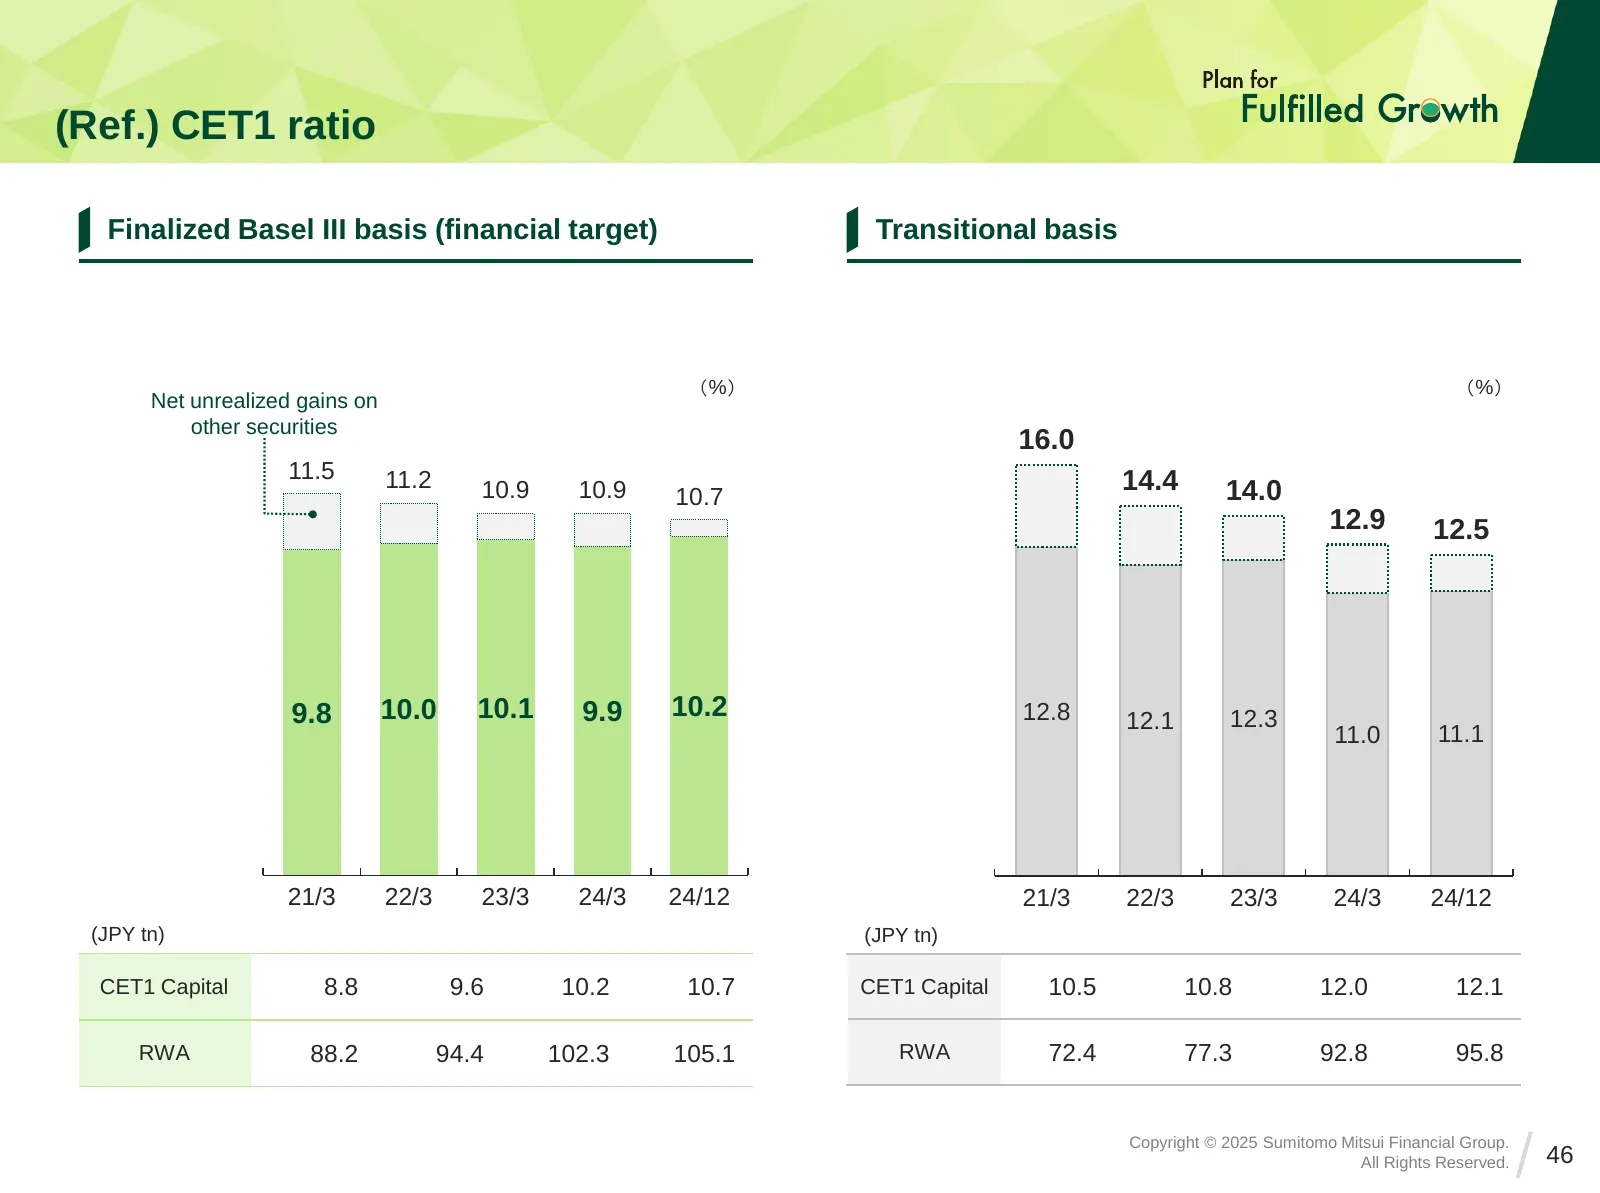
Slide 46: (Ref.) CET1 ratio
(Ref.) CET1 ratio Finalized Basel III basis (financial target) Transitional basis 準規 基行 制 現 (%) (%) Net unrealized gains on other securities 16.0 11.5 11.2 14.4 10.9 10.9 10.7 14.0 12.9 12.5 9.8 10.0 10.1 9.9 10.2 12.8 12.1 12.3 11.0 11.1 21/3 22/3 23/3 24/3 24/12 21/3 22/3 23/3 24/3 24/12 (JPY tn)

Slide 47: Appendix
Appendix
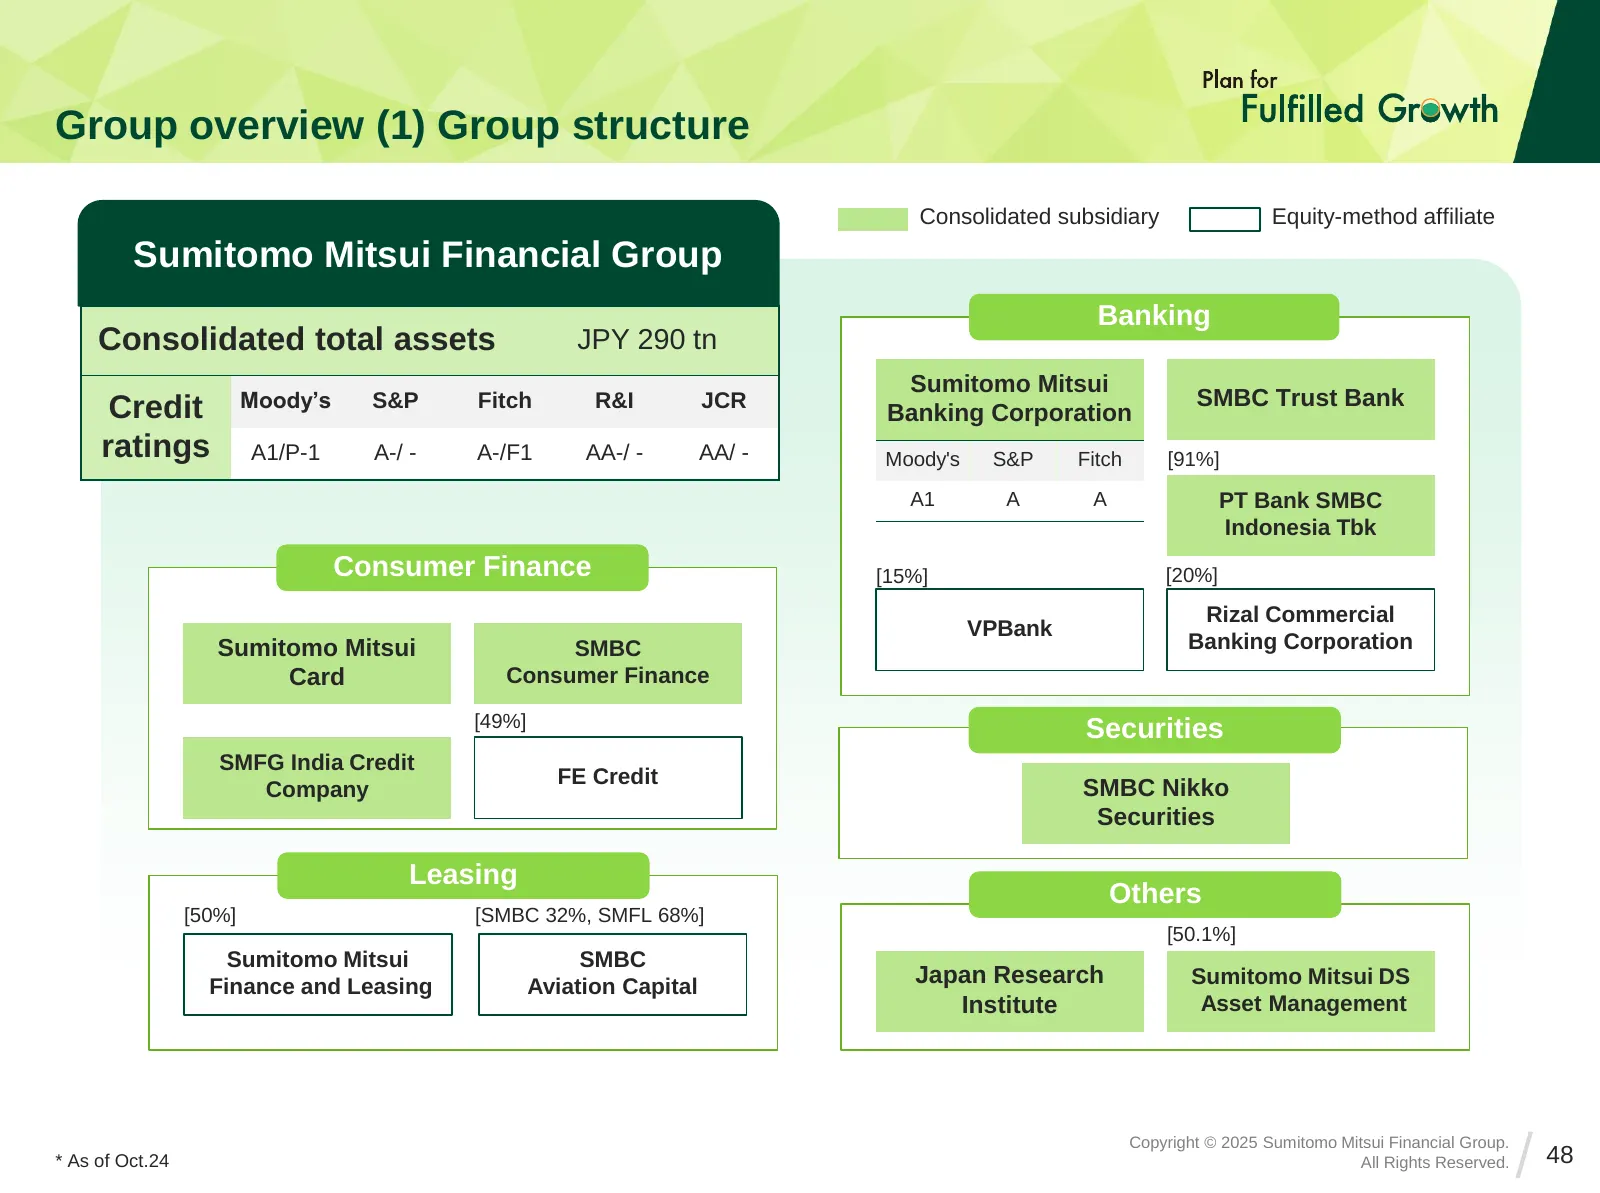
Slide 48: Group overview (1) Group structure
Group overview (1) Group structure Consolidated subsidiary Equity-method affiliate Sumitomo Mitsui Financial Group Banking Consolidated total assets JPY 290 tn Sumitomo Mitsui Credit Moody’s S&P Fitch R&I JCR SMBC Trust Bank Banking Corporation ratings A1/P-1 A-/ - A-/F1 AA-/ - AA/ - Moody's S&P Fit
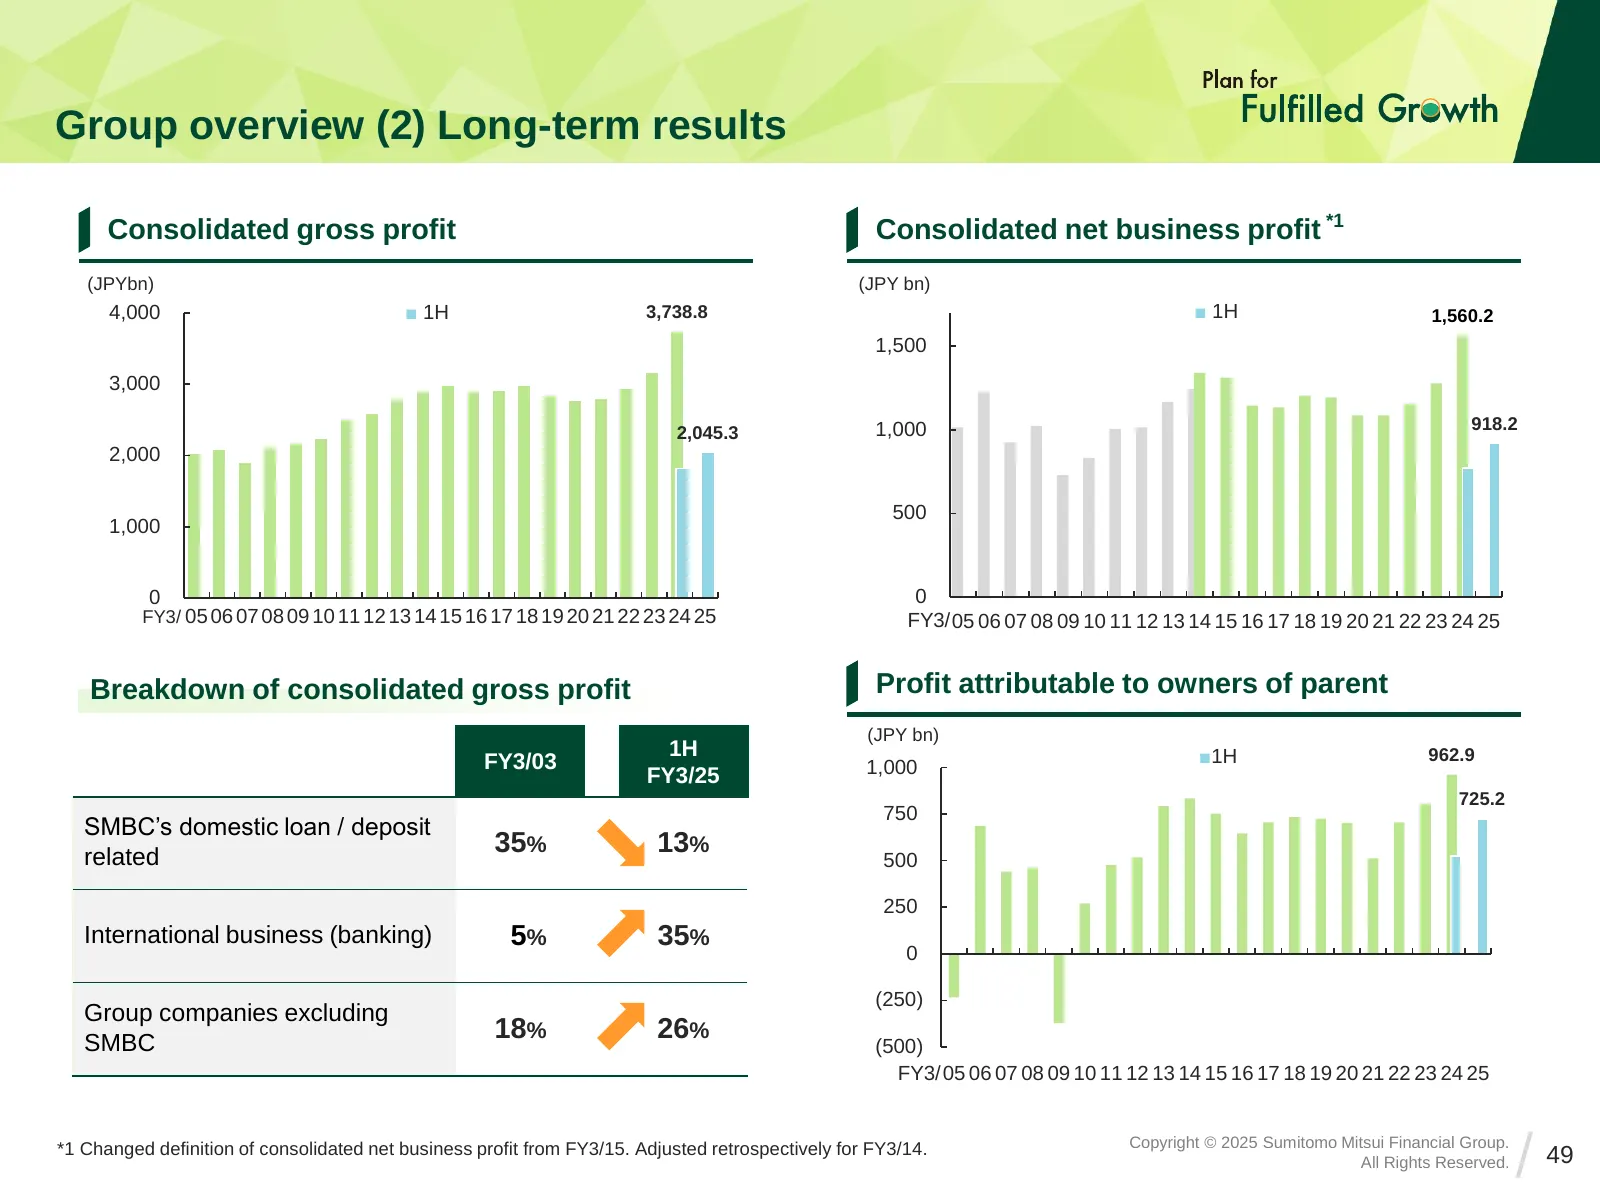
Slide 49: Group overview (2) Long-term results
Group overview (2) Long-term results Consolidated gross profit Consolidated net business profit *1 (JPYbn) (JPY bn) 4,000 ■ 1H 3,738.8 ■ 1H 1,560.2 1,500 3,000 2,045.3 1,000 918.2 2,000 500 1,000 0 0 FY3/ 05 06 07 08 09 10 11 12 13 14 15 16 17 18 19 20 21 22 23 24 25 FY3/ 05 06 07 08 09 10 11 12 13
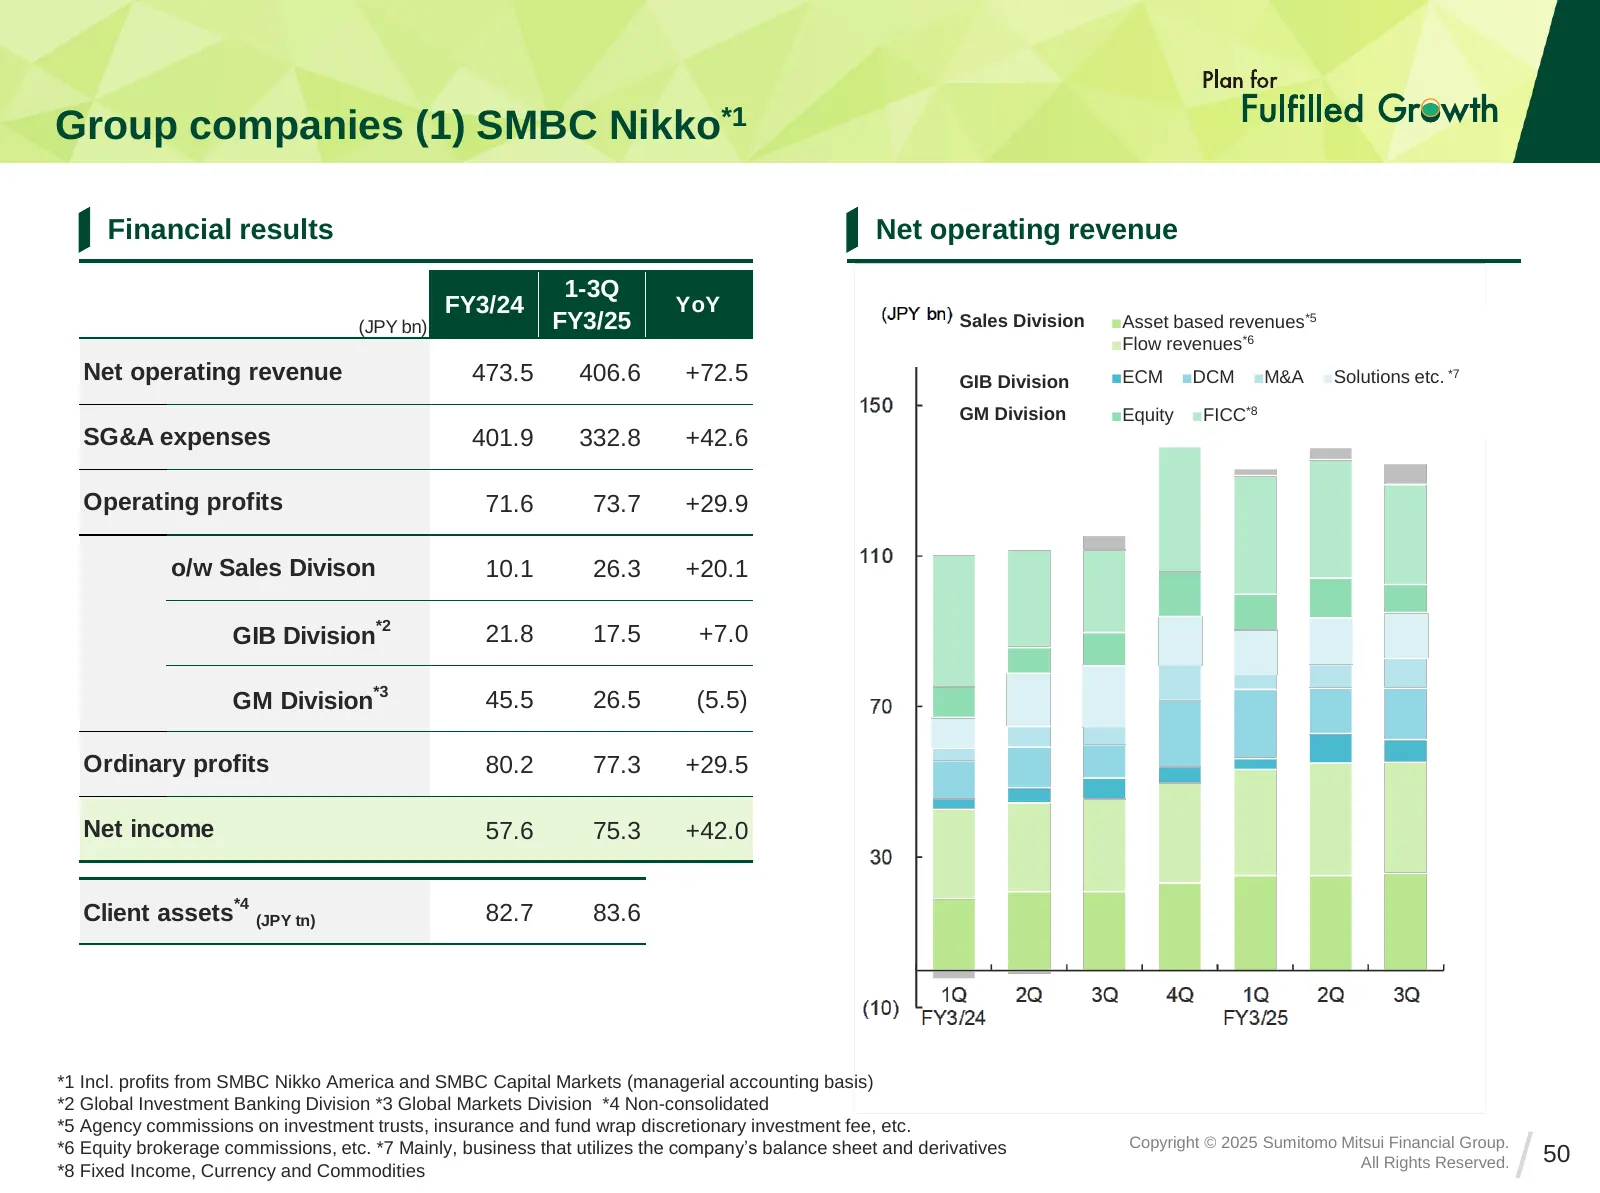
Slide 50: Group companies (1) SMBC Nikko
Group companies (1) SMBC Nikko*1 Financial results Net operating revenue 1-3Q FY3/24 YoY (JPY bn) FY3/25 Sales Division ■Asset based revenues*5 ■Flow revenues*6 Net operating revenue 473.5 406.6 +72.5 GIB Division ■ECM ■DCM ■M&A ■Solutions etc. *7 GM Division ■Equity ■FICC*8 SG&A expenses 401.9 332.
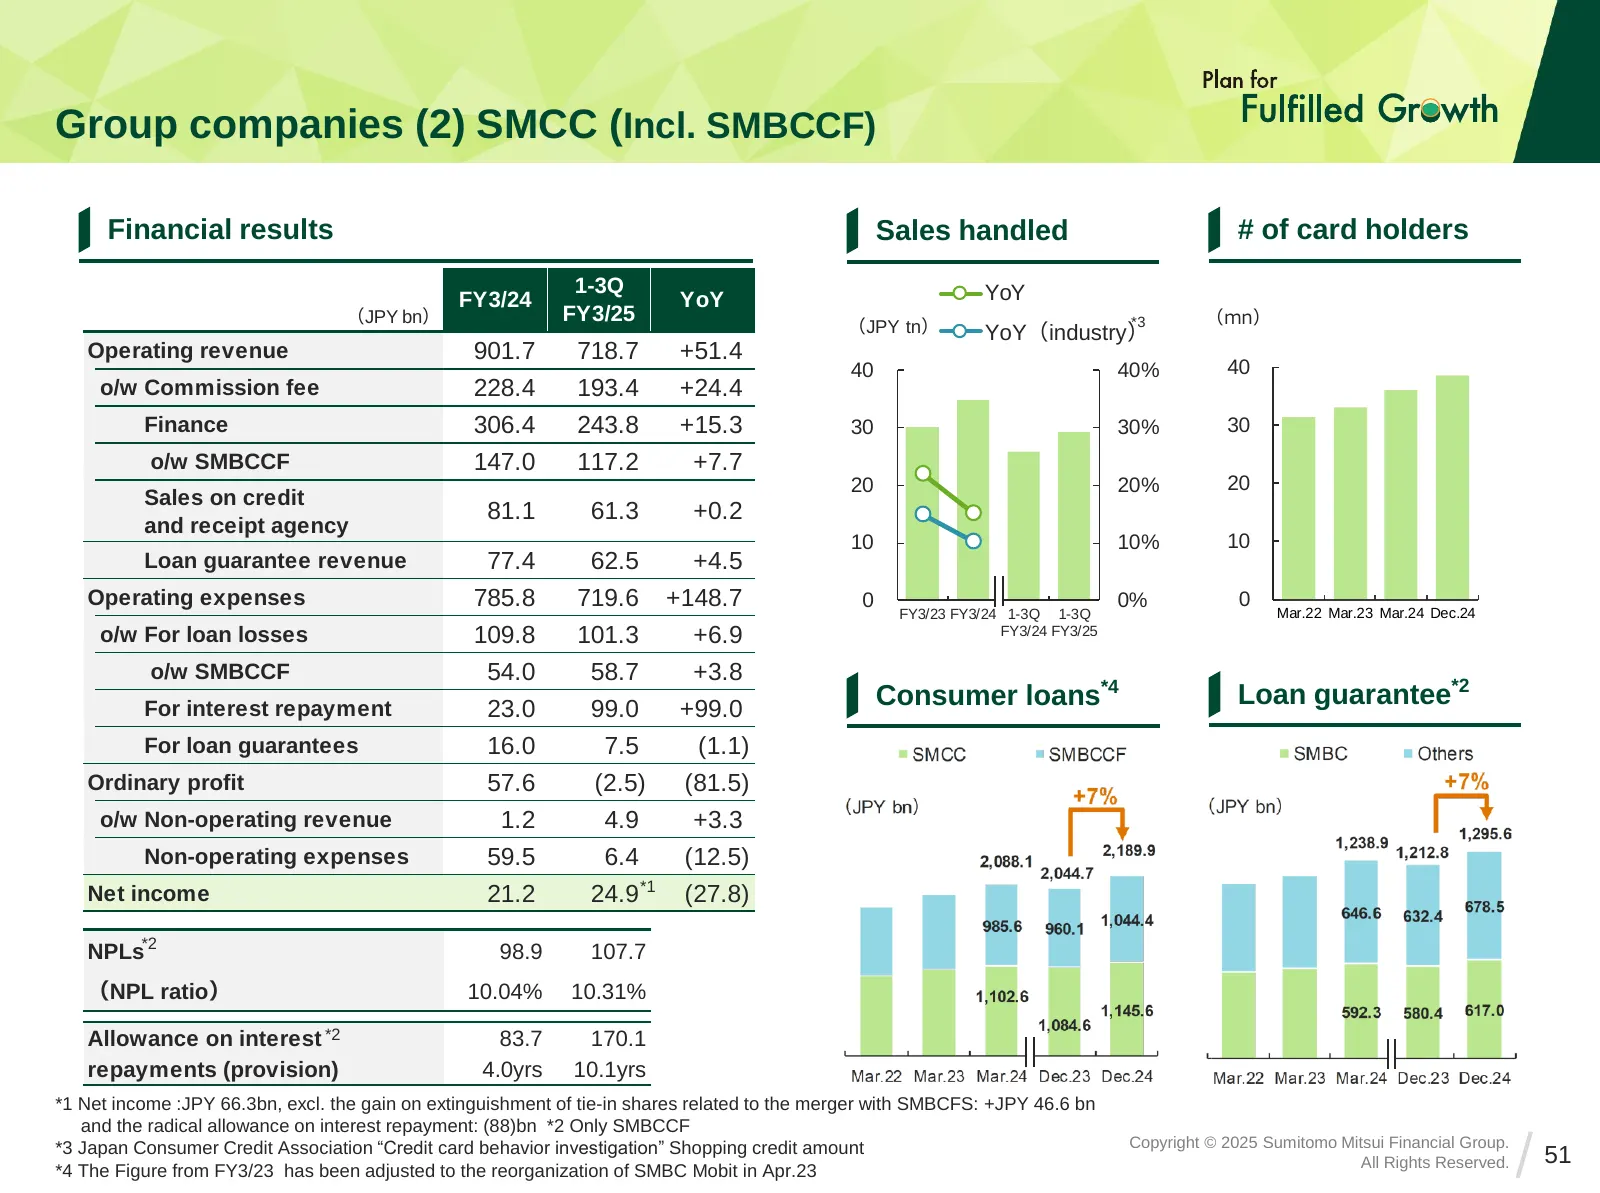
Slide 51: Group companies (2) SMCC (Incl. SMBCCF)
Group companies (2) SMCC (Incl. SMBCCF) Financial results Sales handled # of card holders 1-3Q YoY FY3/24 YoY (JPY bn) FY3/25 (mn) (JPY tn) YoY(industry) *3 Operating revenue 901.7 718.7 +51.4 40 40% 40 o/w Commission fee 228.4 193.4 +24.4 o/w Finance 306.4 243.8 +15.3 30 30% 30 o/w o/w SMBCCF 147.0
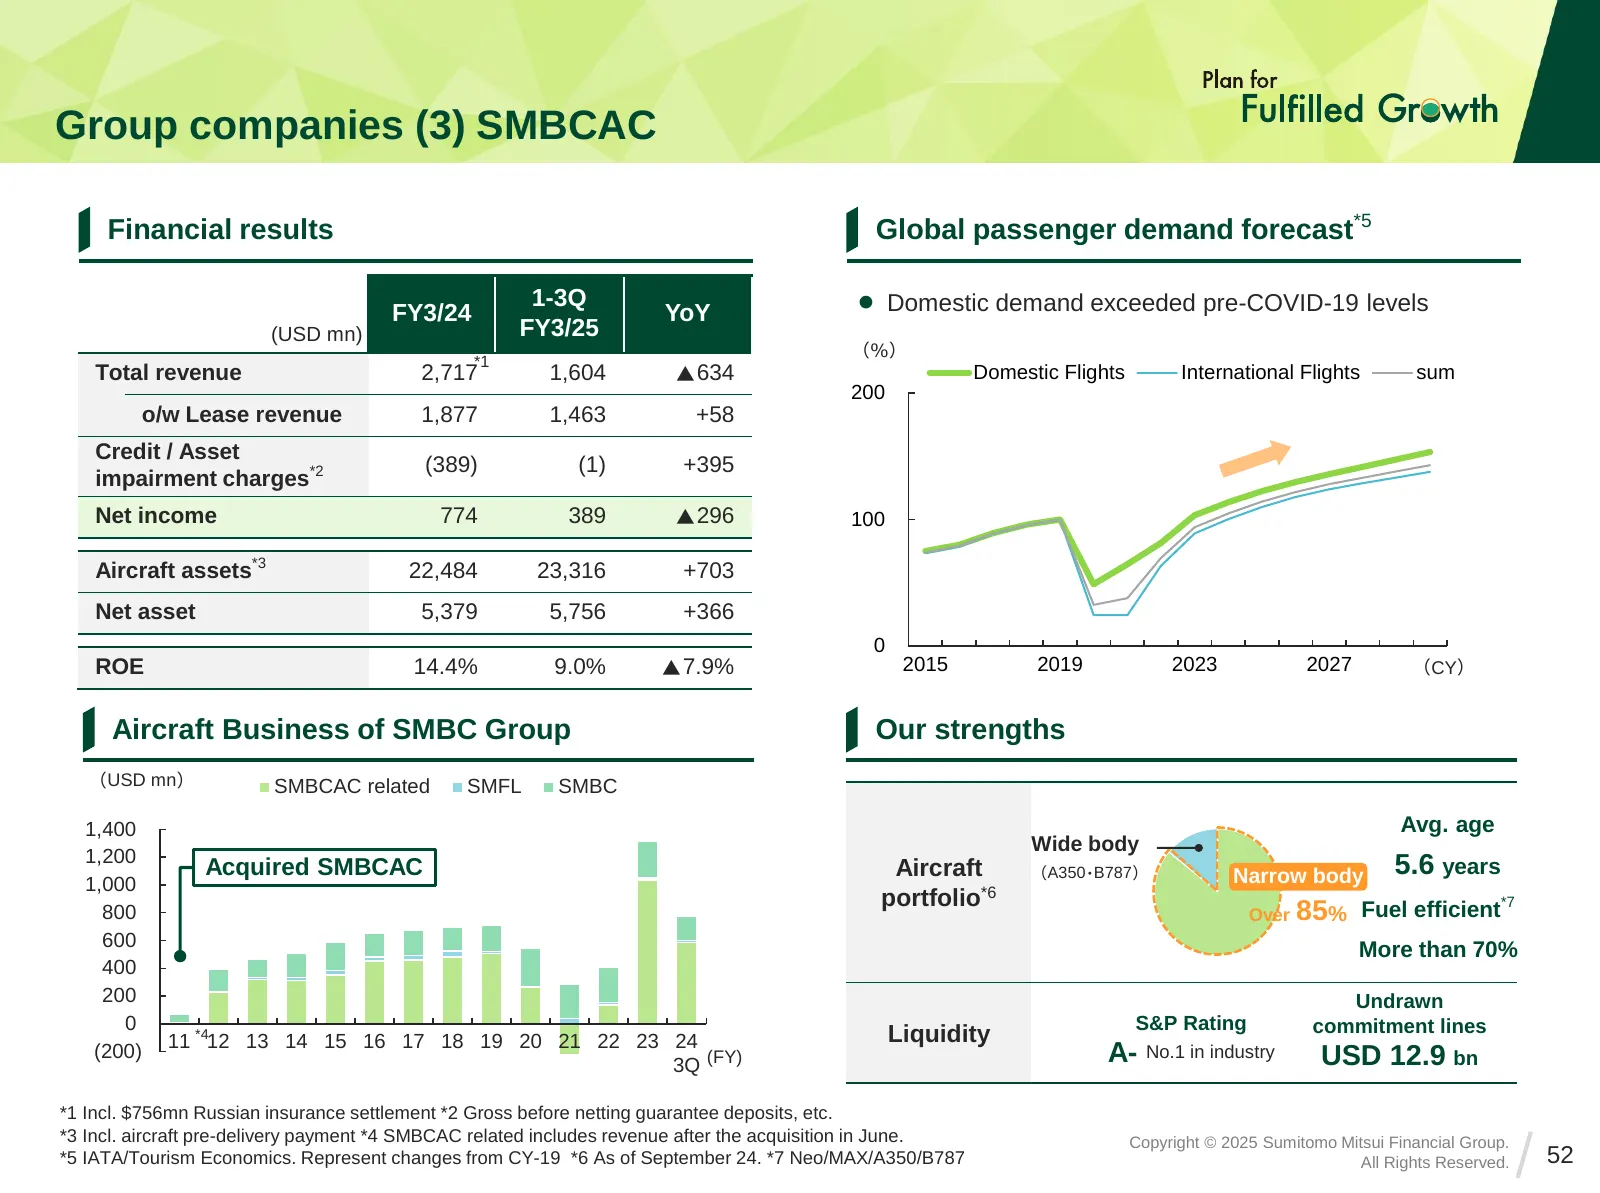
Slide 52: Group companies (3) SMBCAC
Group companies (3) SMBCAC Financial results Global passenger demand forecast*5 1-3Q ⚫ Domestic demand exceeded pre-COVID-19 levels FY3/24 YoY (USD mn) FY3/25 (%) *1 Total revenue 2,717 1,604 ▲634 Domestic Flights International Flights sum 200 o/w Lease revenue 1,877 1,463 +58 Credit / Asset (389) (
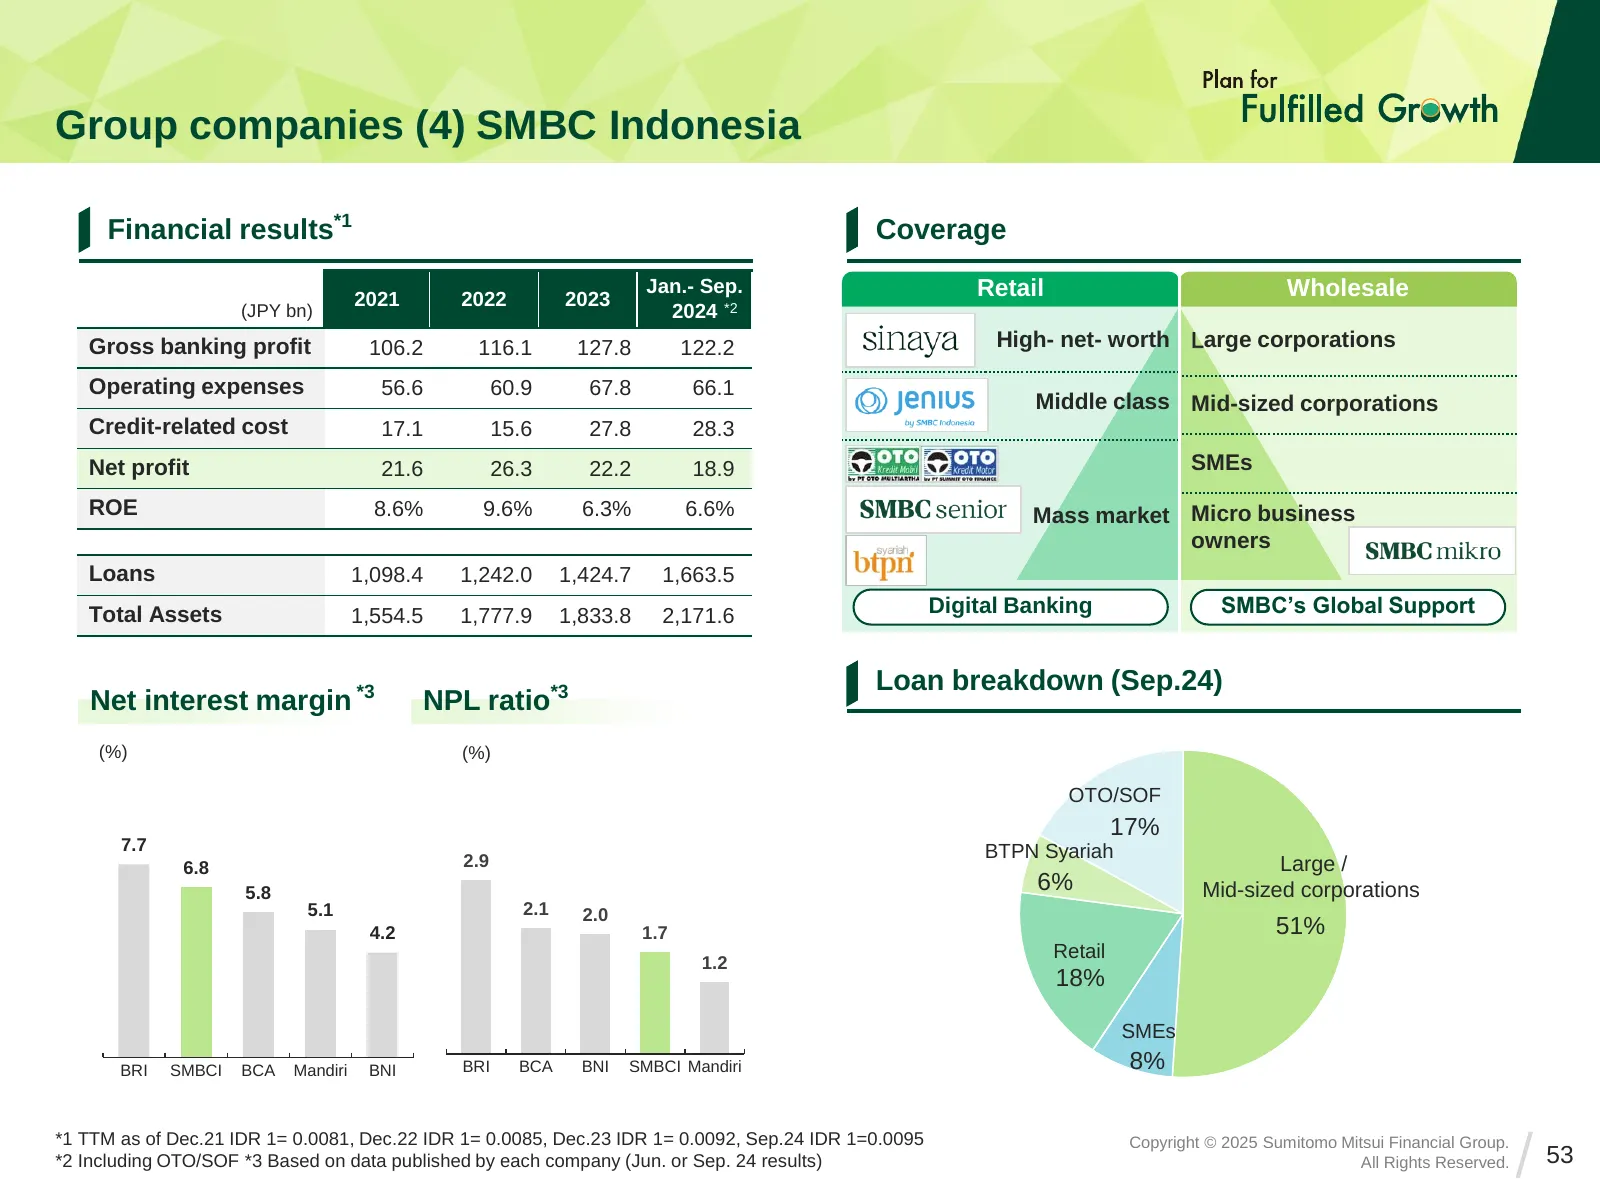
Slide 53: Group companies (4) SMBC Indonesia
Group companies (4) SMBC Indonesia Financial results*1 Coverage Jan.- Sep. Retail Wholesale 2021 2022 2023 (JPY bn) 2024 *2 Gross banking profit 106.2 116.1 127.8 122.2 High- net- worth Large corporations Operating expenses 56.6 60.9 67.8 66.1 Middle class Mid-sized corporations Credit-related cost
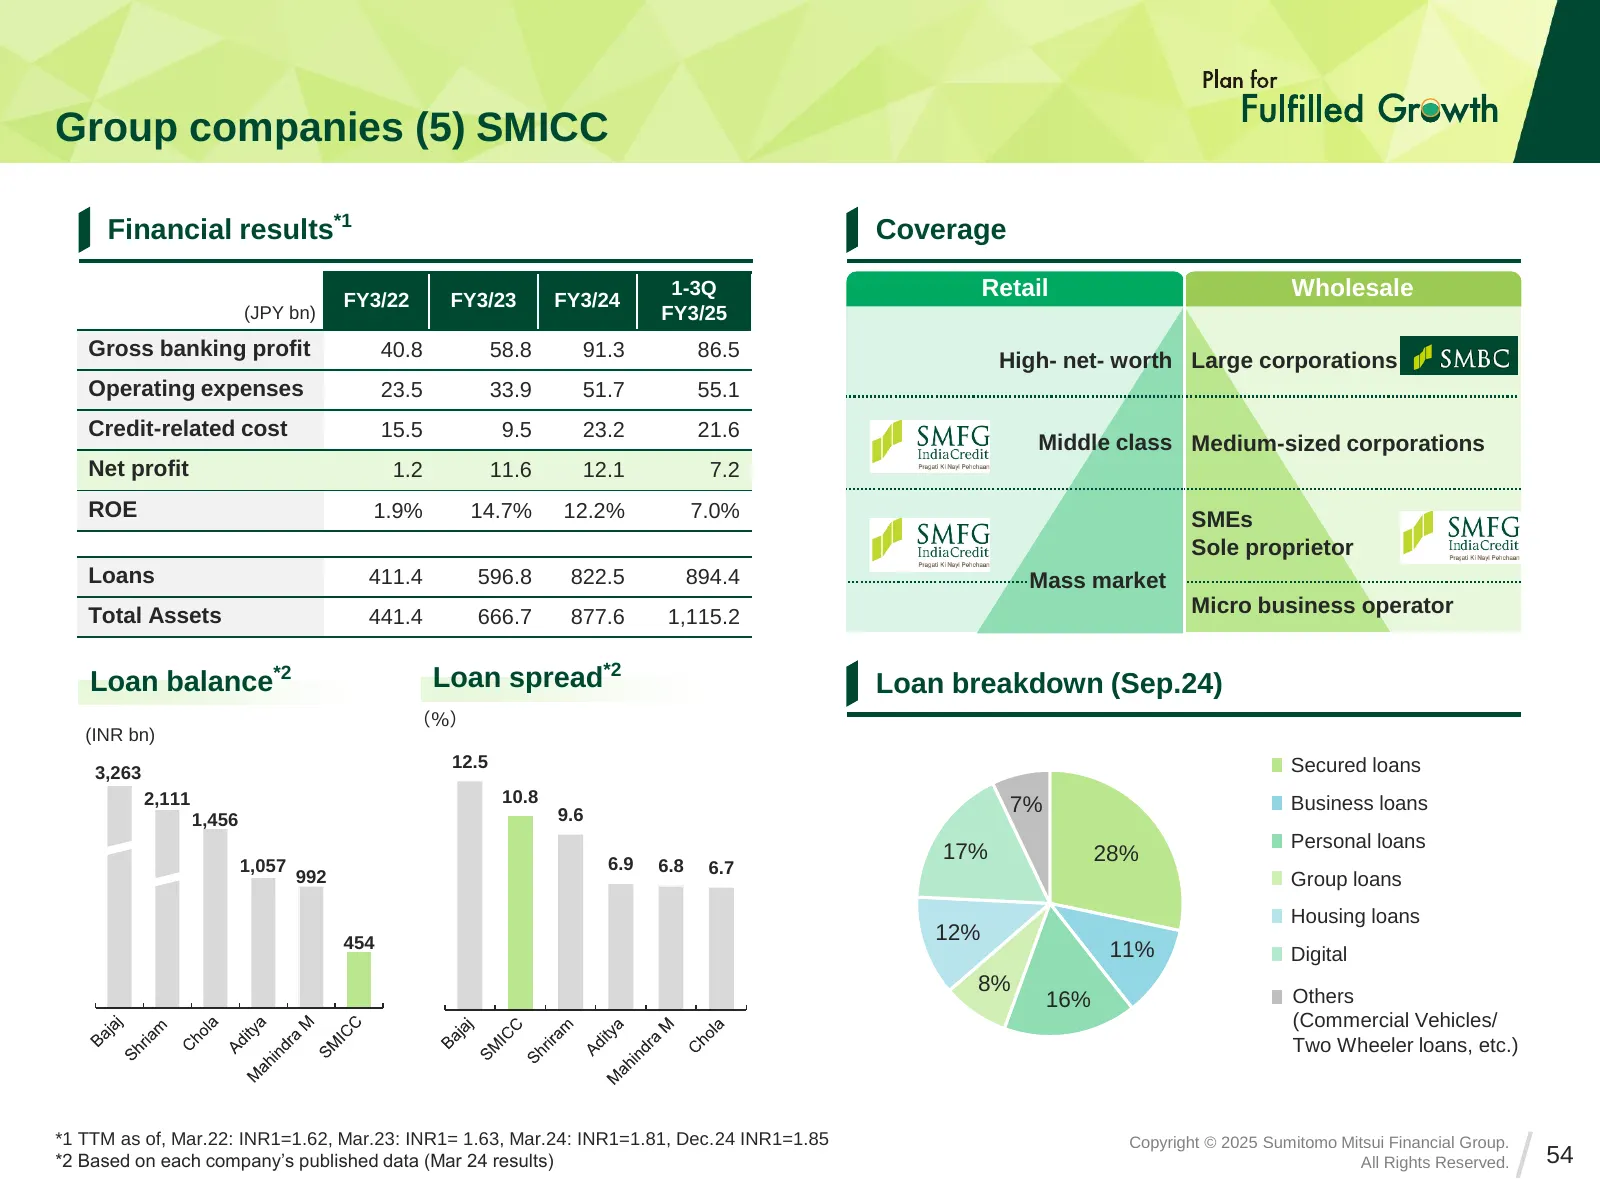
Slide 54: Group companies (5) SMICC
Group companies (5) SMICC Financial results*1 Coverage FY3/22 FY3/23 FY3/24 1-3Q Retail Wholesale (JPY bn) FY3/25 Gross banking profit 40.8 58.8 91.3 86.5 High- net- worth Large corporations Operating expenses 23.5 33.9 51.7 55.1 Credit-related cost 15.5 9.5 23.2 21.6 Middle class Medium-sized corpo
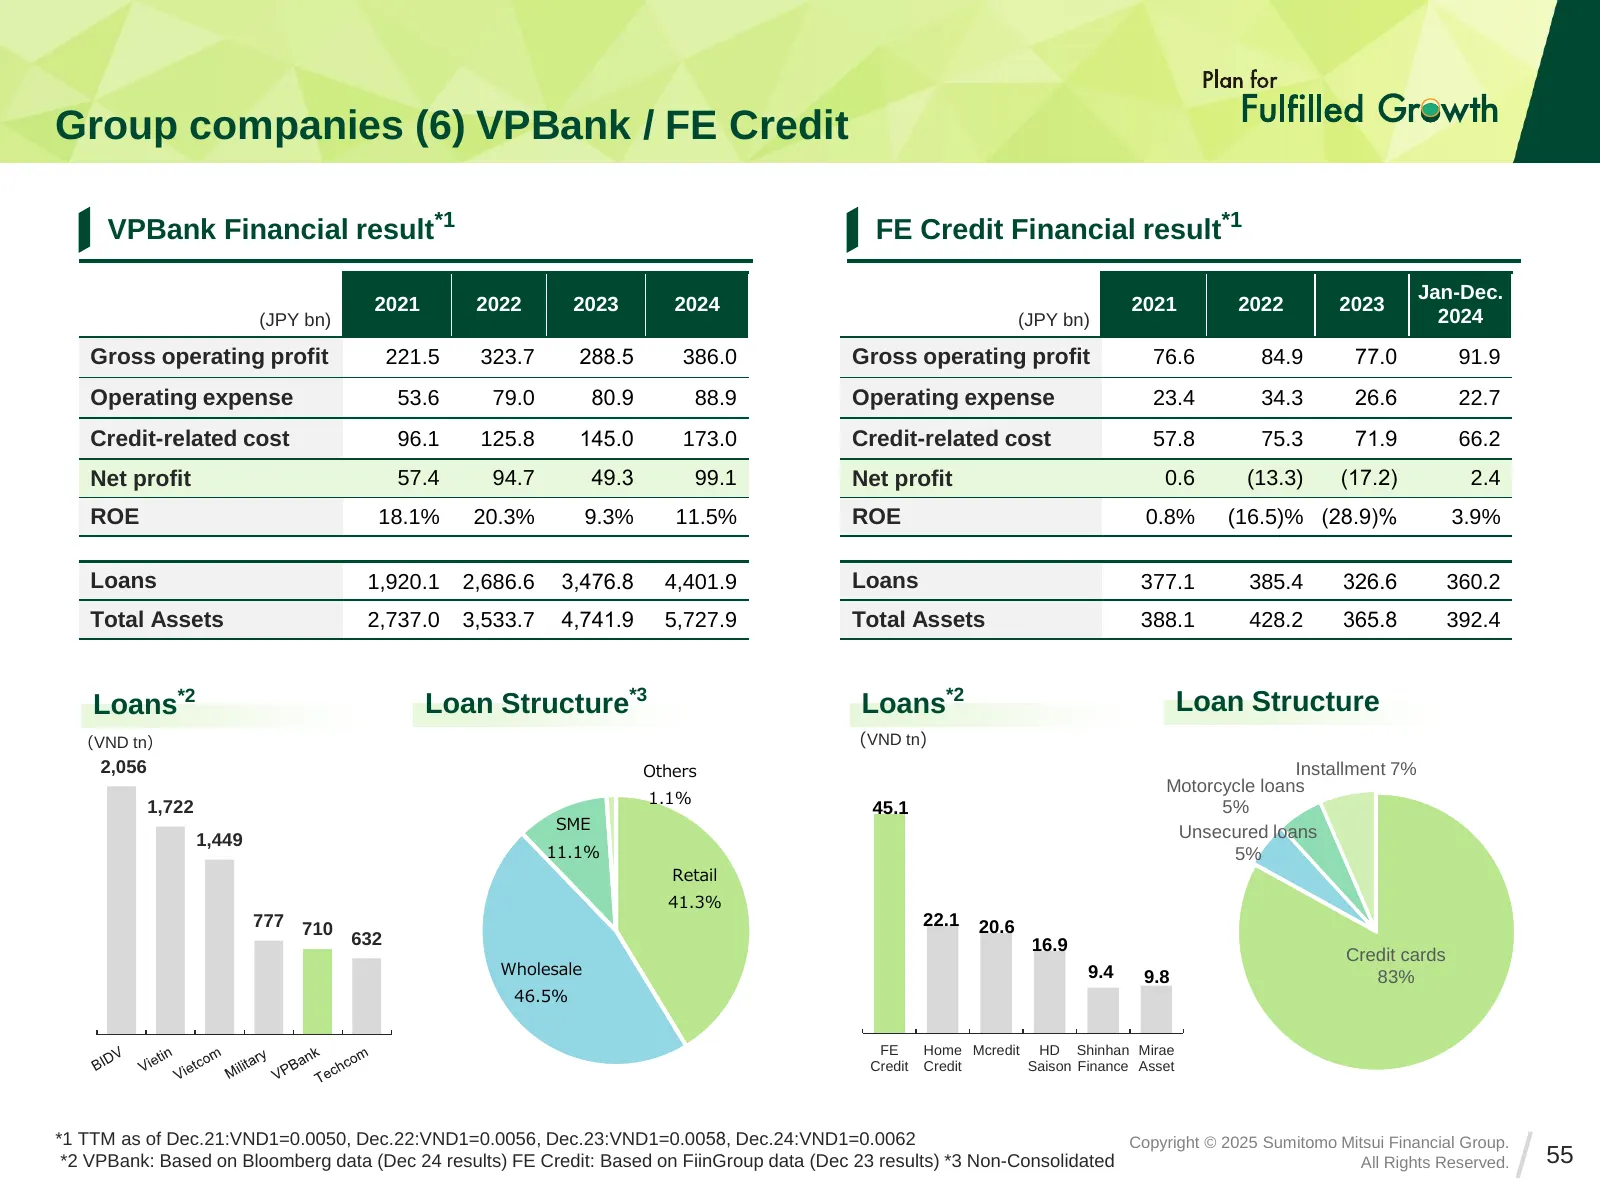
Slide 55: Group companies (6) VPBank / FE Credit
Group companies (6) VPBank / FE Credit VPBank Financial result*1 FE Credit Financial result*1 Jan-Dec. 2021 2022 2023 2024 2021 2022 2023 (JPY bn) (JPY bn) 2024 Gross operating profit 221.5 323.7 288.5 386.0 Gross operating profit 76.6 84.9 77.0 91.9 Operating expense 53.6 79.0 80.9 88.9 Operating e
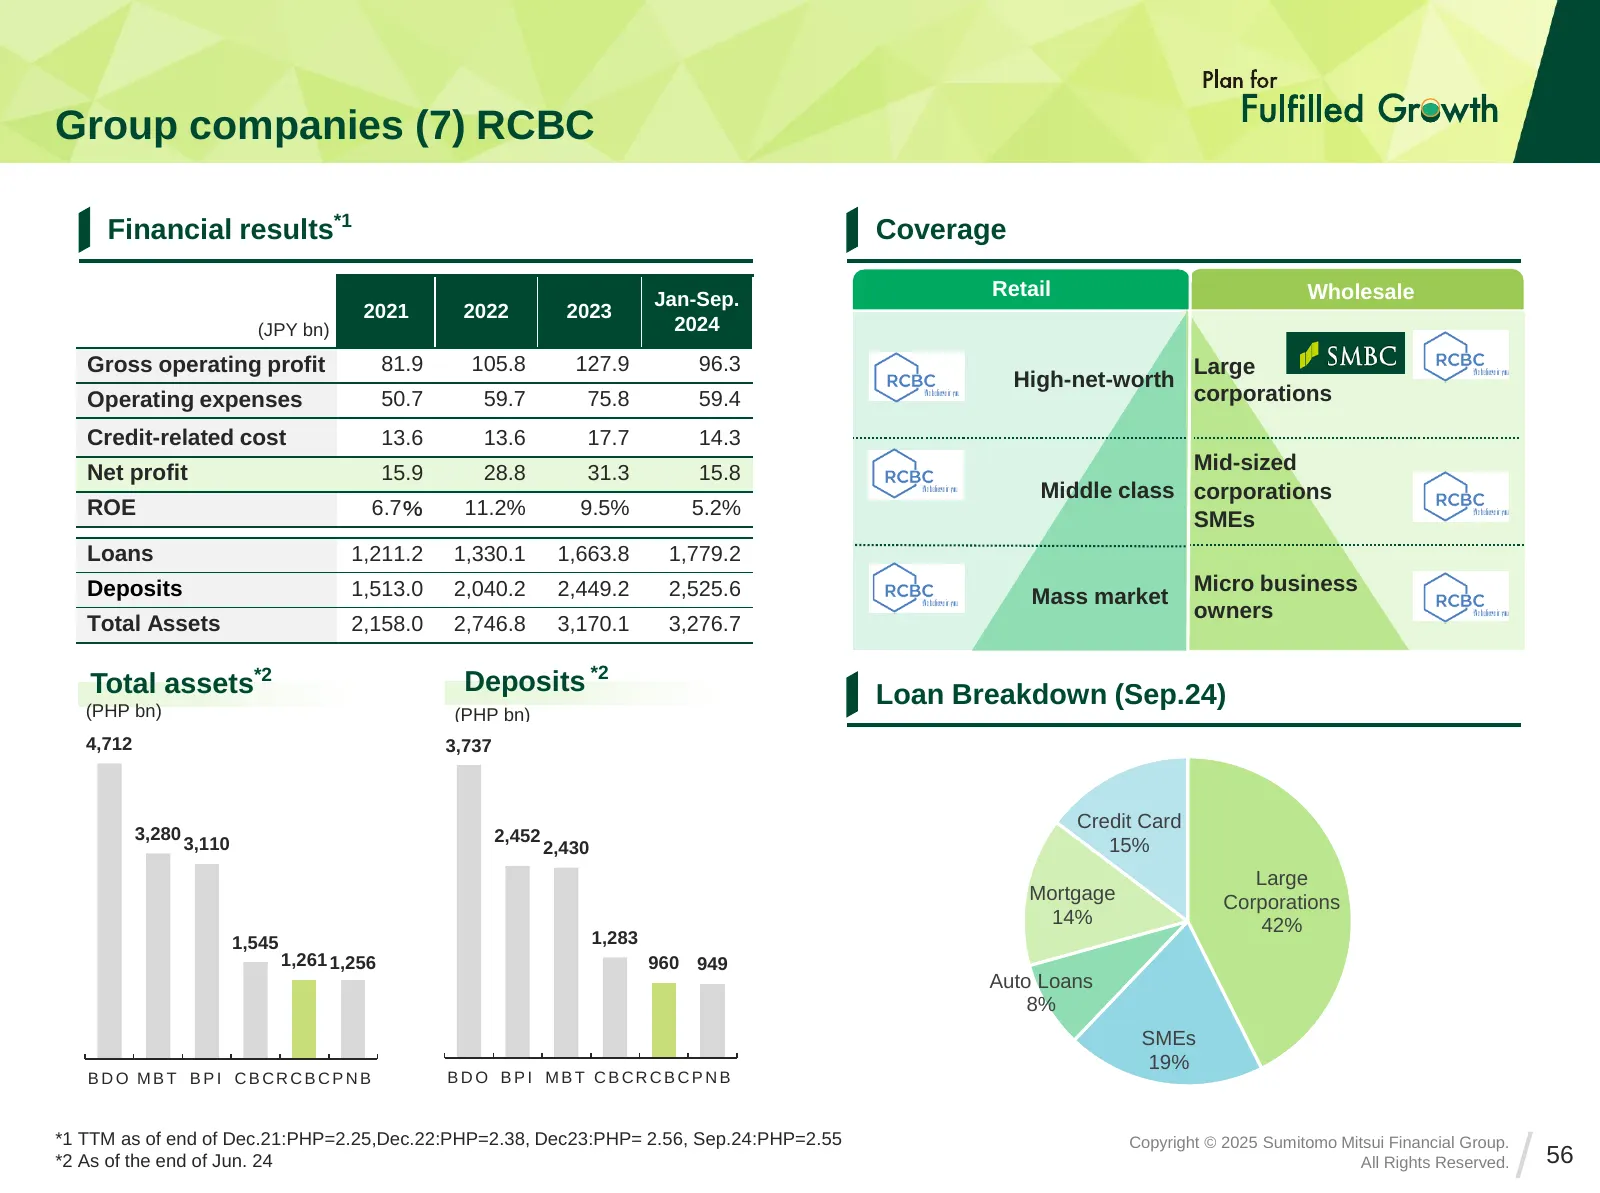
Slide 56: Group companies (7) RCBC
Group companies (7) RCBC Financial results*1 Coverage Jan-Sep. Retail Wholesale 2021 2022 2023 (JPY bn) 2024 Gross operating profit 81.9 105.8 127.9 96.3 Large High-net-worth Operating expenses 50.7 59.7 75.8 59.4 corporations Credit-related cost 13.6 13.6 17.7 14.3 Net profit 15.9 28.8 31.3 15.8 Mi
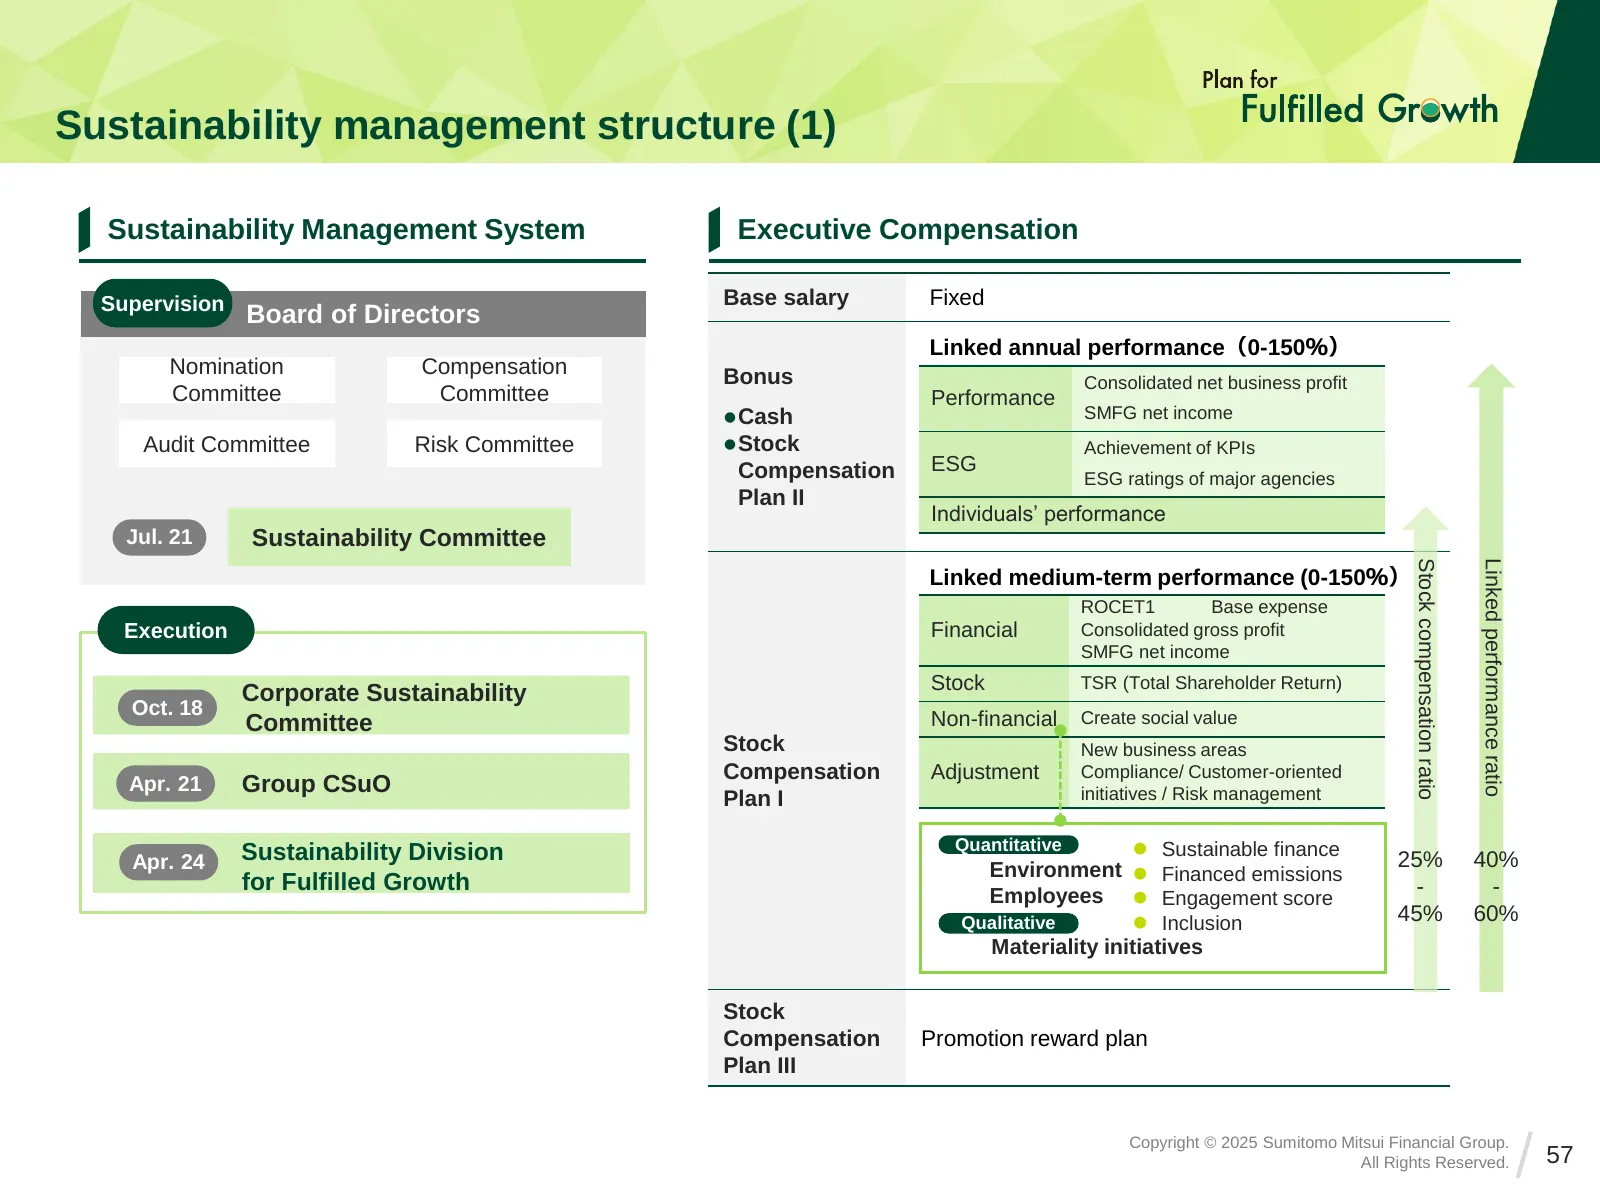
Slide 57: Sustainability management structure (1)
Sustainability management structure (1) Sustainability Management System Executive Compensation Supervision Base salary Fixed Board of Directors Linked annual performance(0-150%) Nomination Compensation Bonus Consolidated net business profit Committee Committee Performance ⚫ Cash SMFG net income Aud
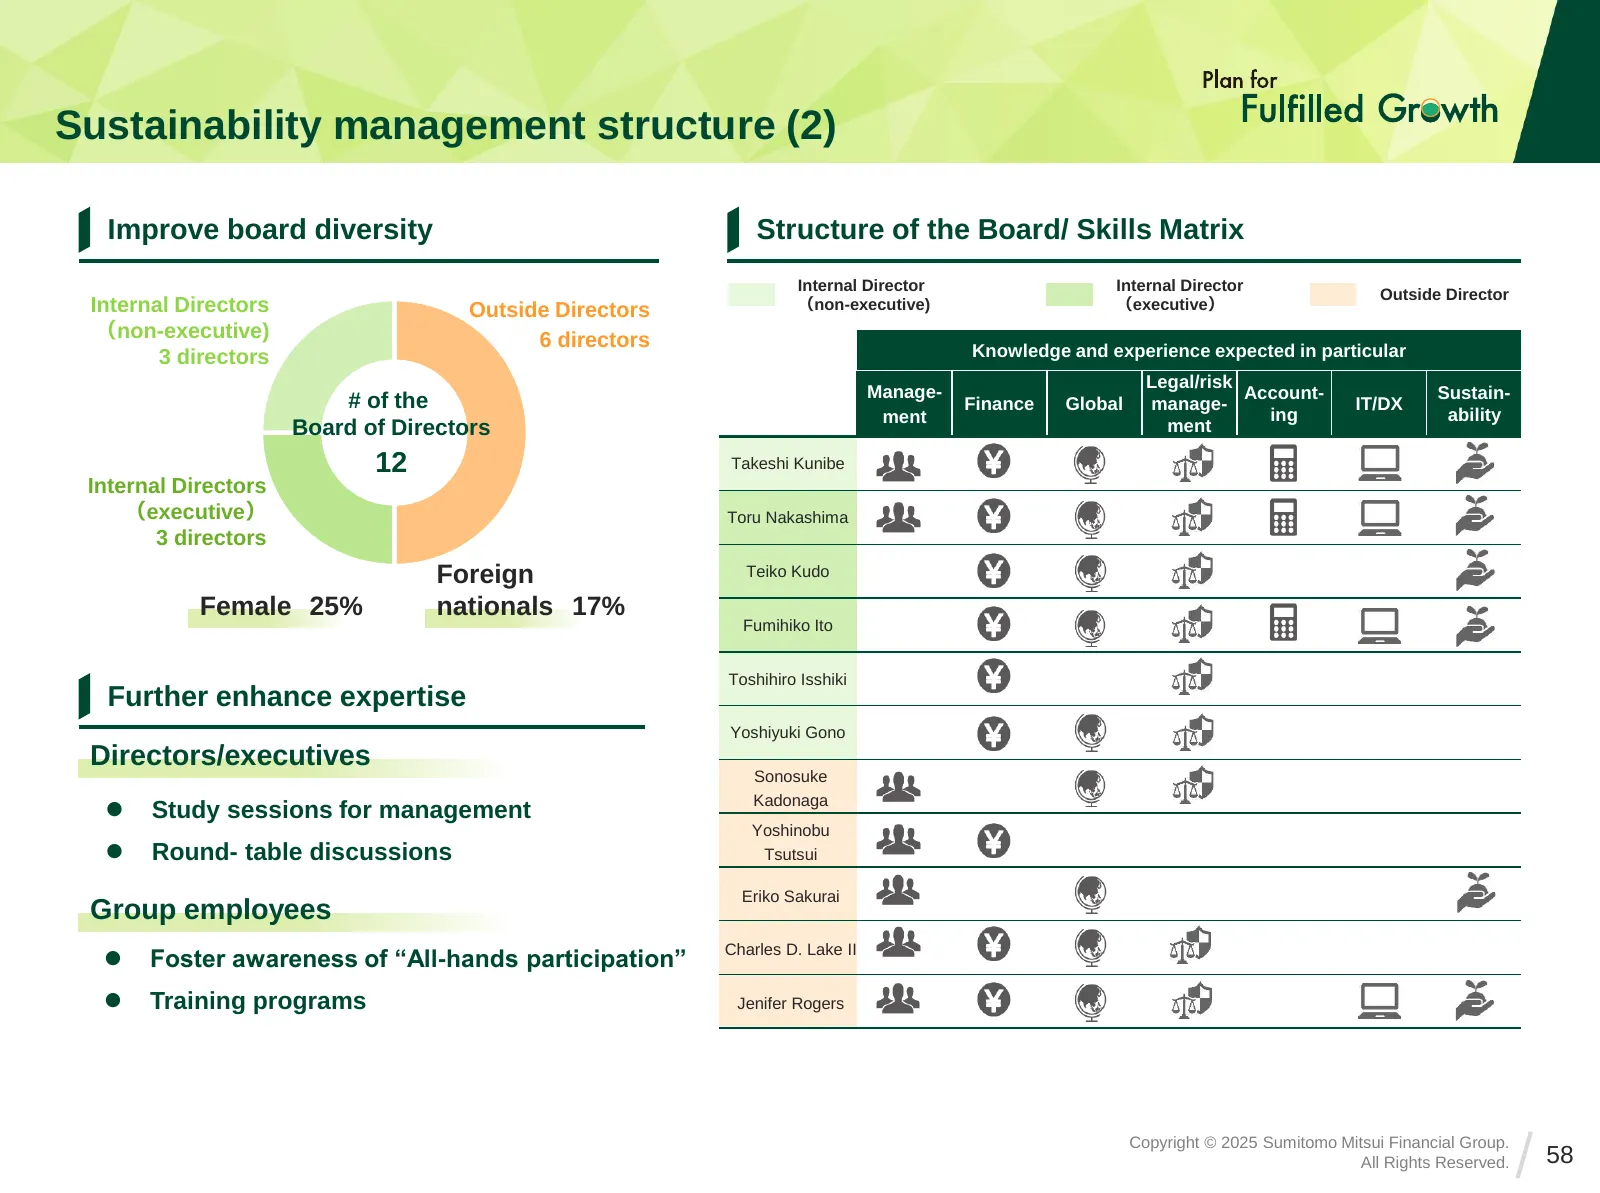
Slide 58: Sustainability management structure (2)
Sustainability management structure (2) Improve board diversity Structure of the Board/ Skills Matrix Internal Director Internal Director Outside Director Internal Directors Outside Directors (non-executive) (executive) (non-executive) 6 directors 3 directors Knowledge and experience expected in par
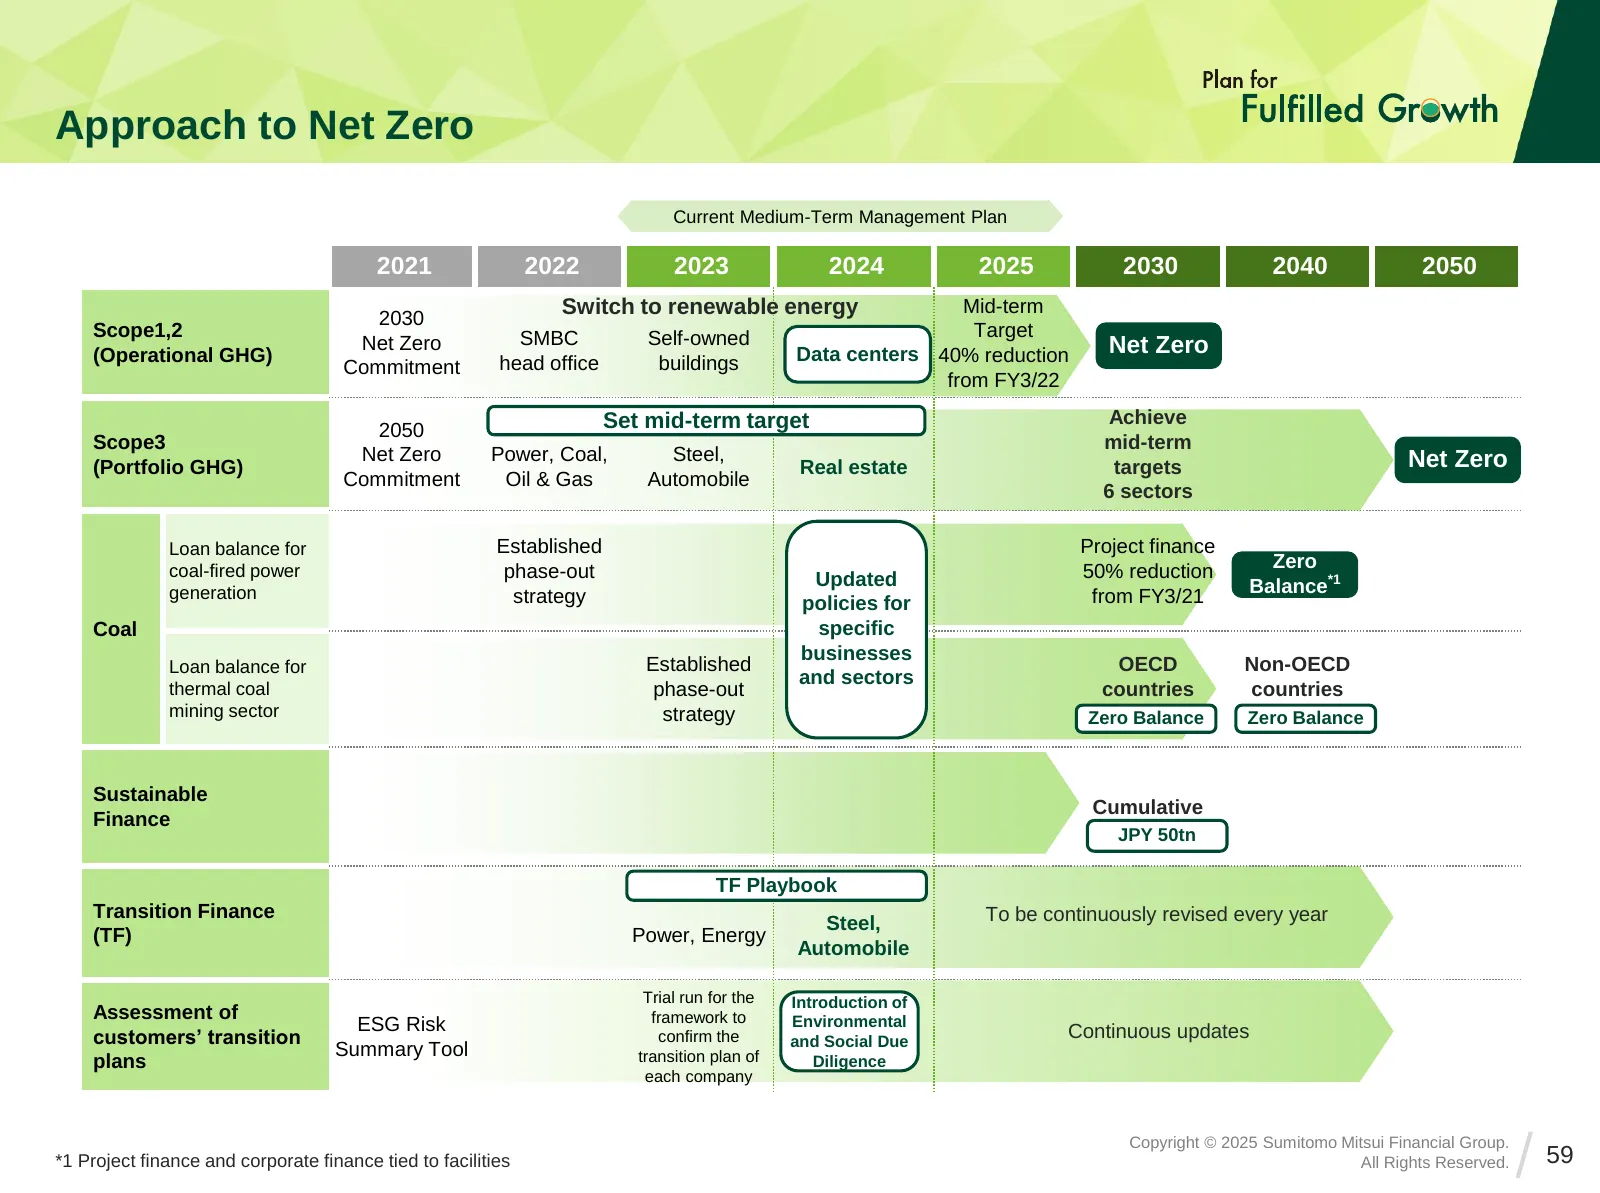
Slide 59: Approach to Net Zero
Approach to Net Zero Current Medium-Term Management Plan 2021 2022 2023 2024 2025 2030 2040 2050 2030 Switch to renewable energy Mid-term Scope1,2 SMBC Self-owned Target Net Zero Net Zero (Operational GHG) head office buildings Data centers 40% reduction Commitment from FY3/22 Set mid-term target Ac
Slide 60: Inclusion in the Index and Initiatives
Inclusion in the Index and Initiatives*1 Selected ESG Indices Endorsed initiatives GPIF Selection Index Copyright © 2025 Sumitomo Mitsui Financial Group. *1 As of Dec.31 2024 All Rights Reserved. 60
Slide 61: Growth with Quality
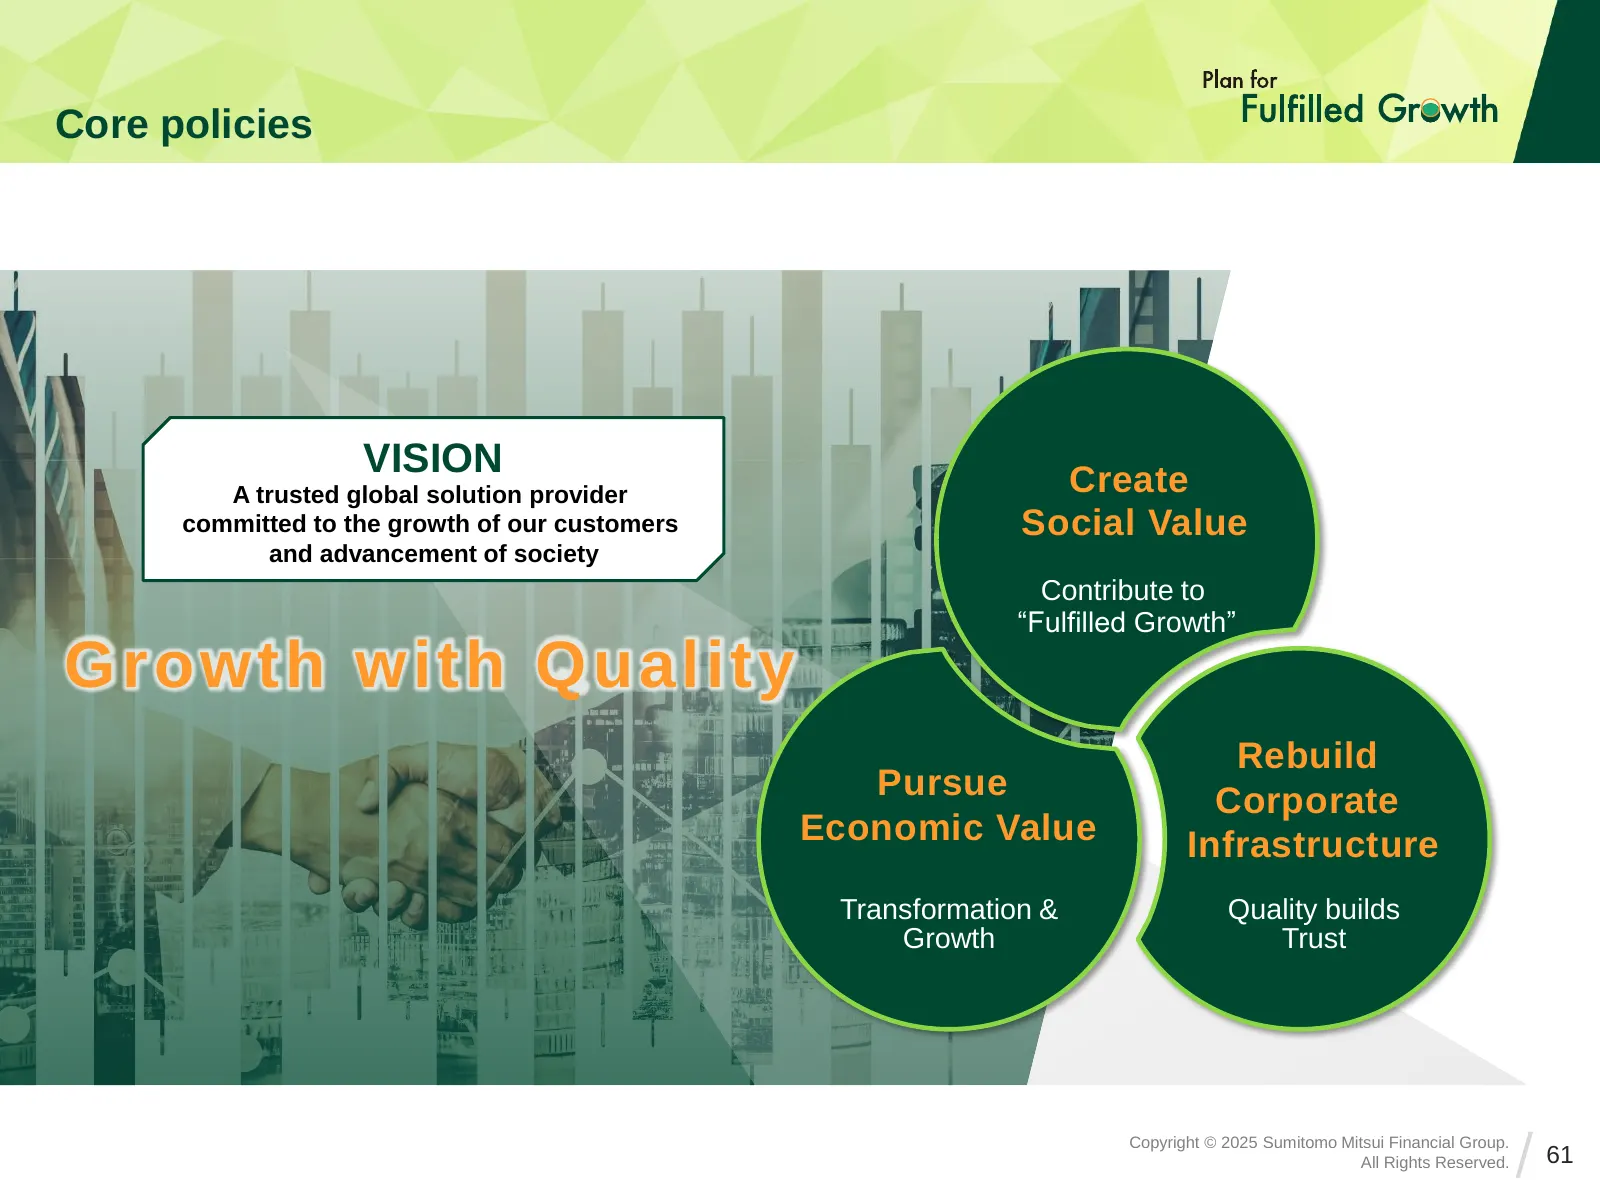
Core policies VISION A trusted global solution provider Create committed to the growth of our customers Social Value and advancement of society Contribute to “Fulfilled Growth” Growth with Quality Rebuild Pursue Corporate Economic Value Infrastructure Transformation & Quality builds Growth Trust Cop
Slide 62: KPI Progress of the Medium-Term Management Plan
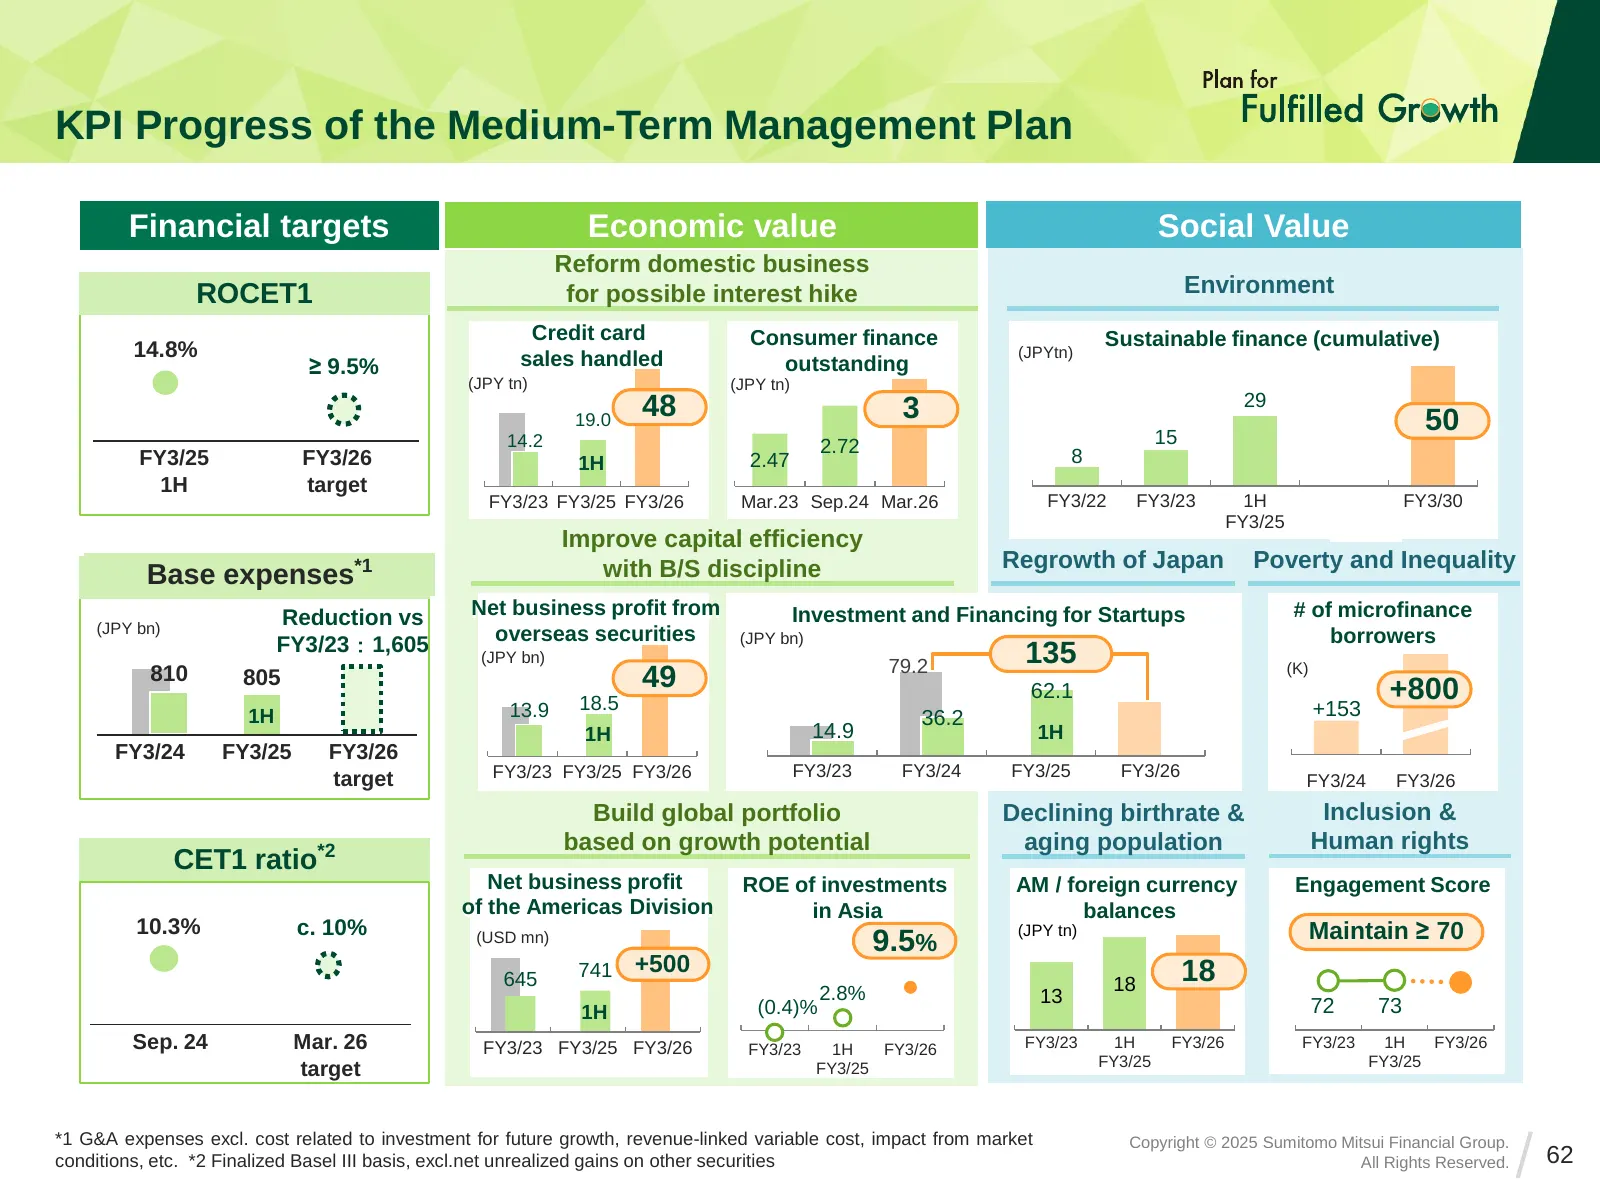
KPI Progress of the Medium-Term Management Plan Financial targets Economic value Social Value Reform domestic business ROCET1 for possible interest hike Environment Credit card Consumer finance Sustainable finance (cumulative) 14.8% sales handled (JPYtn) ≥ 9.5% outstanding (JPY tn) (JPY tn) 48 29 19
Slide 63: Dynamic reallocation of management resources
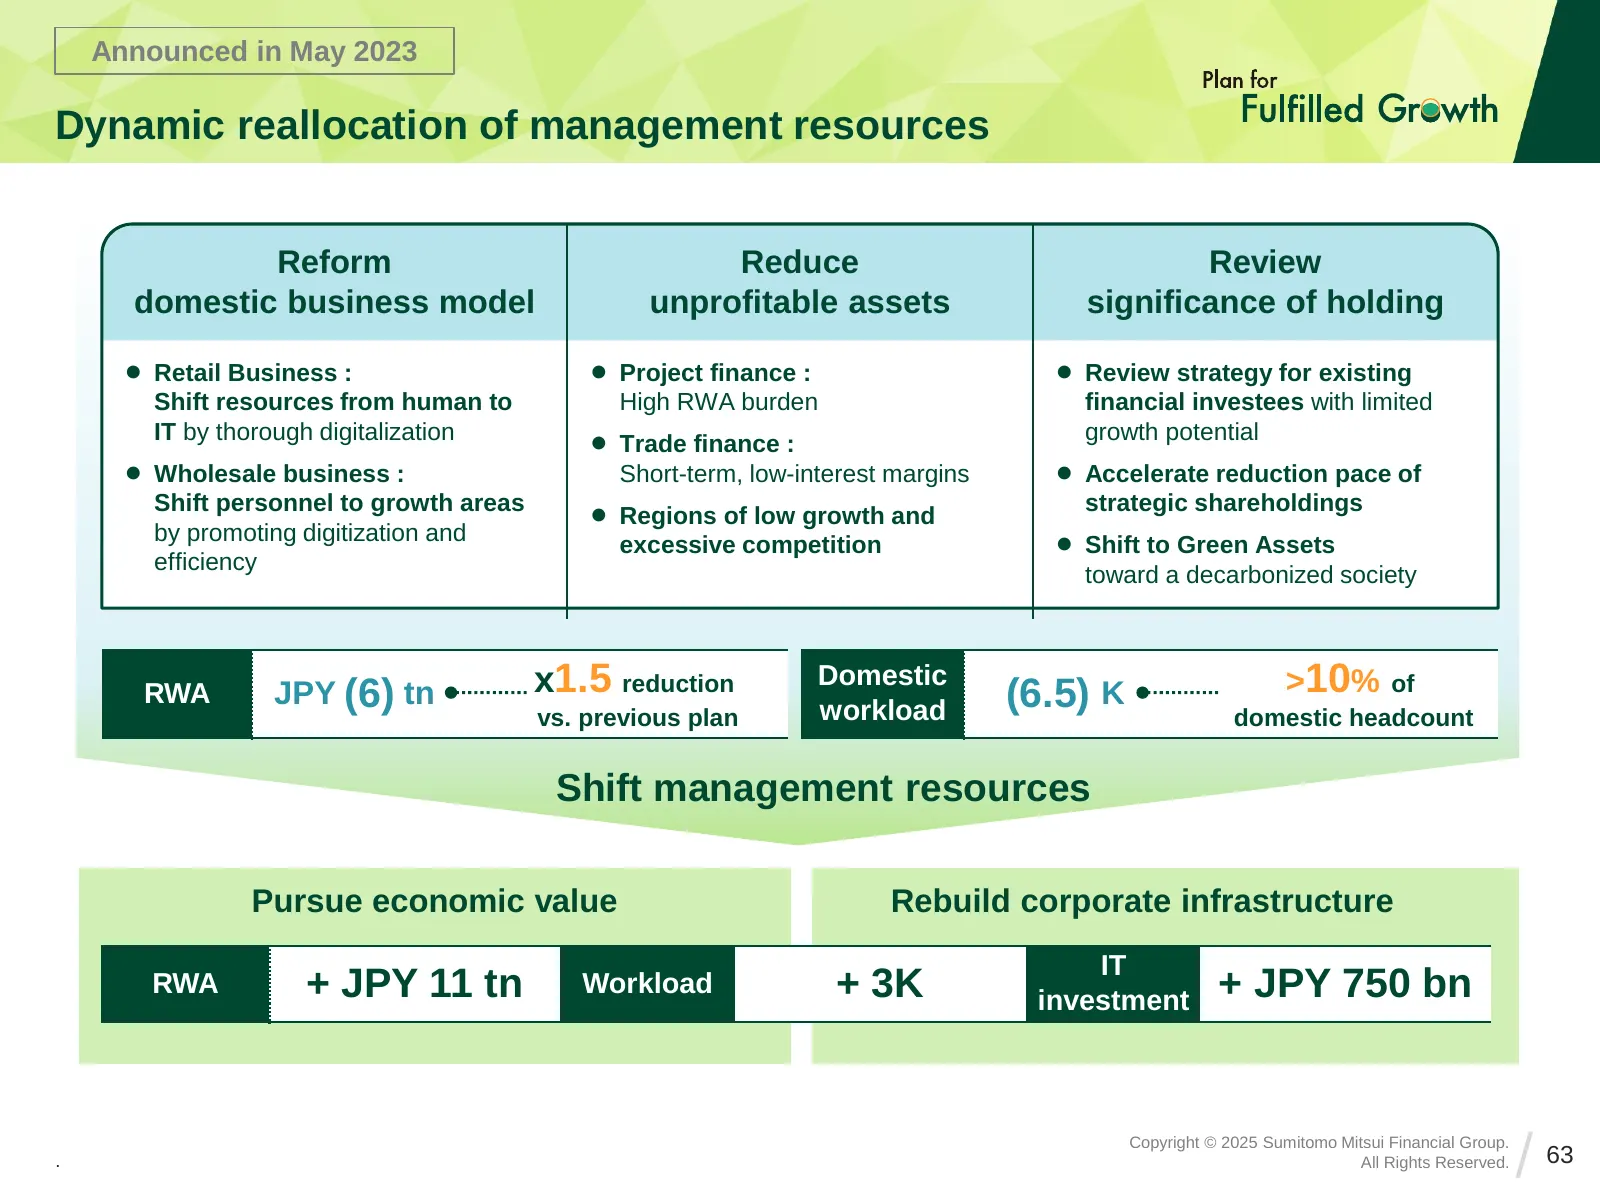
Announced in May 2023 Dynamic reallocation of management resources Reform Reduce Review domestic business model unprofitable assets significance of holding ⚫ Retail Business : ⚫ Project finance : ⚫ Review strategy for existing Shift resources from human to High RWA burden financial investees with li
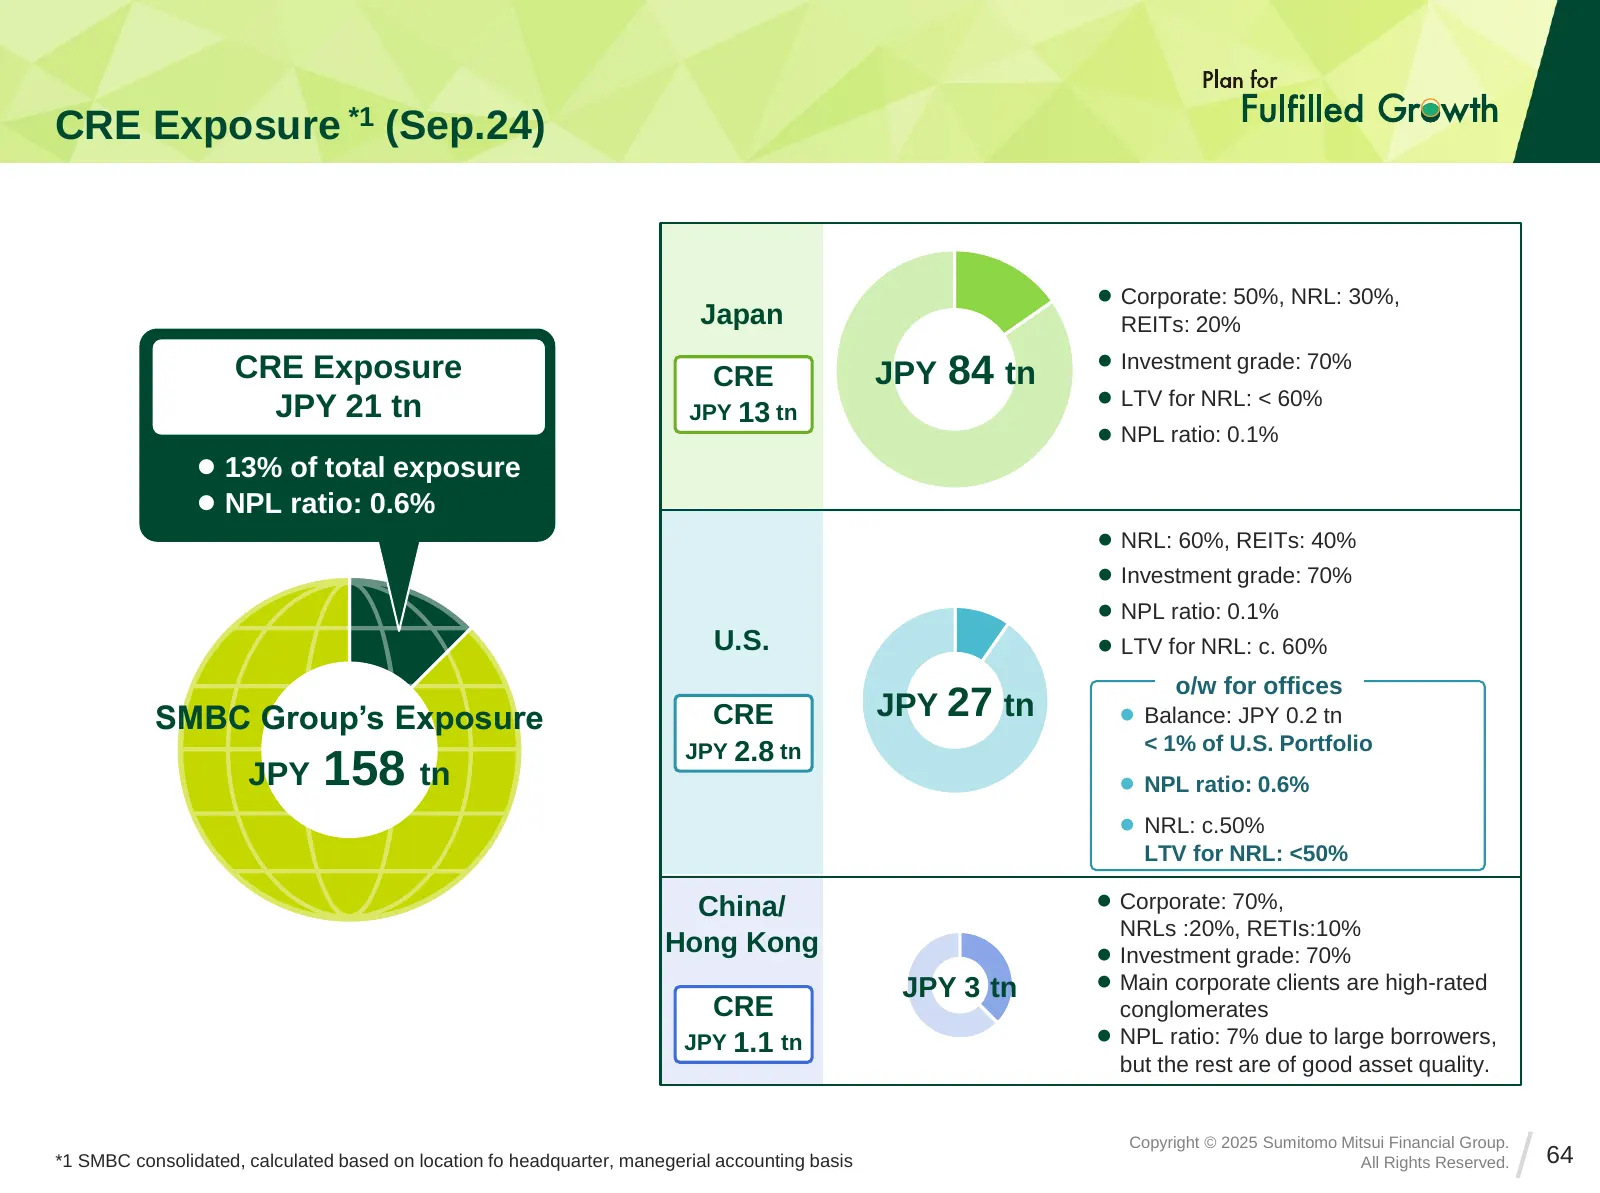
Slide 64: CRE Exposure
CRE Exposure *1 (Sep.24) ⚫ Corporate: 50%, NRL: 30%, Japan REITs: 20% ⚫ Investment grade: 70% CRE Exposure CRE JPY 84 tn ⚫ LTV for NRL: < 60% JPY 21 tn JPY 13 tn ⚫ NPL ratio: 0.1% ⚫ 13% of total exposure ⚫ NPL ratio: 0.6% ⚫ NRL: 60%, REITs: 40% ⚫ Investment grade: 70% ⚫ NPL ratio: 0.1% U.S. ⚫ LTV fo
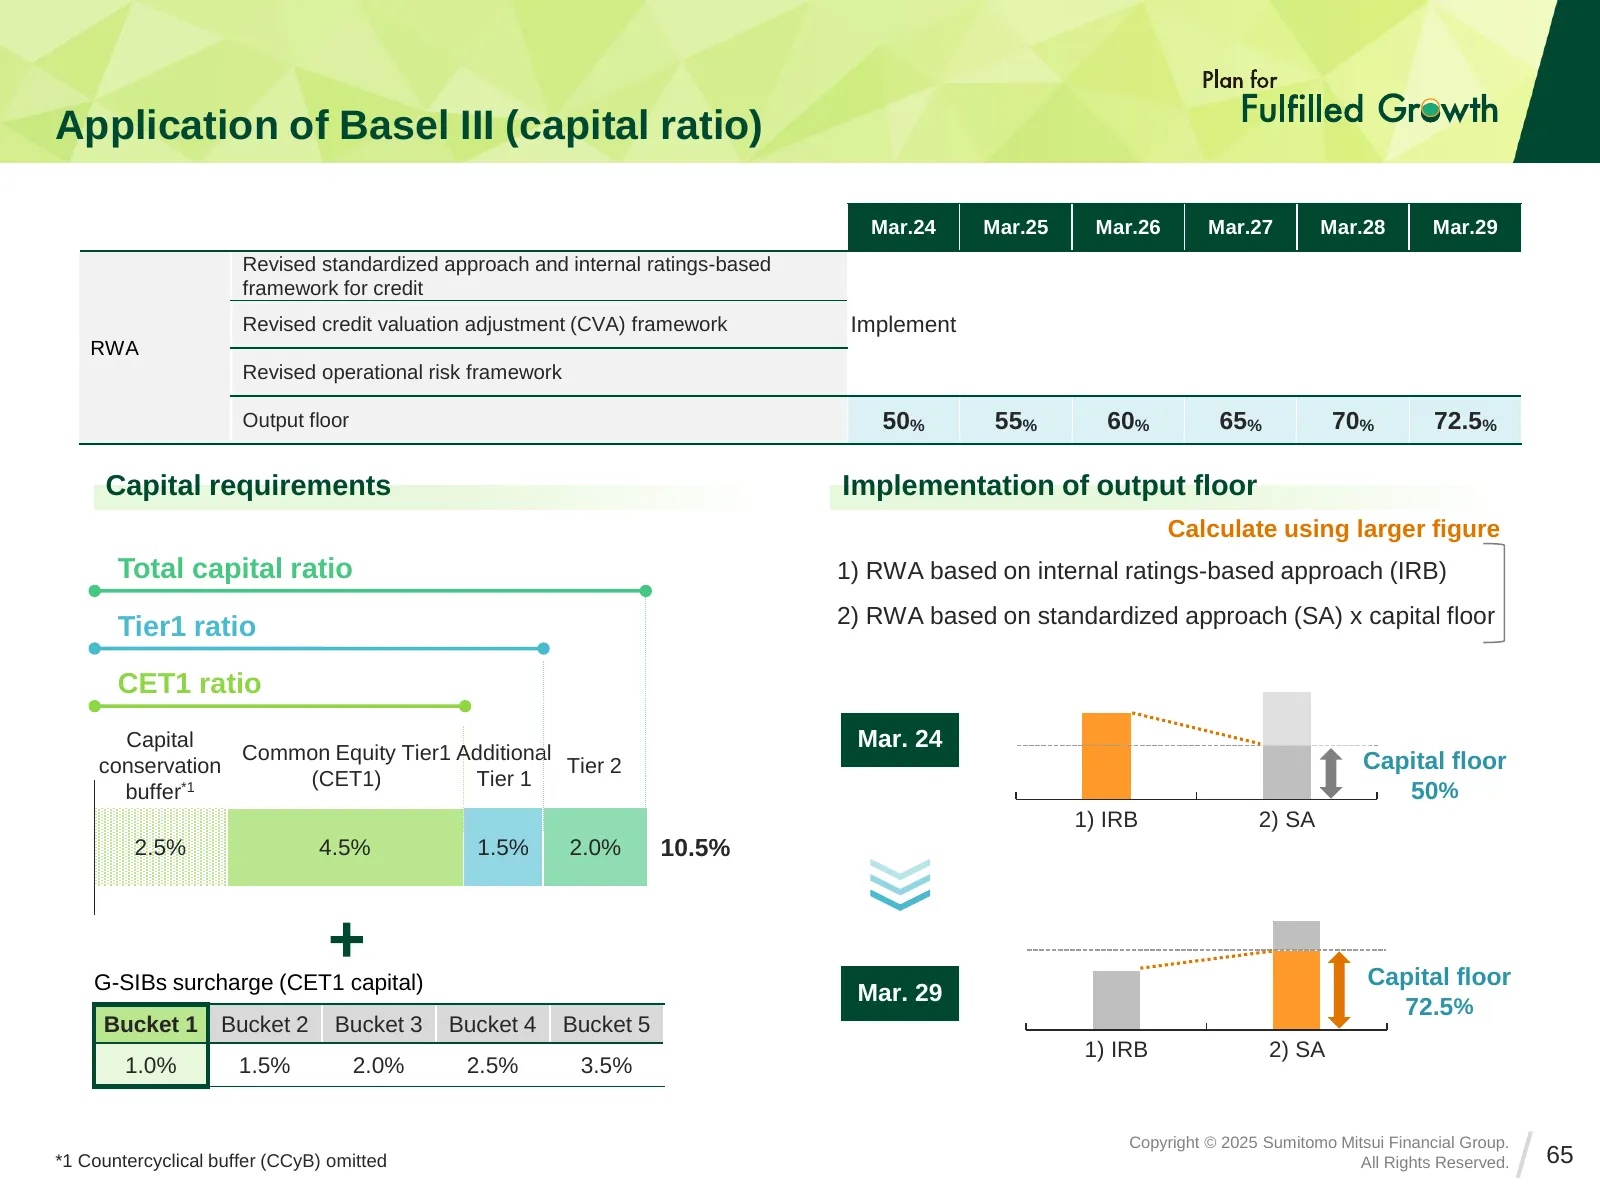
Slide 65: Application of Basel III (capital ratio)
Application of Basel III (capital ratio) Mar.24 Mar.25 Mar.26 Mar.27 Mar.28 Mar.29 Revised standardized approach and internal ratings-based framework for credit Revised credit valuation adjustment (CVA) framework Implement RWA Revised operational risk framework Output floor 50% 55% 60% 65% 70% 72.5%
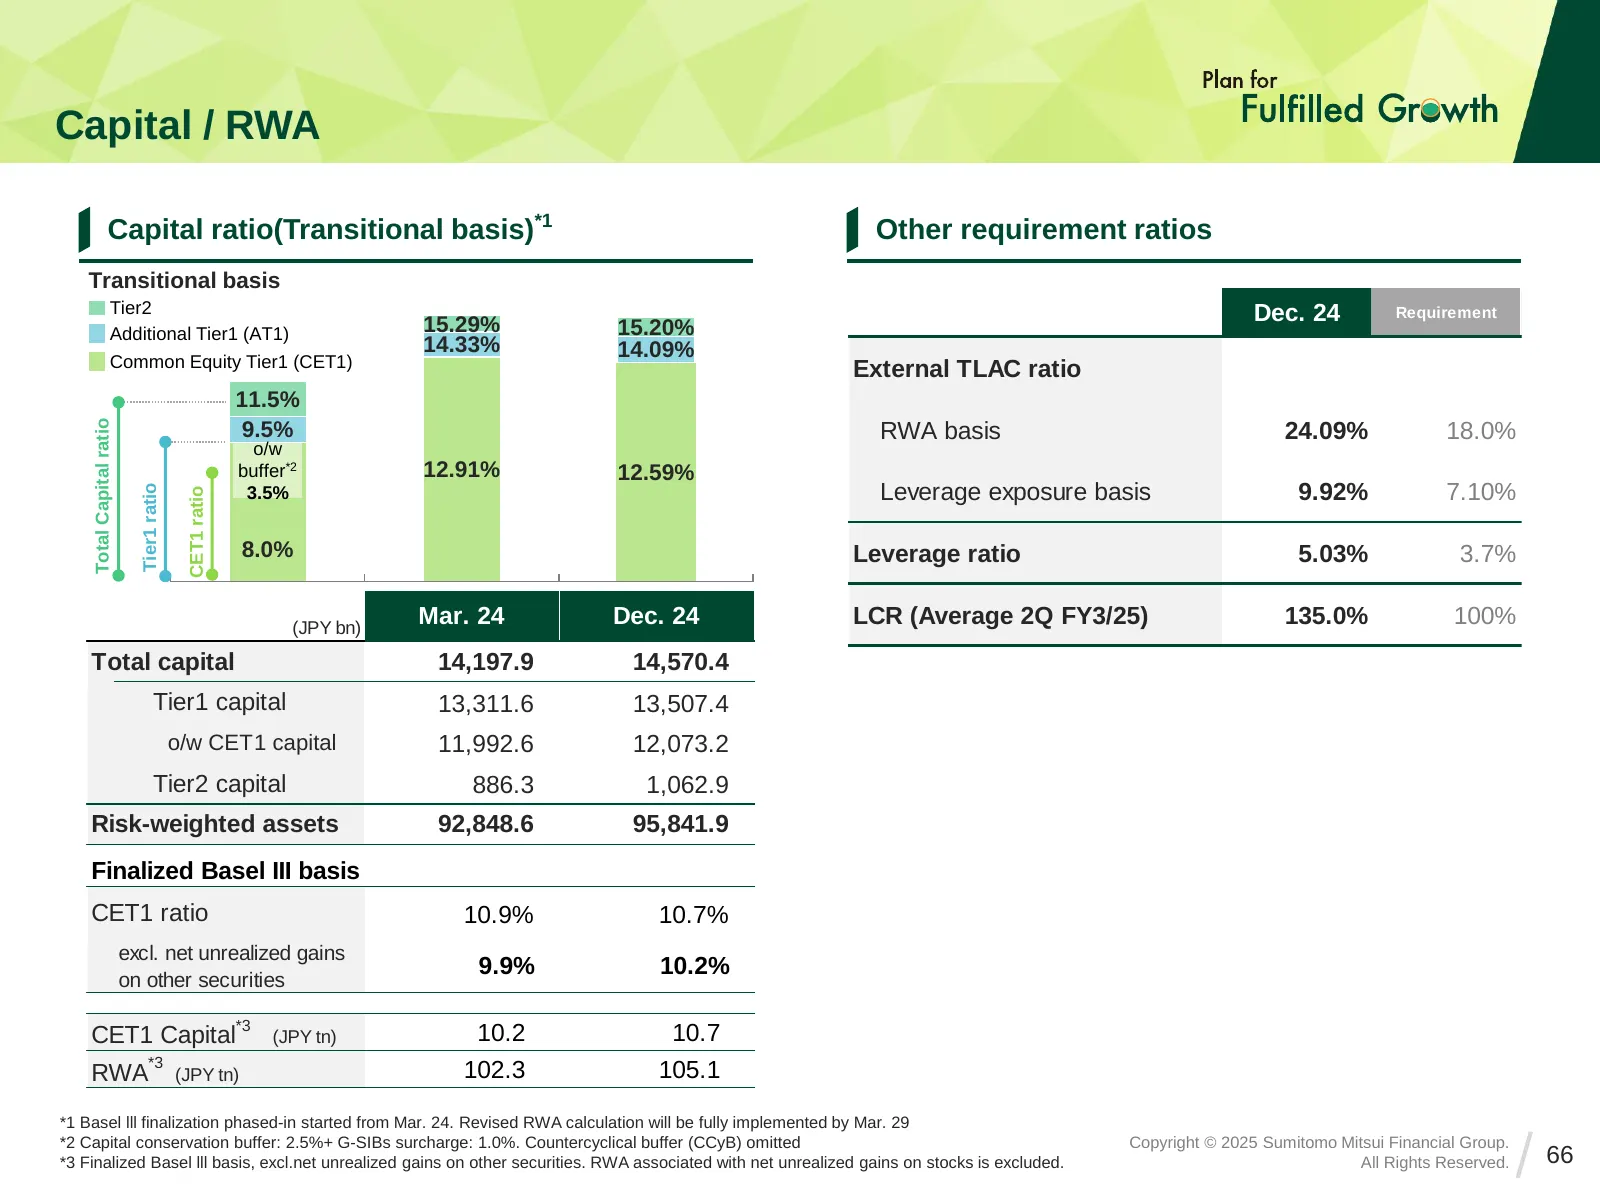
Slide 66: Total Capital ratio
Capital / RWA Capital ratio(Transitional basis)*1 Other requirement ratios Transitional basis Tier2 Dec. 24 Requirement Additional Tier1 (AT1) 15.29% 15.20% 14.33% 14.09% Common Equity Tier1 (CET1) External TLAC ratio 11.5% Total Capital ratio 9.5% RWA basis 24.09% 18.0% o/w buffer*2 12.91% 12.59% T
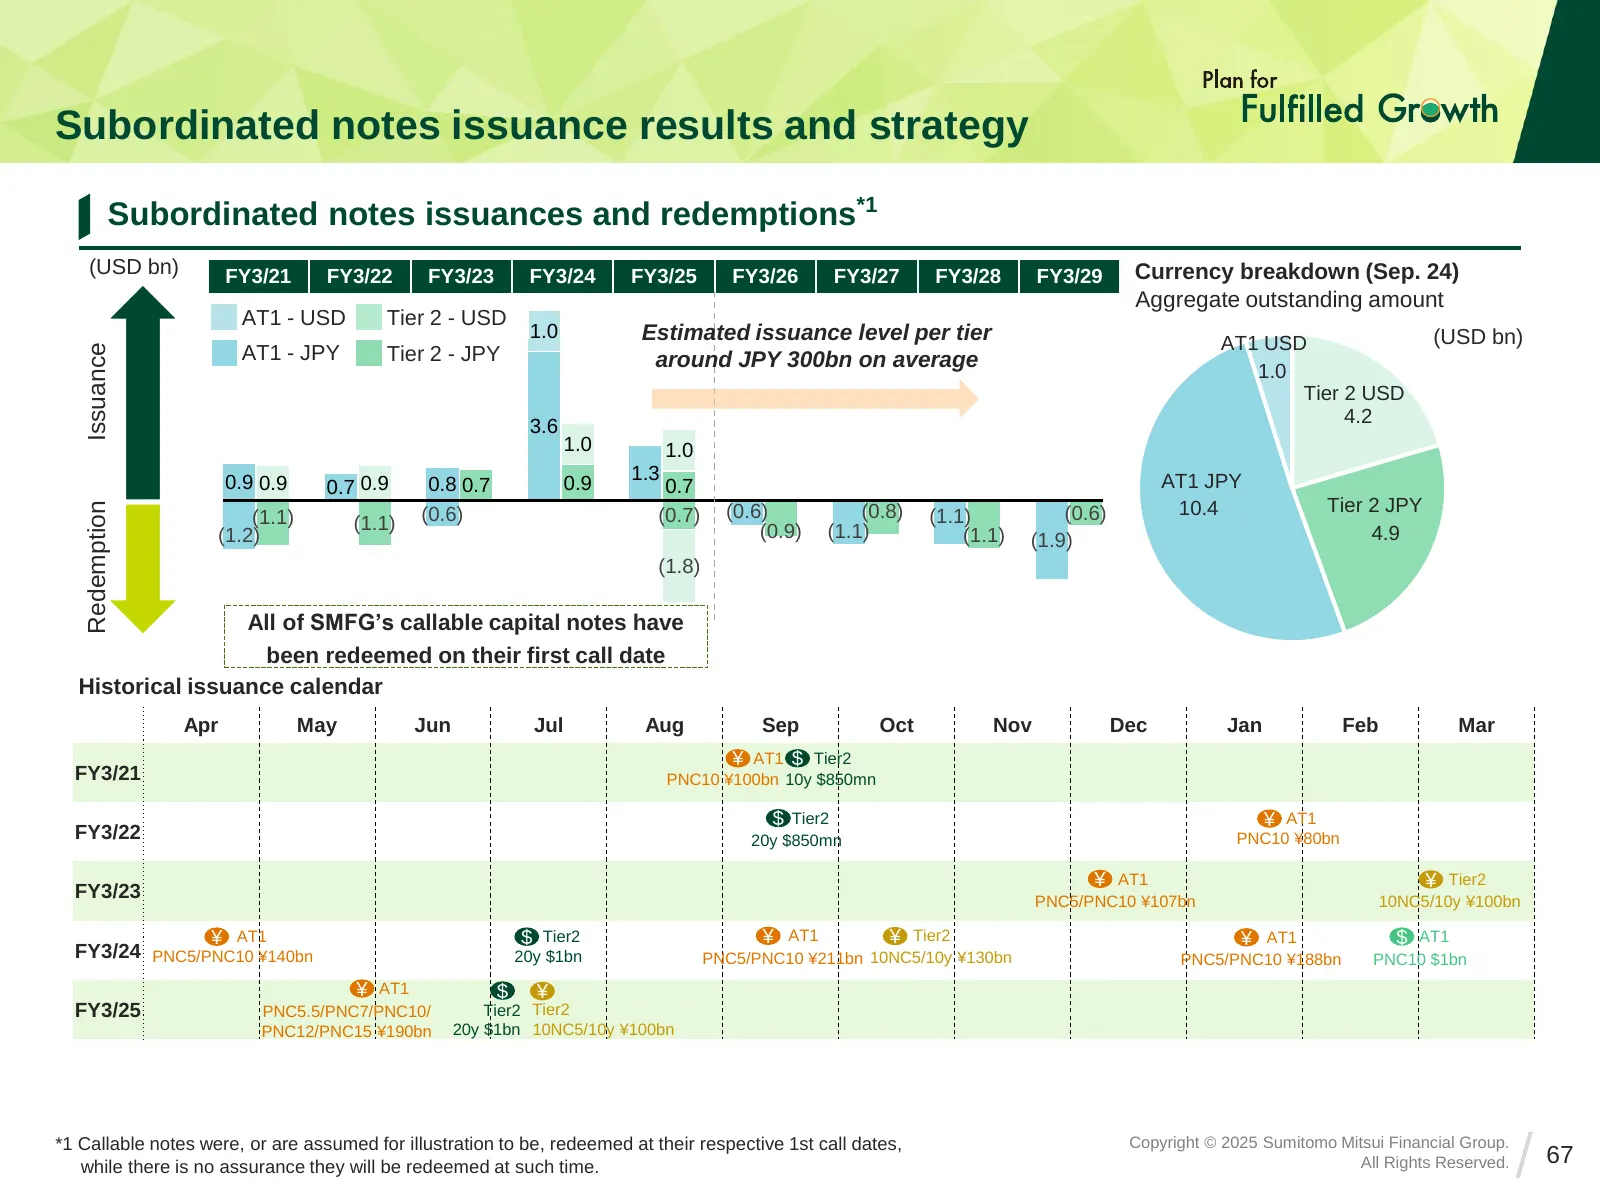
Slide 67: Subordinated notes issuance results and strategy
Subordinated notes issuance results and strategy Subordinated notes issuances and redemptions*1 (USD bn) FY3/21 FY3/22 FY3/23 FY3/24 FY3/25 FY3/26 FY3/27 FY3/28 FY3/29 Currency breakdown (Sep. 24) Aggregate outstanding amount AT1 - USD Tier 2 - USD 1.0 Estimated issuance level per tier (USD bn) AT1
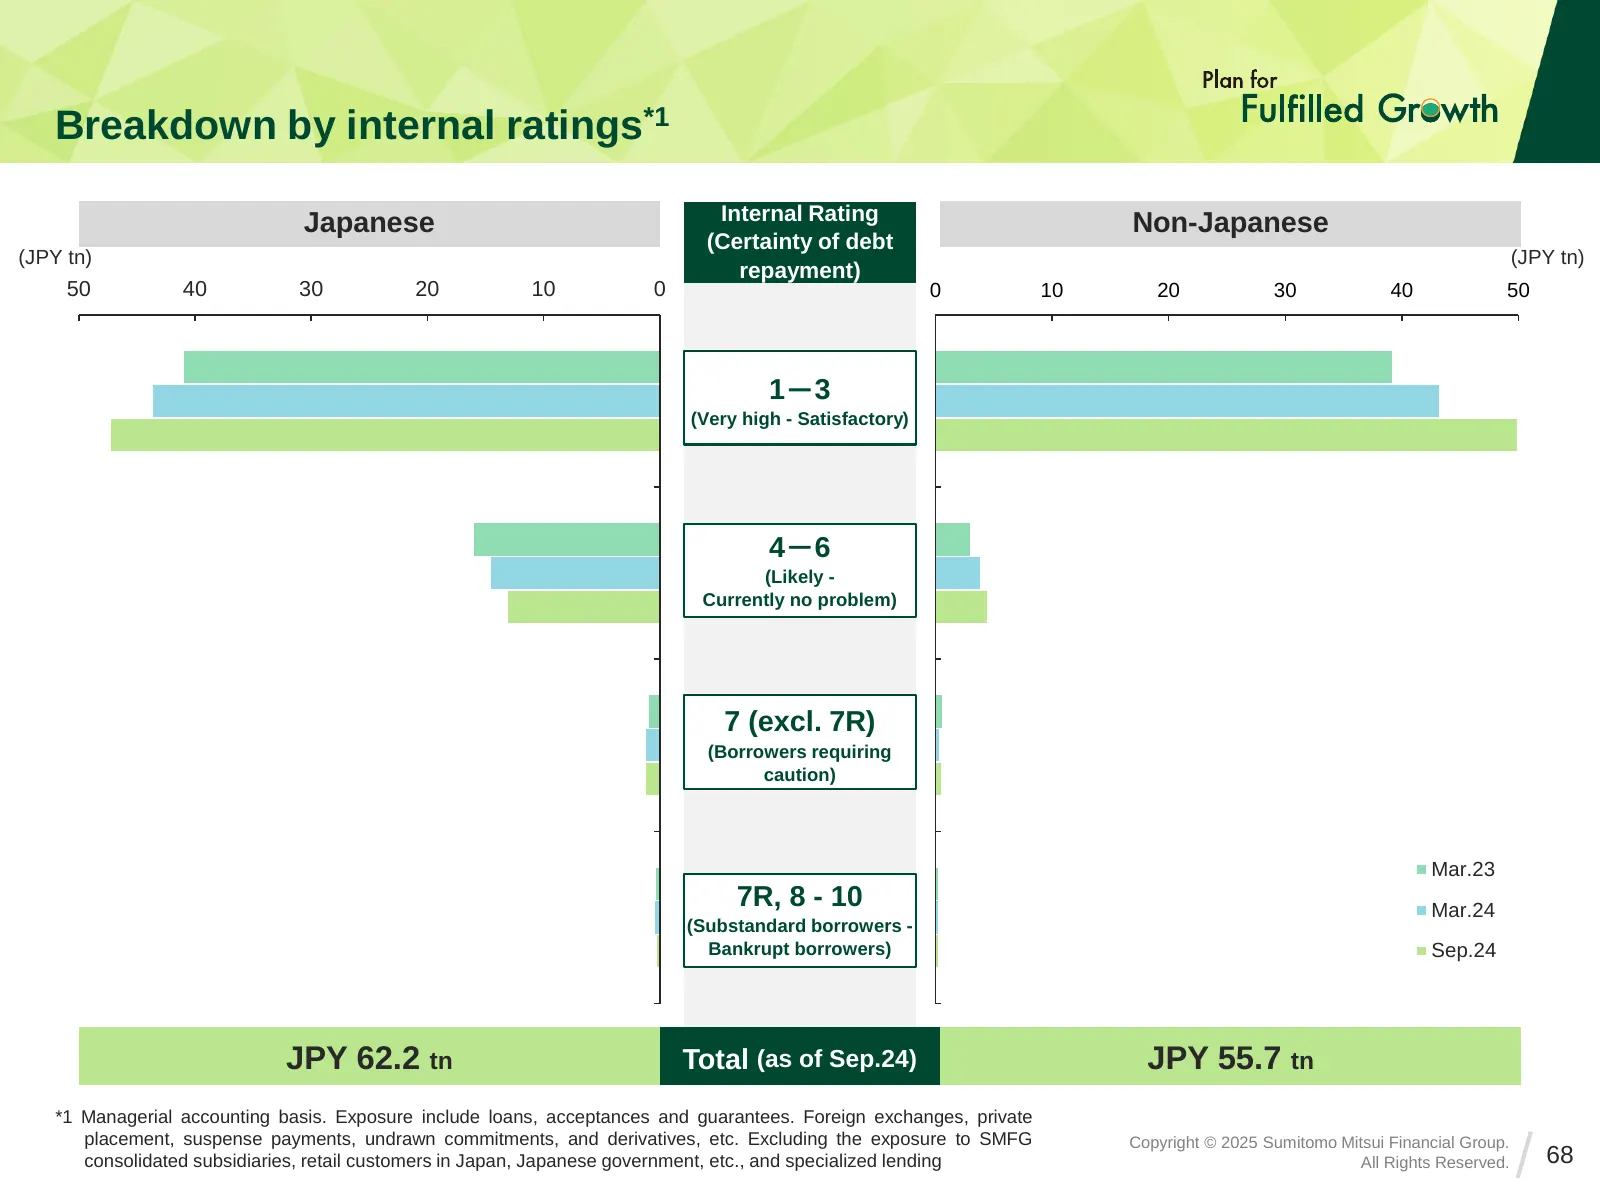
Slide 68: Breakdown by internal ratings
Breakdown by internal ratings*1 Japanese Internal Rating Non-Japanese (Certainty of debt (JPY tn) (JPY tn) repayment) 50 40 30 20 10 0 0 10 20 30 40 50 1-3 (Very high - Satisfactory) 4-6 (Likely - Currently no problem) 7 (excl. 7R) (Borrowers requiring caution) Mar.23 7R, 8 - 10 Mar.24 (Substandard
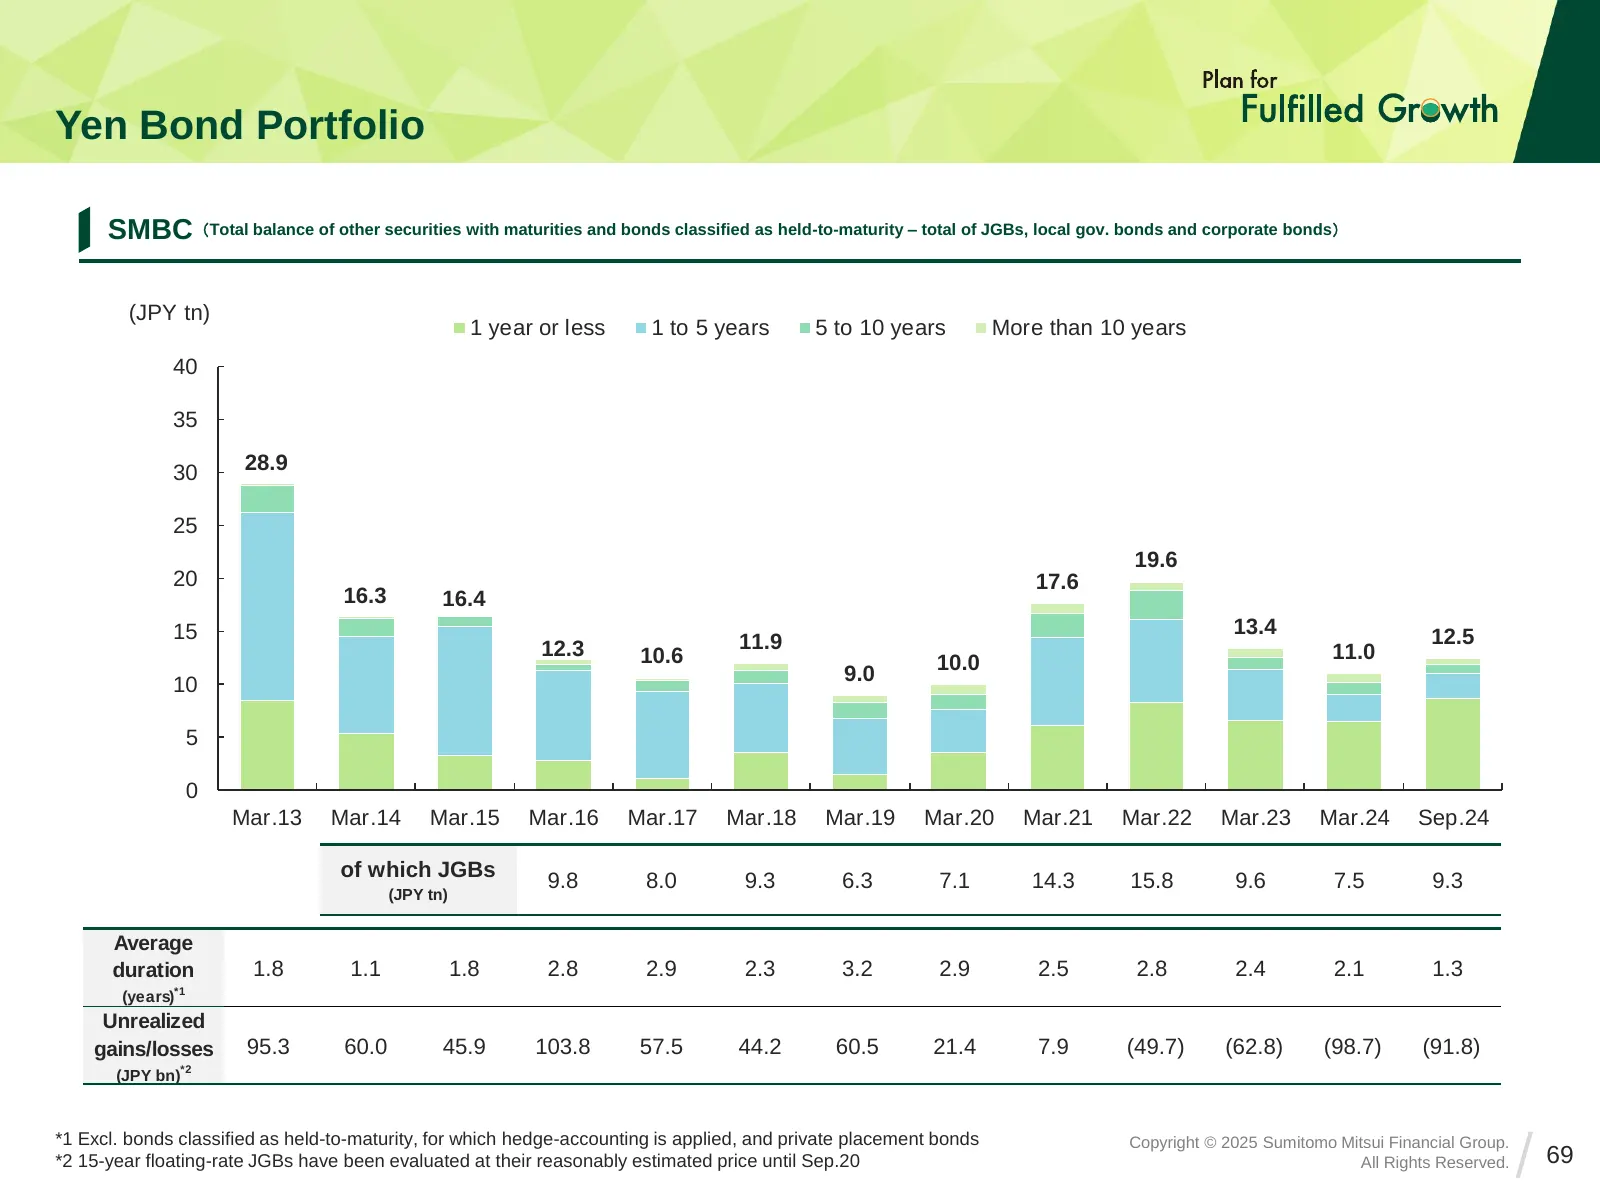
Slide 69: Yen Bond Portfolio
Yen Bond Portfolio SMBC(Total balance of other securities with maturities and bonds classified as held-to-maturity – total of JGBs, local gov. bonds and corporate bonds) (JPY tn) 1 year or less 1 to 5 years 5 to 10 years More than 10 years 40 35 30 28.9 25 19.6 20 17.6 16.3 16.4 15 13.4 12.5 12.3 11
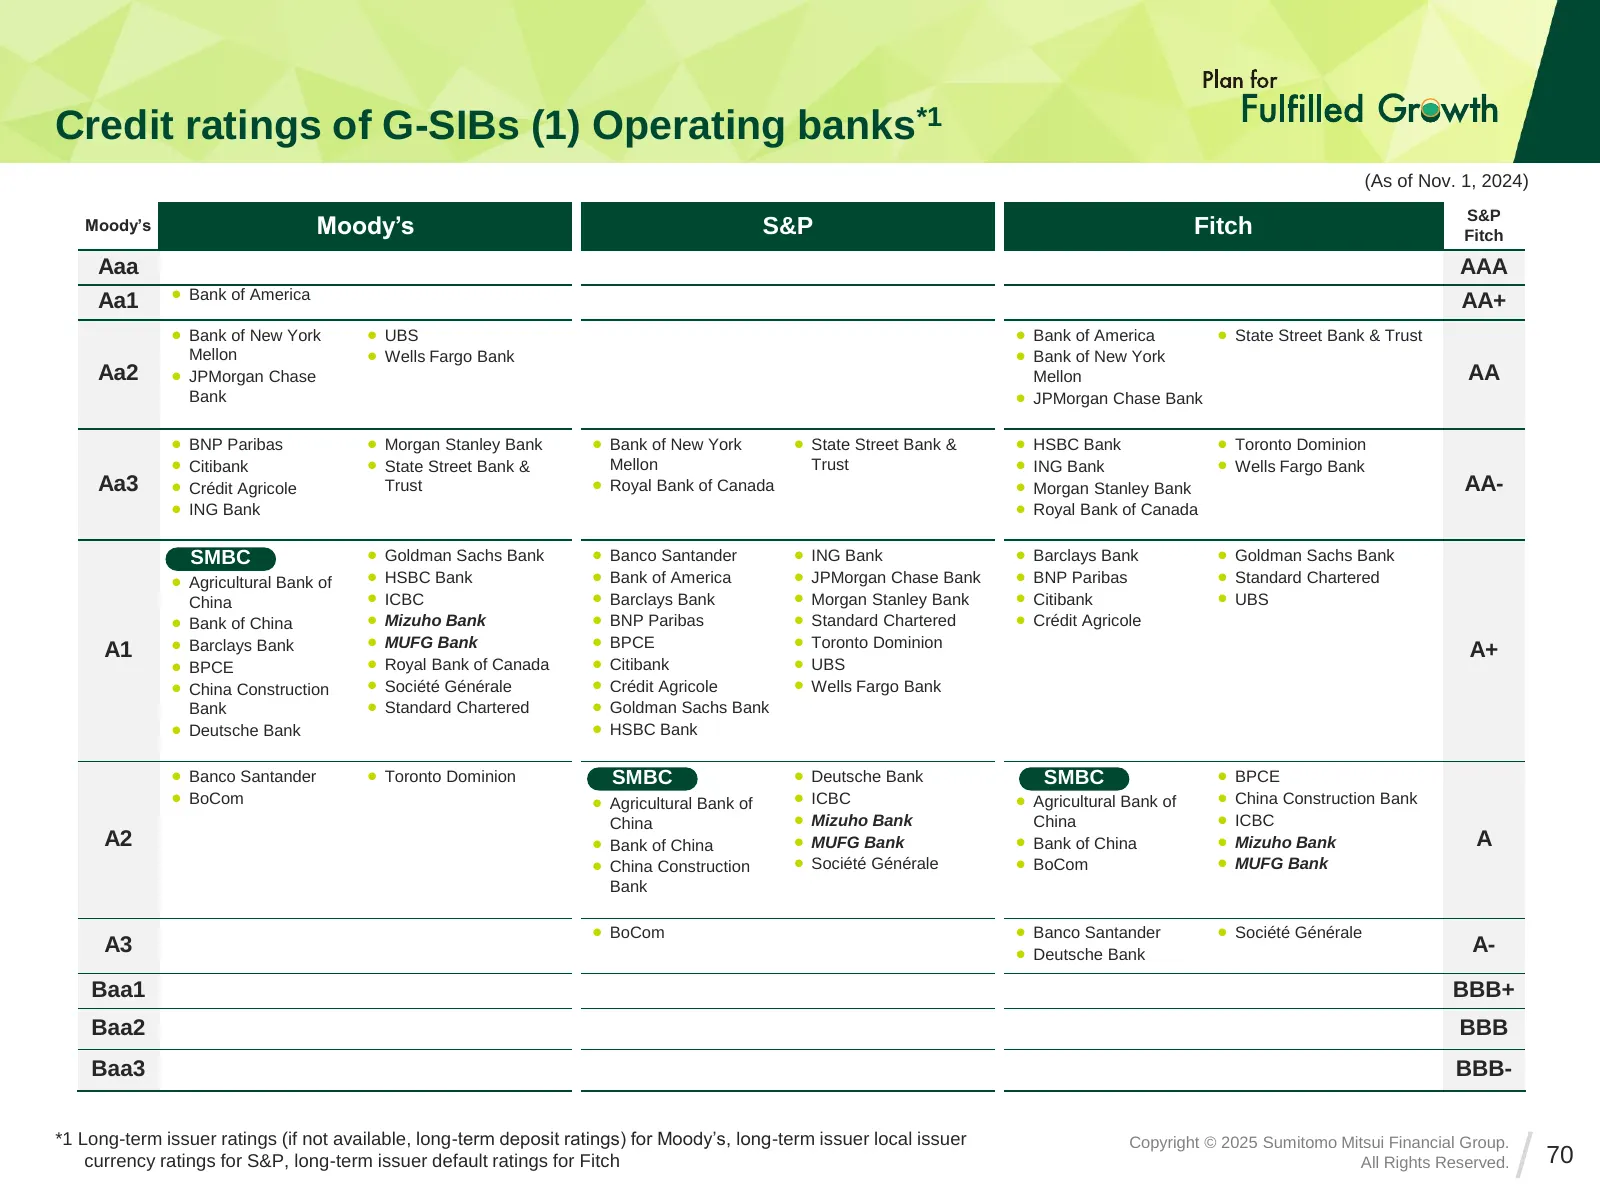
Slide 70: Credit ratings of G-SIBs (1) Operating banks
Credit ratings of G-SIBs (1) Operating banks*1 (As of Nov. 1, 2024) S&P Moody’s Moody’s S&P Fitch Fitch Aaa AAA ⚫ Bank of America Aa1 AA+ ⚫ Bank of New York ⚫ UBS ⚫ Bank of America ⚫ State Street Bank & Trust Mellon ⚫ Wells Fargo Bank ⚫ Bank of New York Aa2 ⚫ JPMorgan Chase Mellon AA Bank ⚫ JPMorgan
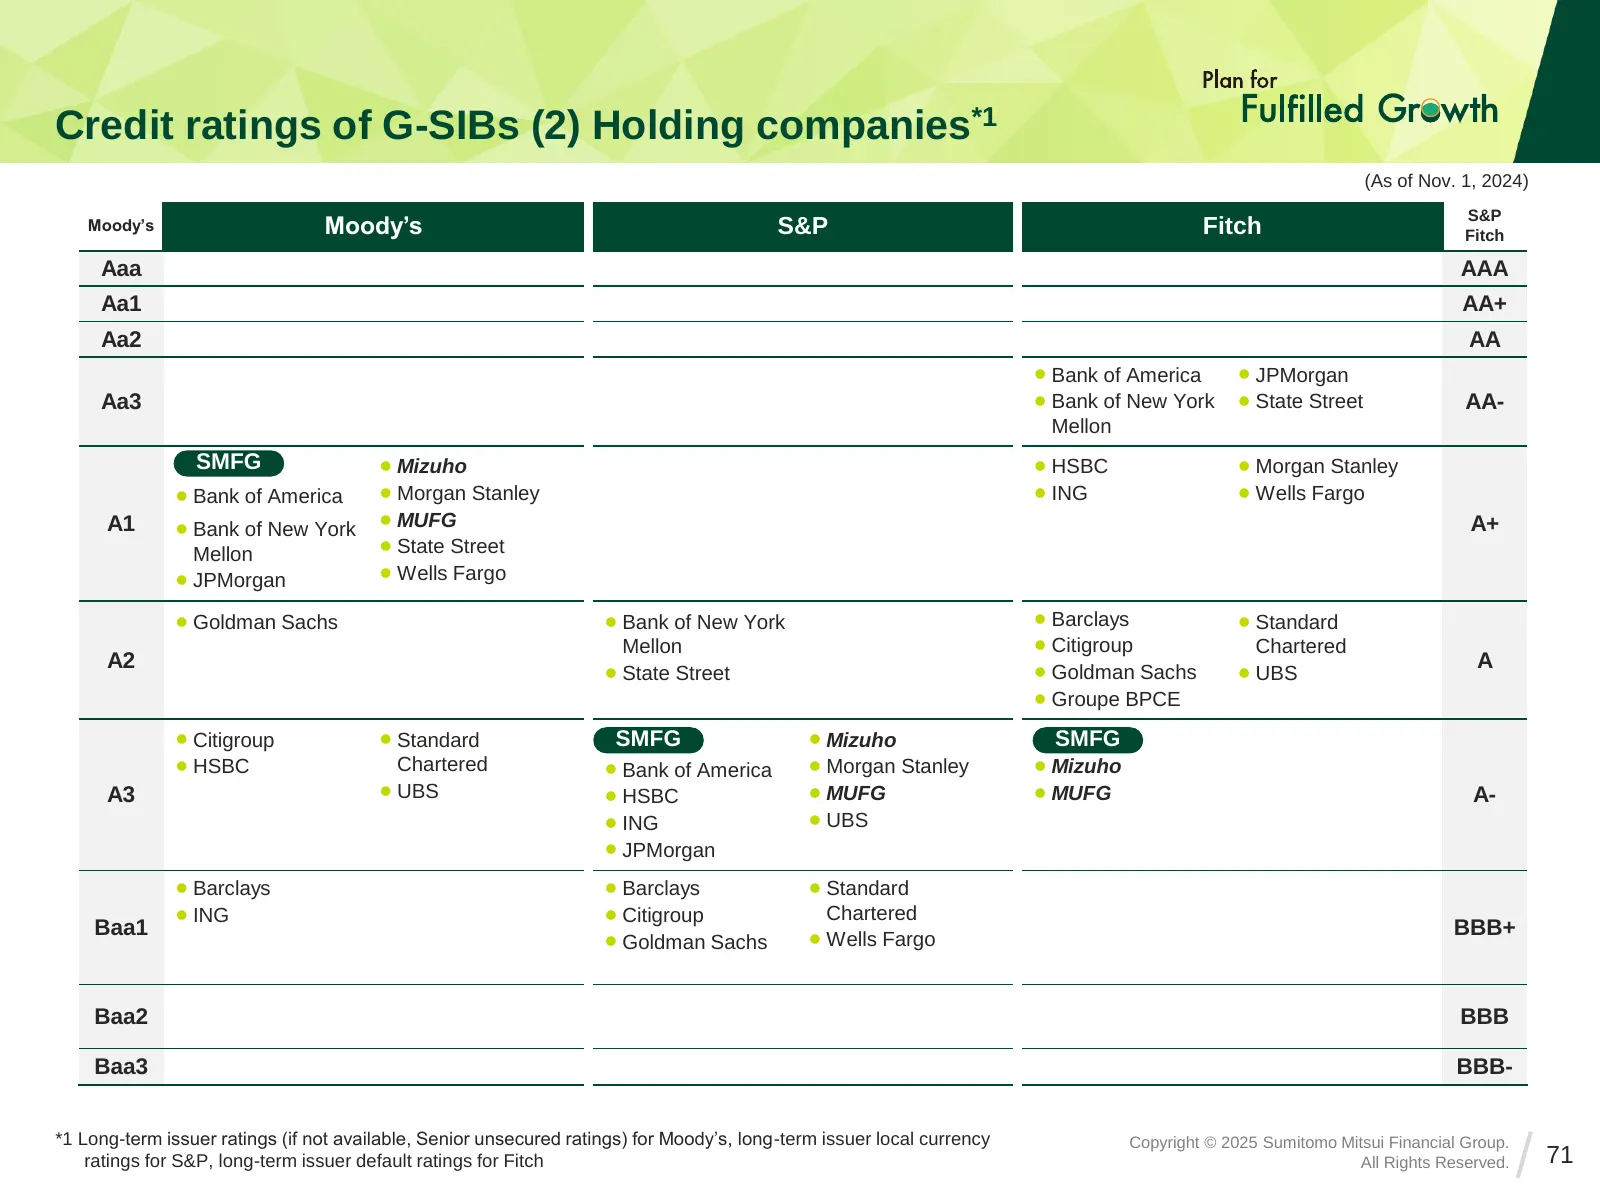
Slide 71: Credit ratings of G-SIBs (2) Holding companies
Credit ratings of G-SIBs (2) Holding companies*1 (As of Nov. 1, 2024) S&P Moody’s Moody’s S&P Fitch Fitch Aaa AAA Aa1 AA+ Aa2 AA ⚫ Bank of America ⚫ JPMorgan Aa3 ⚫ Bank of New York ⚫ State Street AA- Mellon SMFG ⚫ SMFG ⚫ Mizuho ⚫ HSBC ⚫ Morgan Stanley ⚫ Bank of America ⚫ Morgan Stanley ⚫ ING ⚫ Wells
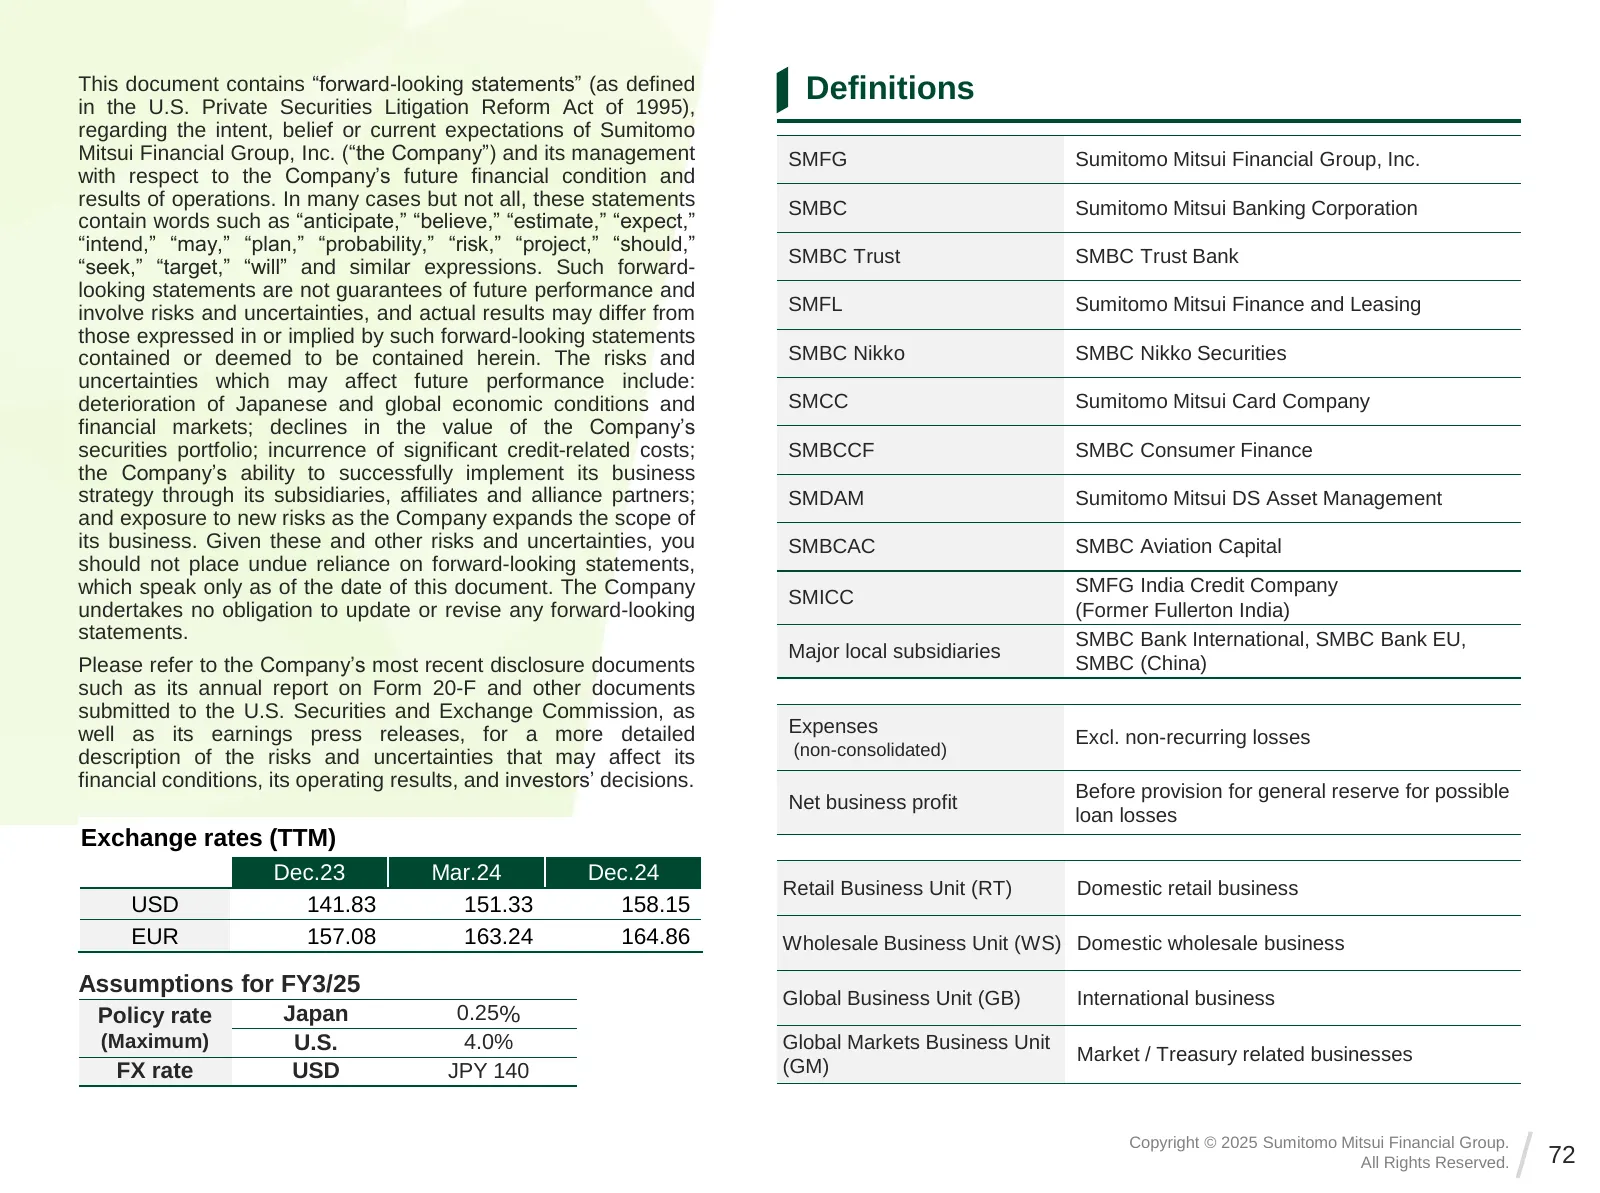
Slide 72: Definitions
This document contains “forward-looking statements” (as defined Definitions in the U.S. Private Securities Litigation Reform Act of 1995), regarding the intent, belief or current expectations of Sumitomo Mitsui Financial Group, Inc. (“the Company”) and its management SMFG Sumitomo Mitsui Financial G
Source: company website
More decks from Sumitomo Mitsui Financial Group, Inc.
 1H FY3/2027 Earnings Presentation67 slides · Nov 19, 2026
 H1 FY2026 Earnings Presentation67 slides · Nov 19, 2026
 H1 FY2026 Earnings Presentation67 slides · Nov 19, 2026
 FY2025 Earnings Presentation22 slides · Nov 13, 2026
 H1 FY2026 Earnings Presentation22 slides · Nov 13, 2026
 Investor Presentation (September 2026)83 slides · September 2026