Seacoast Banking Corporation of Florida · NASDAQ:SBCF
Seacoast Banking Corporation of Florida — Seacoast Banking Corp of Florida — Q4 2022 Earnings Presentation
36 slides from Seacoast Banking Corporation of Florida's earnings presentation, Mar 6, 2023
Slide 1: Investor Presentation Fourth Quarter 2022
INVESTOR PRESENTATION FOURTH QUARTER 2022
Slide 2: Forward-Looking Statements
2FOURTH QUARTER 2022 INVESTOR PRESENTATION This presentation contains “forward-looking statements” within the meaning, and protections, of Section 27A of the Securities Act of 1933 and Section 21E of the Securities Exchange Act of 1934, including, without limitation, statements about future financia
Slide 3: Agenda
01 ABOUT SEACOAST BANK 02 OUTLOOK 03 COMPANY PERFORMANCE 04 APPENDIX AGENDA
Slide 4: About Seacoast Bank
AGENDA ABOUT SEACOAST BANK
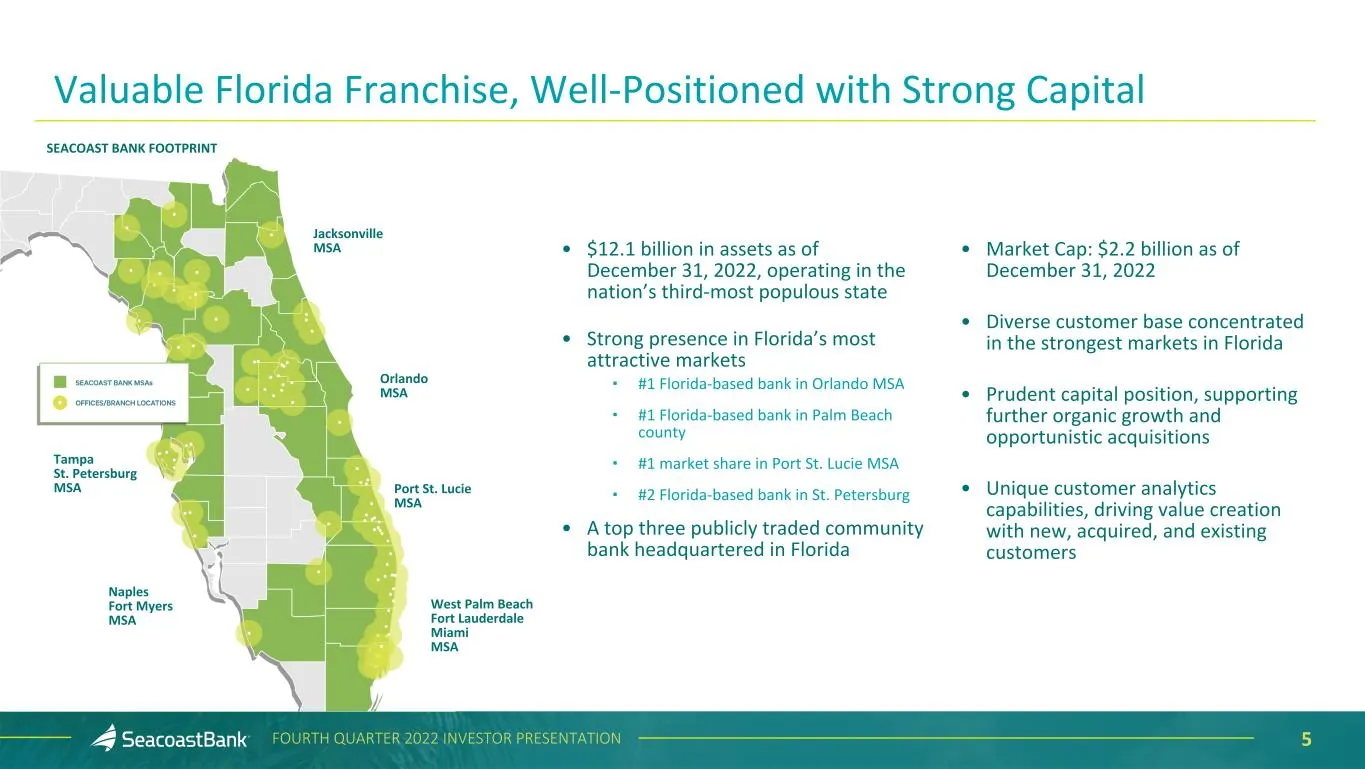
Slide 5: Valuable Florida Franchise, Well-Positioned
5FOURTH QUARTER 2022 INVESTOR PRESENTATION • $12.1 billion in assets as of December 31, 2022, operating in the nation’s third-most populous state • Strong presence in Florida’s most attractive markets ▪ #1 Florida-based bank in Orlando MSA ▪ #1 Florida-based bank in Palm Beach county ▪ #1 market sha
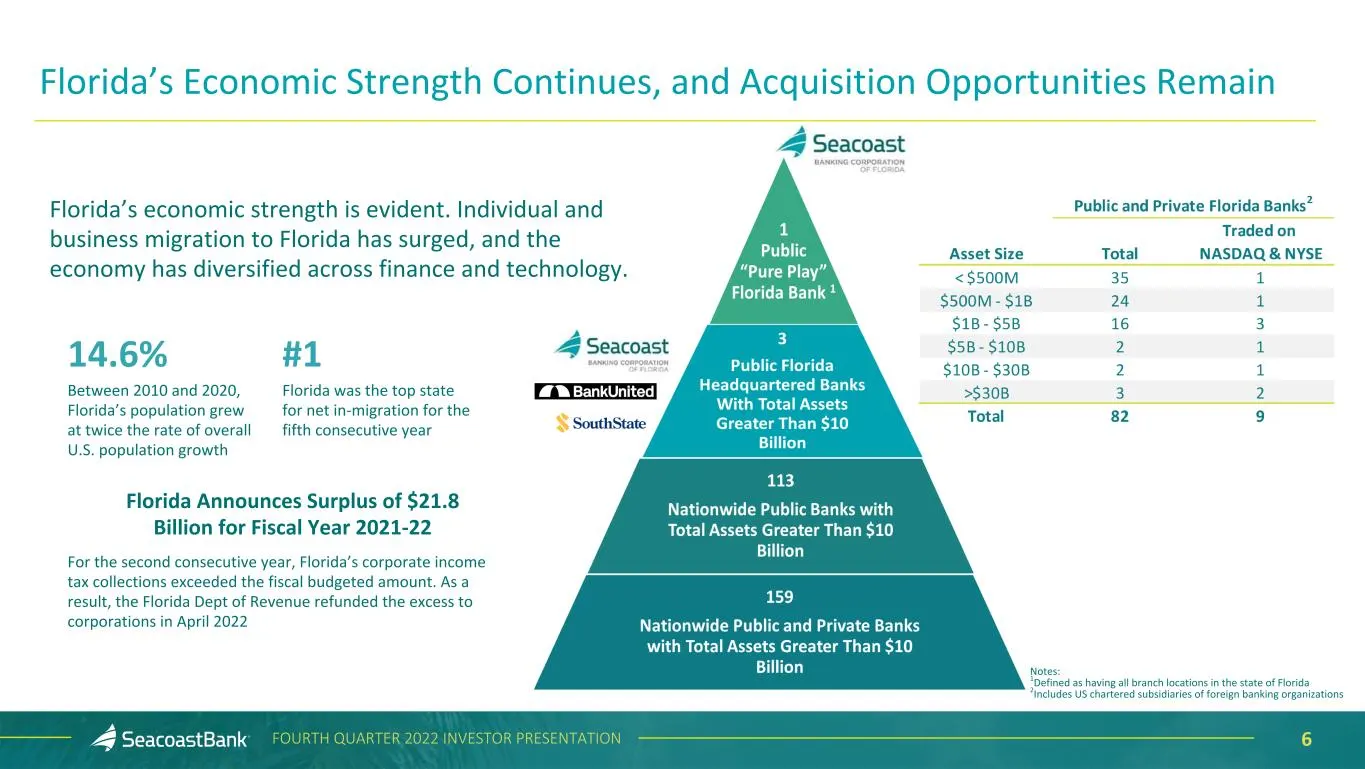
Slide 6: Florida's Economic Strength Continues, and Acquisition Opportunities Remain
6FOURTH QUARTER 2022 INVESTOR PRESENTATION Florida’s Economic Strength Continues, and Acquisition Opportunities Remain Florida’s economic strength is evident. Individual and business migration to Florida has surged, and the economy has diversified across finance and technology. 14.6% Between 2010 an
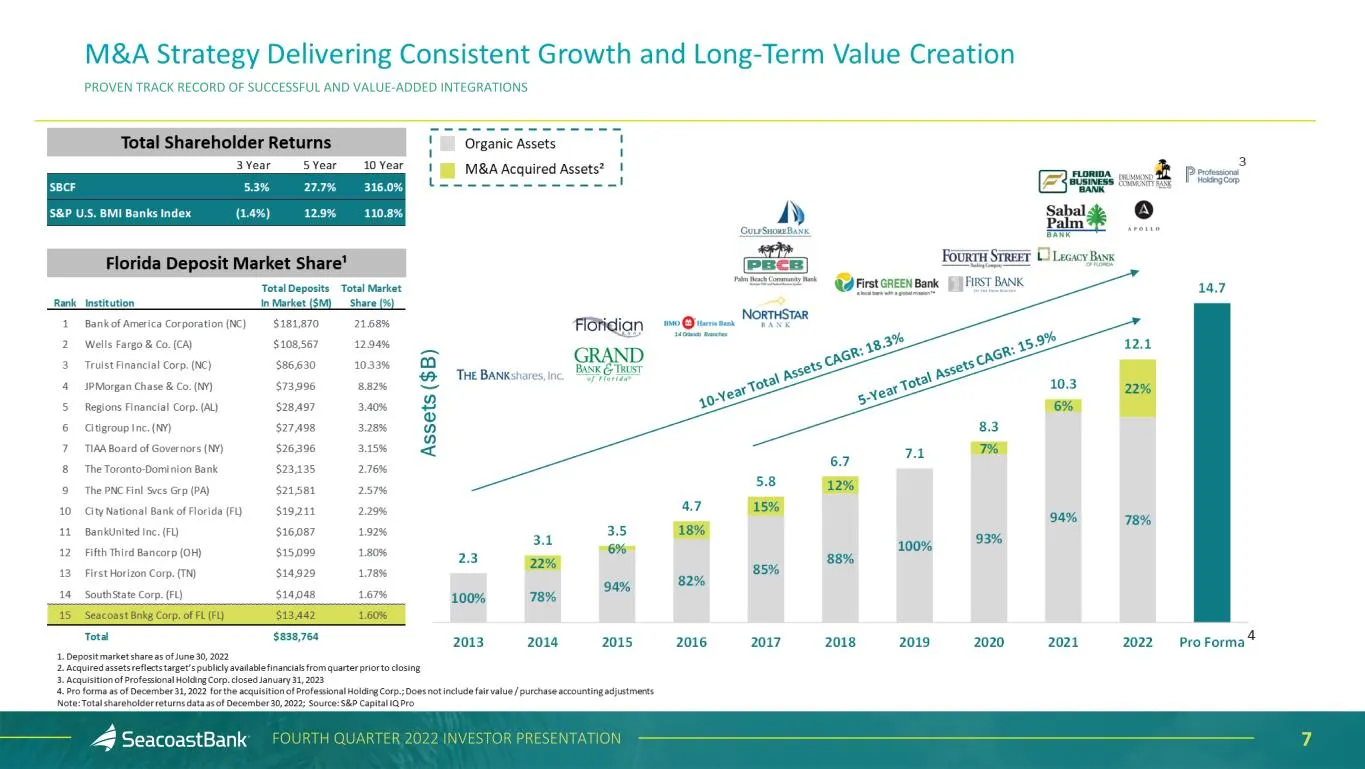
Slide 7: Proven Track Record of Successful and Value-Added Integrations
7FOURTH QUARTER 2022 INVESTOR PRESENTATION PROVEN TRACK RECORD OF SUCCESSFUL AND VALUE-ADDED INTEGRATIONS
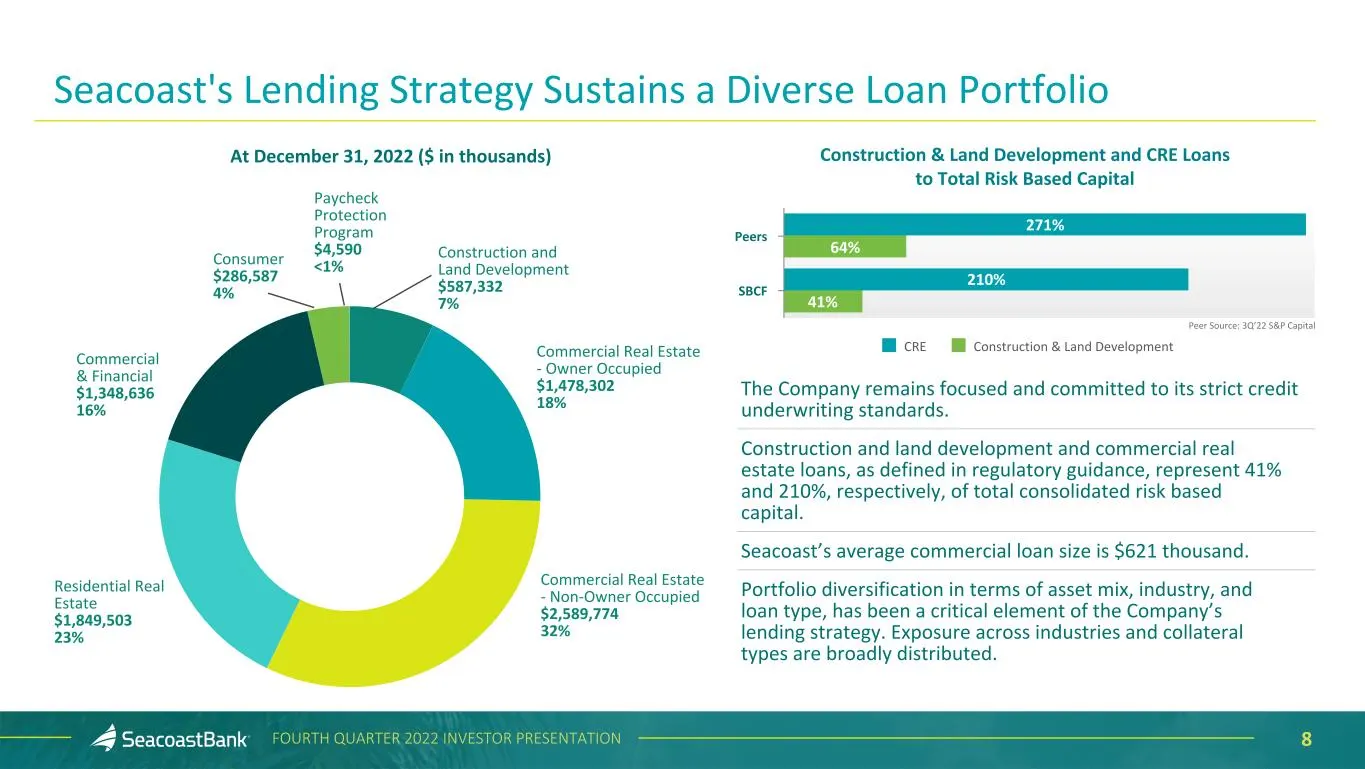
Slide 8: Seacoast's Lending Strategy Sustains a Diverse Loan Portfolio
8FOURTH QUARTER 2022 INVESTOR PRESENTATION Commercial Real Estate - Owner Occupied $1,478,302 18% Construction and Land Development $587,332 7% Paycheck Protection Program $4,590 <1%Consumer $286,587 4% Commercial & Financial $1,348,636 16% Commercial Real Estate - Non-Owner Occupied $2,589,774 32%
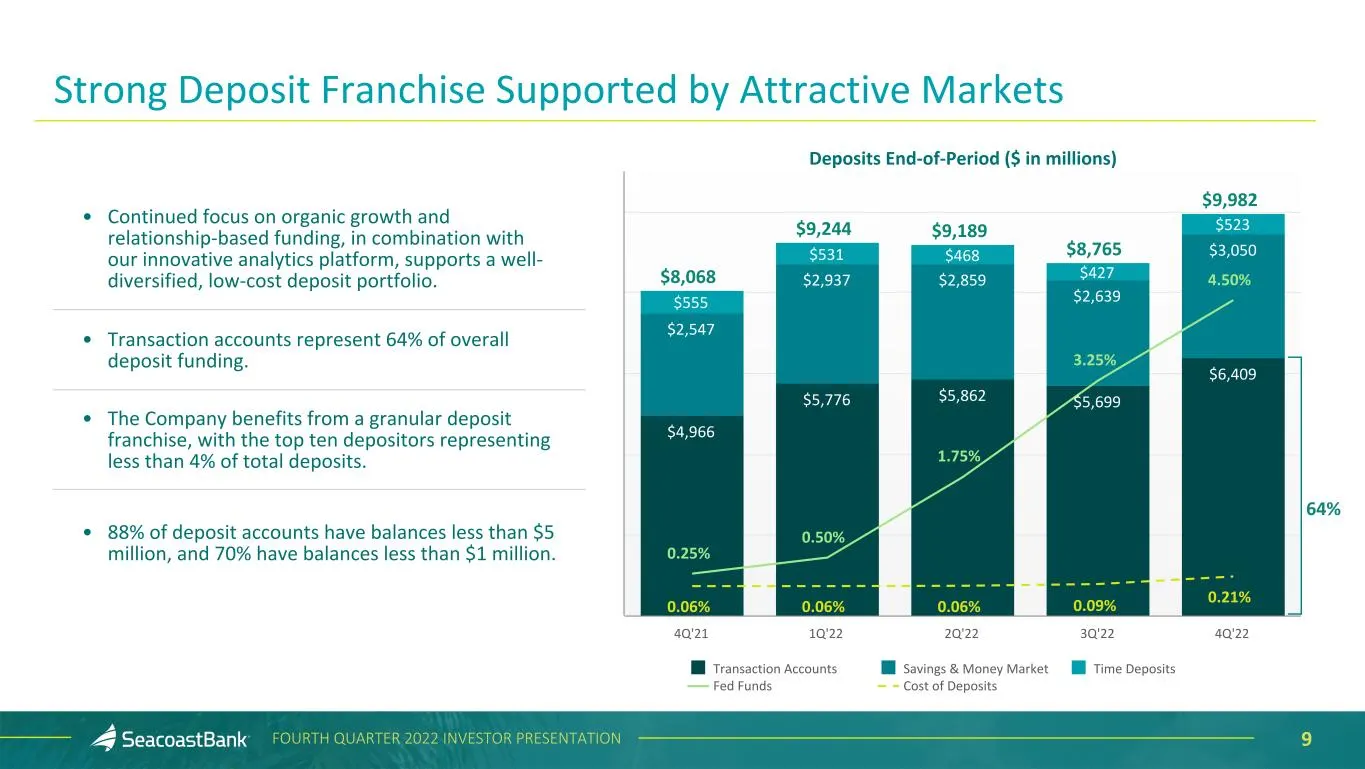
Slide 9: Strong Deposit Franchise Supported by Attractive Markets
9FOURTH QUARTER 2022 INVESTOR PRESENTATION 64% Deposits End-of-Period ($ in millions) $8,068 $9,244 $9,189 $8,765 $9,982 $4,966 $5,776 $5,862 $5,699 $6,409 $2,547 $2,937 $2,859 $2,639 $3,050 $555 $531 $468 $427 $523 0.25% 0.50% 1.75% 3.25% 4.50% 0.06% 0.06% 0.06% 0.09% 0.21% Transaction Accounts Sav
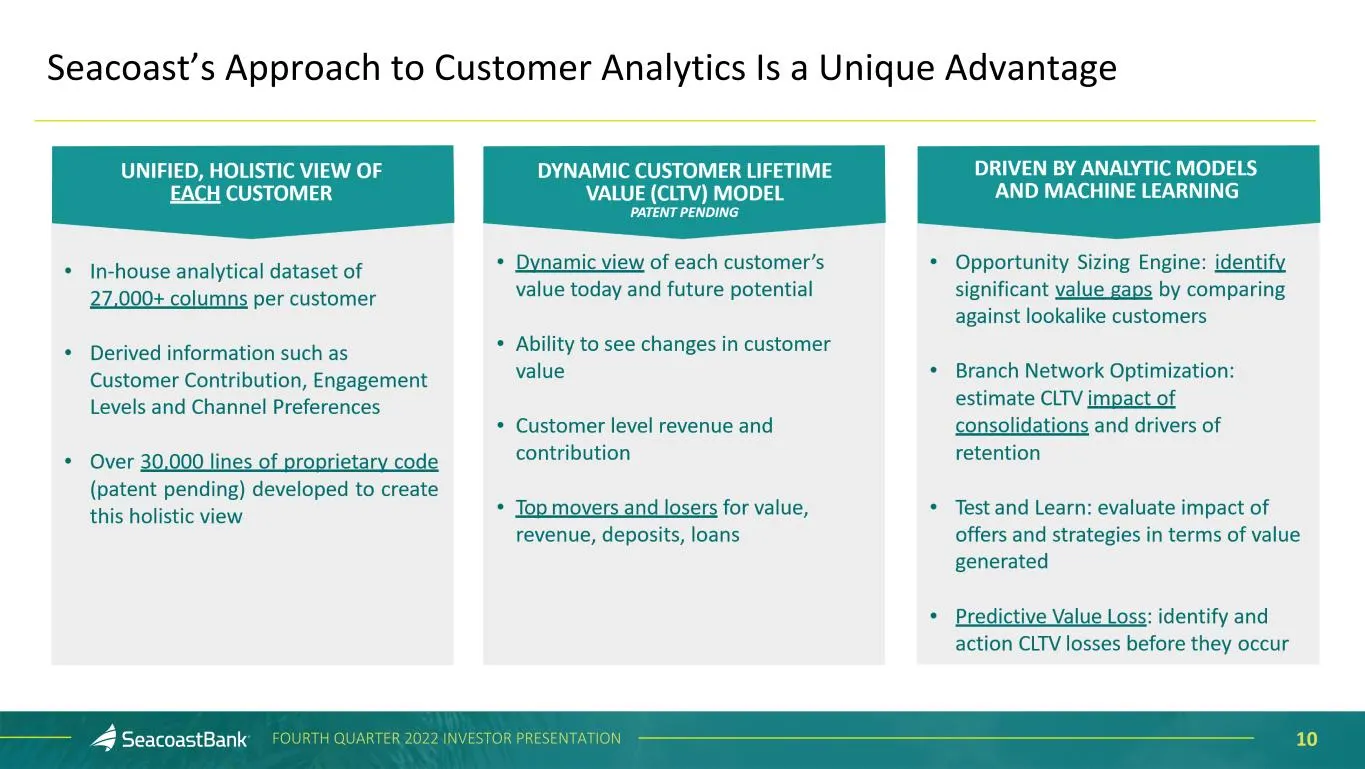
Slide 10: Seacoast's Approach to Customer Analytics Is a Unique Advantage
10FOURTH QUARTER 2022 INVESTOR PRESENTATION Seacoast’s Approach to Customer Analytics Is a Unique Advantage
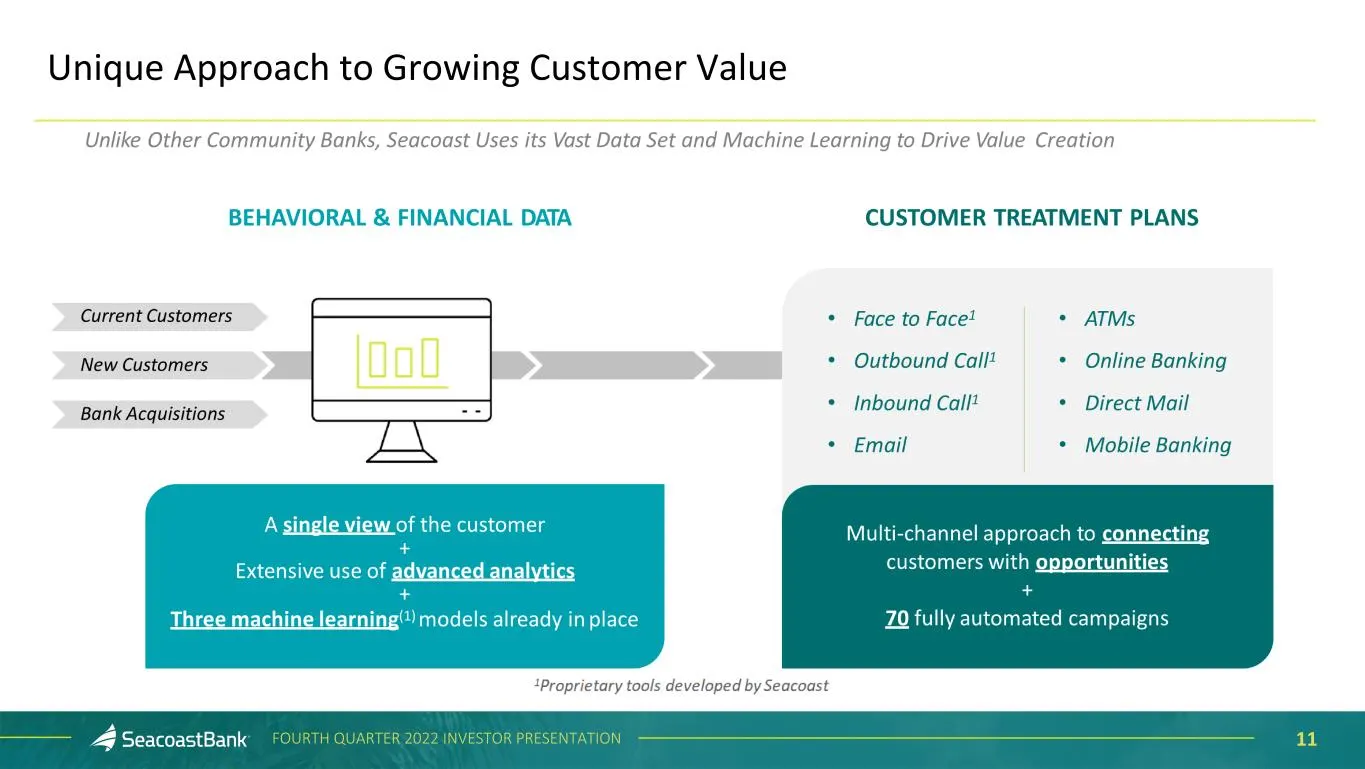
Slide 11: Unique Approach to Growing Customer Value
11FOURTH QUARTER 2022 INVESTOR PRESENTATION Unique Approach to Growing Customer Value
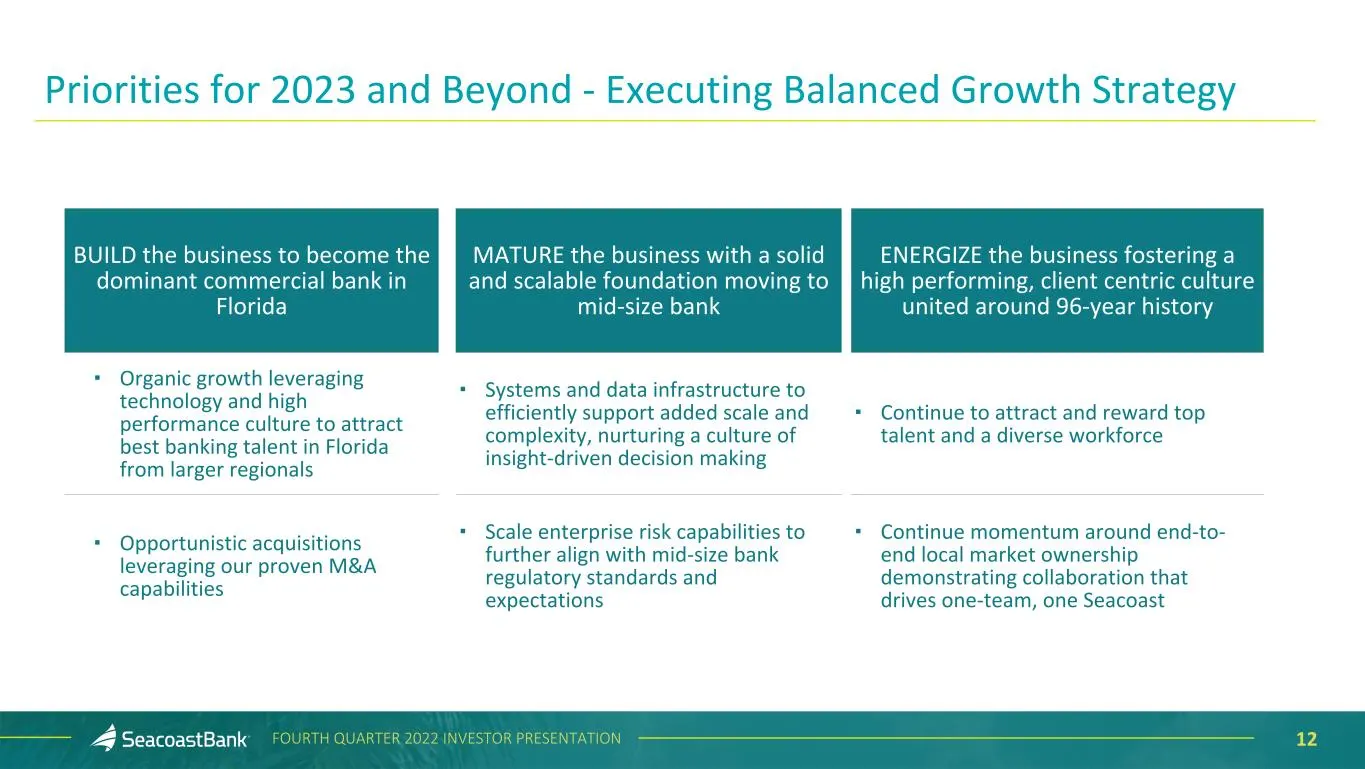
Slide 12: Priorities for 2023 and Beyond - Executing Balanced Growth Strategy
12FOURTH QUARTER 2022 INVESTOR PRESENTATION Priorities for 2023 and Beyond - Executing Balanced Growth Strategy BUILD the business to become the dominant commercial bank in Florida ▪ Organic growth leveraging technology and high performance culture to attract best banking talent in Florida from larg
Slide 13: Outlook
AGENDA OUTLOOK
Slide 14: Key Principles to Driving Long-Term Shareholder Value
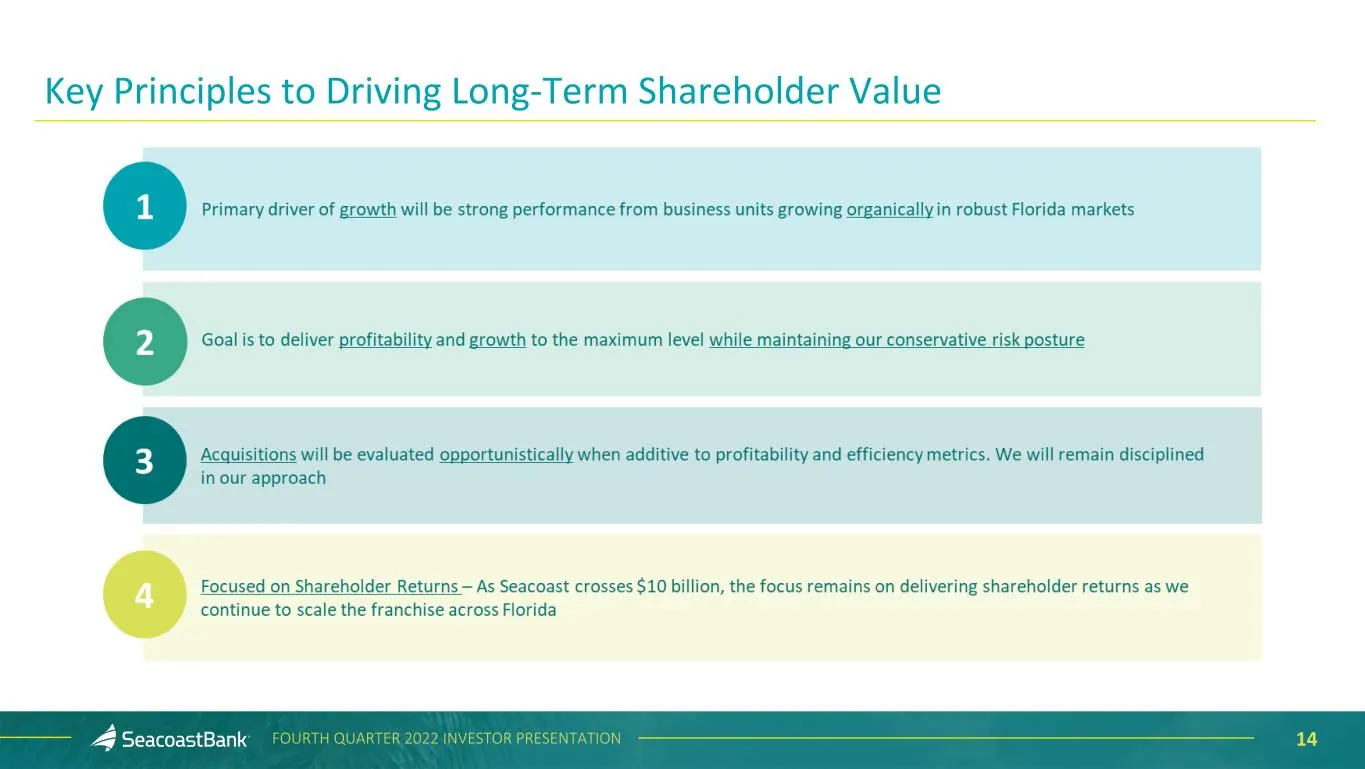
14FOURTH QUARTER 2022 INVESTOR PRESENTATION Key Principles to Driving Long-Term Shareholder Value
Slide 15: Company Performance
AGENDA COMPANY PERFORMANCE
Slide 16: Fourth Quarter 2022 Highlights
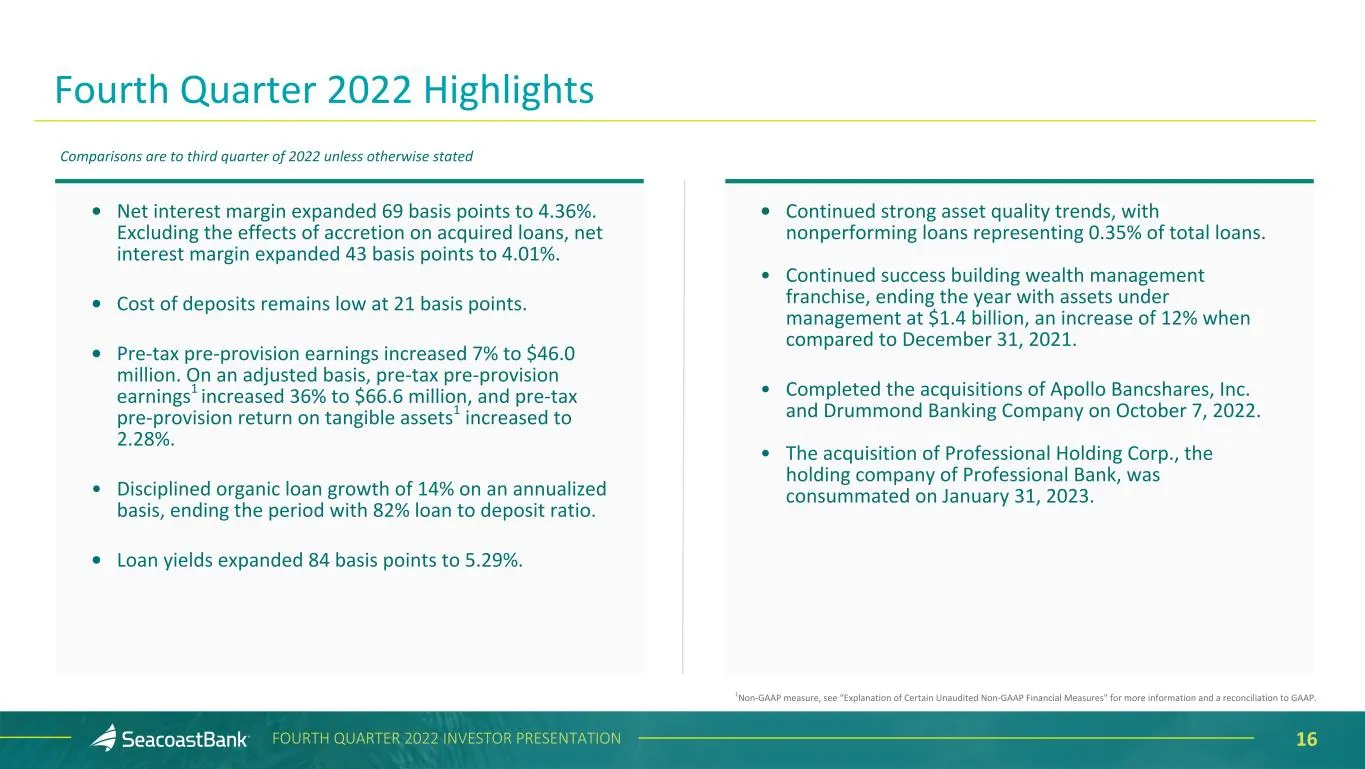
16FOURTH QUARTER 2022 INVESTOR PRESENTATION • Net interest margin expanded 69 basis points to 4.36%. Excluding the effects of accretion on acquired loans, net interest margin expanded 43 basis points to 4.01%. • Cost of deposits remains low at 21 basis points. • Pre-tax pre-provision earnings increa
Slide 17: Significant Expansion in Net Interest Margin and Net Interest Income
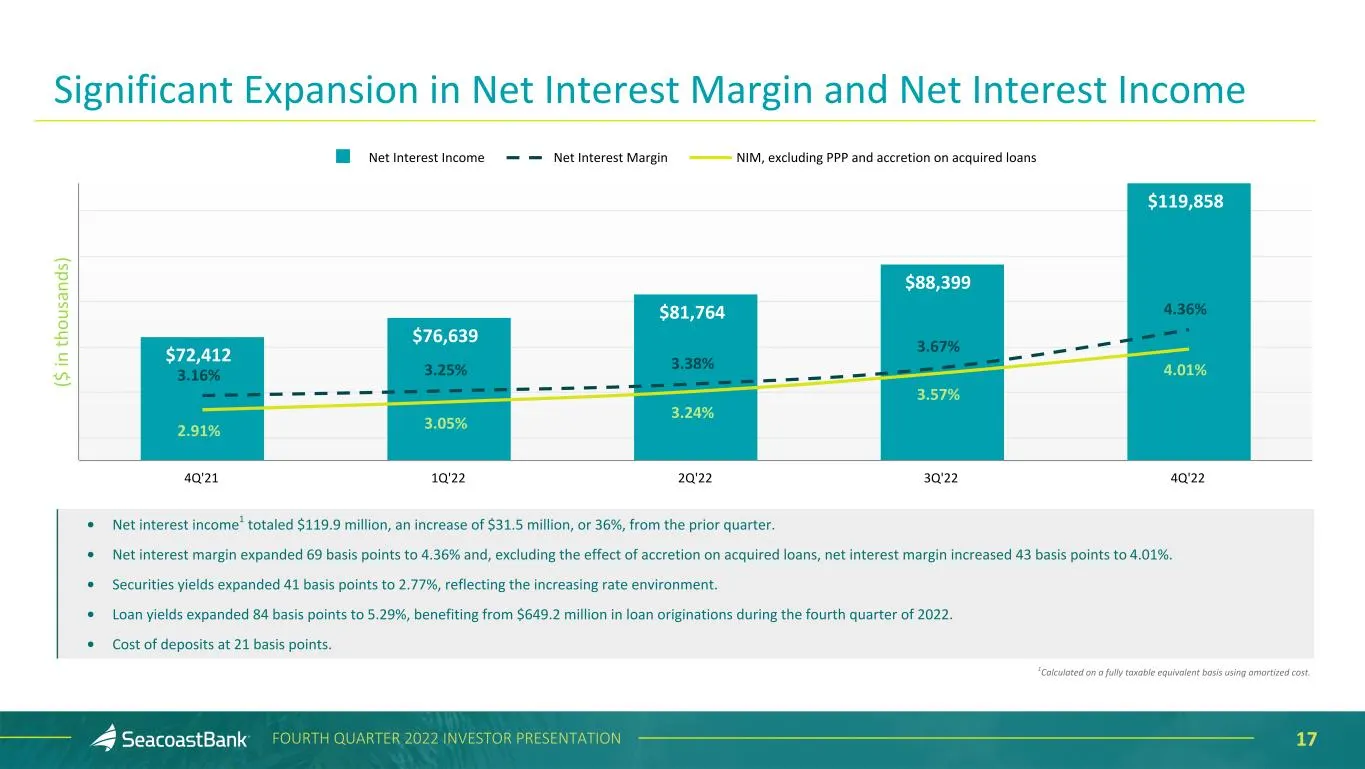
17FOURTH QUARTER 2022 INVESTOR PRESENTATION Significant Expansion in Net Interest Margin and Net Interest Income ($ in th ou sa nd s) $72,412 $76,639 $81,764 $88,399 $119,858 3.16% 3.25% 3.38% 3.67% 4.36% 2.91% 3.05% 3.24% 3.57% 4.01% Net Interest Income Net Interest Margin NIM, excluding PPP and ac
Slide 18: Noninterest Income
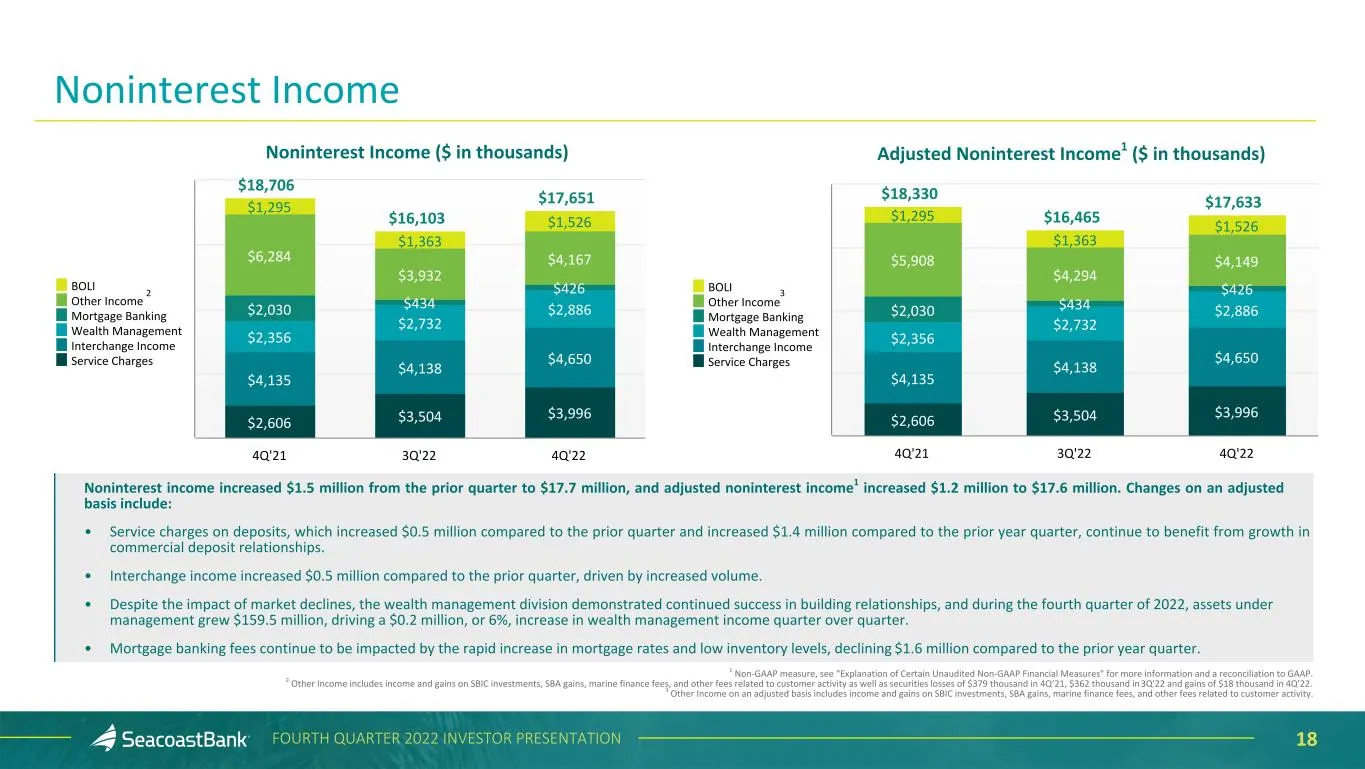
18FOURTH QUARTER 2022 INVESTOR PRESENTATION $18,330 $16,465 $17,633 $2,606 $3,504 $3,996 $4,135 $4,138 $4,650 $2,356 $2,732 $2,886$2,030 $434 $426 $5,908 $4,294 $4,149 $1,295 $1,363 $1,526 BOLI Other Income Mortgage Banking Wealth Management Interchange Income Service Charges 4Q'21 3Q'22 4Q'22 $18,7
Slide 19: Noninterest Expense
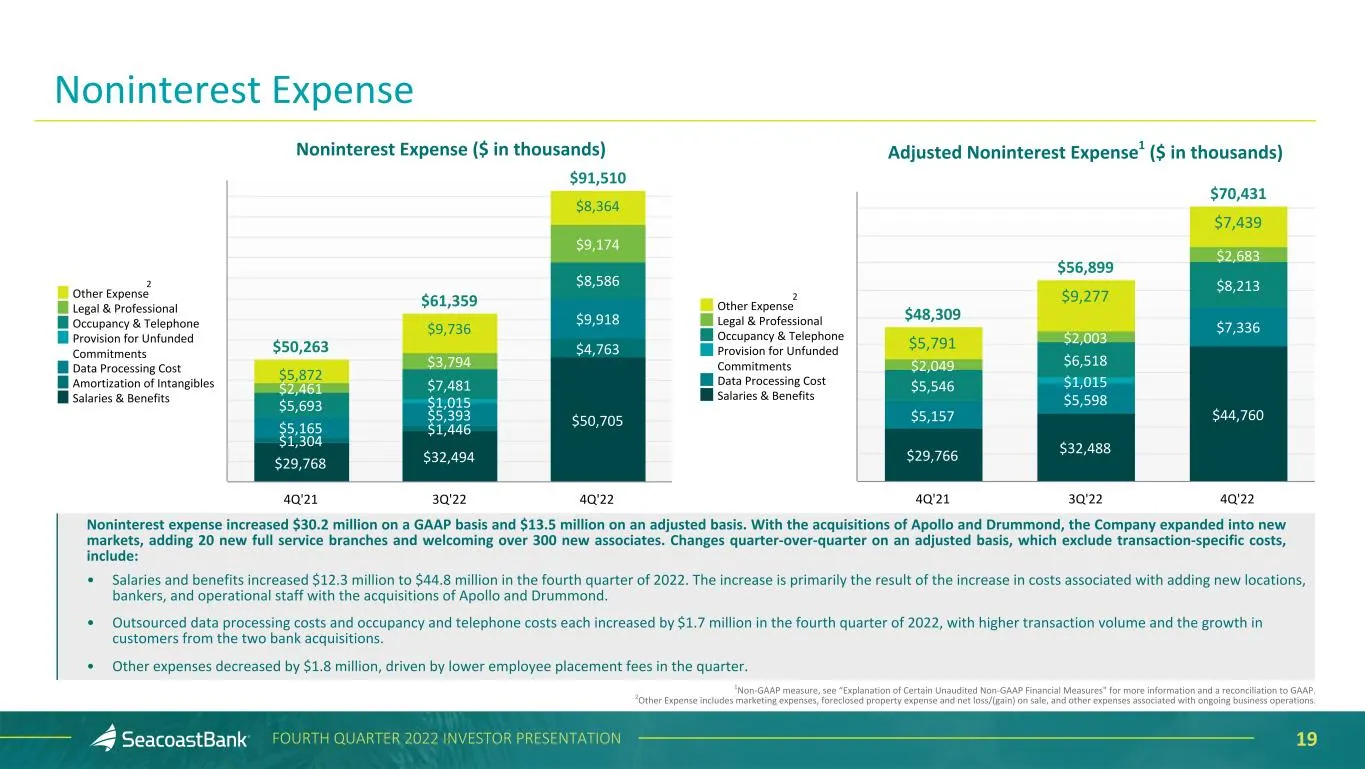
19FOURTH QUARTER 2022 INVESTOR PRESENTATION $48,309 $56,899 $70,431 $29,766 $32,488 $44,760$5,157 $5,598 $7,336 $1,015$5,546 $6,518 $8,213 $2,049 $2,003 $2,683 $5,791 $9,277 $7,439 Other Expense Legal & Professional Occupancy & Telephone Provision for Unfunded Commitments Data Processing Cost Salari
Slide 20: Efficiency Ratio Trend - Continued Focus on Disciplined Expense Control
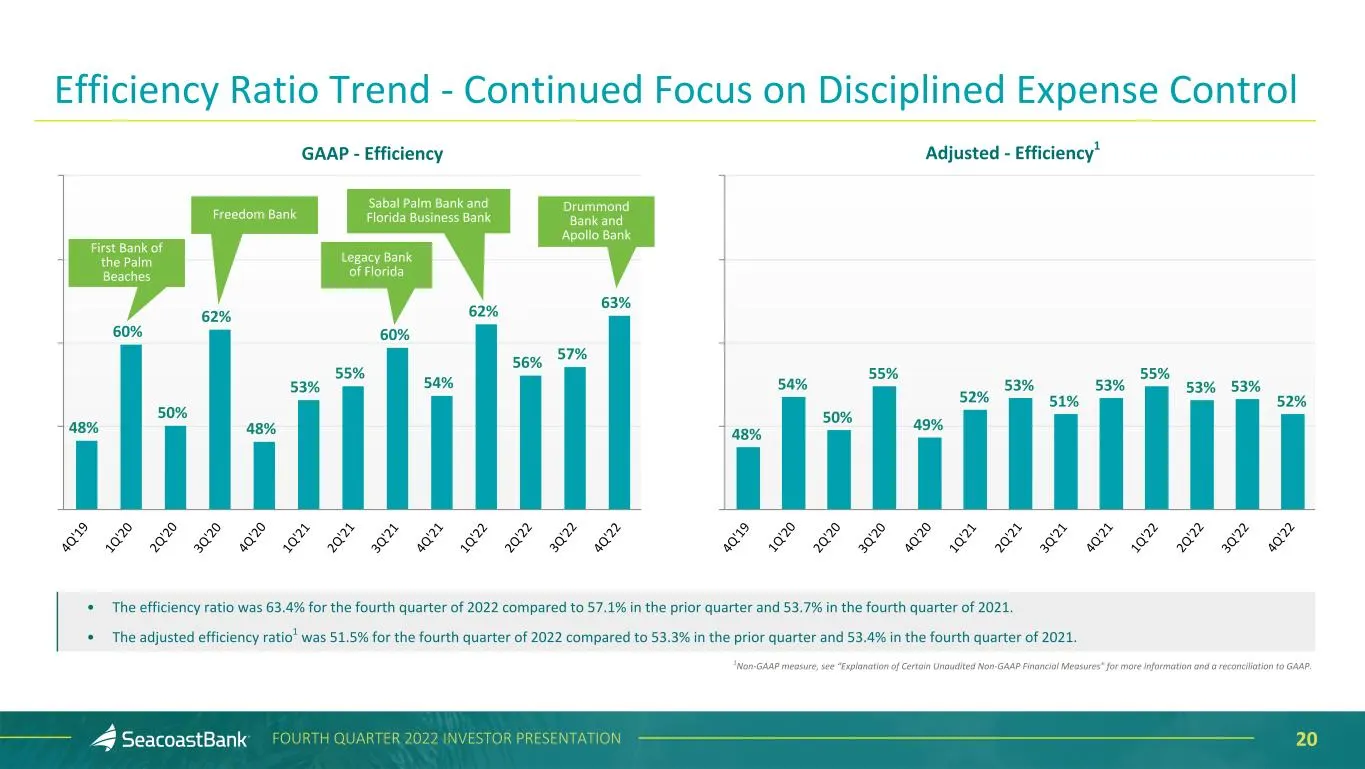
20FOURTH QUARTER 2022 INVESTOR PRESENTATION Efficiency Ratio Trend - Continued Focus on Disciplined Expense Control Pa lm B ea ch C om m un ity a nd N or th S ta r Ba nk A cq ui si tio n 48% 60% 50% 62% 48% 53% 55% 60% 54% 62% 56% 57% 63% 4Q '19 1Q '20 2Q '20 3Q '20 4Q '20 1Q '21 2Q '21 3Q '21 4Q '2
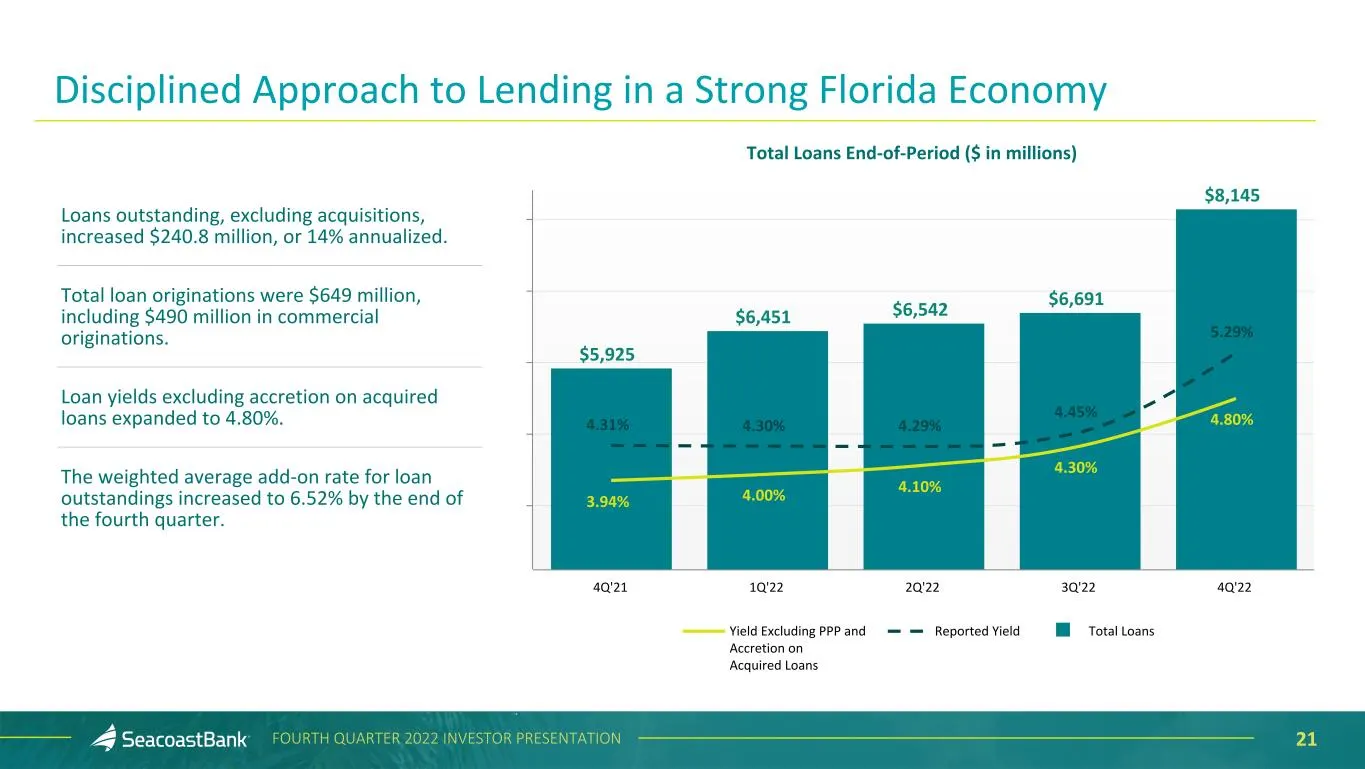
Slide 21: Disciplined Approach to Lending in a Strong Florida Economy
21FOURTH QUARTER 2022 INVESTOR PRESENTATION $5,925 $6,451 $6,542 $6,691 $8,145 4.31% 4.30% 4.29% 4.45% 5.29% 3.94% 4.00% 4.10% 4.30% 4.80% Yield Excluding PPP and Accretion on Acquired Loans Reported Yield Total Loans 4Q'21 1Q'22 2Q'22 3Q'22 4Q'22 Total Loans End-of-Period ($ in millions) Discipline
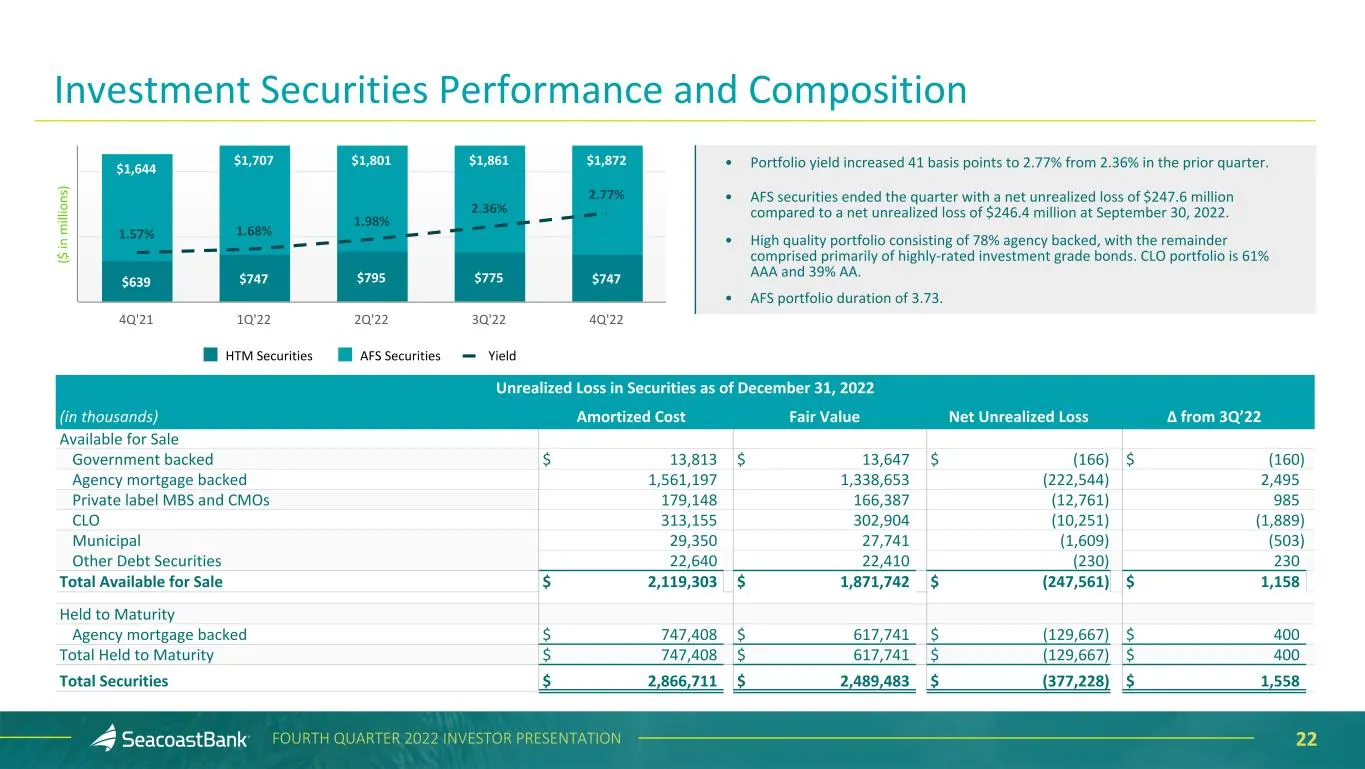
Slide 22: Investment Securities Performance and Composition
22FOURTH QUARTER 2022 INVESTOR PRESENTATION Investment Securities Performance and Composition Unrealized Loss in Securities as of December 31, 2022 (in thousands) Amortized Cost Fair Value Net Unrealized Loss Δ from 3Q’22 Available for Sale Government backed $ 13,813 $ 13,647 $ (166) $ (160) Agency
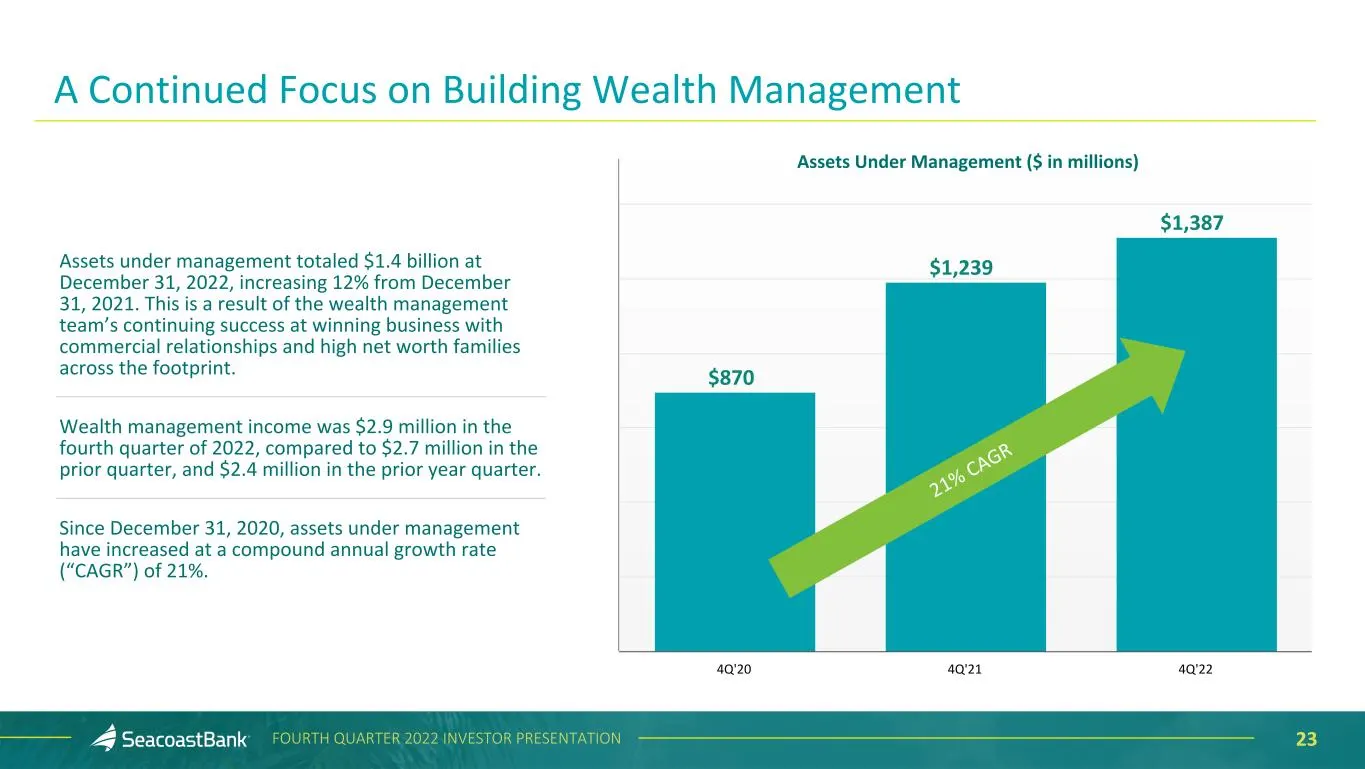
Slide 23: Continued Focus on Building Wealth Management
23FOURTH QUARTER 2022 INVESTOR PRESENTATION $870 $1,239 $1,387 4Q'20 4Q'21 4Q'22 Assets Under Management ($ in millions) 21% CA GR A Continued Focus on Building Wealth Management Assets under management totaled $1.4 billion at December 31, 2022, increasing 12% from December 31, 2021. This is a resul
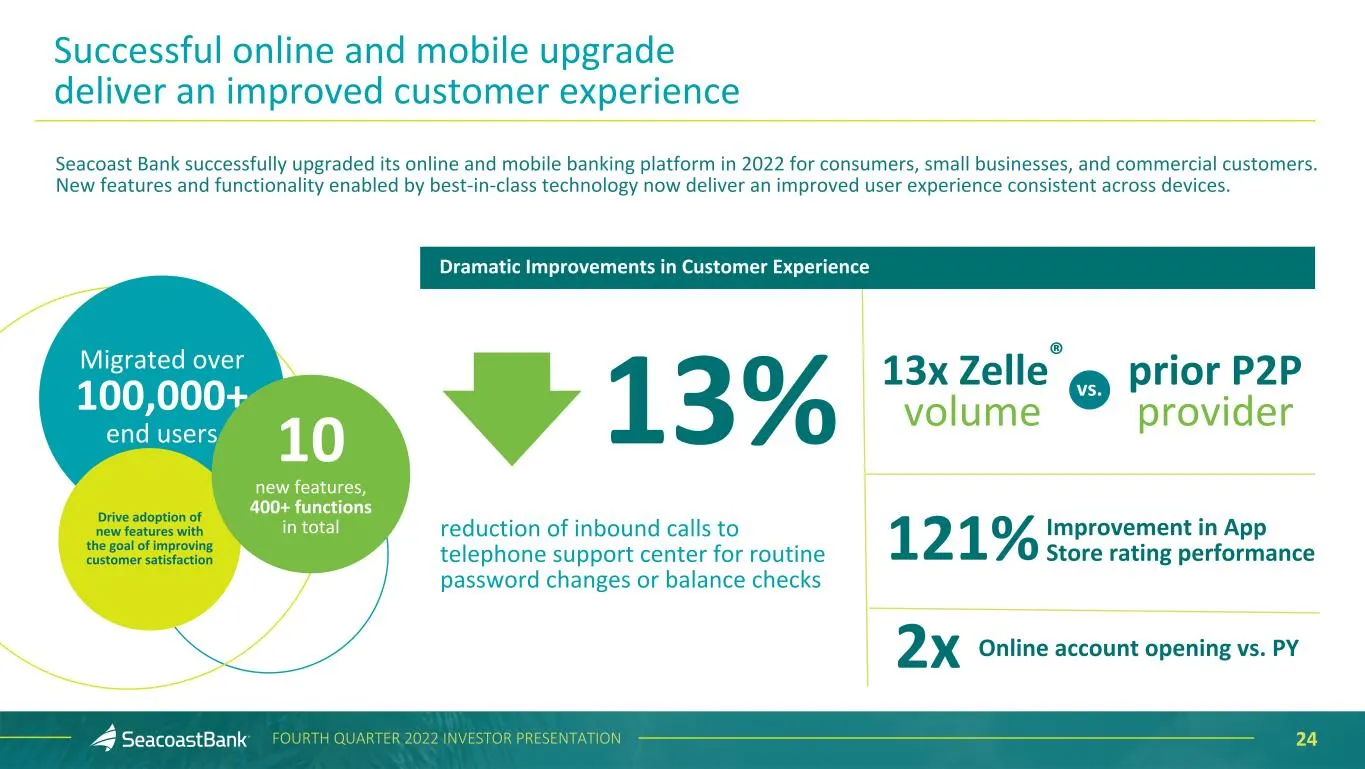
Slide 24: Successful Online and Mobile Upgrade Deliver an Improved Customer Experience
24FOURTH QUARTER 2022 INVESTOR PRESENTATION Successful online and mobile upgrade deliver an improved customer experience 121%reduction of inbound calls to telephone support center for routine password changes or balance checks Improvement in App Store rating performance Seacoast Bank successfully up
Slide 25: Allowance for Credit Losses and Purchase Discount
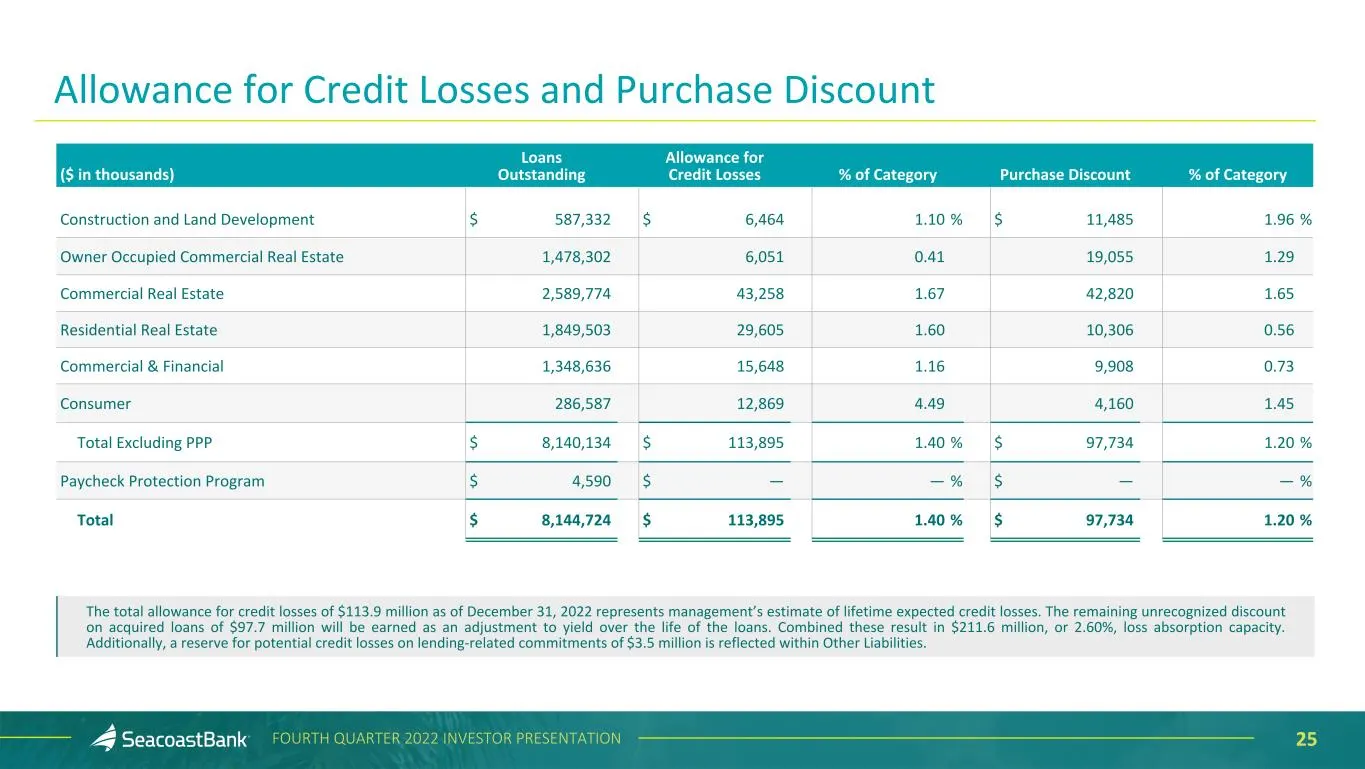
25FOURTH QUARTER 2022 INVESTOR PRESENTATION Allowance for Credit Losses and Purchase Discount ($ in thousands) Loans Outstanding Allowance for Credit Losses % of Category Purchase Discount % of Category Construction and Land Development $ 587,332 $ 6,464 1.10 % $ 11,485 1.96 % Owner Occupied Commerc
Slide 26: Continued Strong Asset Quality Trends
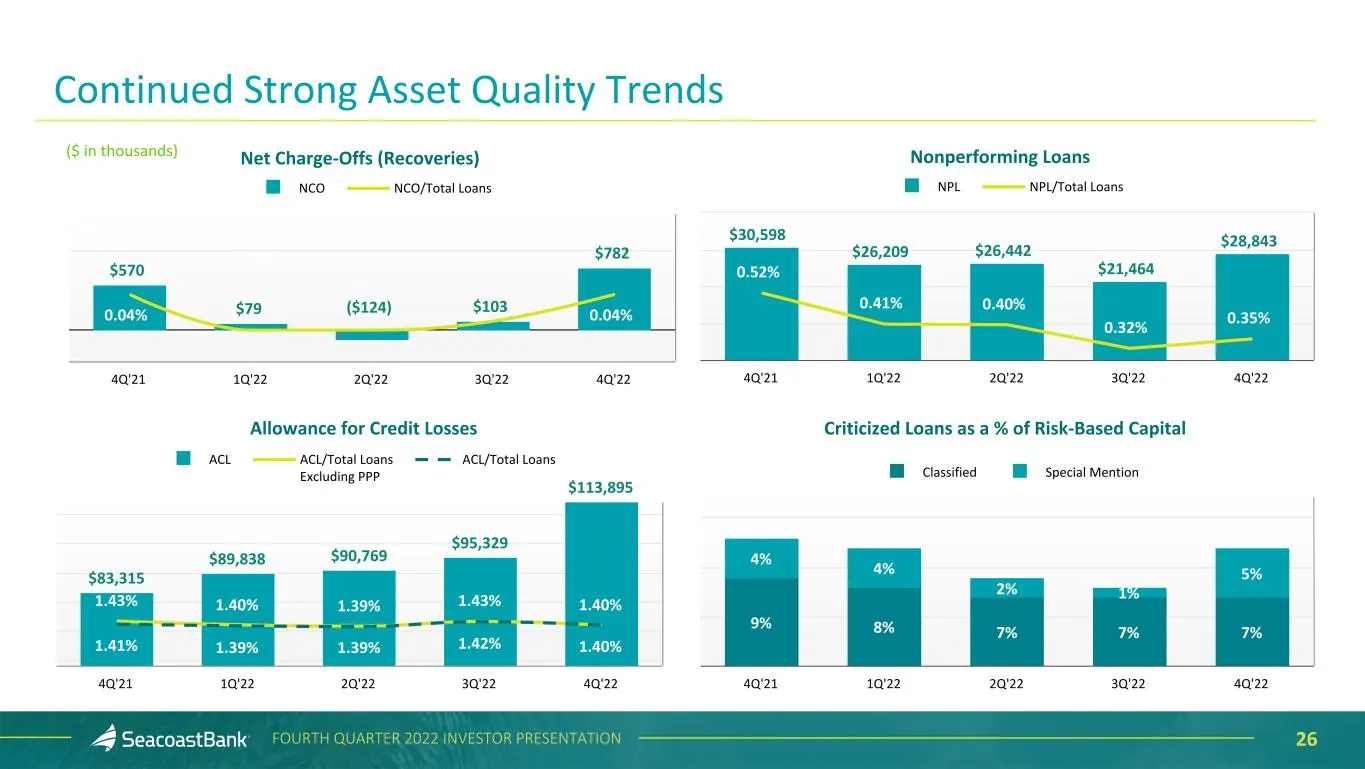
26FOURTH QUARTER 2022 INVESTOR PRESENTATION Net Charge-Offs (Recoveries) $570 $79 $103 $782 0.04% 0.04% NCO NCO/Total Loans 4Q'21 1Q'22 2Q'22 3Q'22 4Q'22 ($ in thousands) Nonperforming Loans $30,598 $26,209 $26,442 $21,464 $28,843 0.52% 0.41% 0.40% 0.32% 0.35% NPL NPL/Total Loans 4Q'21 1Q'22 2Q'22 3
Slide 27: Strong Capital Position and Tangible Book Value
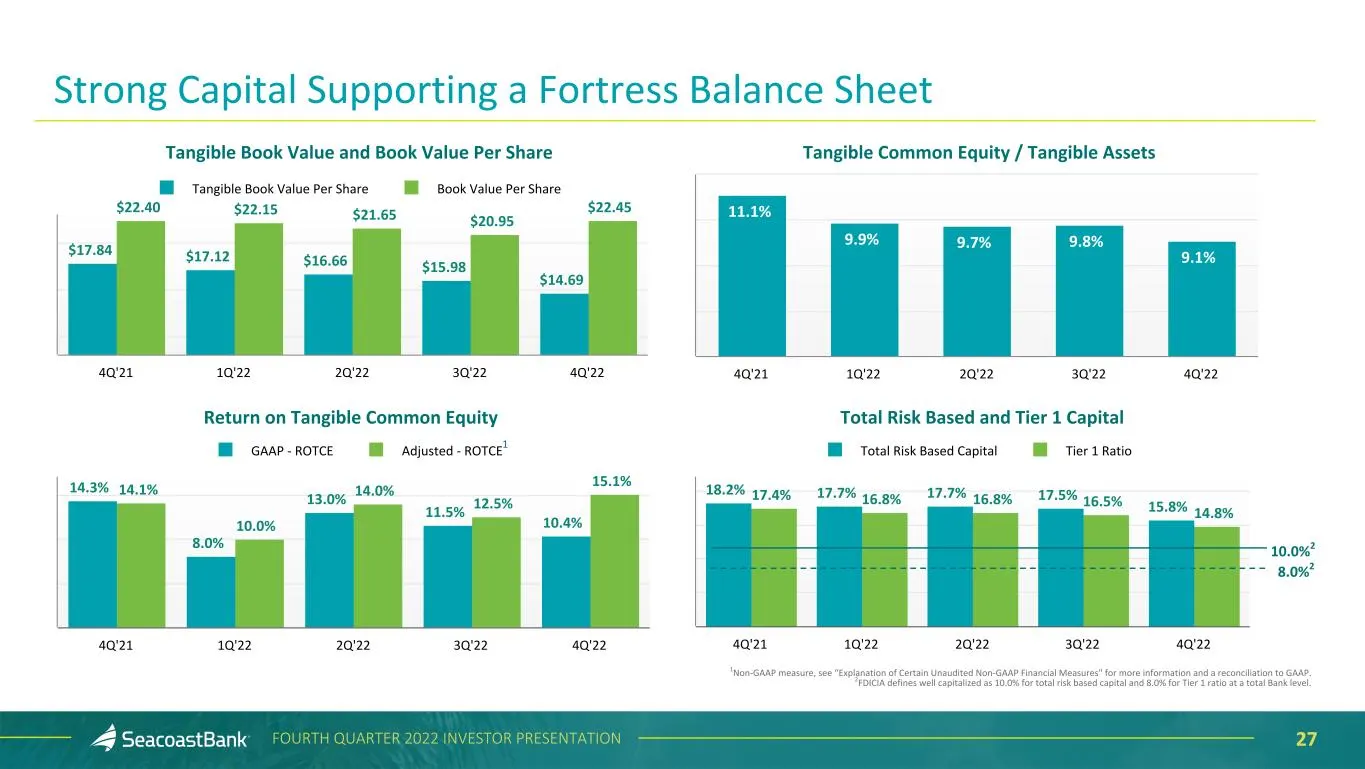
27FOURTH QUARTER 2022 INVESTOR PRESENTATION $17.84 $17.12 $16.66 $15.98 $14.69 $22.40 $22.15 $21.65 $20.95 $22.45 Tangible Book Value Per Share Book Value Per Share 4Q'21 1Q'22 2Q'22 3Q'22 4Q'22 11.1% 9.9% 9.7% 9.8% 9.1% 4Q'21 1Q'22 2Q'22 3Q'22 4Q'22 18.2% 17.7% 17.7% 17.5% 15.8% 17.4% 16.8% 16.8% 1
Slide 28: Investor Relations
Michael Young SVP, Treasurer & Director of Investor Relations [email protected] (772) 403-0451 INVESTOR RELATIONS NASDAQ: SBCF
Slide 29: Appendix
29FOURTH QUARTER 2022 INVESTOR PRESENTATION Appendix
Slide 30: Low Historical Deposit Beta Coupled with Favorable Deposit Composition
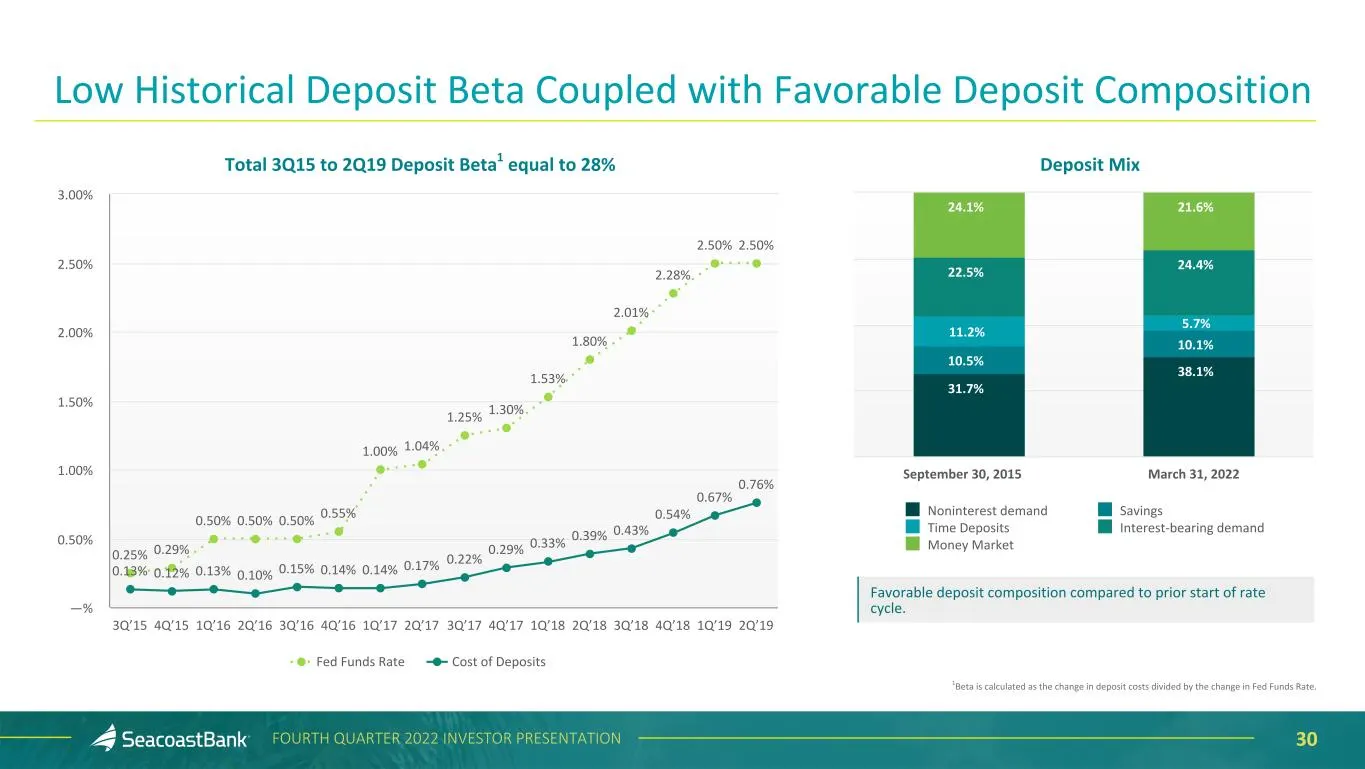
30FOURTH QUARTER 2022 INVESTOR PRESENTATION Low Historical Deposit Beta Coupled with Favorable Deposit Composition 0.25% 0.29% 0.50% 0.50% 0.50% 0.55% 1.00% 1.04% 1.25% 1.30% 1.53% 1.80% 2.01% 2.28% 2.50% 2.50% 0.13% 0.12% 0.13% 0.10% 0.15% 0.14% 0.14% 0.17% 0.22% 0.29% 0.33% 0.39% 0.43% 0.54% 0.67%
Slide 31: Quarterly Trend: Pipelines and Originations
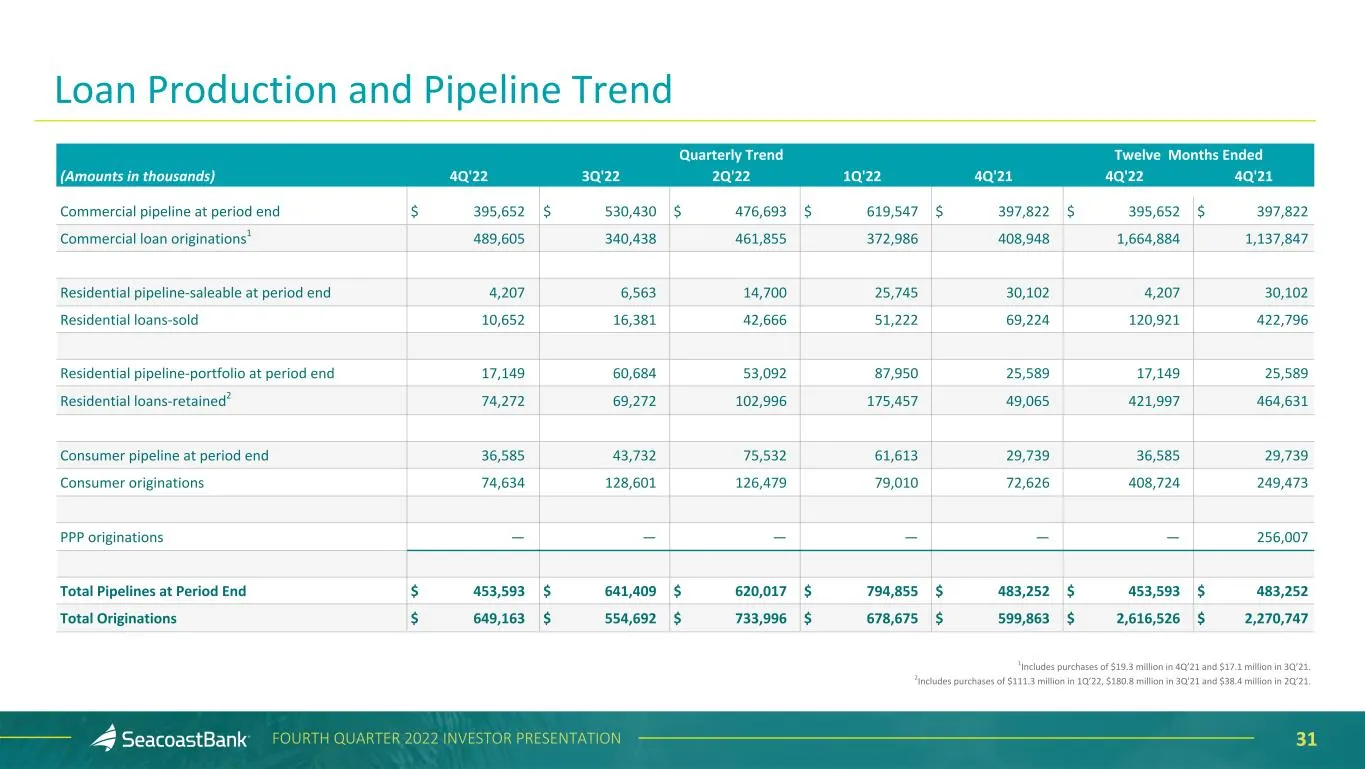
31FOURTH QUARTER 2022 INVESTOR PRESENTATION Quarterly Trend Twelve Months Ended (Amounts in thousands) 4Q'22 3Q'22 2Q'22 1Q'22 4Q'21 4Q'22 4Q'21 Commercial pipeline at period end $ 395,652 $ 530,430 $ 476,693 $ 619,547 $ 397,822 $ 395,652 $ 397,822 Commercial loan originations1 489,605 340,438 461,8
Slide 32: Explanation of Certain Unaudited Non-GAAP Financial Measures
32FOURTH QUARTER 2022 INVESTOR PRESENTATION This presentation contains financial information determined by methods other than Generally Accepted Accounting Principles (“GAAP”). The financial highlights provide reconciliations between GAAP and adjusted financial measures including net income, noninte
Slide 33: Non-GAAP Reconciliation: Net Income and Noninterest Items
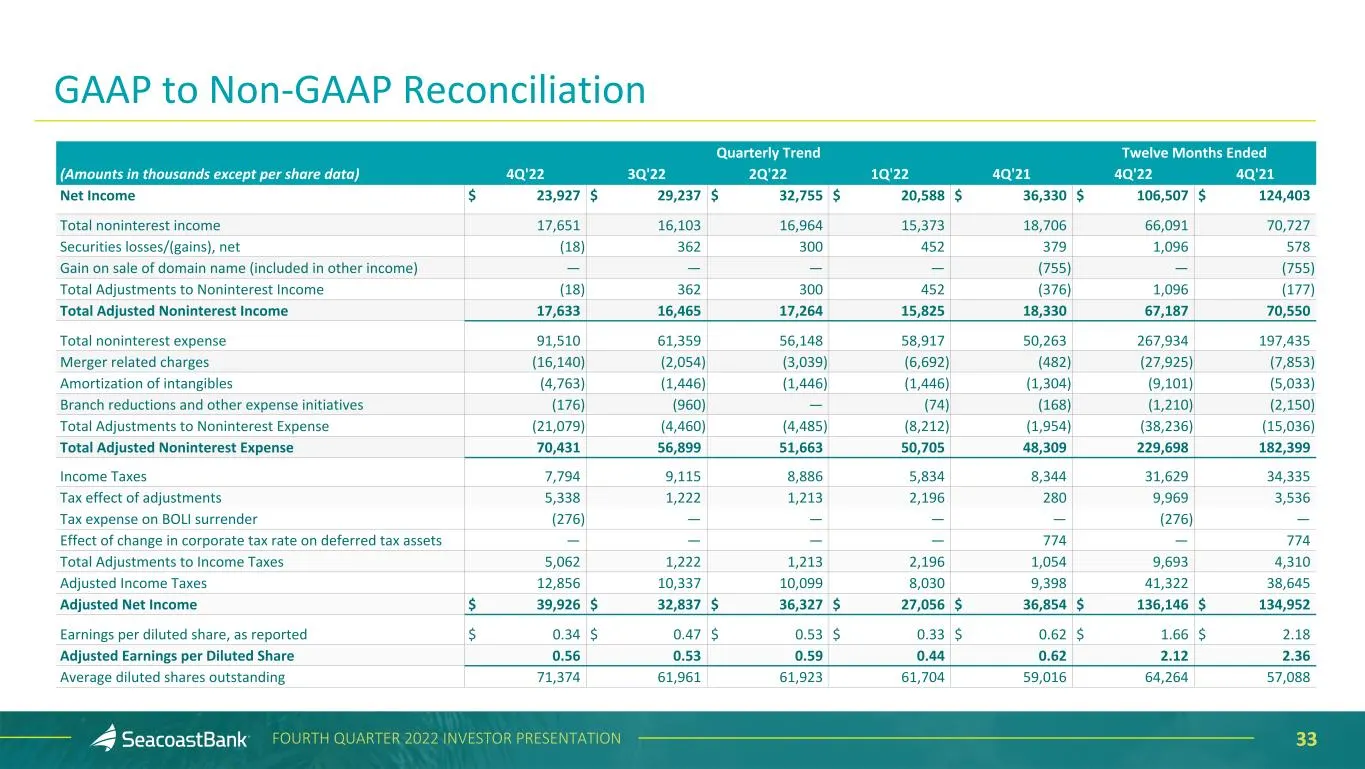
33FOURTH QUARTER 2022 INVESTOR PRESENTATION Quarterly Trend Twelve Months Ended (Amounts in thousands except per share data) 4Q'22 3Q'22 2Q'22 1Q'22 4Q'21 4Q'22 4Q'21 Net Income $ 23,927 $ 29,237 $ 32,755 $ 20,588 $ 36,330 $ 106,507 $ 124,403 Total noninterest income 17,651 16,103 16,964 15,373 18,7
Slide 34: Non-GAAP Reconciliation: Adjusted Efficiency Ratio
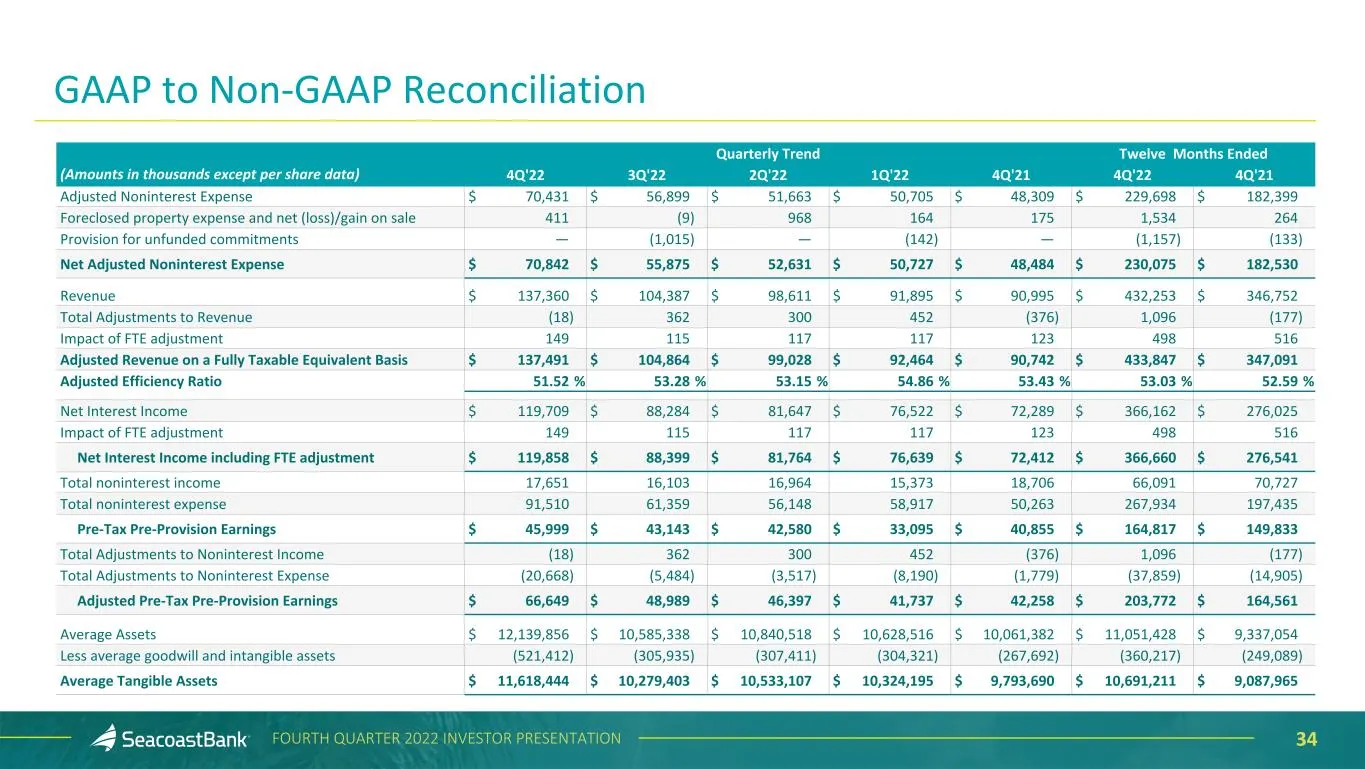
34FOURTH QUARTER 2022 INVESTOR PRESENTATION Quarterly Trend Twelve Months Ended (Amounts in thousands except per share data) 4Q'22 3Q'22 2Q'22 1Q'22 4Q'21 4Q'22 4Q'21 Adjusted Noninterest Expense $ 70,431 $ 56,899 $ 51,663 $ 50,705 $ 48,309 $ 229,698 $ 182,399 Foreclosed property expense and net (lo
Slide 35: Non-GAAP Reconciliation: Return on Assets and Tangible Equity
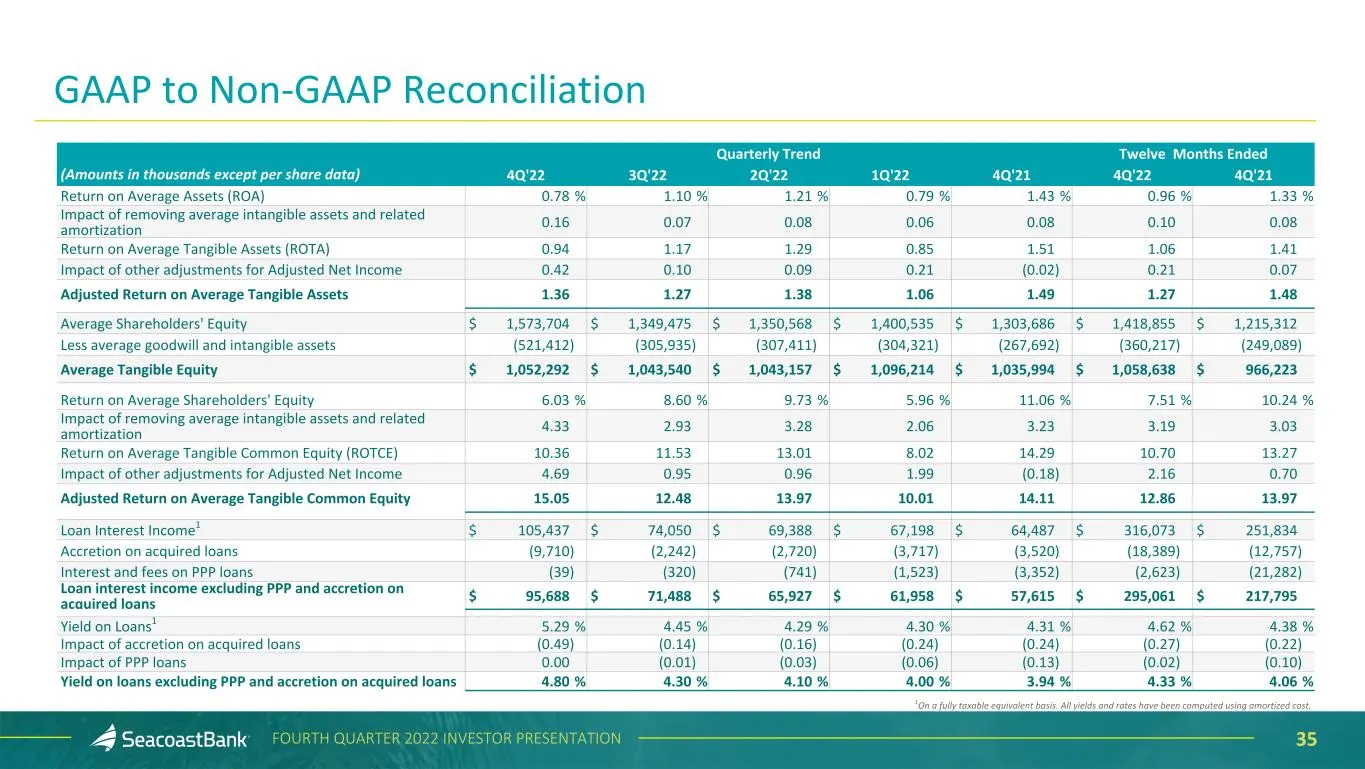
35FOURTH QUARTER 2022 INVESTOR PRESENTATION Quarterly Trend Twelve Months Ended (Amounts in thousands except per share data) 4Q'22 3Q'22 2Q'22 1Q'22 4Q'21 4Q'22 4Q'21 Return on Average Assets (ROA) 0.78 % 1.10 % 1.21 % 0.79 % 1.43 % 0.96 % 1.33 % Impact of removing average intangible assets and rela
Slide 36: Non-GAAP Reconciliation: Net Interest Income and Margin
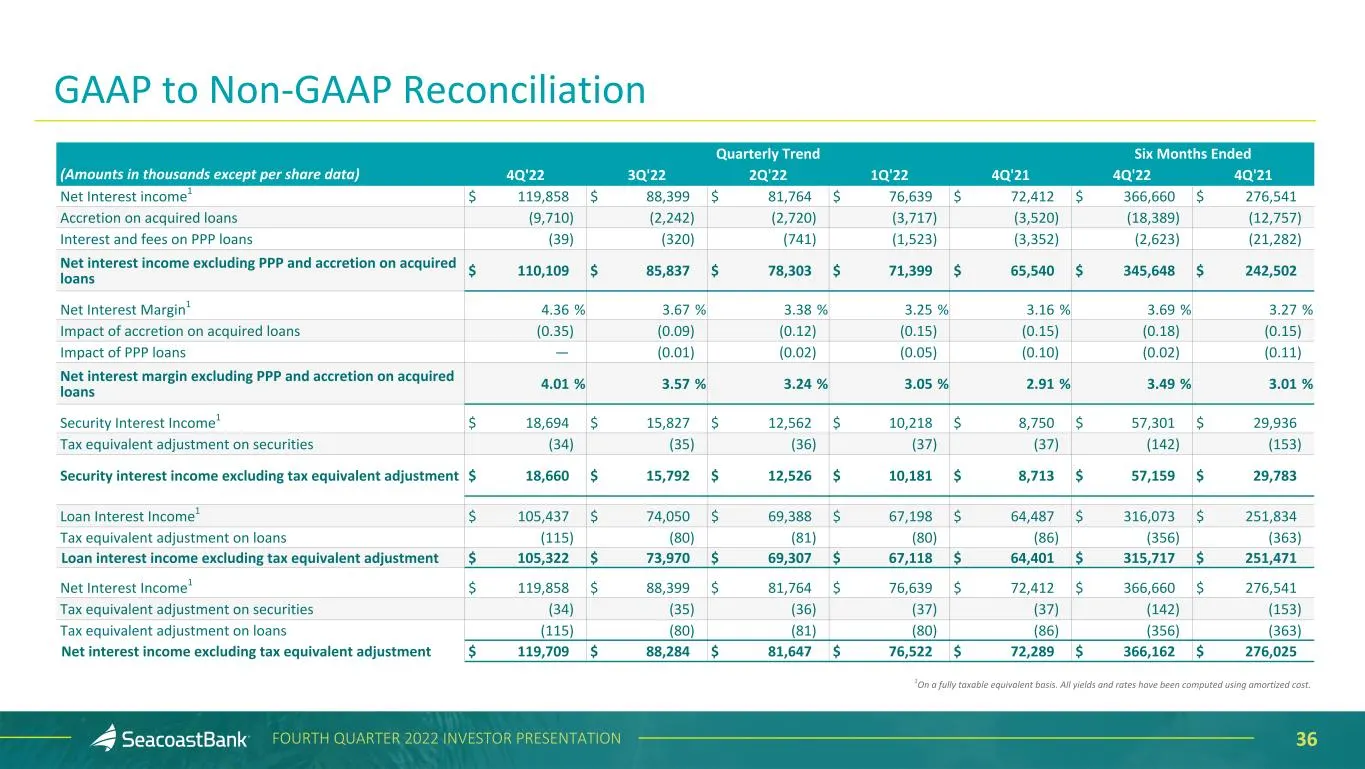
36FOURTH QUARTER 2022 INVESTOR PRESENTATION Quarterly Trend Six Months Ended (Amounts in thousands except per share data) 4Q'22 3Q'22 2Q'22 1Q'22 4Q'21 4Q'22 4Q'21 Net Interest income1 $ 119,858 $ 88,399 $ 81,764 $ 76,639 $ 72,412 $ 366,660 $ 276,541 Accretion on acquired loans (9,710) (2,242) (2,72
Source: SEC EDGAR · 8-K filed Mar 6, 2023
More decks from Seacoast Banking Corporation of Florida
 Seacoast Banking Corp of Florida — Q3 2026 Earnings Presentation35 slides · Nov 4, 2026
 Q3 2026 Earnings Presentation27 slides · Oct 27, 2026
 Seacoast Banking Corp of Florida — Q2 2026 Earnings Presentation34 slides · Sep 9, 2026
 Q2 2026 Earnings Presentation26 slides · Jul 29, 2026
 Seacoast Banking Corp of Florida — Investor Presentation (May 2026)34 slides · May 13, 2026
 Q1 2026 Earnings Presentation26 slides · Apr 29, 2026