Inland Real Estate — Investor Presentation (November 2010)
29 slides from Inland Real Estate's investor presentation, Nov 15, 2010
Slide 1: Investor Presentation Third Quarter 2010
Investor Presentation Third Quarter 2010 www.inlandrealestate.com NYSE: IRC November 2010
Slide 2: IRC Snapshot Profile
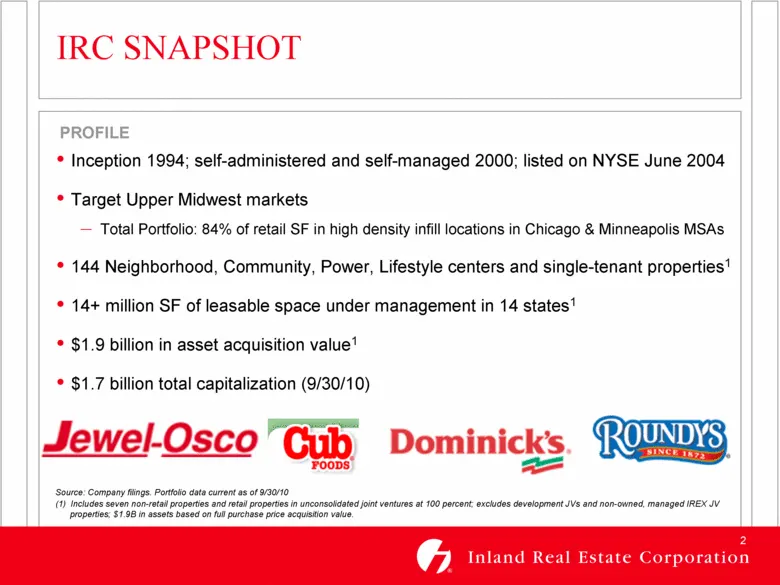
IRC SNAPSHOT PROFILE Inception 1994; self-administered and self-managed 2000; listed on NYSE June 2004 Target Upper Midwest markets Total Portfolio: 84% of retail SF in high density infill locations in Chicago & Minneapolis MSAs 144 Neighborhood, Community, Power, Lifestyle centers and single-tenant
Slide 3: Experienced Leadership Team
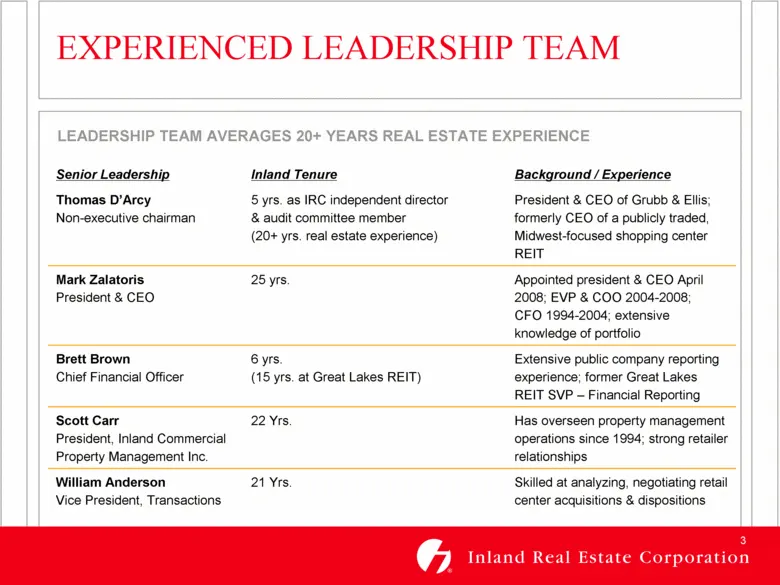
EXPERIENCED LEADERSHIP TEAM Senior Leadership Inland Tenure Background / Experience Thomas D’Arcy Non-executive chairman 5 yrs. as IRC independent director & audit committee member (20+ yrs. real estate experience) President & CEO of Grubb & Ellis; formerly CEO of a publicly traded, Midwest-focused
Slide 4: Operating Strategy
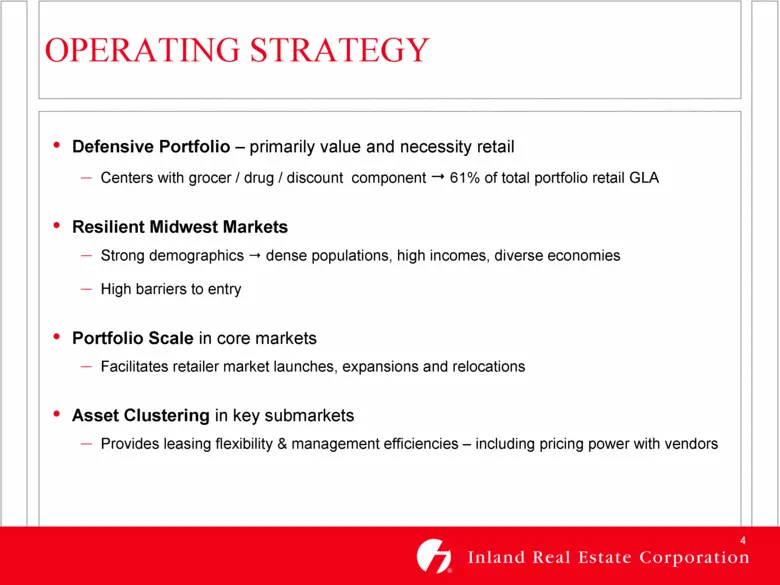
OPERATING STRATEGY Defensive Portfolio – primarily value and necessity retail Centers with grocer / drug / discount component 61% of total portfolio retail GLA Resilient Midwest Markets Strong demographics dense populations, high incomes, diverse economies High barriers to entry Portfolio Scale in c
Slide 5: Operating Strategy: Strong balance sheet focus
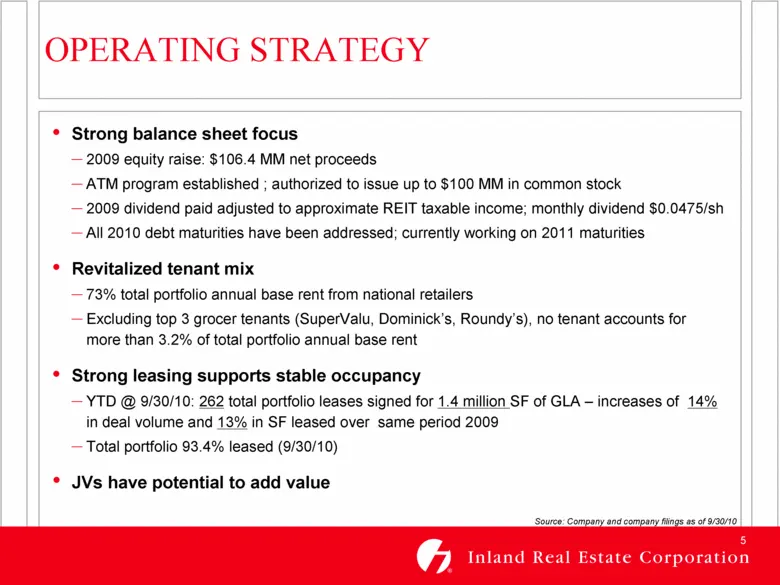
OPERATING STRATEGY Source: Company and company filings as of 9/30/10 Strong balance sheet focus 2009 equity raise: $106.4 MM net proceeds ATM program established ; authorized to issue up to $100 MM in common stock 2009 dividend paid adjusted to approximate REIT taxable income; monthly dividend $0.04
Slide 6: Core Markets: Chicago and Minneapolis
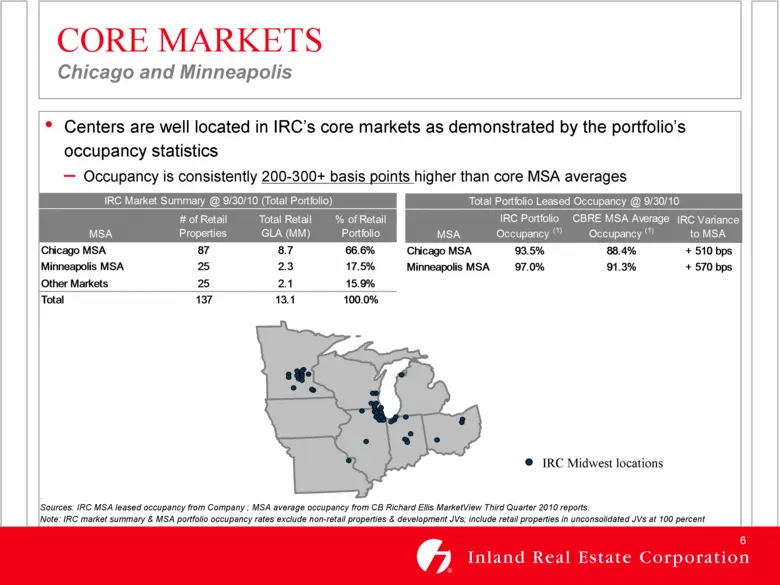
CORE MARKETS Chicago and Minneapolis Sources: IRC MSA leased occupancy from Company ; MSA average occupancy from CB Richard Ellis MarketView Third Quarter 2010 reports. Note: IRC market summary & MSA portfolio occupancy rates exclude non-retail properties & development JVs; include retail properties
Slide 7: Chicago Market Snapshot
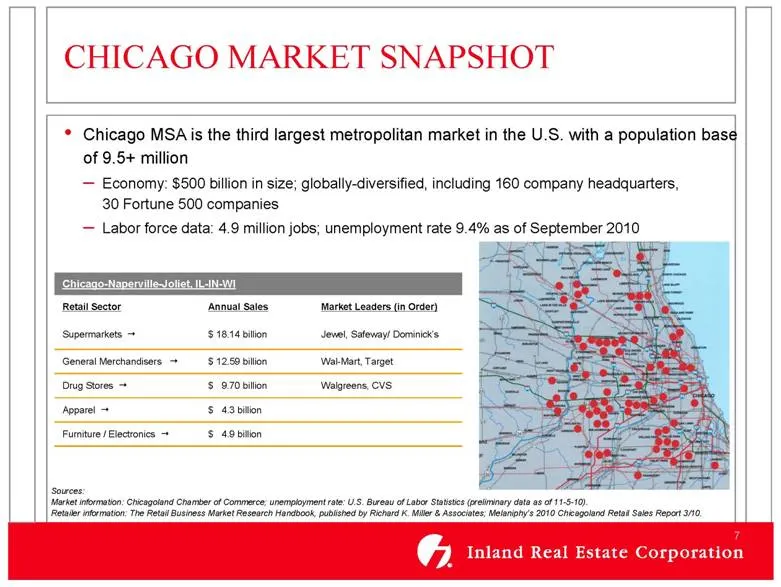
CHICAGO MARKET SNAPSHOT Sources: Market information: Chicagoland Chamber of Commerce; unemployment rate: U.S. Bureau of Labor Statistics (preliminary data as of 11-5-10). Retailer information: The Retail Business Market Research Handbook, published by Richard K. Miller & Associates; Melaniphy’s 2010
Slide 8: Chicago Market Shopping Center REIT Ownership
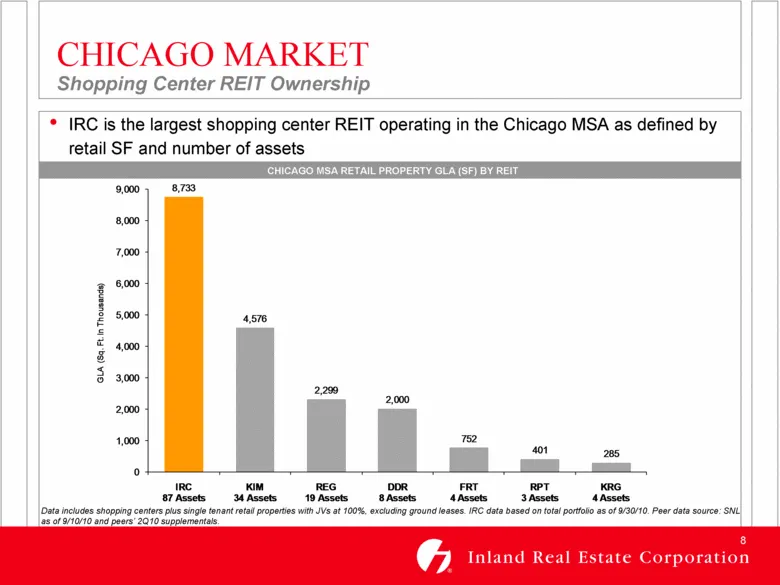
CHICAGO MARKET Shopping Center REIT Ownership Data includes shopping centers plus single tenant retail properties with JVs at 100%, excluding ground leases. IRC data based on total portfolio as of 9/30/10. Peer data source: SNL as of 9/10/10 and peers’ 2Q10 supplementals. IRC is the largest shopping
Slide 9: Minneapolis Market Snapshot
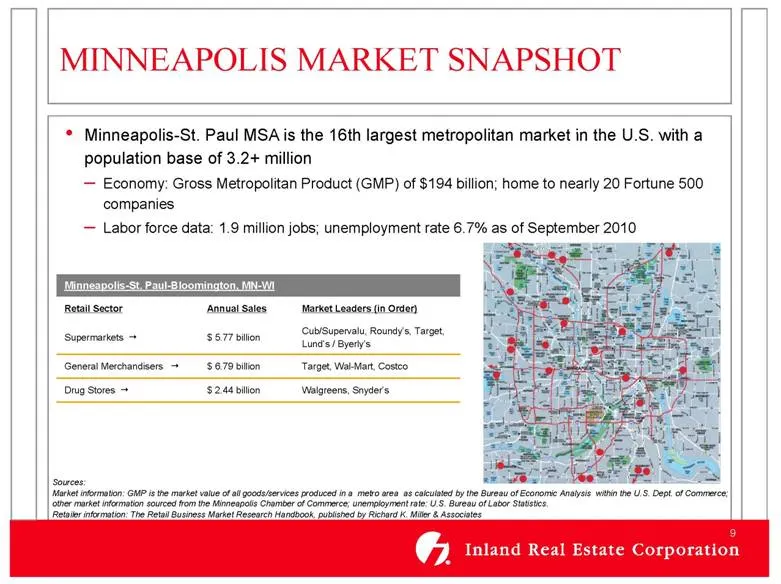
MINNEAPOLIS MARKET SNAPSHOT Sources: Market information: GMP is the market value of all goods/services produced in a metro area as calculated by the Bureau of Economic Analysis within the U.S. Dept. of Commerce; other market information sourced from the Minneapolis Chamber of Commerce; unemployment
Slide 10: Minneapolis Market Shopping Center REIT Ownership
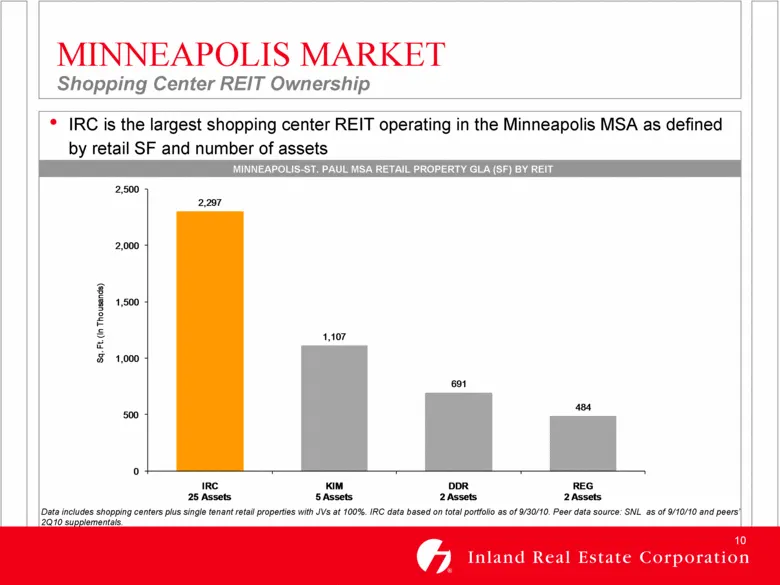
MINNEAPOLIS MARKET Shopping Center REIT Ownership IRC is the largest shopping center REIT operating in the Minneapolis MSA as defined by retail SF and number of assets MINNEAPOLIS-ST. PAUL MSA RETAIL PROPERTY GLA (SF) BY REIT Data includes shopping centers plus single tenant retail properties with J
Slide 11: Strong Market Demographics
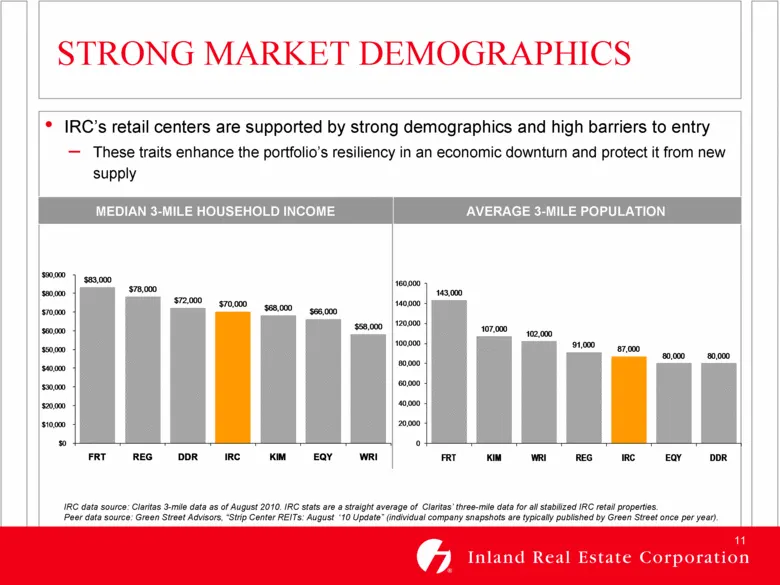
STRONG MARKET DEMOGRAPHICS IRC data source: Claritas 3-mile data as of August 2010. IRC stats are a straight average of Claritas’ three-mile data for all stabilized IRC retail properties. Peer data source: Green Street Advisors, “Strip Center REITs: August ‘10 Update” (individual company snapshots a
Slide 12: Total Portfolio Composition
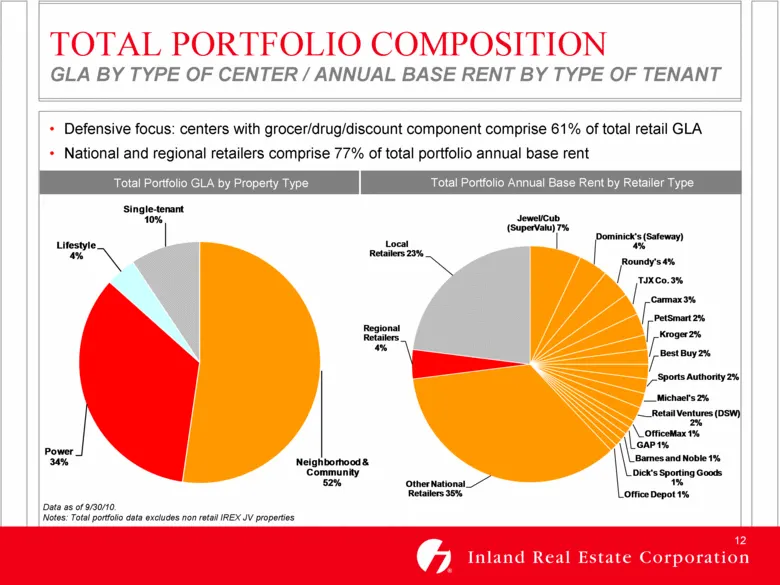
TOTAL PORTFOLIO COMPOSITION GLA BY TYPE OF CENTER / ANNUAL BASE RENT BY TYPE OF TENANT (1) Data as of 9/30/10. Notes: Total portfolio data excludes non retail IREX JV properties Defensive focus: centers with grocer/drug/discount component comprise 61% of total retail GLA National and regional retail
Slide 13: Diversified Tenant Base
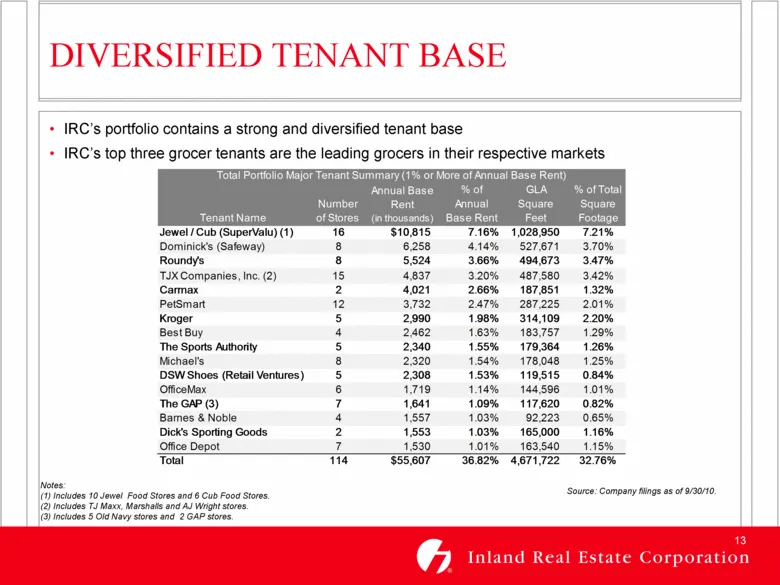
DIVERSIFIED TENANT BASE IRC’s portfolio contains a strong and diversified tenant base IRC’s top three grocer tenants are the leading grocers in their respective markets Notes: (1) Includes 10 Jewel Food Stores and 6 Cub Food Stores. (2) Includes TJ Maxx, Marshalls and AJ Wright stores. (3) Includes
Slide 14: Operating Fundamentals: Leasing and Rent Spreads
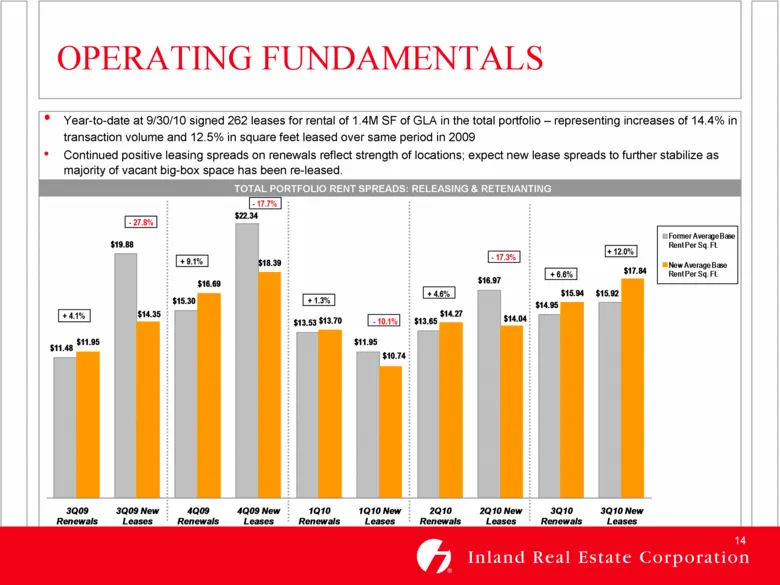
Year-to-date at 9/30/10 signed 262 leases for rental of 1.4M SF of GLA in the total portfolio – representing increases of 14.4% in transaction volume and 12.5% in square feet leased over same period in 2009 Continued positive leasing spreads on renewals reflect strength of locations; expect new leas
Slide 15: Well Staggered Lease Expirations
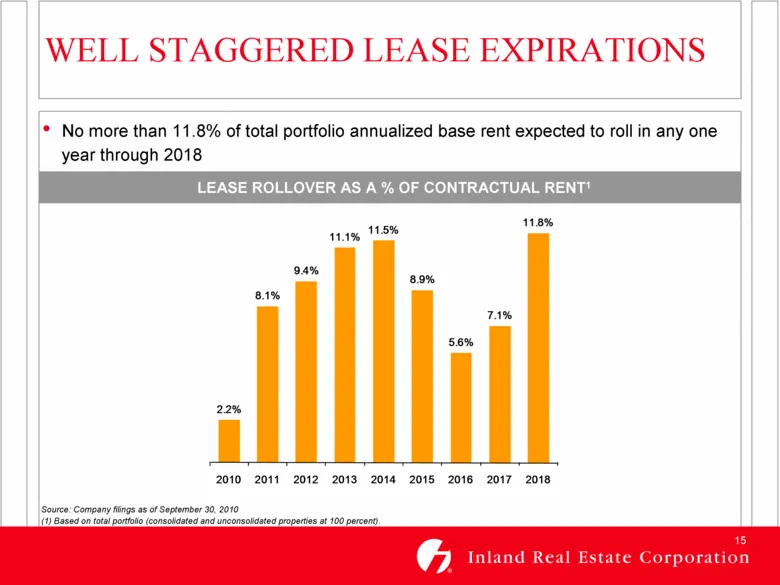
WELL STAGGERED LEASE EXPIRATIONS No more than 11.8% of total portfolio annualized base rent expected to roll in any one year through 2018 Source: Company filings as of September 30, 2010 (1) Based on total portfolio (consolidated and unconsolidated properties at 100 percent). LEASE ROLLOVER AS A % O
Slide 16: Growth from Existing Portfolio: Completed Initiatives
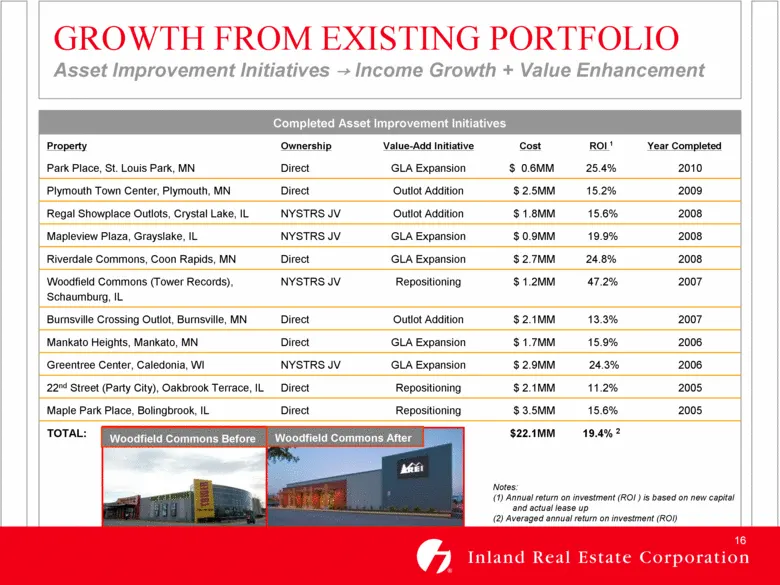
GROWTH FROM EXISTING PORTFOLIO Asset Improvement Initiatives Income Growth + Value Enhancement Completed Asset Improvement Initiatives Property Ownership Value-Add Initiative Cost ROI 1 Year Completed Park Place, St. Louis Park, MN Direct GLA Expansion $ 0.6MM 25.4% 2010 Plymouth Town Center, Plymou
Slide 17: Growth from Existing Portfolio: In-Process Initiatives
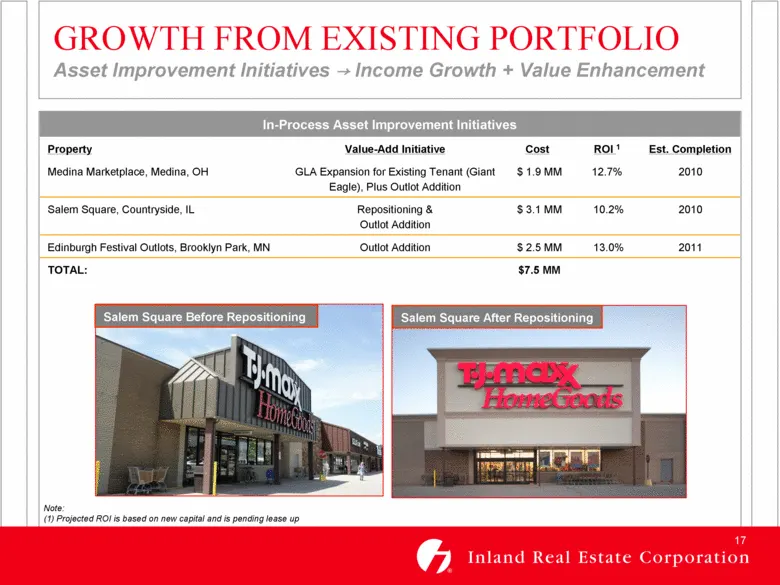
GROWTH FROM EXISTING PORTFOLIO Asset Improvement Initiatives Income Growth + Value Enhancement In-Process Asset Improvement Initiatives Property Value-Add Initiative Cost ROI 1 Est. Completion Medina Marketplace, Medina, OH GLA Expansion for Existing Tenant (Giant Eagle), Plus Outlot Addition $ 1.9
Slide 18: Development Projects
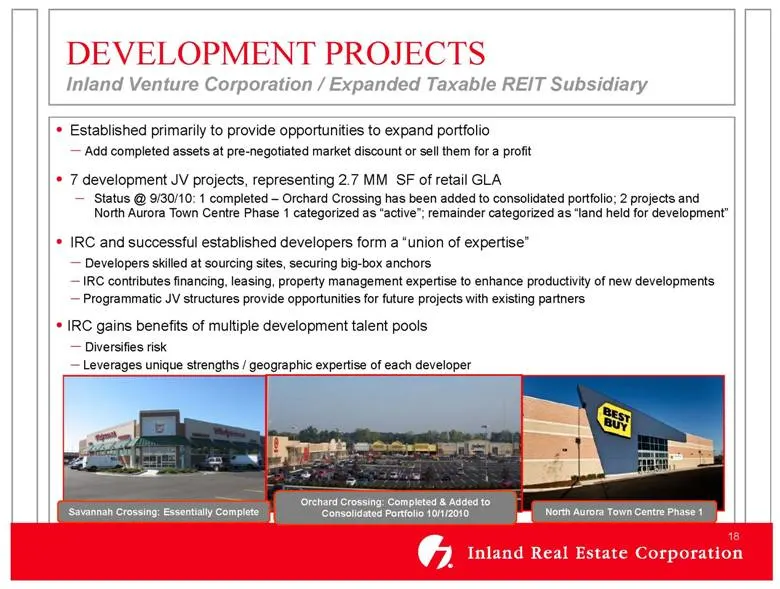
North Aurora Town Centre Phase 1 Savannah Crossing: Essentially Complete DEVELOPMENT PROJECTS Inland Venture Corporation / Expanded Taxable REIT Subsidiary Established primarily to provide opportunities to expand portfolio Add completed assets at pre-negotiated market discount or sell them for a pro
Slide 19: Acquisition History
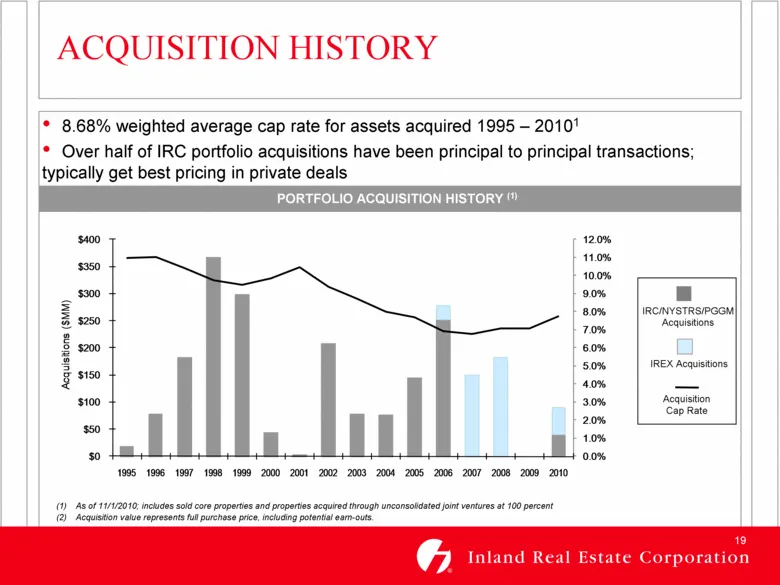
As of 11/1/2010; includes sold core properties and properties acquired through unconsolidated joint ventures at 100 percent Acquisition value represents full purchase price, including potential earn-outs. ACQUISITION HISTORY 8.68% weighted average cap rate for assets acquired 1995 – 20101 Over half
Slide 20: Maintaining a Strong Balance Sheet
MAINTAINING A STRONG BALANCE SHEET Equity offering/sales enhance liquidity in uncertain environment; provide capital for opportunistic acquisitions: Equity offering 5/09: 17.1 MM shares sold @ $6.50 per share; net proceeds of $106.4 MM ATM program as of 9/30/10: 1.7 MM shares sold @ average price of
Slide 21: Consolidated Debt Maturities
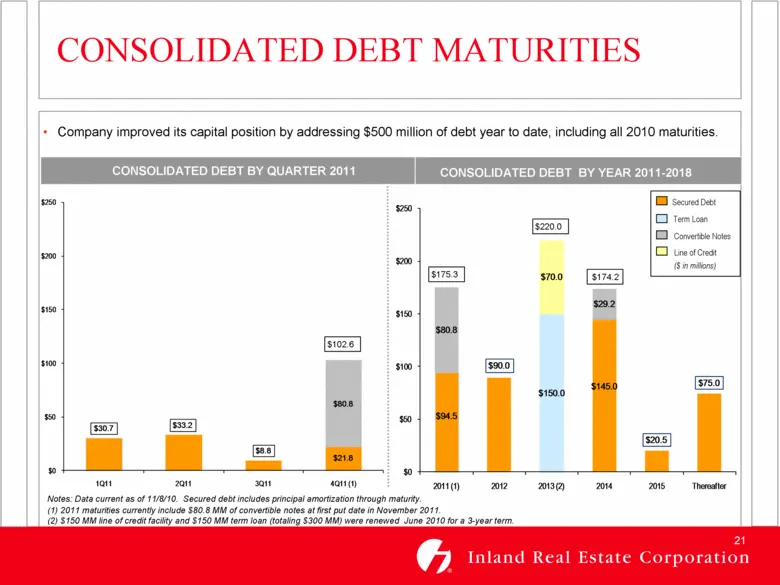
CONSOLIDATED DEBT MATURITIES $175.3 $220.0 Company improved its capital position by addressing $500 million of debt year to date, including all 2010 maturities. Notes: Data current as of 11/8/10. Secured debt includes principal amortization through maturity. (1) 2011 maturities currently include $80
Slide 22: Joint Venture Strategies
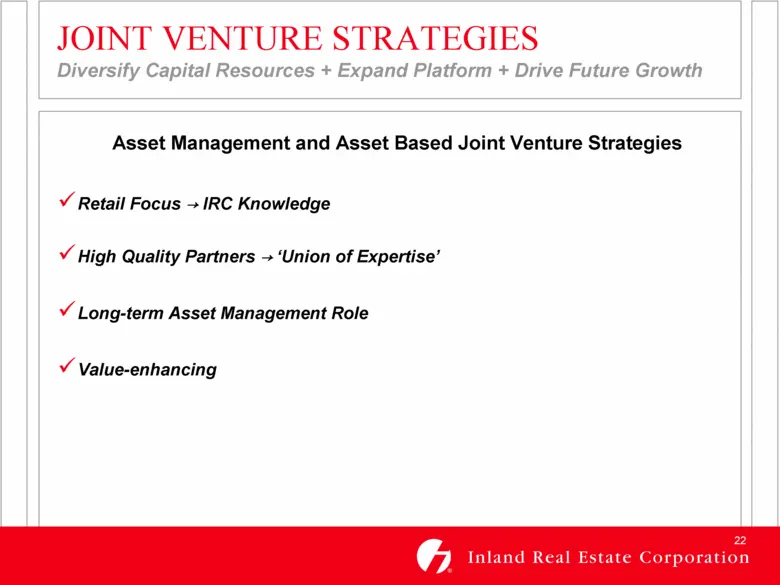
JOINT VENTURE STRATEGIES Diversify Capital Resources + Expand Platform + Drive Future Growth Asset Management and Asset Based Joint Venture Strategies Retail Focus IRC Knowledge High Quality Partners ‘Union of Expertise’ Long-term Asset Management Role Value-enhancing
Slide 23: Asset Management Joint Venture: IREX
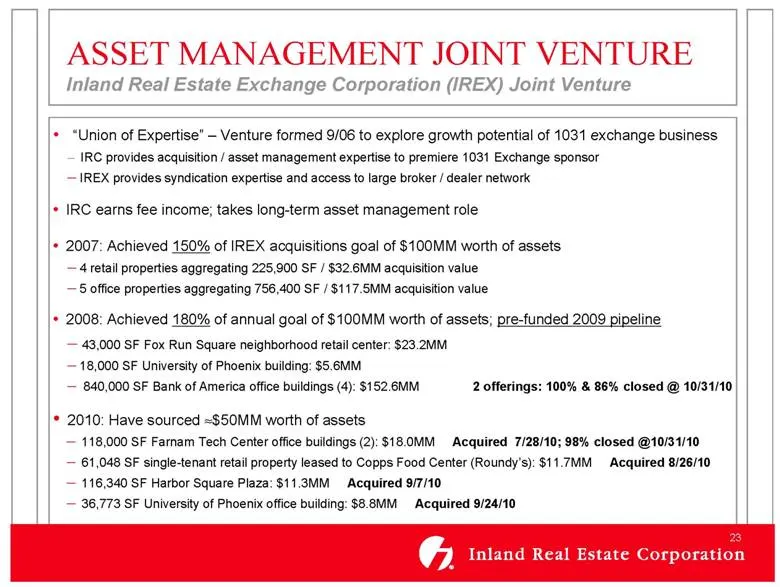
ASSET MANAGEMENT JOINT VENTURE Inland Real Estate Exchange Corporation (IREX) Joint Venture “Union of Expertise” – Venture formed 9/06 to explore growth potential of 1031 exchange business IRC provides acquisition / asset management expertise to premiere 1031 Exchange sponsor IREX provides syndicati
Slide 24: Strategic Joint Venture with PGGM
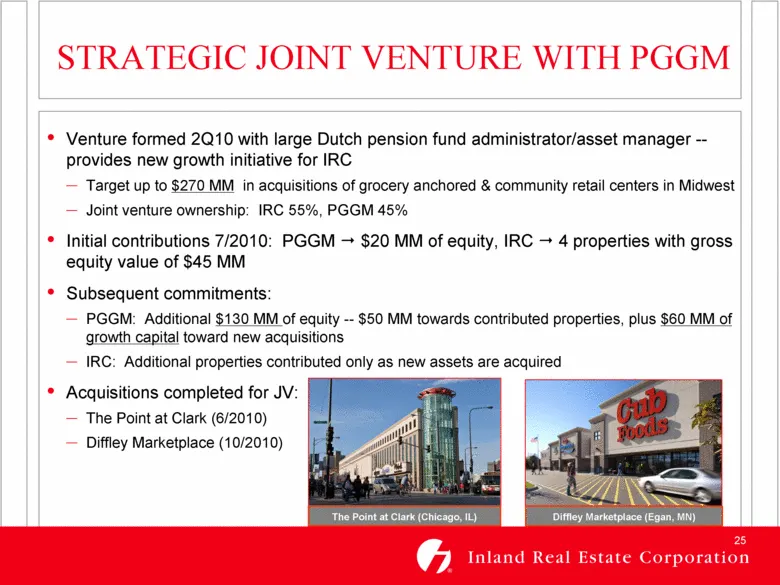
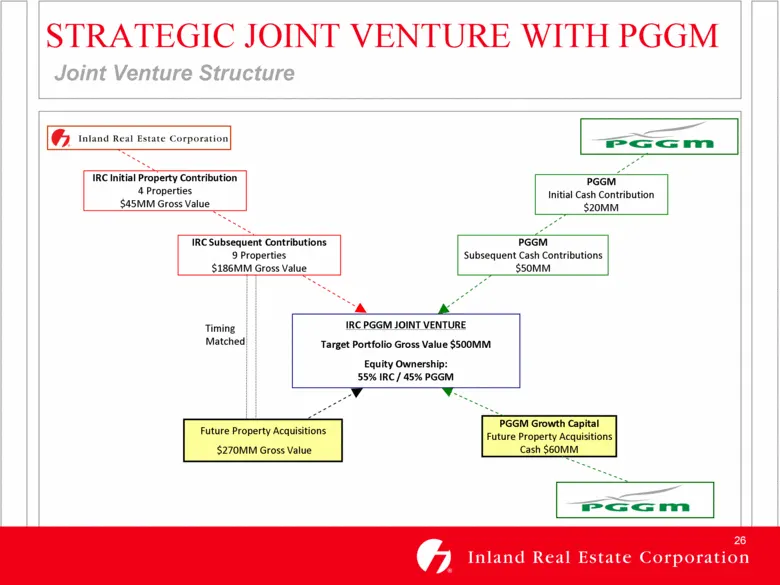
STRATEGIC JOINT VENTURE WITH PGGM Venture formed 2Q10 with large Dutch pension fund administrator/asset manager -- provides new growth initiative for IRC Target up to $270 MM in acquisitions of grocery anchored & community retail centers in Midwest Joint venture ownership: IRC 55%, PGGM 45% Initial
Slide 25: Strategic Joint Venture with PGGM: Structure
STRATEGIC JOINT VENTURE WITH PGGM Joint Venture Structure IRC Subsequent Contributions 9 Properties $186MM Gross Value PGGM Subsequent Cash Contributions $50MM PGGM Growth Capital Future Property Acquisitions Cash $60MM Future Property Acquisitions $270MM Gross Value IRC PGGM JOINT VENTURE Target Po
Slide 26: Strategic Joint Venture with PGGM: Benefits
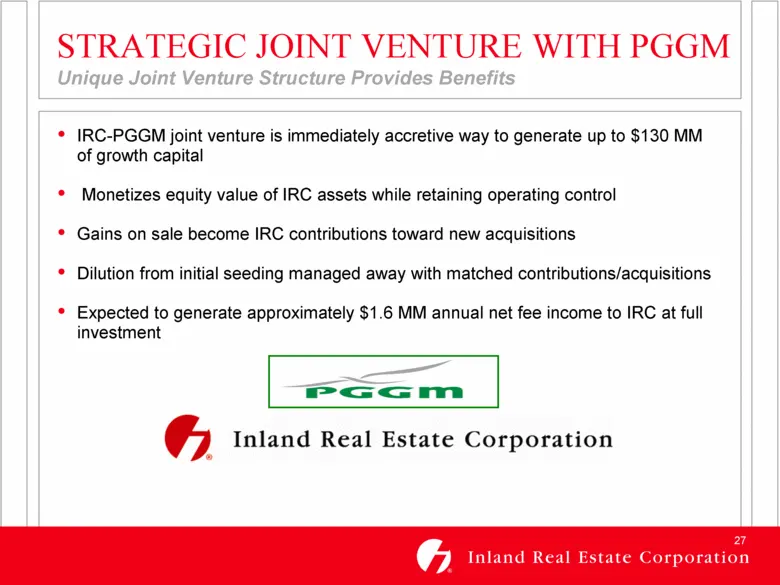
STRATEGIC JOINT VENTURE WITH PGGM Unique Joint Venture Structure Provides Benefits IRC-PGGM joint venture is immediately accretive way to generate up to $130 MM of growth capital Monetizes equity value of IRC assets while retaining operating control Gains on sale become IRC contributions toward new
Slide 27: Joint Venture Fee Income
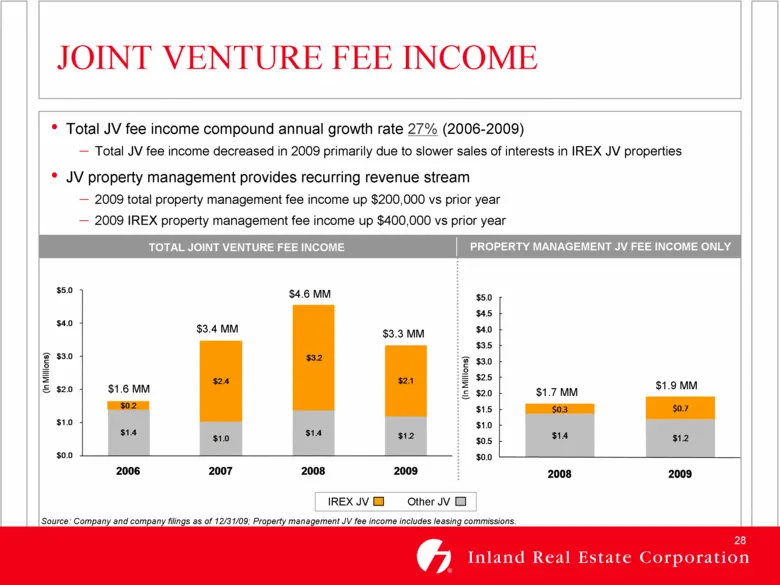
JOINT VENTURE FEE INCOME TOTAL JOINT VENTURE FEE INCOME Total JV fee income compound annual growth rate 27% (2006-2009) Total JV fee income decreased in 2009 primarily due to slower sales of interests in IREX JV properties JV property management provides recurring revenue stream 2009 total property
Slide 28: IRC is well positioned to weather current economic and credit conditions
IRC is well positioned to weather current economic and credit market conditions Necessity and value-based retail in high barrier to entry markets should outperform other retail real estate Strong interest and fixed charge coverage ratio: 2.2 times IRC is building a solid foundation for future growth
Slide 29: Forward-Looking Statements
FORWARD-LOOKING STATEMENTS Certain statements in this presentation constitute "forward-looking statements" within the meaning of the Federal Private Securities Litigation Reform Act of 1995. These forward-looking statements are not historical facts but are the intent, belief or current expectations
Source: SEC EDGAR · 8-K filed Nov 15, 2010
More decks from Inland Real Estate Corp
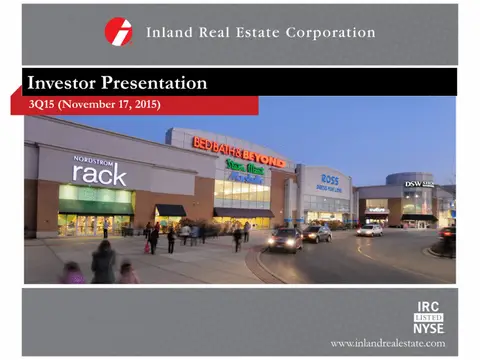 Investor Presentation (November 2015)30 slides · Nov 17, 2015
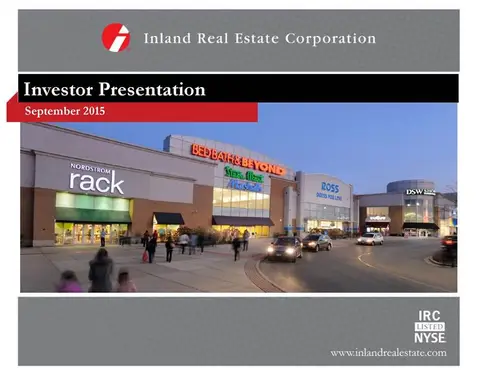 Investor Presentation (September 2015)29 slides · Sep 16, 2015
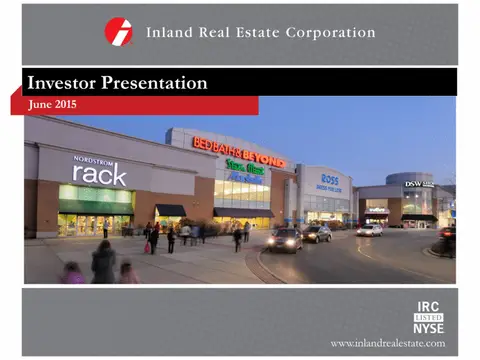 Investor Presentation (June 2015)29 slides · Jun 9, 2015
 Investor Presentation (May 2015)26 slides · May 15, 2015
 Investor Presentation (February 2015)26 slides · Feb 24, 2015
 Investor Presentation (November 2014)26 slides · Nov 5, 2014