NuStar Energy LP — 2021 UBS Winter Infrastructure & Energy Virtual Conference
40 slides from NuStar Energy LP's conference presentation, Jan 12, 2021
Slide 1: 2021 UBS Winter Infrastructure & Energy Virtual Conference
North Beach Corpus Christi, TX 1 2021 UBS Winter Infrastructure & Energy Virtual Conference January 12-13, 2021
Slide 2: Forward-Looking Statements
2 Forward-Looking Statements Statements contained in this presentation other than statements of historical fact are forward-looking statements. While these forward-looking statements, and any assumptions upon which they are based, are made in good faith and reflect our current judgment regarding the
Slide 3: Introduction
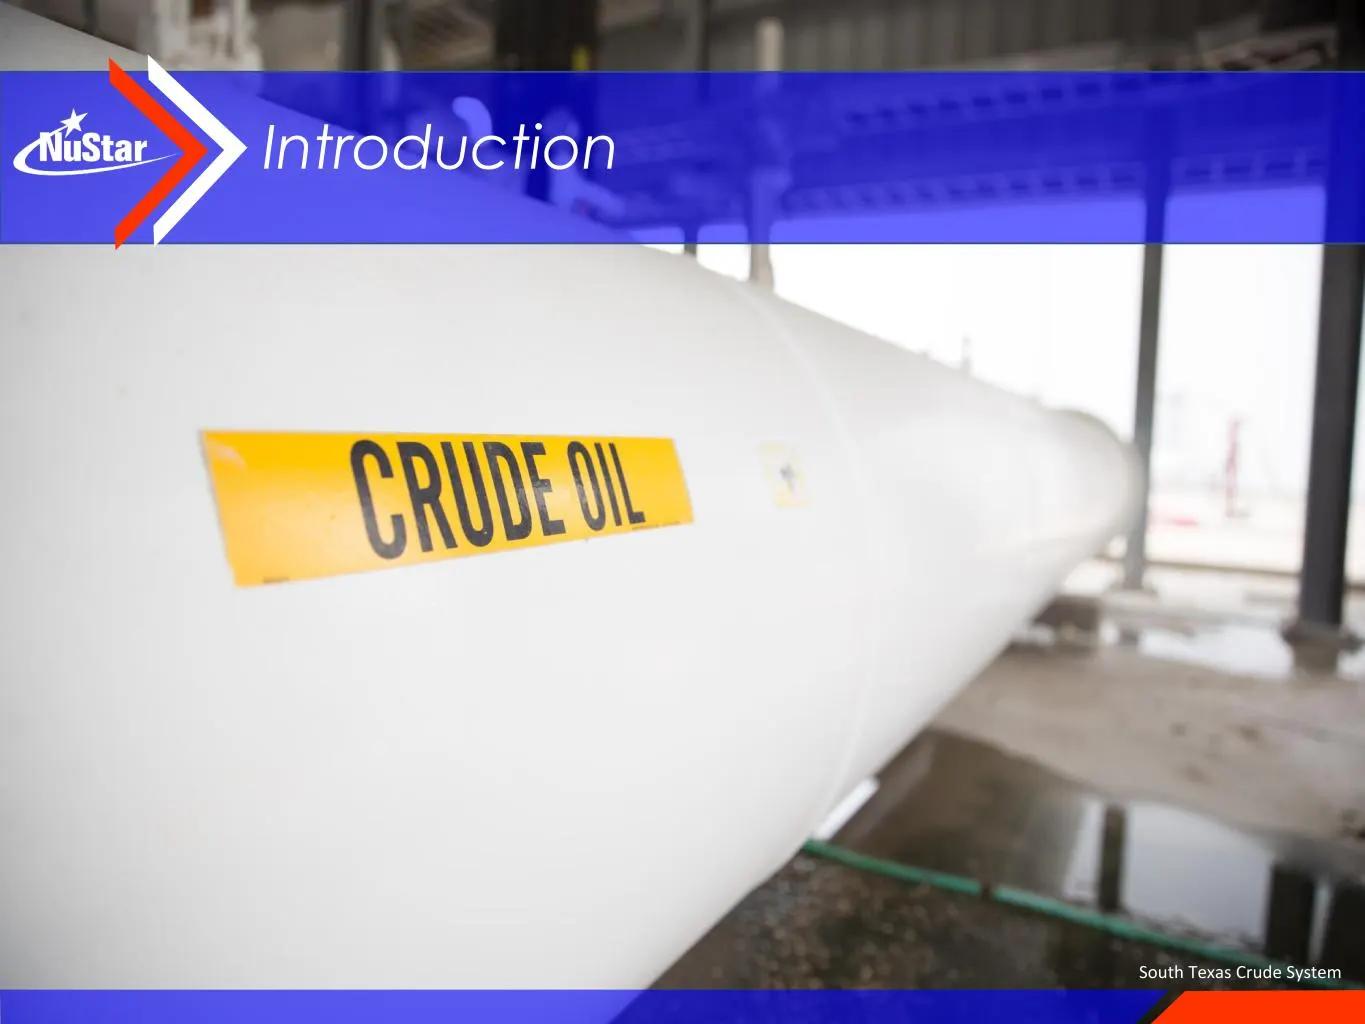
South Texas Crude System 3 Introduction
Slide 4: After a Year Full of Challenges, NuStar is Well-positioned for 2021
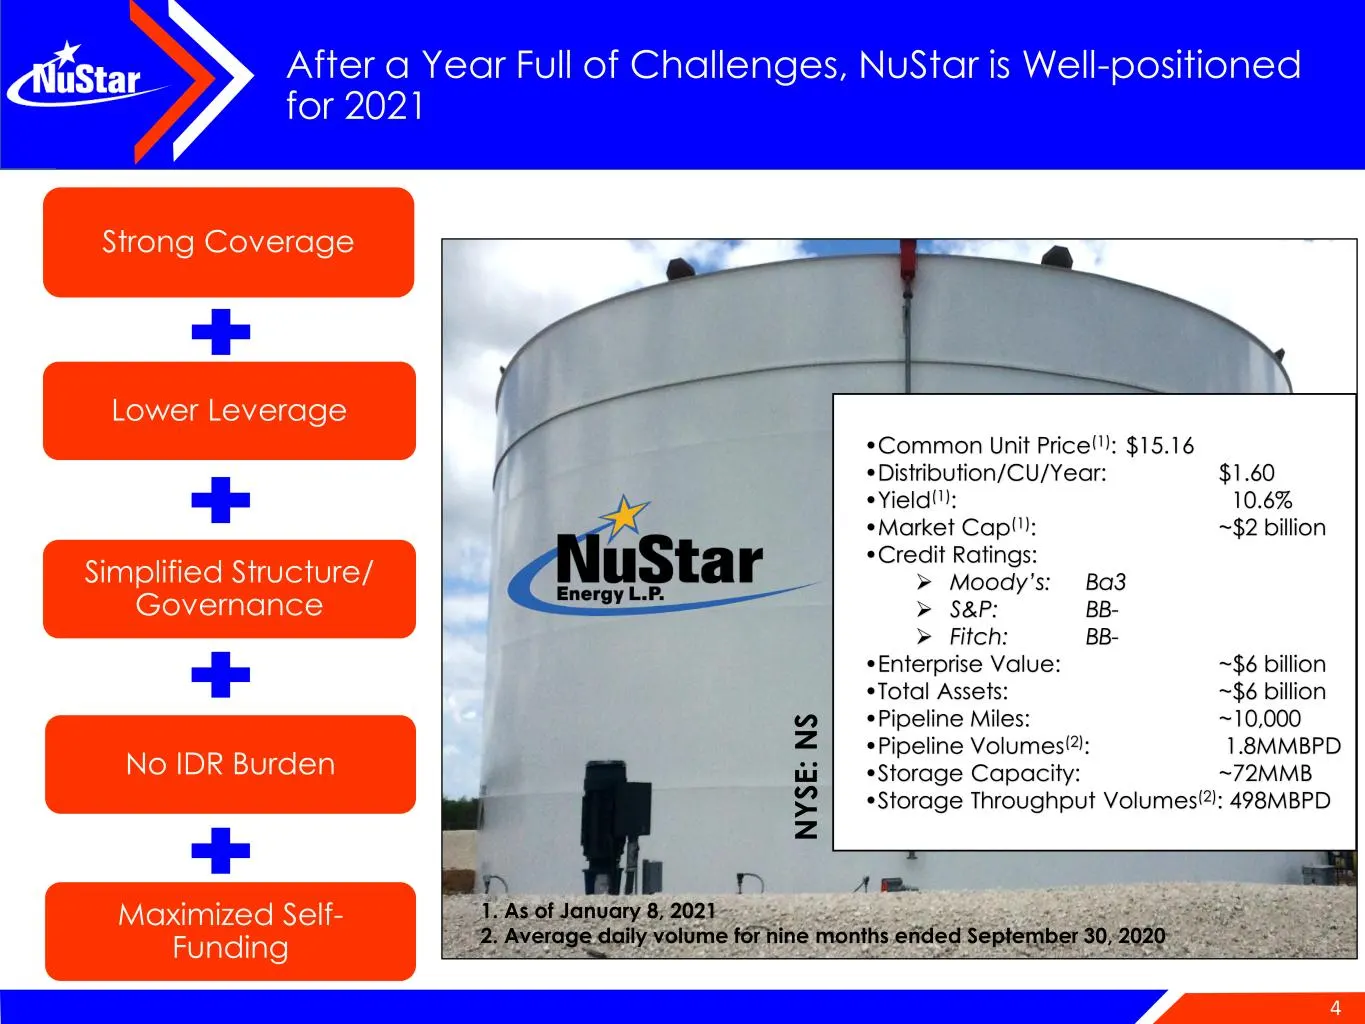
4 After a Year Full of Challenges, NuStar is Well-positioned for 2021 Strong Coverage Lower Leverage Simplified Structure/ Governance No IDR Burden Maximized Self- Funding N Y S E : N S •Common Unit Price(1): $15.16 •Distribution/CU/Year: $1.60 •Yield(1): 10.6% •Market Cap(1): ~$2 billion •Credit Ra
Slide 5: Last Year, We Took Decisive Action and Remained Focused on Our Priorities
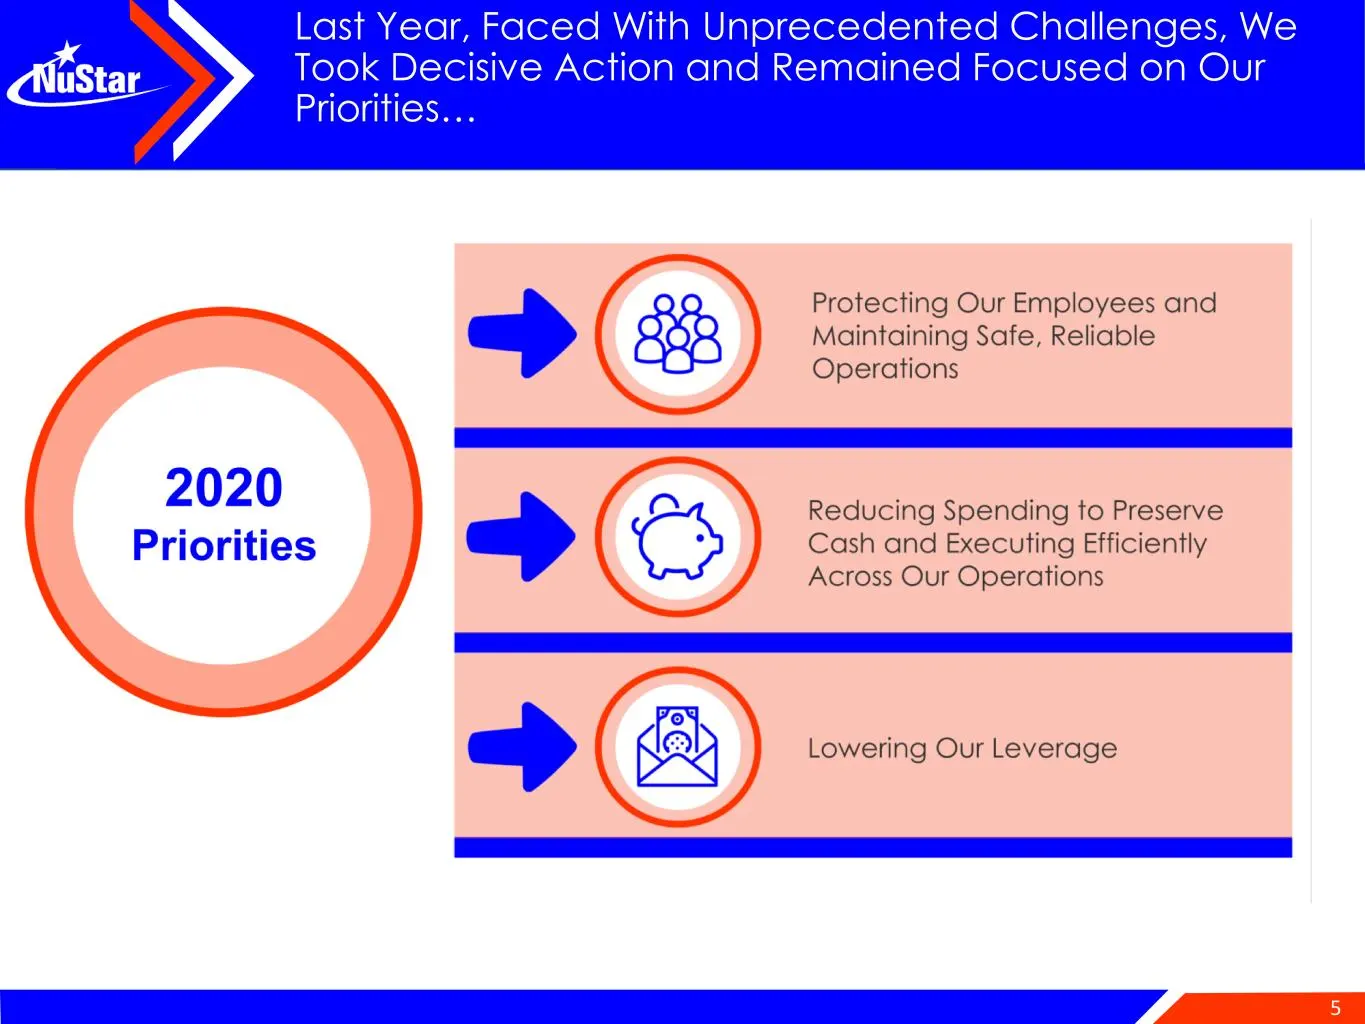
5 Last Year, Faced With Unprecedented Challenges, We Took Decisive Action and Remained Focused on Our Priorities…
Slide 6: This Past Quarter, We Again Delivered Solid and Stable Financial Results
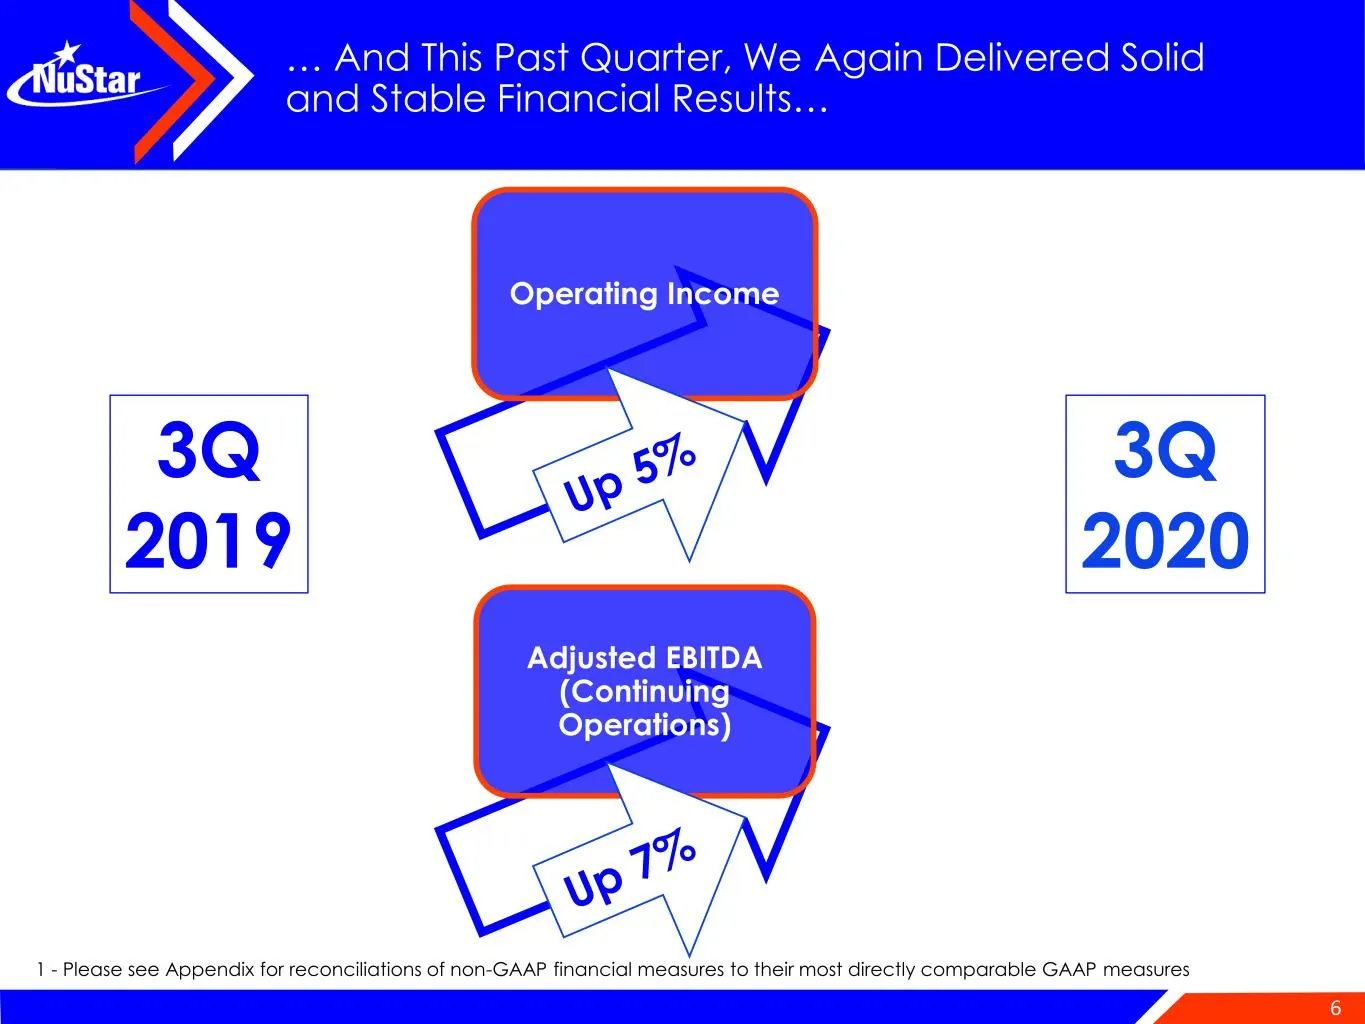
6 … And This Past Quarter, We Again Delivered Solid and Stable Financial Results… Adjusted EBITDA (Continuing Operations) 3Q 2019 3Q 2020 1 - Please see Appendix for reconciliations of non-GAAP financial measures to their most directly comparable GAAP measures Operating Income
Slide 7: Strong Operational Performance Across Our Footprint
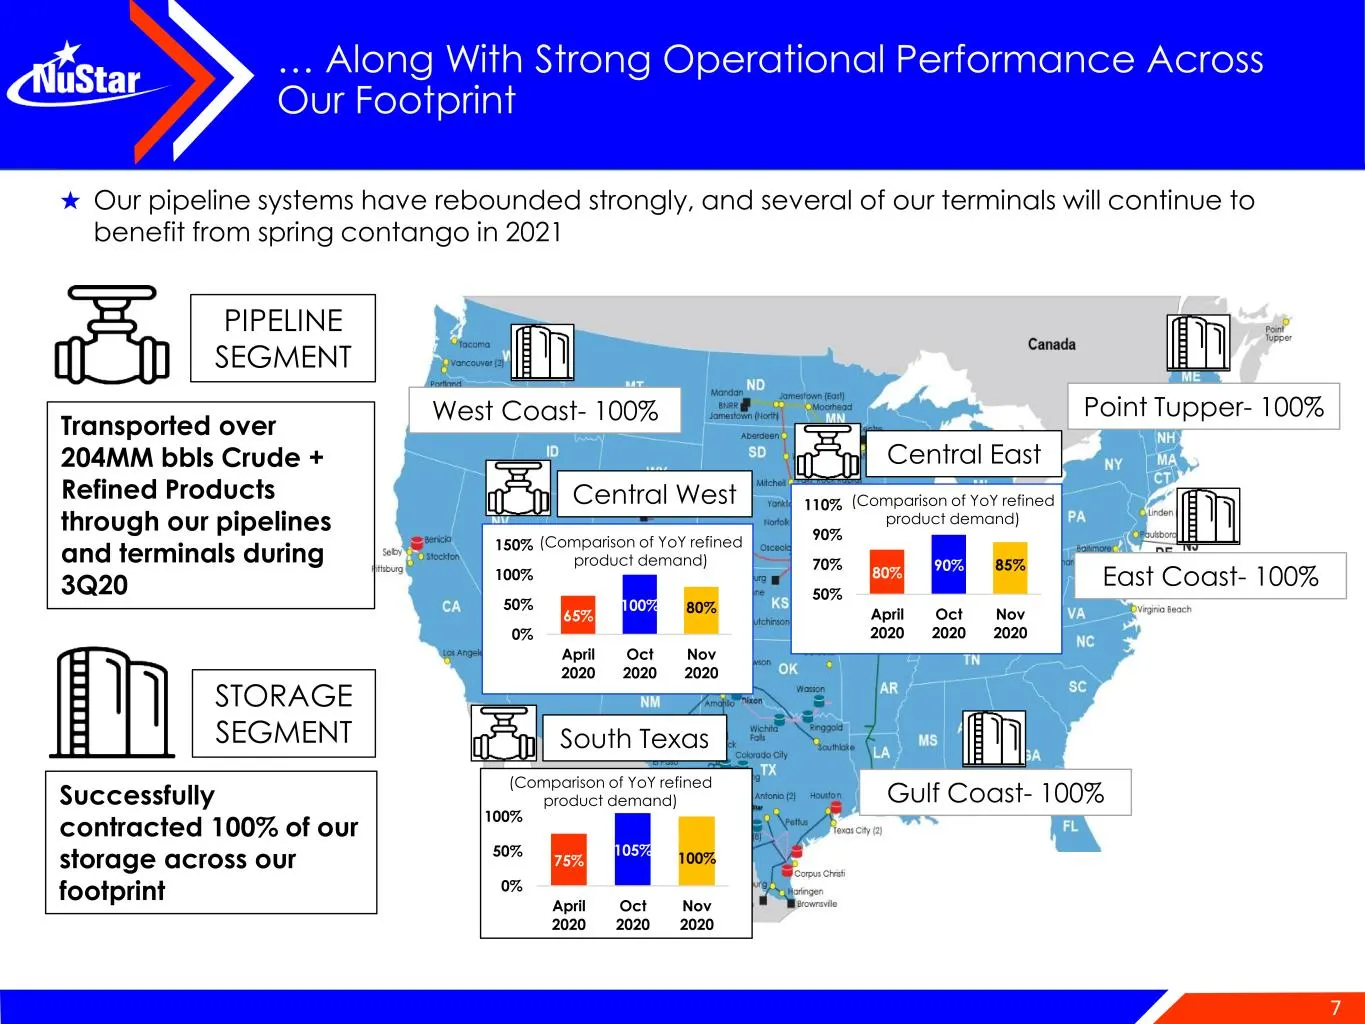
7 ★ Our pipeline systems have rebounded strongly, and several of our terminals will continue to benefit from spring contango in 2021 … Along With Strong Operational Performance Across Our Footprint Transported over 204MM bbls Crude + Refined Products through our pipelines and terminals during 3Q20 S
Slide 8: We Expect Solid Full-Year 2020 Results
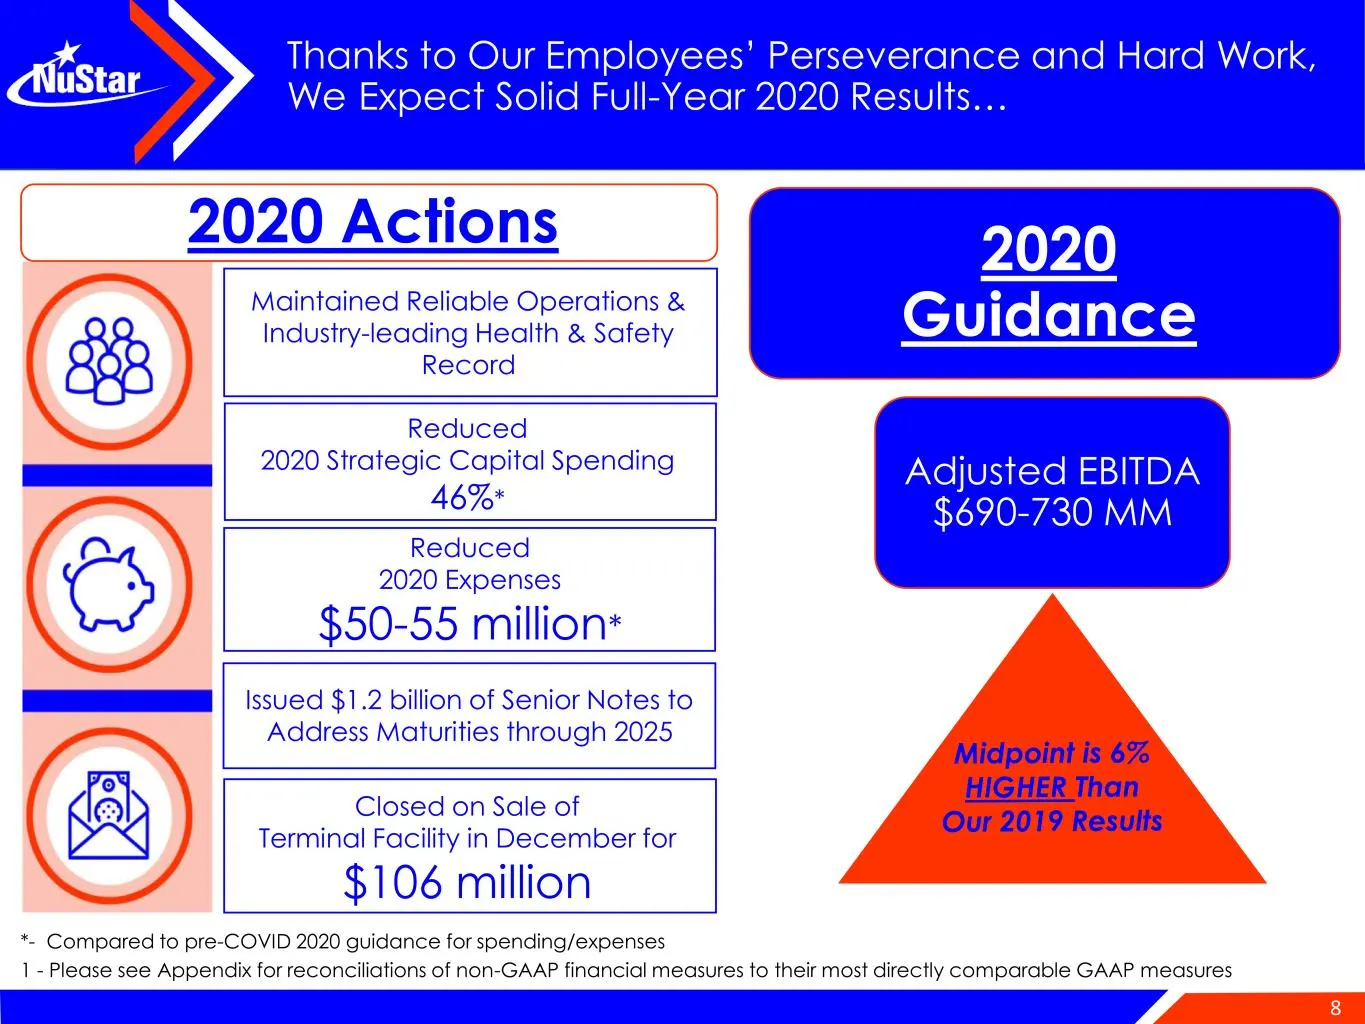
8 Thanks to Our Employees’ Perseverance and Hard Work, We Expect Solid Full-Year 2020 Results… Closed on Sale of Terminal Facility in December for $106 million Adjusted EBITDA $690-730 MM 2020 Guidance *- Compared to pre-COVID 2020 guidance for spending/expenses 1 - Please see Appendix for reconcili
Slide 9: We Expect to Continue to Demonstrate Financial Strength in 2021
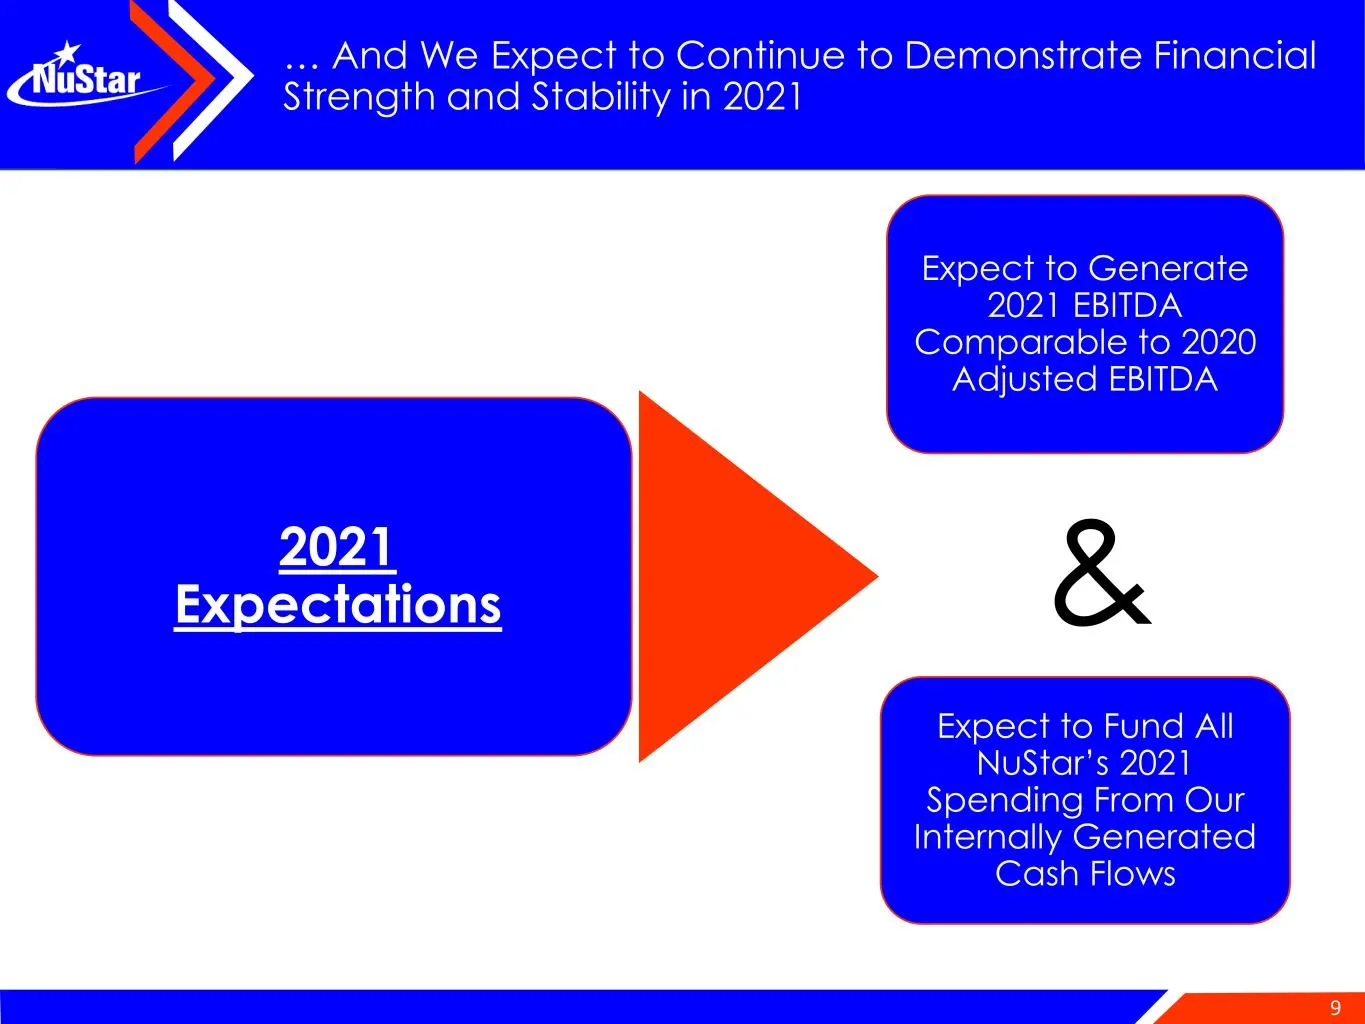
9 … And We Expect to Continue to Demonstrate Financial Strength and Stability in 2021 2021 Expectations Expect to Generate 2021 EBITDA Comparable to 2020 Adjusted EBITDA & Expect to Fund All NuStar’s 2021 Spending From Our Internally Generated Cash Flows
Slide 10: In 2021, We Plan to Release Our First Sustainability Report
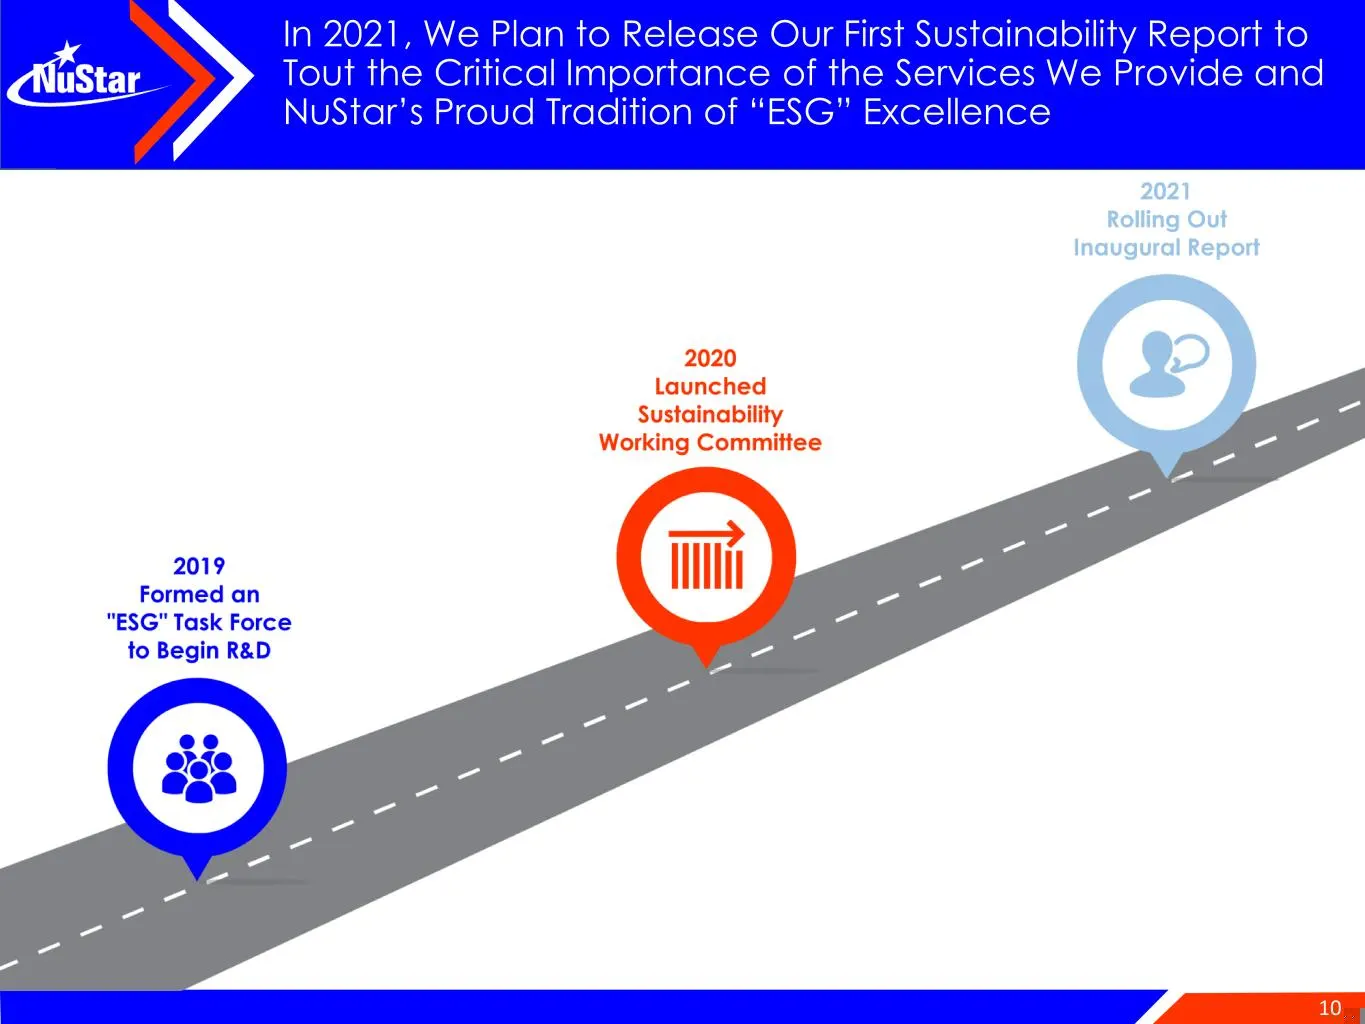
10 In 2021, We Plan to Release Our First Sustainability Report to Tout the Critical Importance of the Services We Provide and NuStar’s Proud Tradition of “ESG” Excellence
Slide 11: Pipelines Provide the Most Efficient and Safest Way to Transport Energy
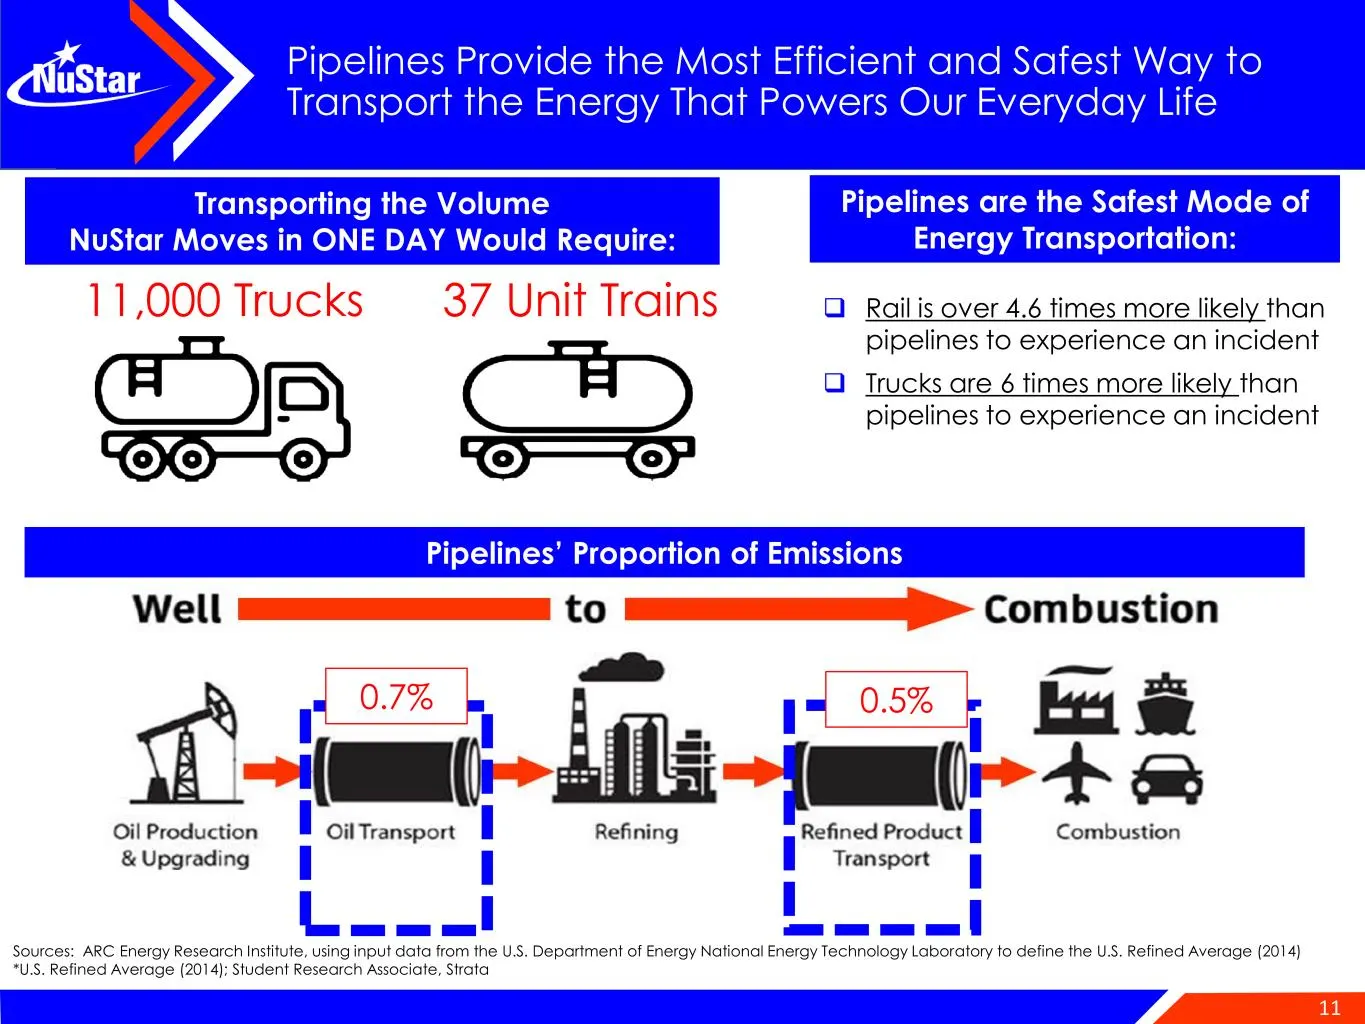
11 Pipelines Provide the Most Efficient and Safest Way to Transport the Energy That Powers Our Everyday Life Sources: ARC Energy Research Institute, using input data from the U.S. Department of Energy National Energy Technology Laboratory to define the U.S. Refined Average (2014) *U.S. Refined Avera
Slide 12: NuStar Has Been Protecting Our Employees, Environment and Communities
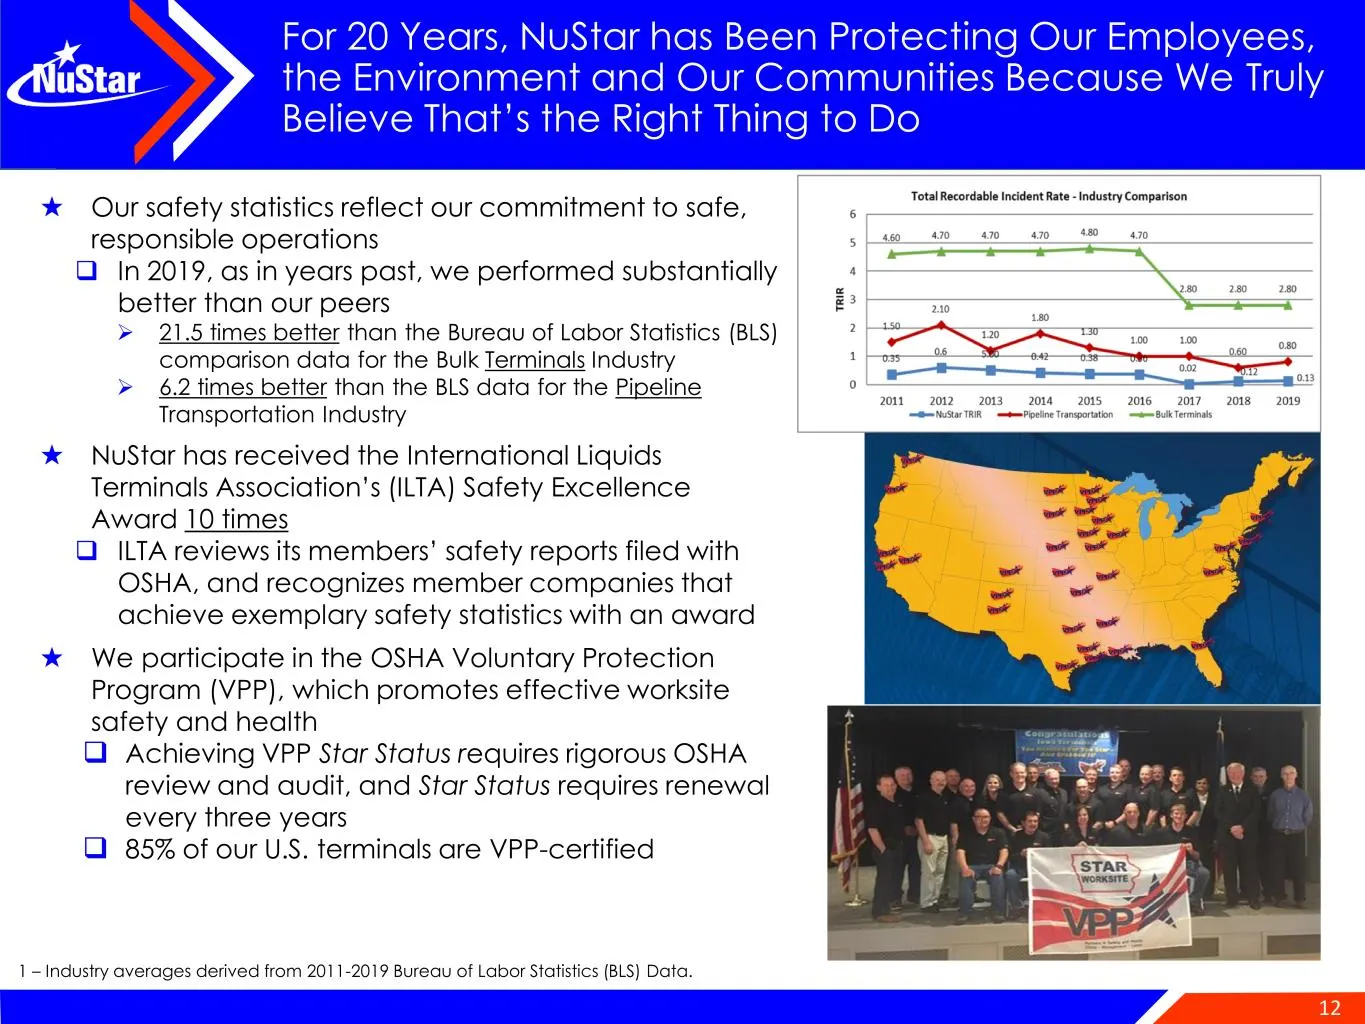
12 For 20 Years, NuStar has Been Protecting Our Employees, the Environment and Our Communities Because We Truly Believe That’s the Right Thing to Do ★ Our safety statistics reflect our commitment to safe, responsible operations ❑ In 2019, as in years past, we performed substantially better than our
Slide 13: Our Report Will Reflect Statistics, Record and Rankings
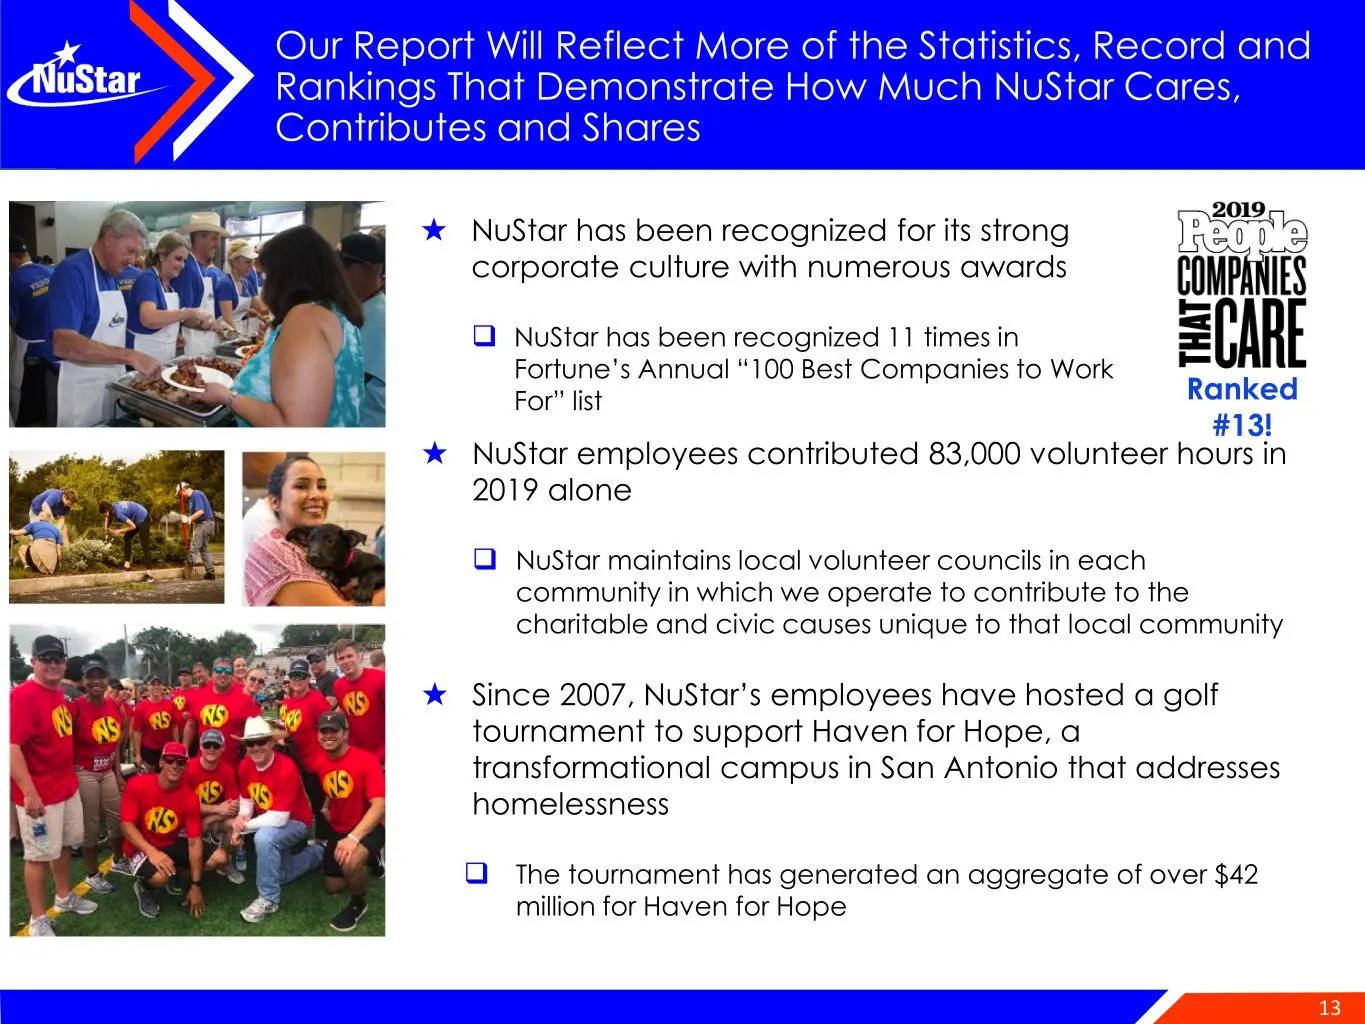
13 Our Report Will Reflect More of the Statistics, Record and Rankings That Demonstrate How Much NuStar Cares, Contributes and Shares ★ NuStar employees contributed 83,000 volunteer hours in 2019 alone ❑ NuStar maintains local volunteer councils in each community in which we operate to contribute to
Slide 14: Proud of the Strength of Our Support of Each Other and Communities
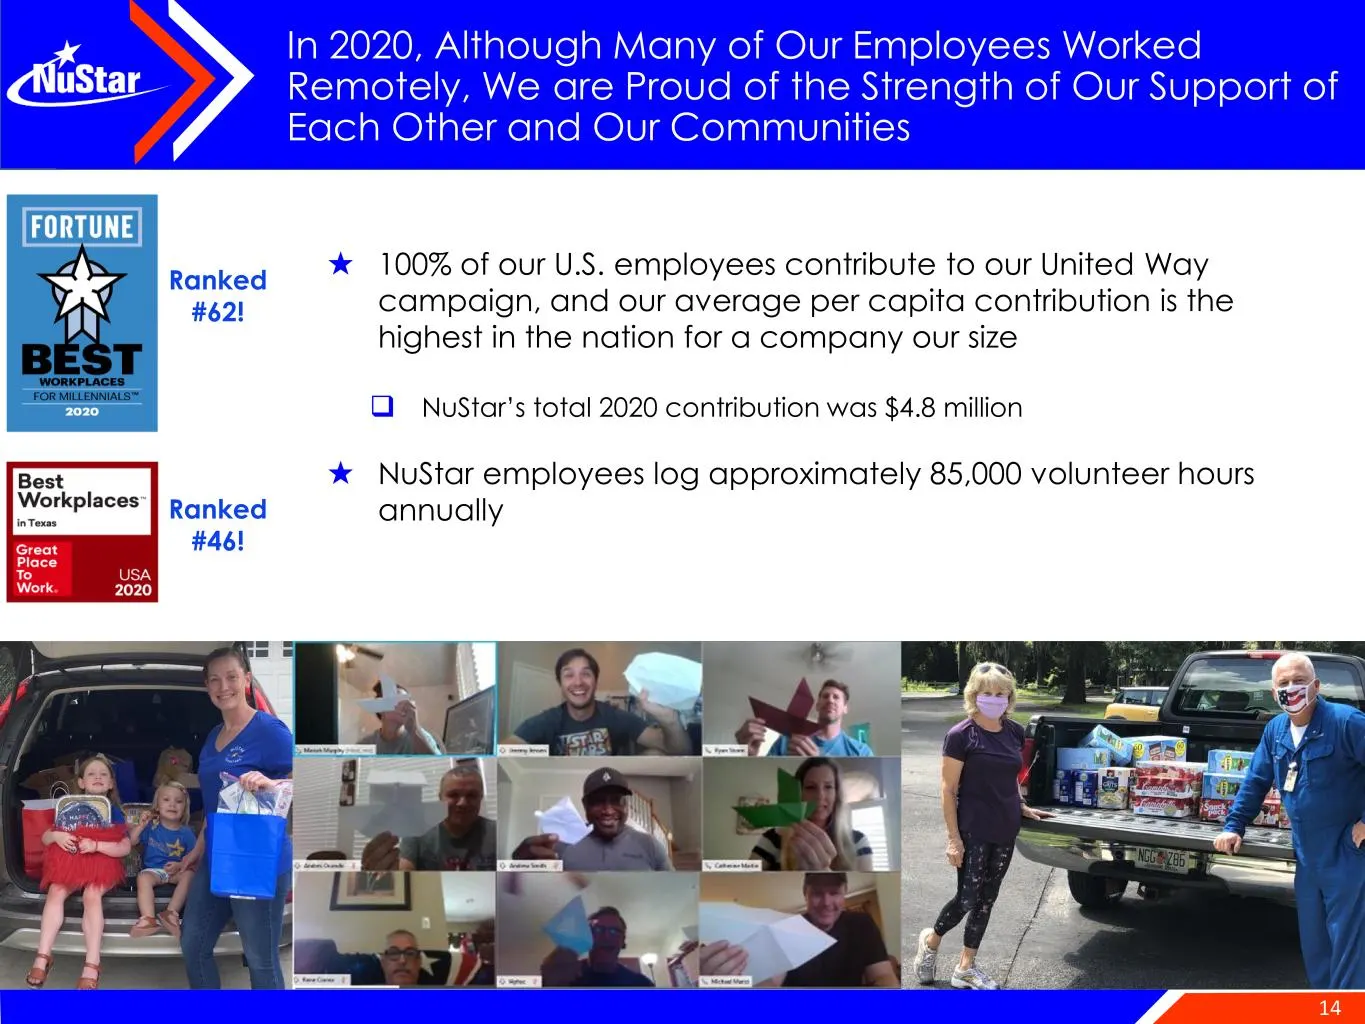
14 In 2020, Although Many of Our Employees Worked Remotely, We are Proud of the Strength of Our Support of Each Other and Our Communities ★ 100% of our U.S. employees contribute to our United Way campaign, and our average per capita contribution is the highest in the nation for a company our size ❑
Slide 15: NuStar's Governance is Aligned With Our Unitholders' Interests
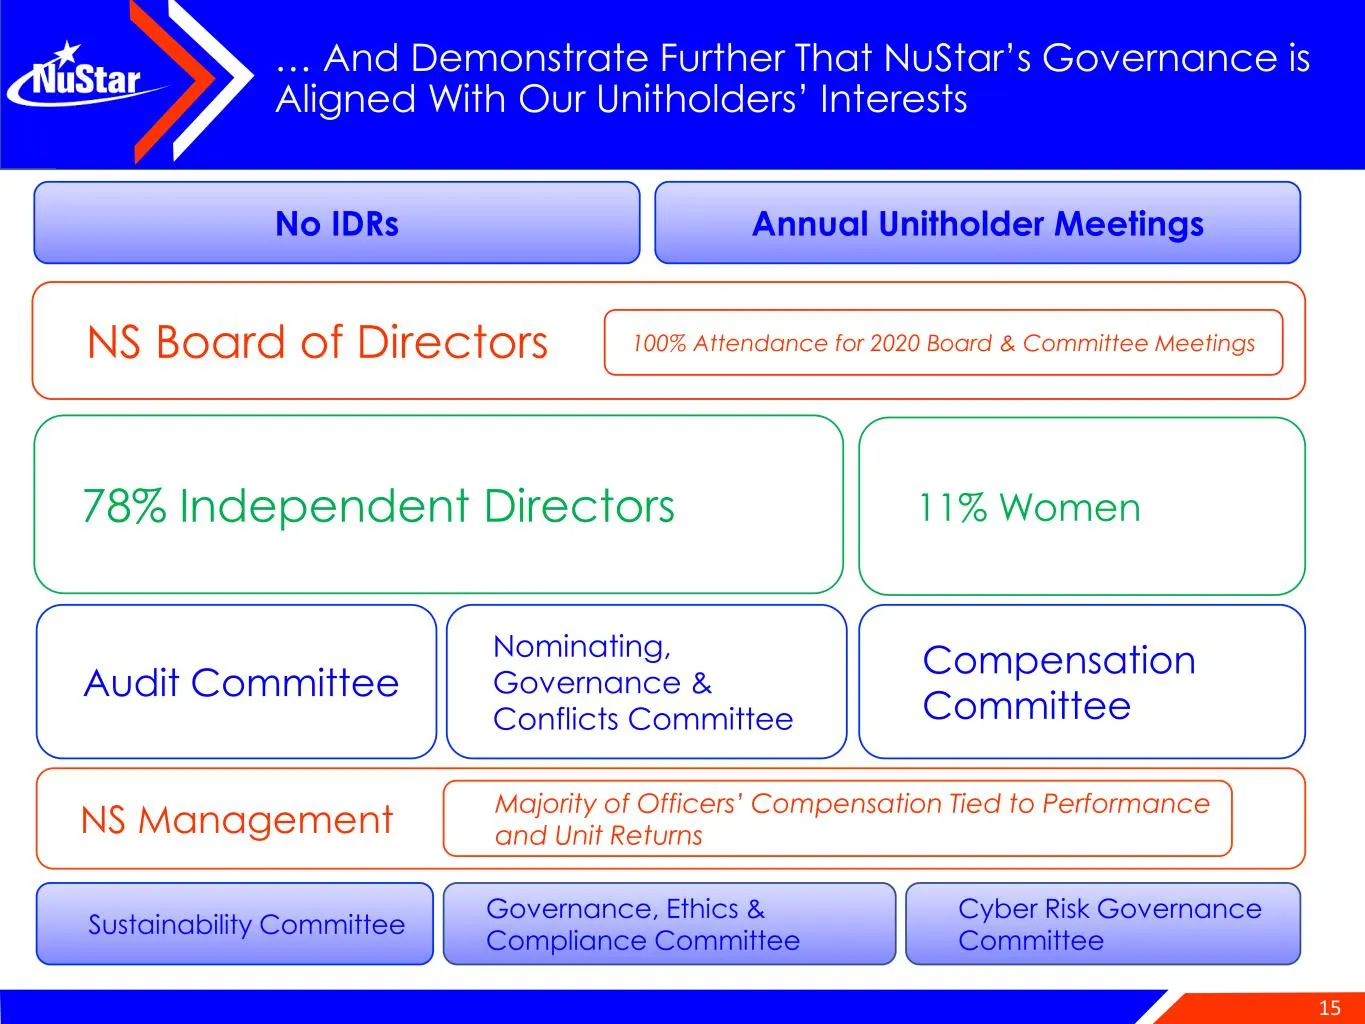
15 … And Demonstrate Further That NuStar’s Governance is Aligned With Our Unitholders’ Interests 78% Independent Directors 11% Women No IDRs NS Management NS Board of Directors 100% Attendance for 2020 Board & Committee Meetings Sustainability Committee Majority of Officers’ Compensation Tied to Per
Slide 16: We Are Focused on Our Strategic Priorities for 2021
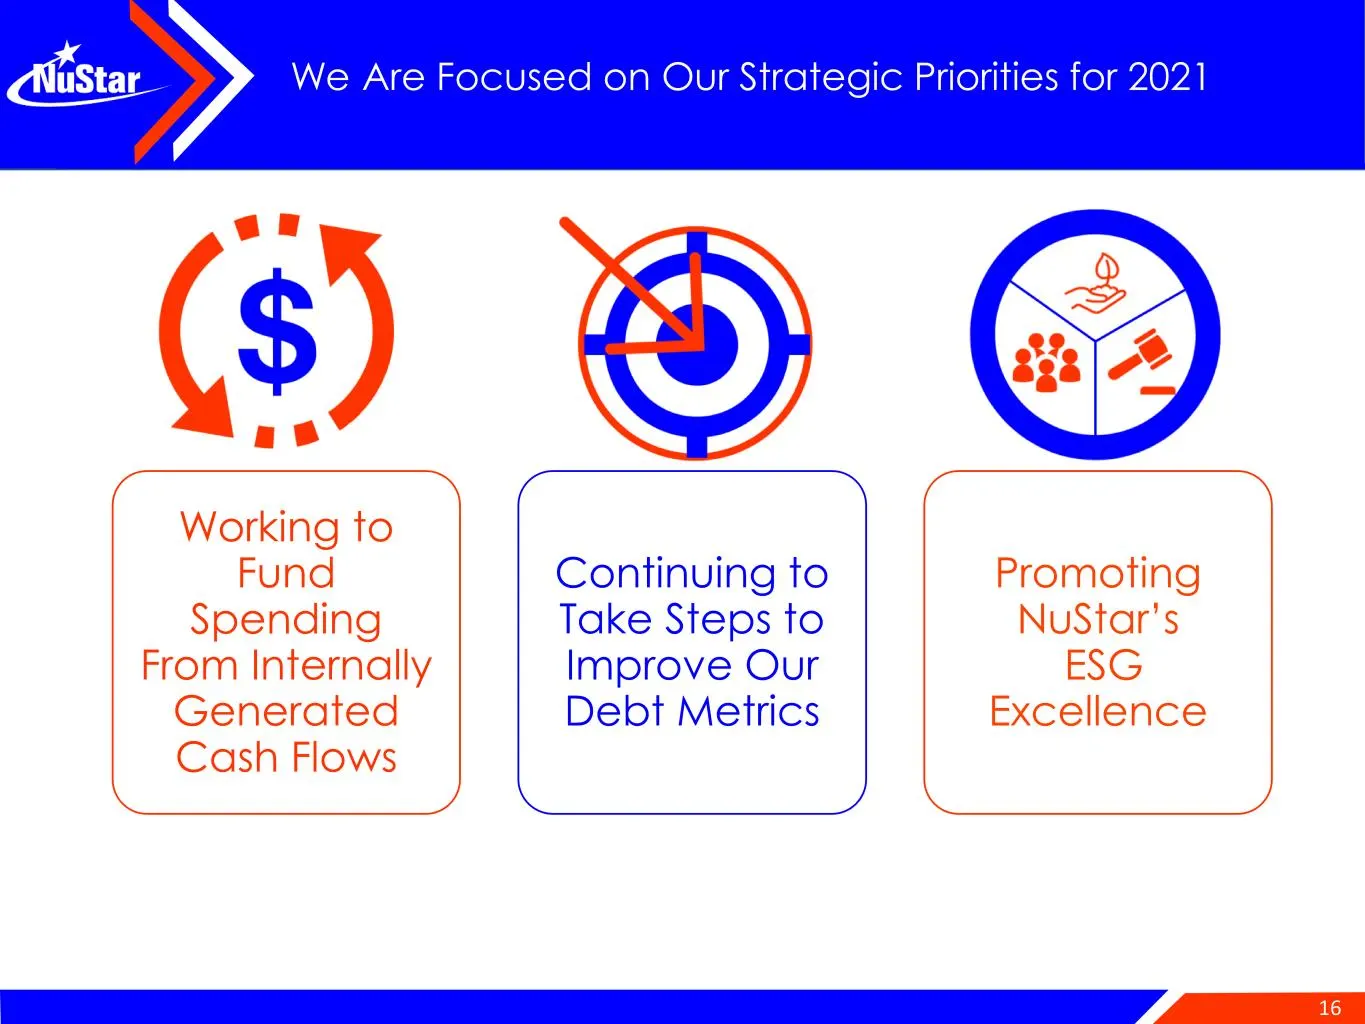
16 We Are Focused on Our Strategic Priorities for 2021 Working to Fund Spending From Internally Generated Cash Flows Continuing to Take Steps to Improve Our Debt Metrics Promoting NuStar’s ESG Excellence
Slide 17: Product Demand Rebound is the First Step Back to Shale Growth
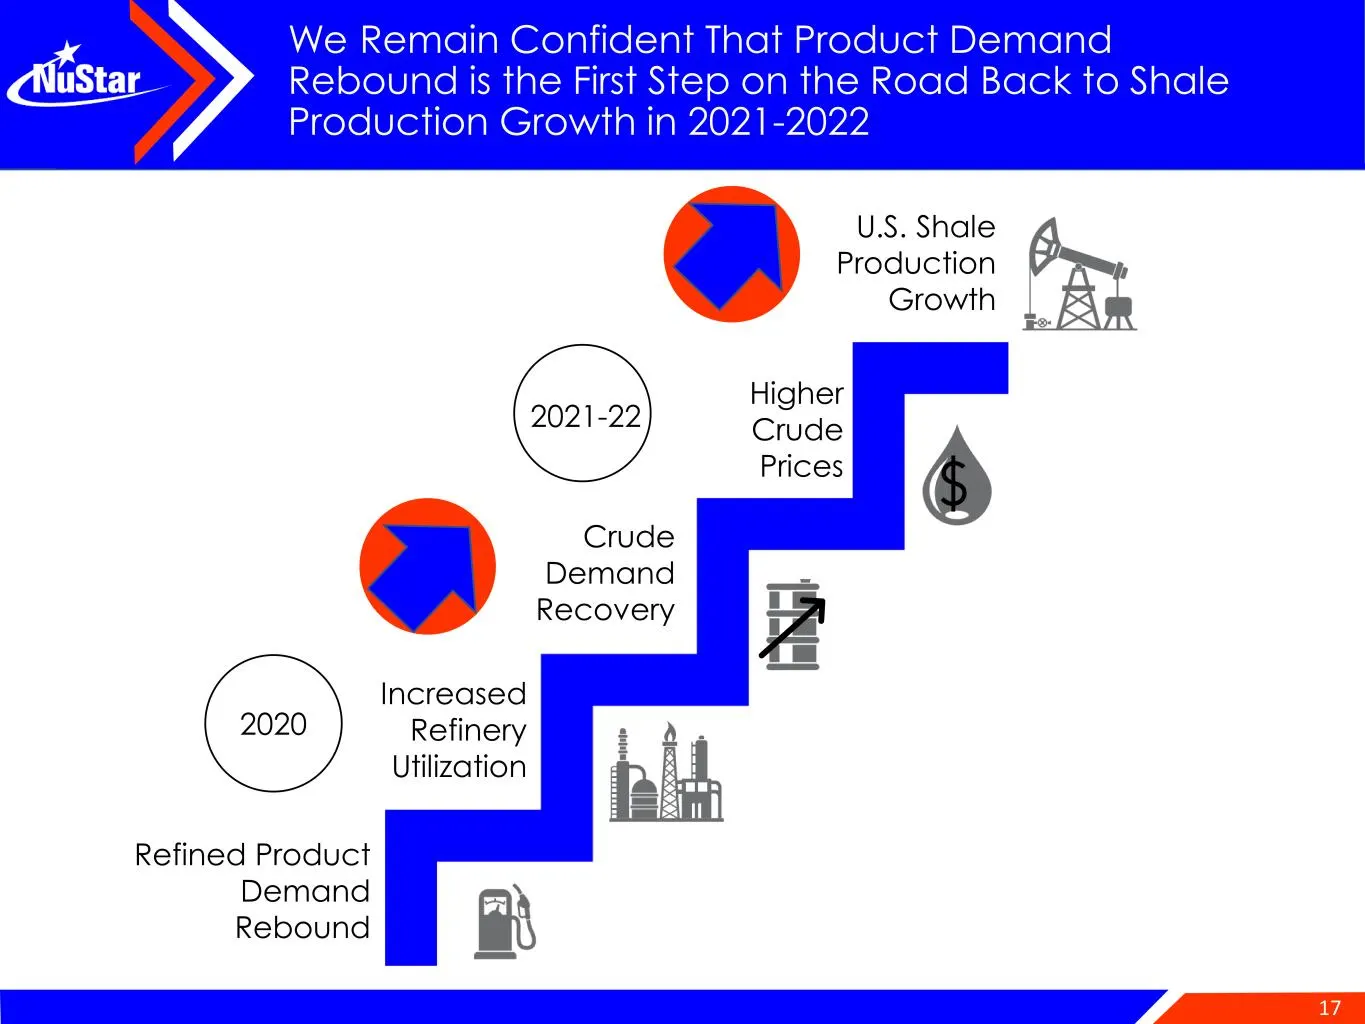
17 We Remain Confident That Product Demand Rebound is the First Step on the Road Back to Shale Production Growth in 2021-2022 U.S. Shale Production Growth Higher Crude Prices Crude Demand Recovery Increased Refinery Utilization Refined Product Demand Rebound 2020 2021-22
Slide 18: U.S. Gasoline and Diesel Demand Expected to Recover to 95% of Pre-COVID
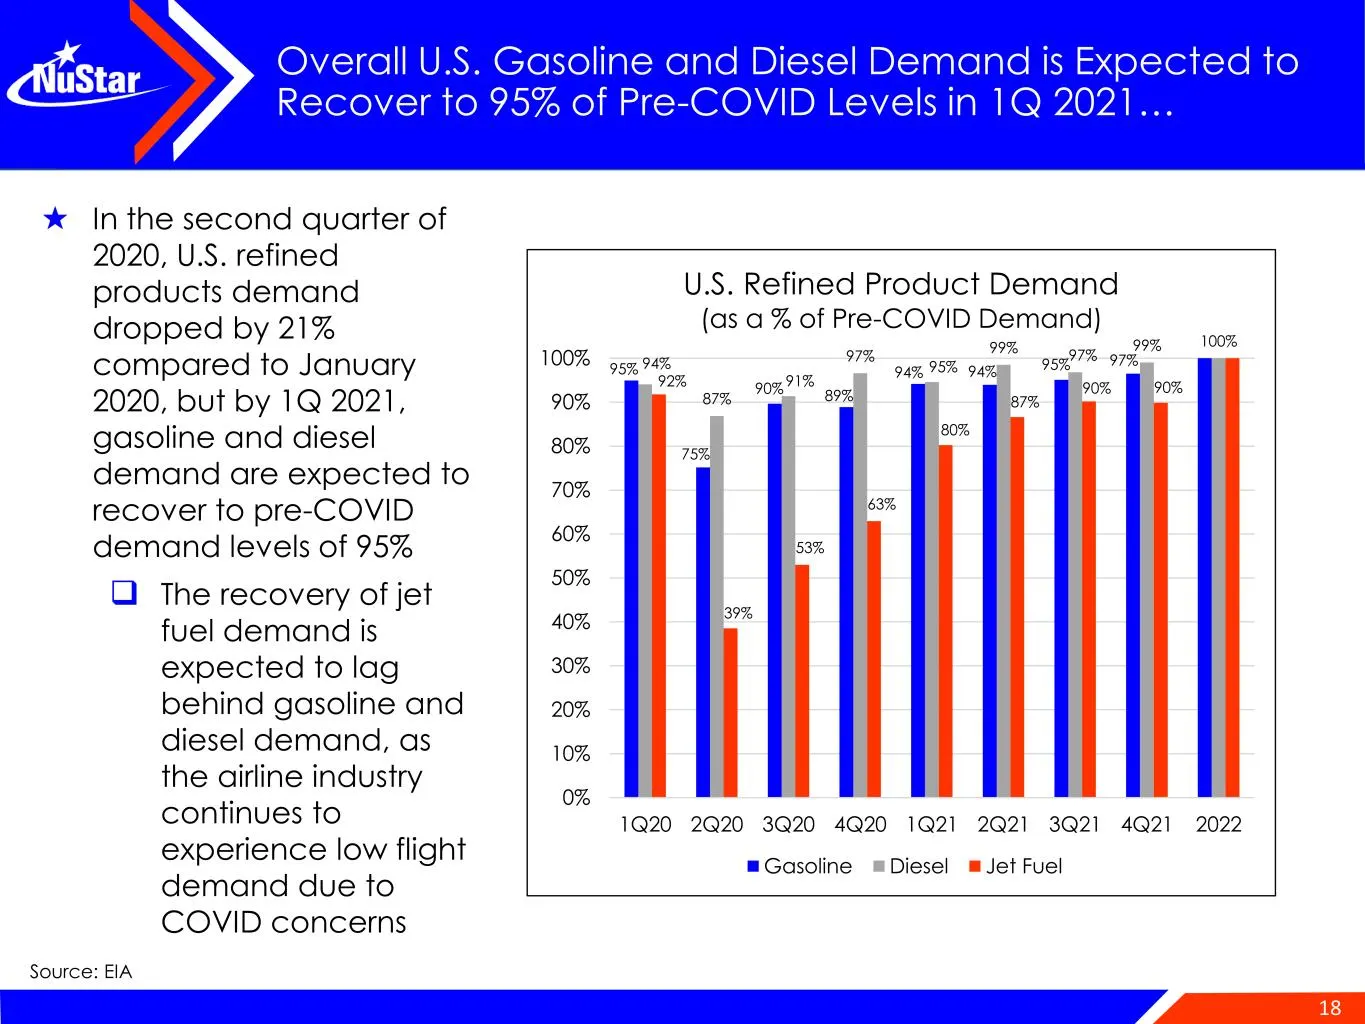
18 Overall U.S. Gasoline and Diesel Demand is Expected to Recover to 95% of Pre-COVID Levels in 1Q 2021… ★ In the second quarter of 2020, U.S. refined products demand dropped by 21% compared to January 2020, but by 1Q 2021, gasoline and diesel demand are expected to recover to pre-COVID demand level
Slide 19: Refined Products Demand Continues to Demonstrate Resilience
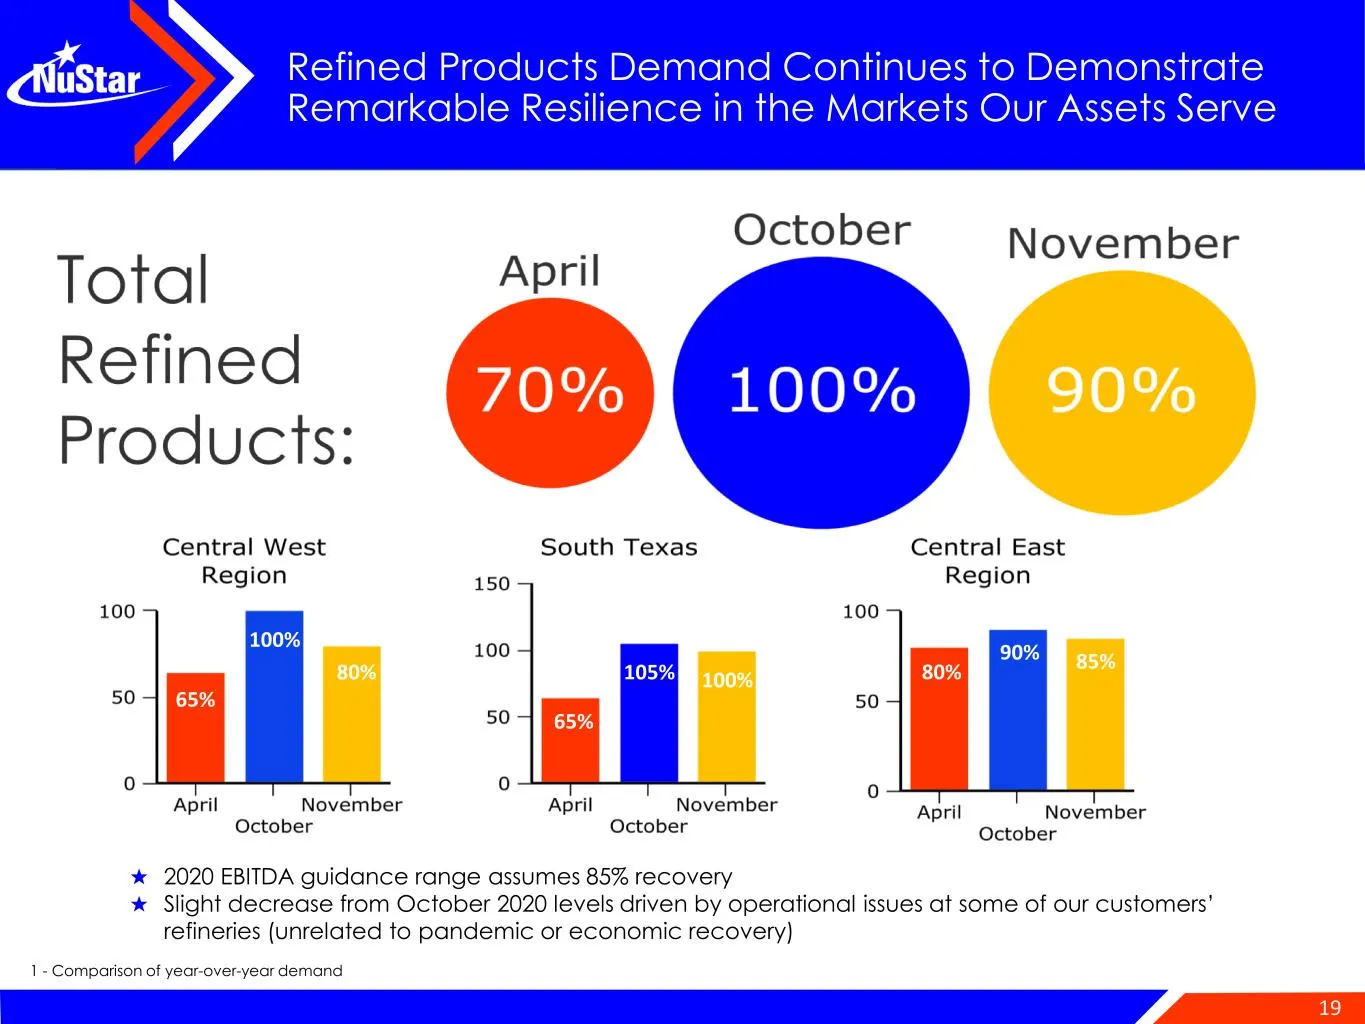
19 Refined Products Demand Continues to Demonstrate Remarkable Resilience in the Markets Our Assets Serve 1 - Comparison of year-over-year demand ★ 2020 EBITDA guidance range assumes 85% recovery ★ Slight decrease from October 2020 levels driven by operational issues at some of our customers’ refine
Slide 20: U.S. Refinery Utilization Continues to Recover
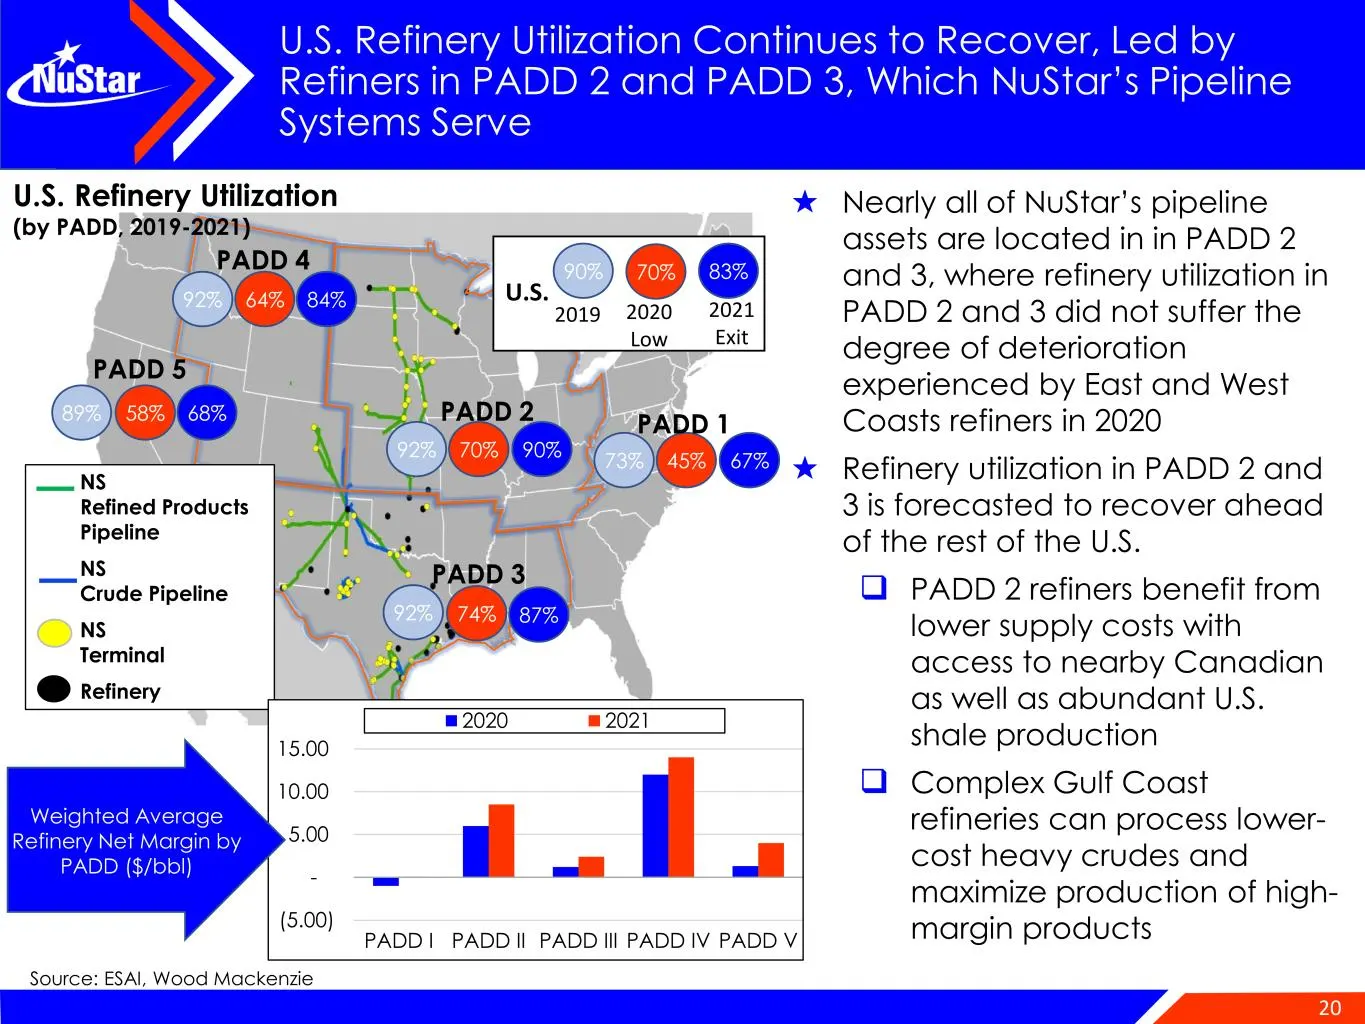
20 U.S. Refinery Utilization Continues to Recover, Led by Refiners in PADD 2 and PADD 3, Which NuStar’s Pipeline Systems Serve 2019 2020 Low 2021 Exit 90% 70% 83% U.S. 73% 45% 67% PADD 1 92% 74% PADD 3 92% 70% 90% PADD 2 92% 64% 84% PADD 4 89% 58% 68% PADD 5 87% ★ Nearly all of NuStar’s pipeline ass
Slide 21: Permian Basin Expected to Resume Growth in 2022
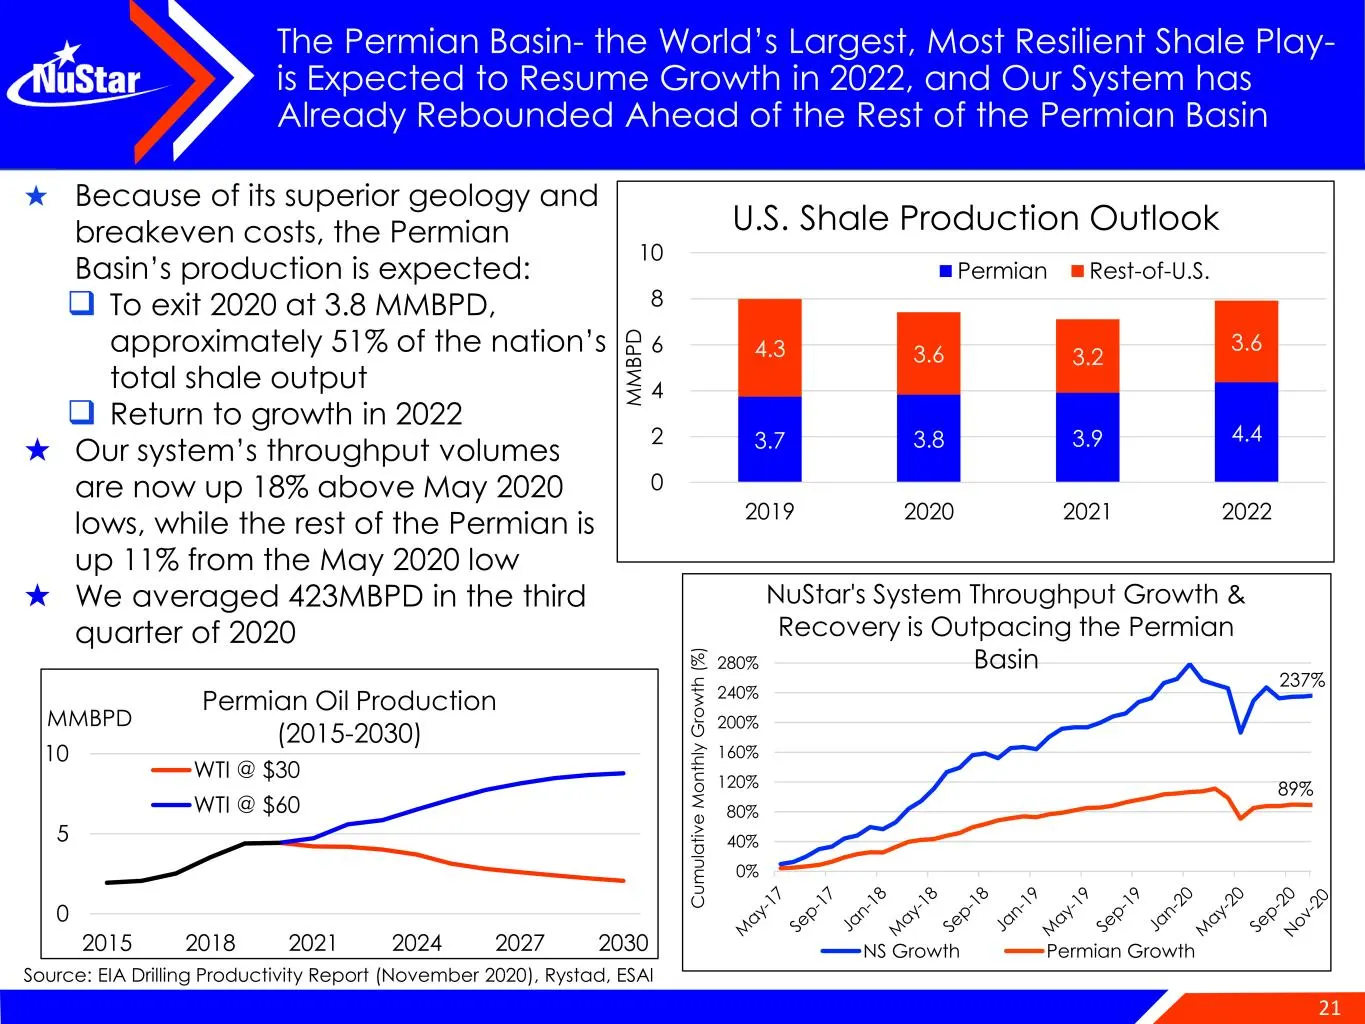
21 The Permian Basin- the World’s Largest, Most Resilient Shale Play- is Expected to Resume Growth in 2022, and Our System has Already Rebounded Ahead of the Rest of the Permian Basin ★ Because of its superior geology and breakeven costs, the Permian Basin’s production is expected: ❑ To exit 2020 at
Slide 22: Trimmed-Down Strategic Spending Program for 2020 and 2021
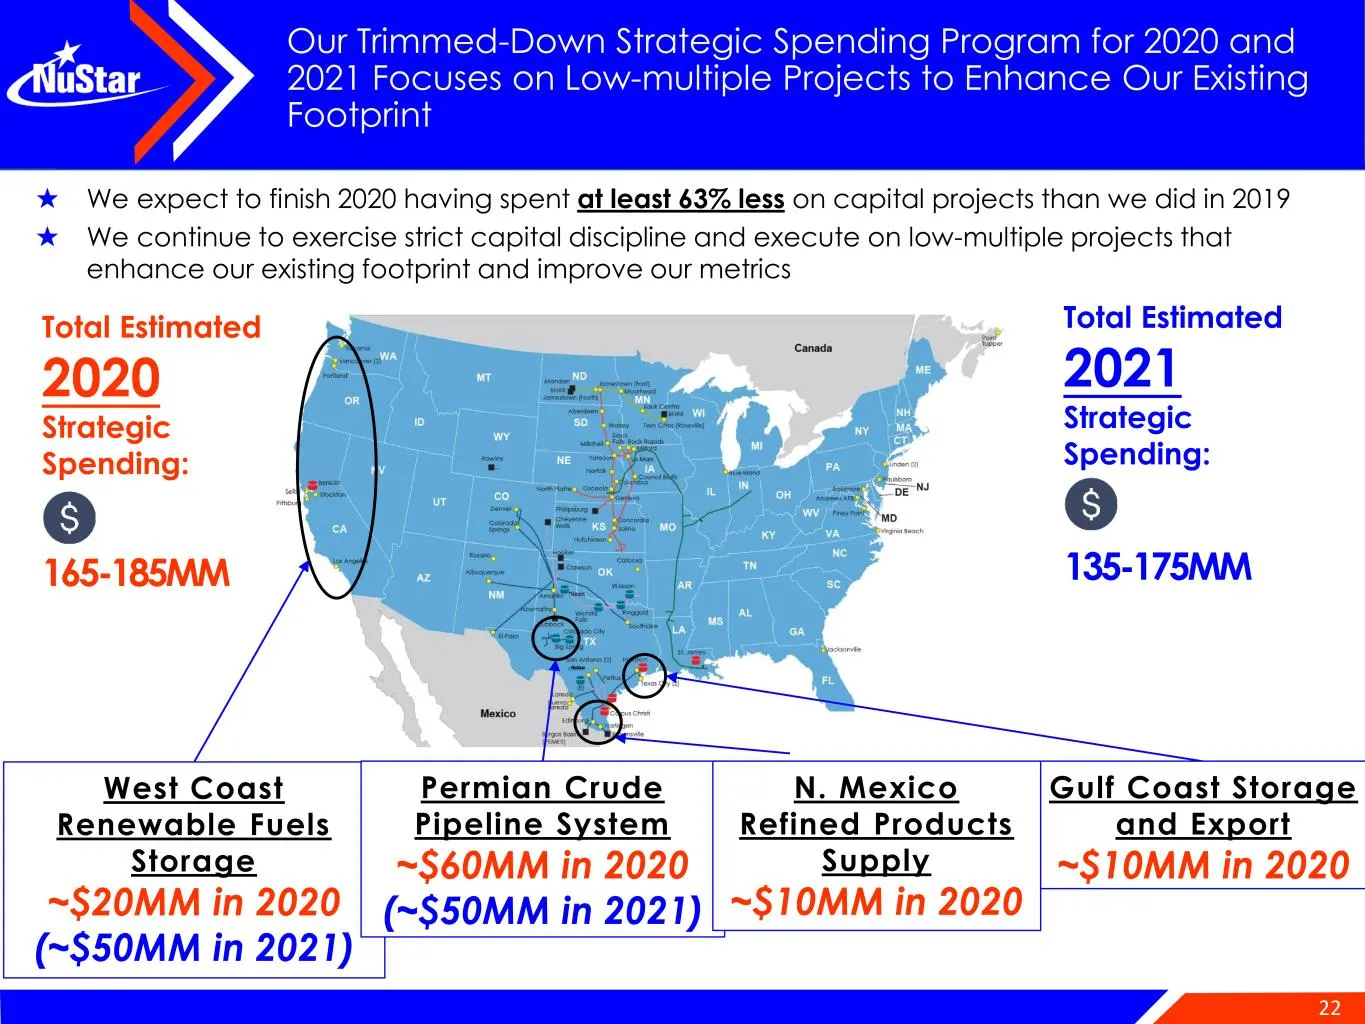
22 Our Trimmed-Down Strategic Spending Program for 2020 and 2021 Focuses on Low-multiple Projects to Enhance Our Existing Footprint West Coast Renewable Fuels Storage ~$20MM in 2020 (~$50MM in 2021) Permian Crude Pipeline System ~$60MM in 2020 (~$50MM in 2021) Total Estimated 2020 Strategic Spending
Slide 23: West Coast Carbon Emissions Reduction Goals Generate Growing Demand
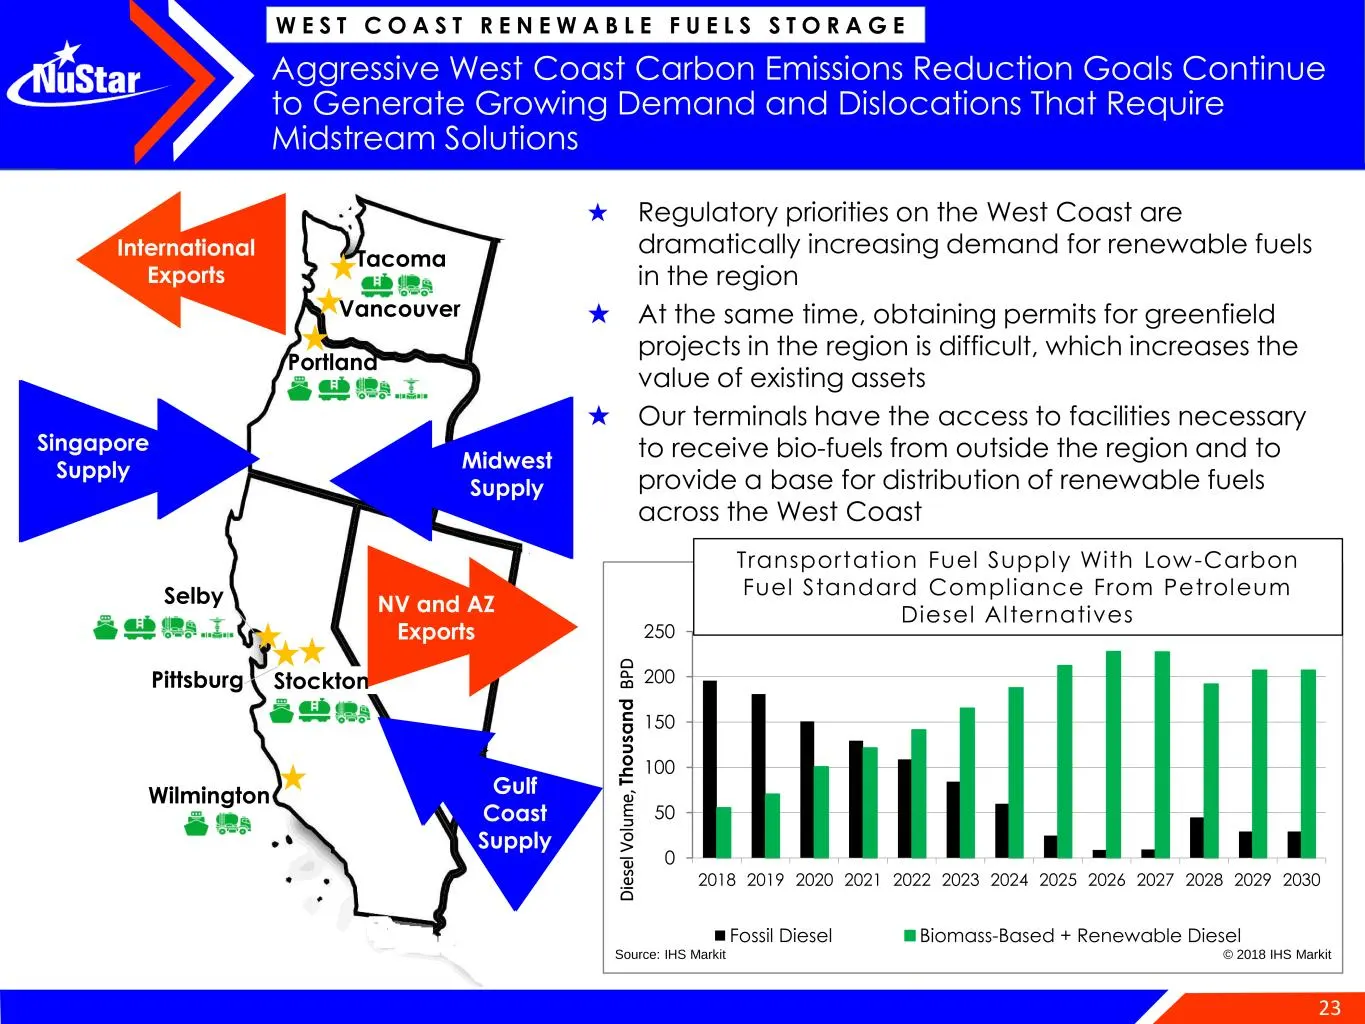
23 Aggressive West Coast Carbon Emissions Reduction Goals Continue to Generate Growing Demand and Dislocations That Require Midstream Solutions W E S T C O A S T R E N E W A B L E F U E L S S T O R A G E Wilmington Tacoma Vancouver Portland Stockton Selby Pittsburg Midwest Supply Gulf Coast Supply I
Slide 24: Partnered With Key Customers to Develop Renewable Fuels Storage Projects
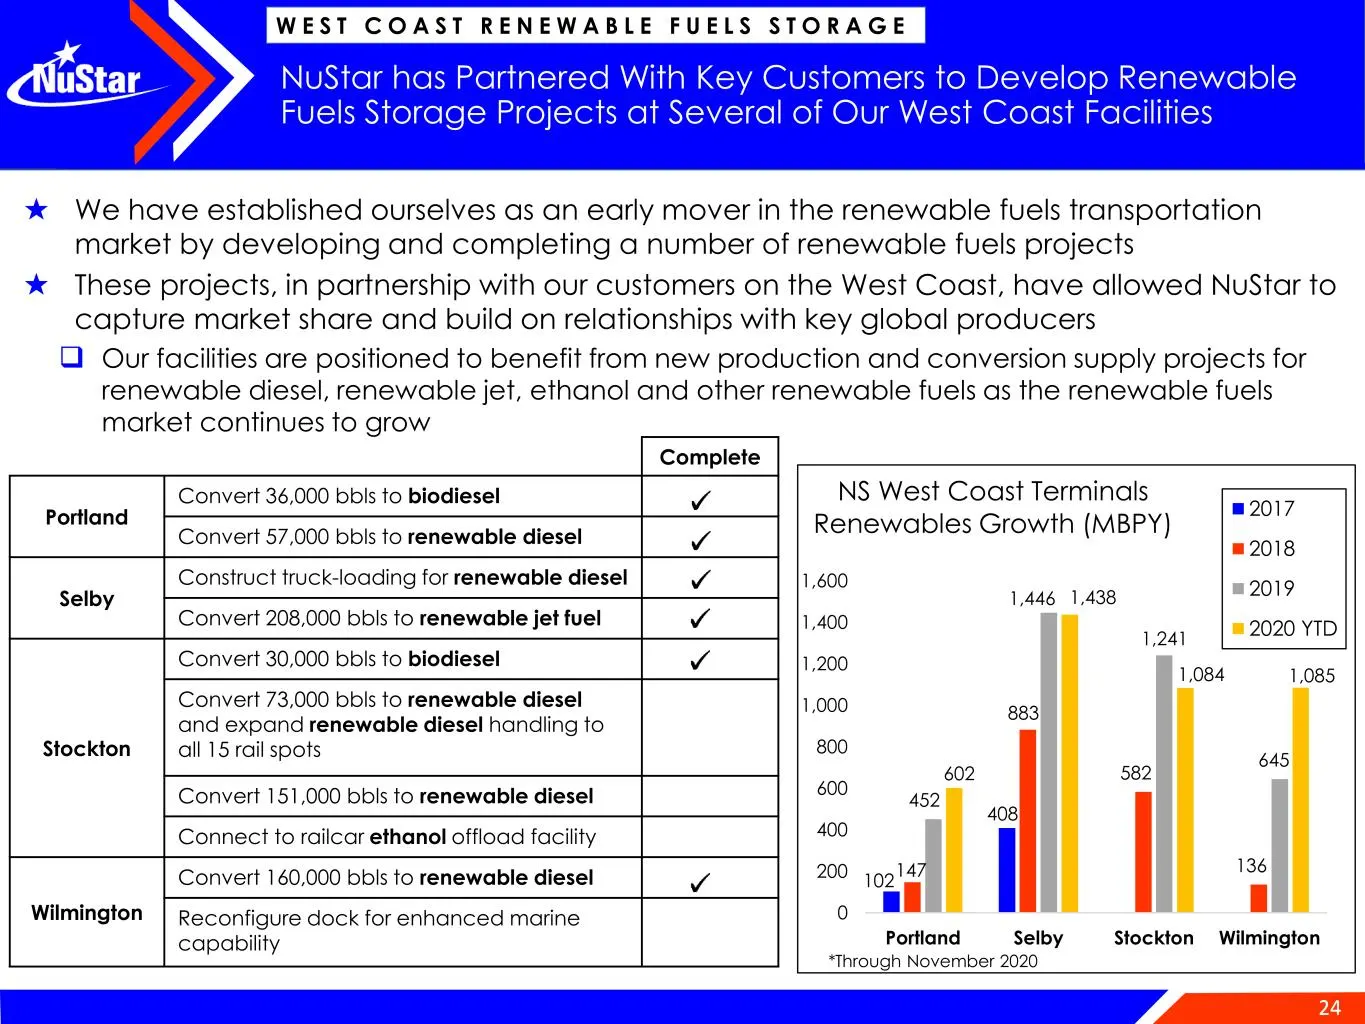
24 NuStar has Partnered With Key Customers to Develop Renewable Fuels Storage Projects at Several of Our West Coast Facilities W E S T C O A S T R E N E W A B L E F U E L S S T O R A G E Complete Portland Convert 36,000 bbls to biodiesel Convert 57,000 bbls to renewable diesel Selby Construct truck-
Slide 25: We Handle Significant Proportion of Low-Carbon Fuels Volumes in California
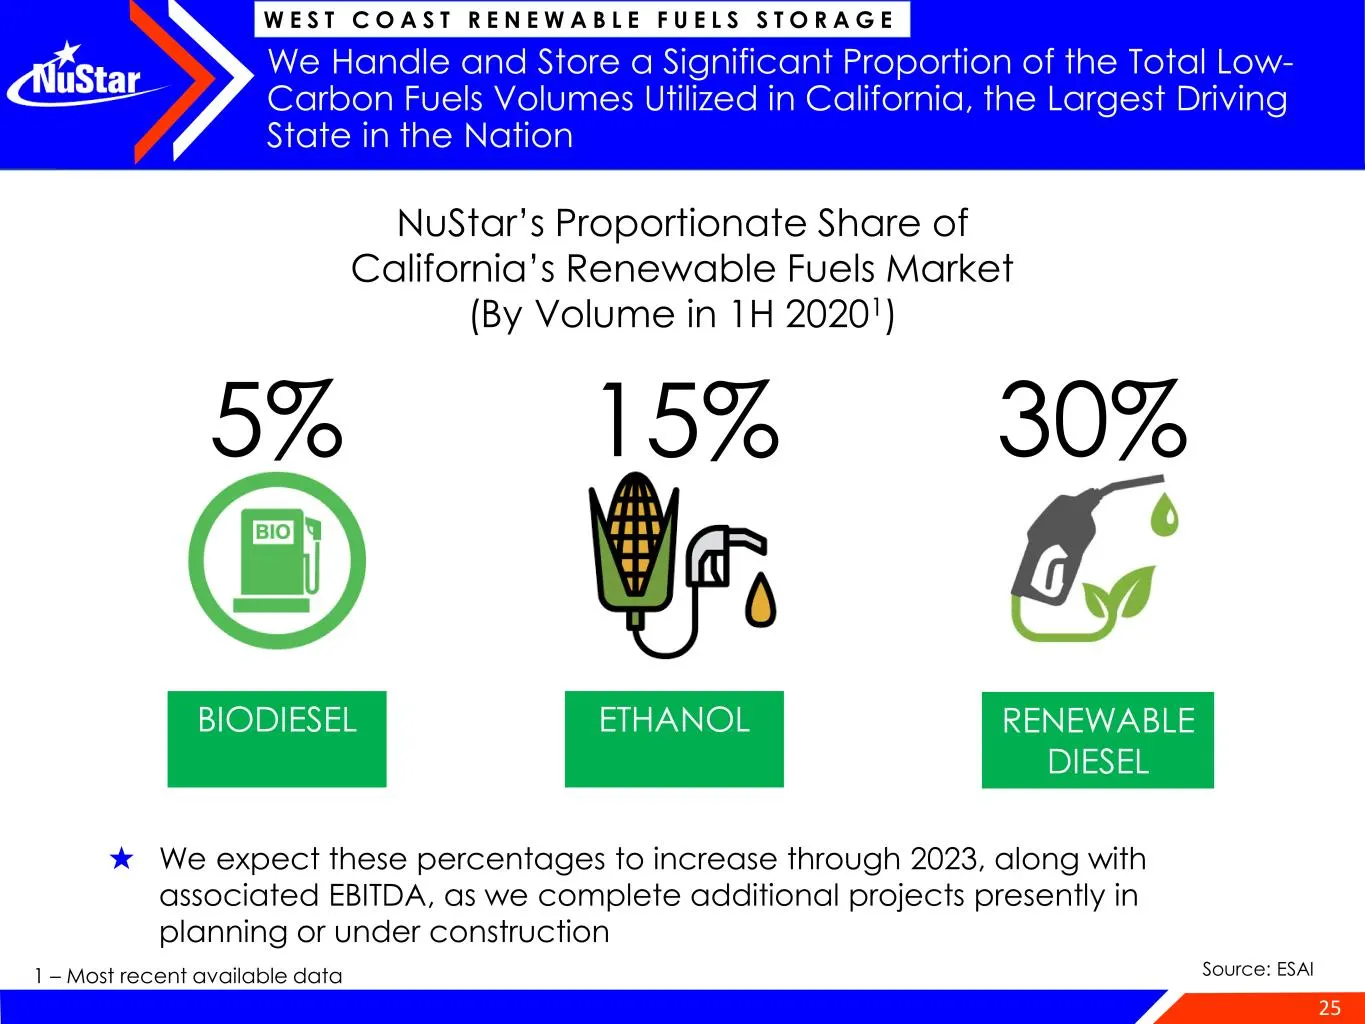
25 We Handle and Store a Significant Proportion of the Total Low- Carbon Fuels Volumes Utilized in California, the Largest Driving State in the Nation W E S T C O A S T R E N E W A B L E F U E L S S T O R A G E ★ We expect these percentages to increase through 2023, along with associated EBITDA, as
Slide 26: Permian Crude Pipeline System
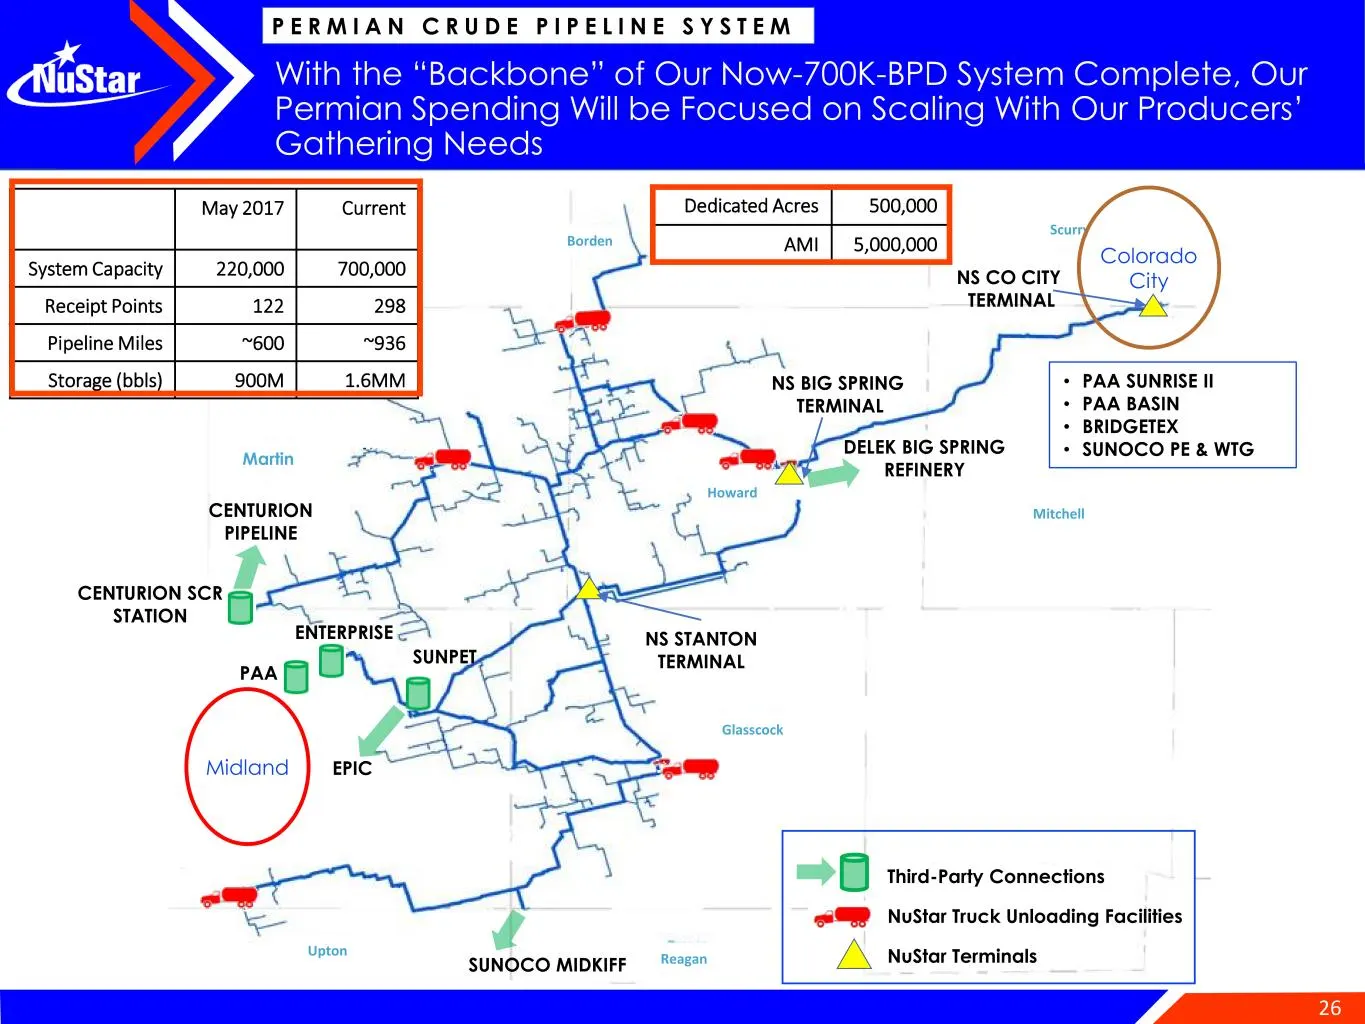
26 P E R M I A N C R U D E P I P E L I N E S Y S T E M May 2017 Current System Capacity 220,000 700,000 Receipt Points 122 298 Pipeline Miles ~600 ~936 Storage (bbls) 900M 1.6MM Third-Party Connections NuStar Truck Unloading Facilities NuStar Terminals • PAA SUNRISE II • PAA BASIN • BRIDGETEX • SUNO
Slide 27: Our Core of the Core Location Has Attracted Top-Tier Customers
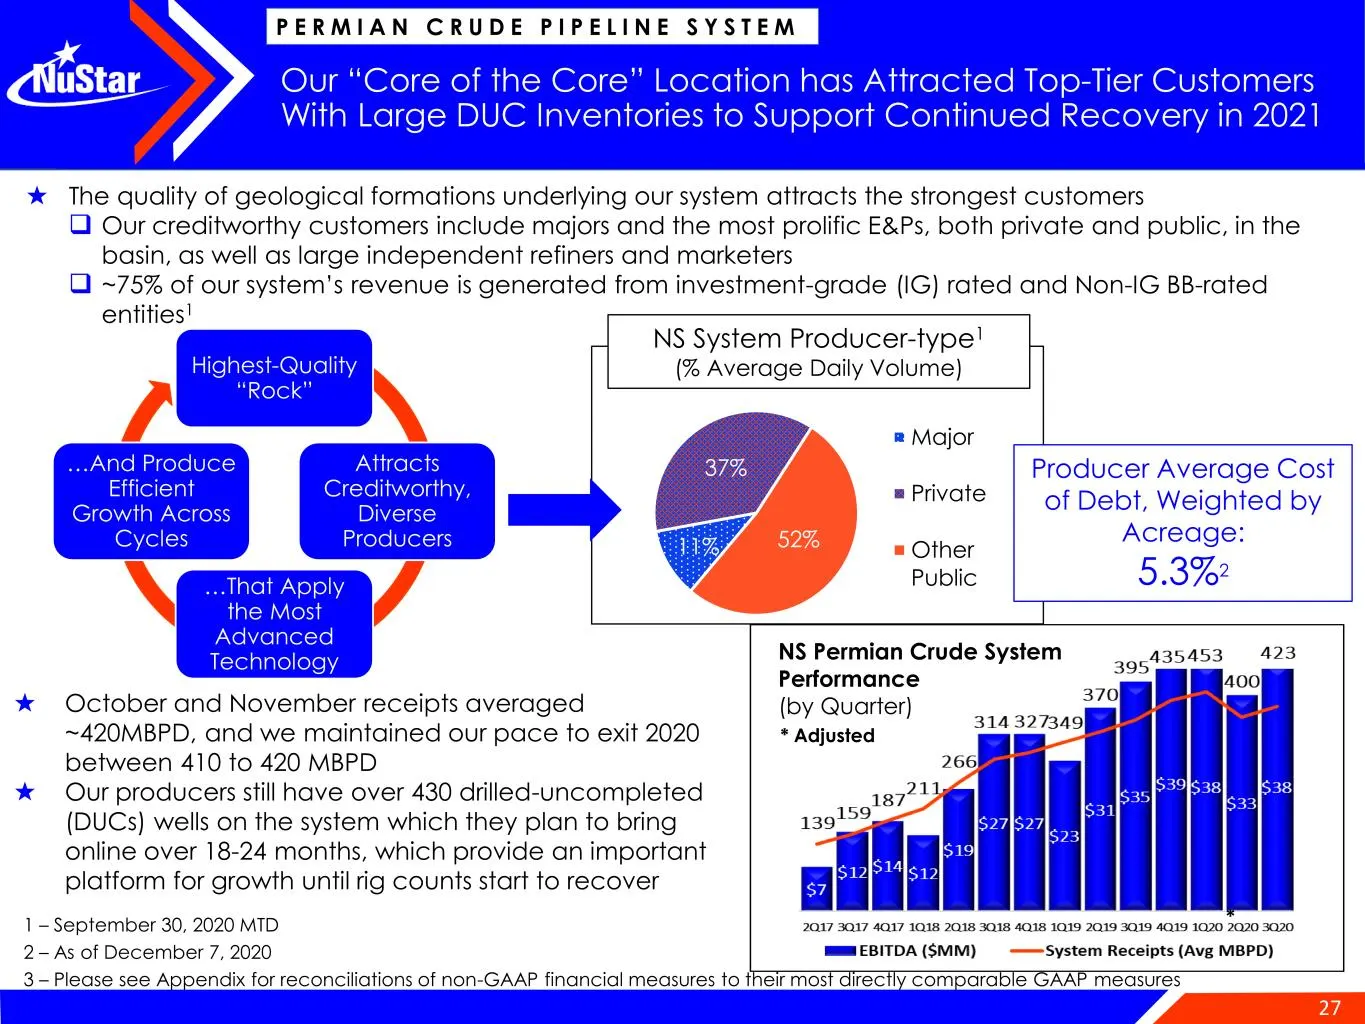
27 Our “Core of the Core” Location has Attracted Top-Tier Customers With Large DUC Inventories to Support Continued Recovery in 2021 P E R M I A N C R U D E P I P E L I N E S Y S T E M 11% 37% 52% Major Private Other Public 1 – September 30, 2020 MTD 2 – As of December 7, 2020 3 – Please see Appendi
Slide 28: Port of Corpus Christi Remains the Leading U.S. Crude Export Hub
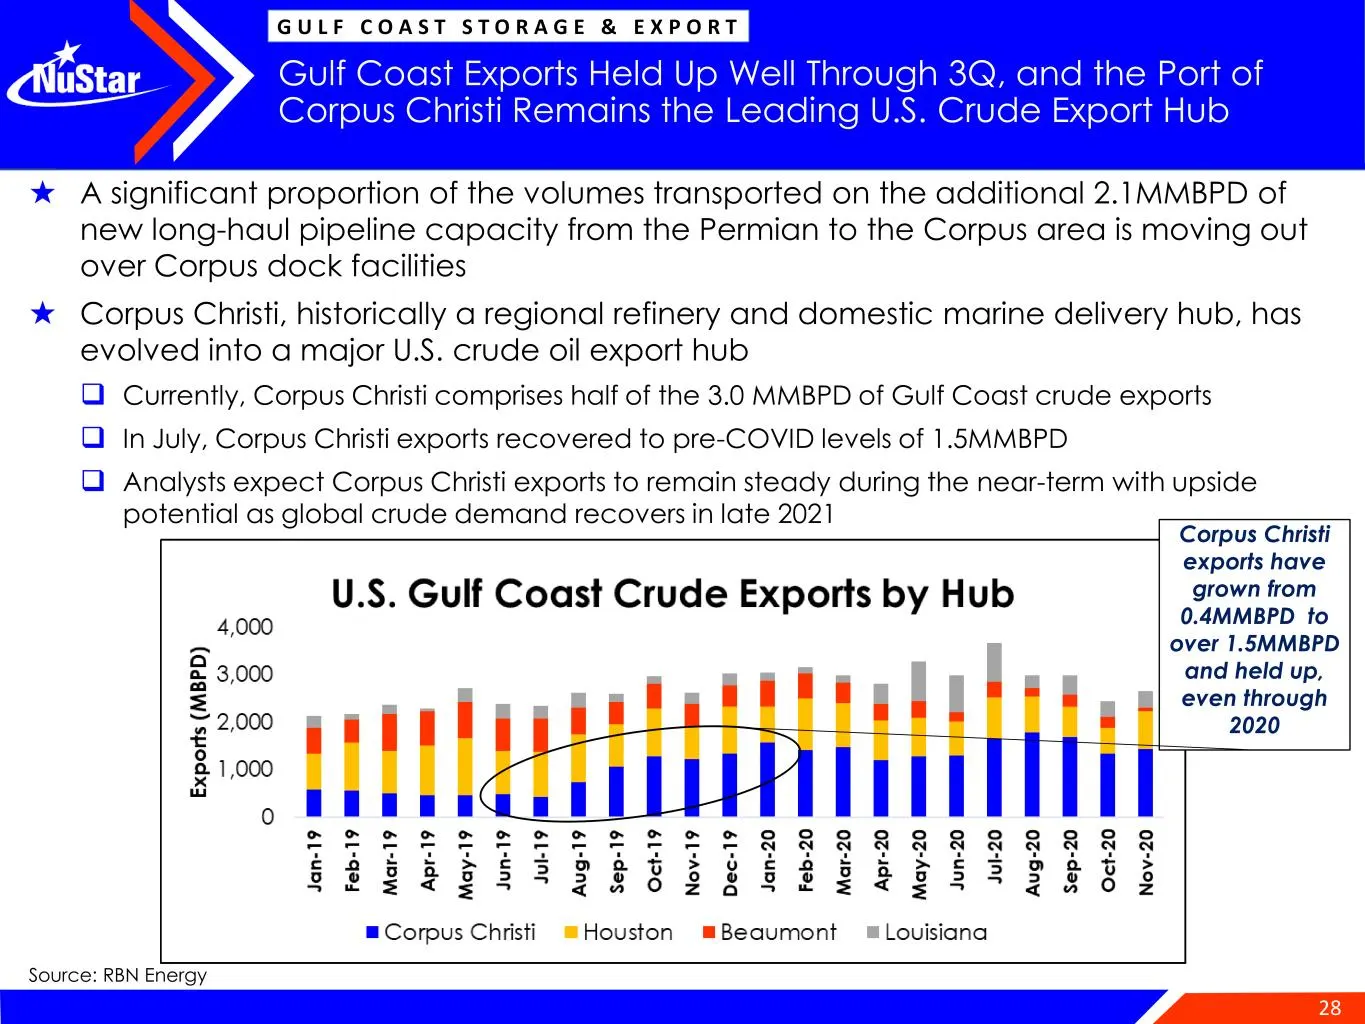
28 ★ A significant proportion of the volumes transported on the additional 2.1MMBPD of new long-haul pipeline capacity from the Permian to the Corpus area is moving out over Corpus dock facilities ★ Corpus Christi, historically a regional refinery and domestic marine delivery hub, has evolved into a
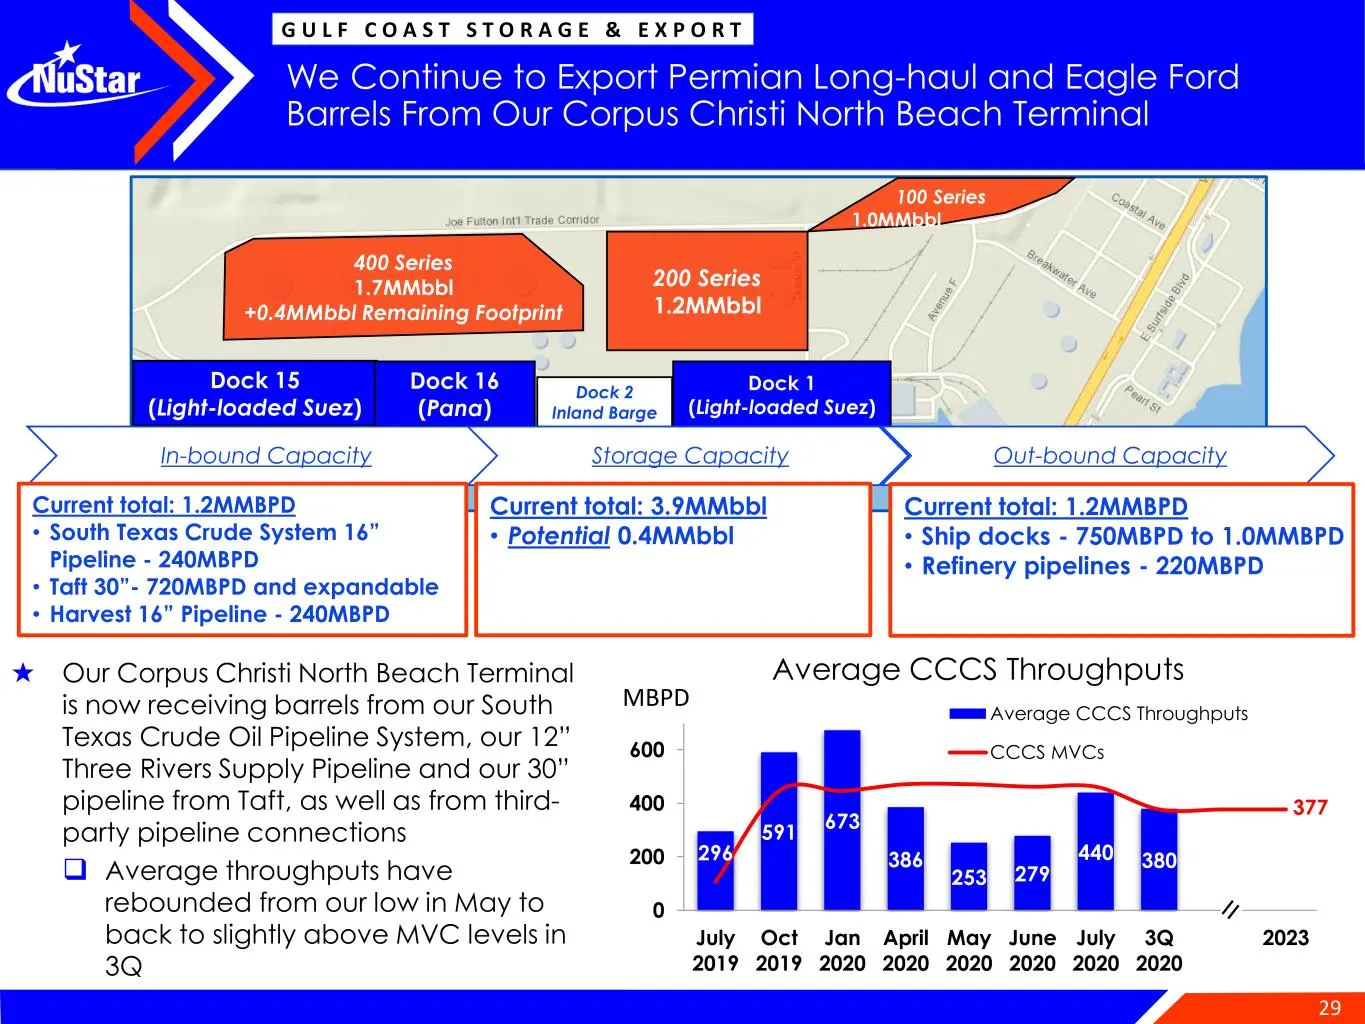
Slide 29: We Continue to Export Permian and Eagle Ford Barrels From Corpus Christi
29 296 591 673 386 253 279 440 380 377 0 200 400 600 July 2019 Oct 2019 Jan 2020 April 2020 May 2020 June 2020 July 2020 3Q 2020 2023 Average CCCS Throughputs CCCS MVCs Average CCCS Throughputs 400 Series 1.7MMbbl +0.4MMbbl Remaining Footprint 200 Series 1.2MMbbl 100 Series 1.0MMbbl . Dock 15 (Light
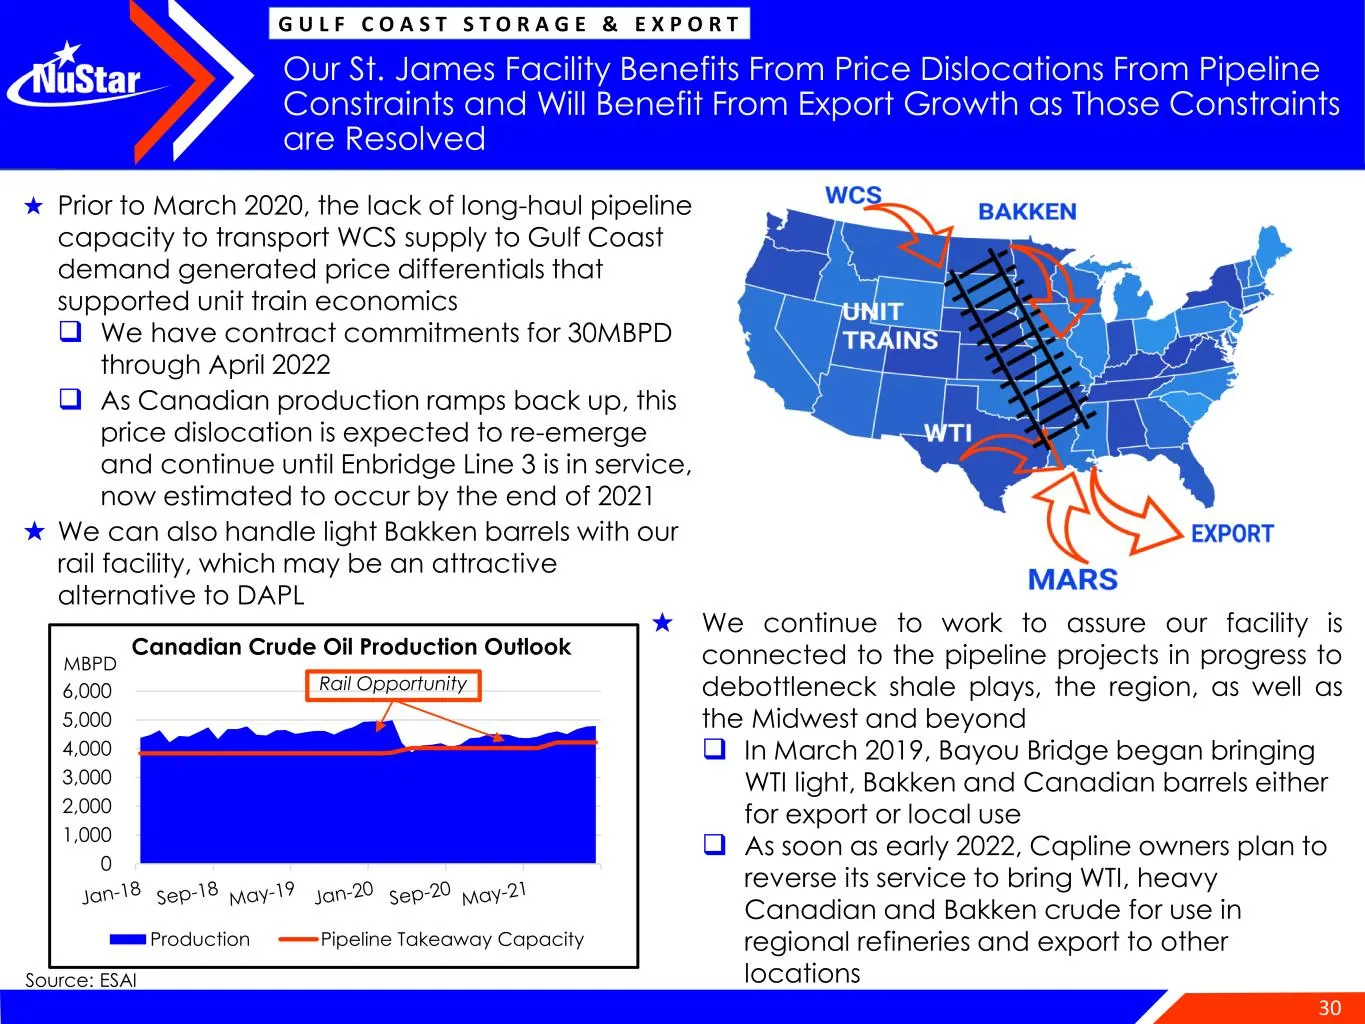
Slide 30: St. James Facility Benefits From Price Dislocations
30 Our St. James Facility Benefits From Price Dislocations From Pipeline Constraints and Will Benefit From Export Growth as Those Constraints are Resolved G U L F C O A S T S T O R A G E & E X P O R T ★ We continue to work to assure our facility is connected to the pipeline projects in progress to d
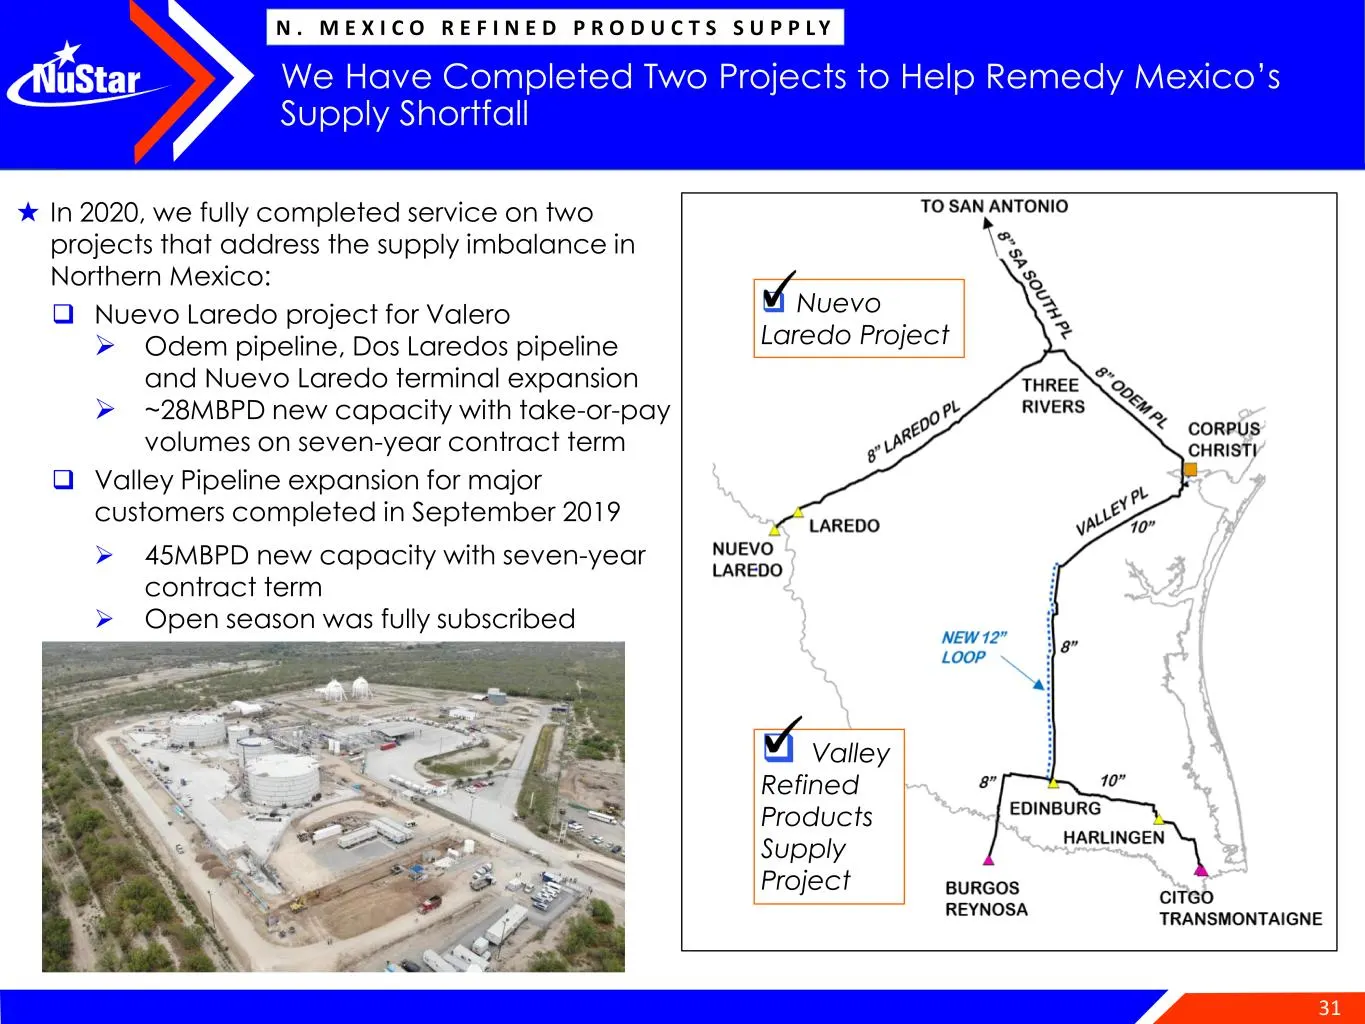
Slide 31: We Completed Two Projects to Help Remedy Mexico's Supply Shortfall
31 We Have Completed Two Projects to Help Remedy Mexico’s Supply Shortfall N . M E X I C O R E F I N E D P R O D U C T S S U P P L Y ★ In 2020, we fully completed service on two projects that address the supply imbalance in Northern Mexico: ❑ Nuevo Laredo project for Valero ➢ Odem pipeline, Dos Lare
Slide 32: Appendix
South Texas Crude System 32 APPENDIX
Slide 33: Long-term Commitments From Creditworthy Customers
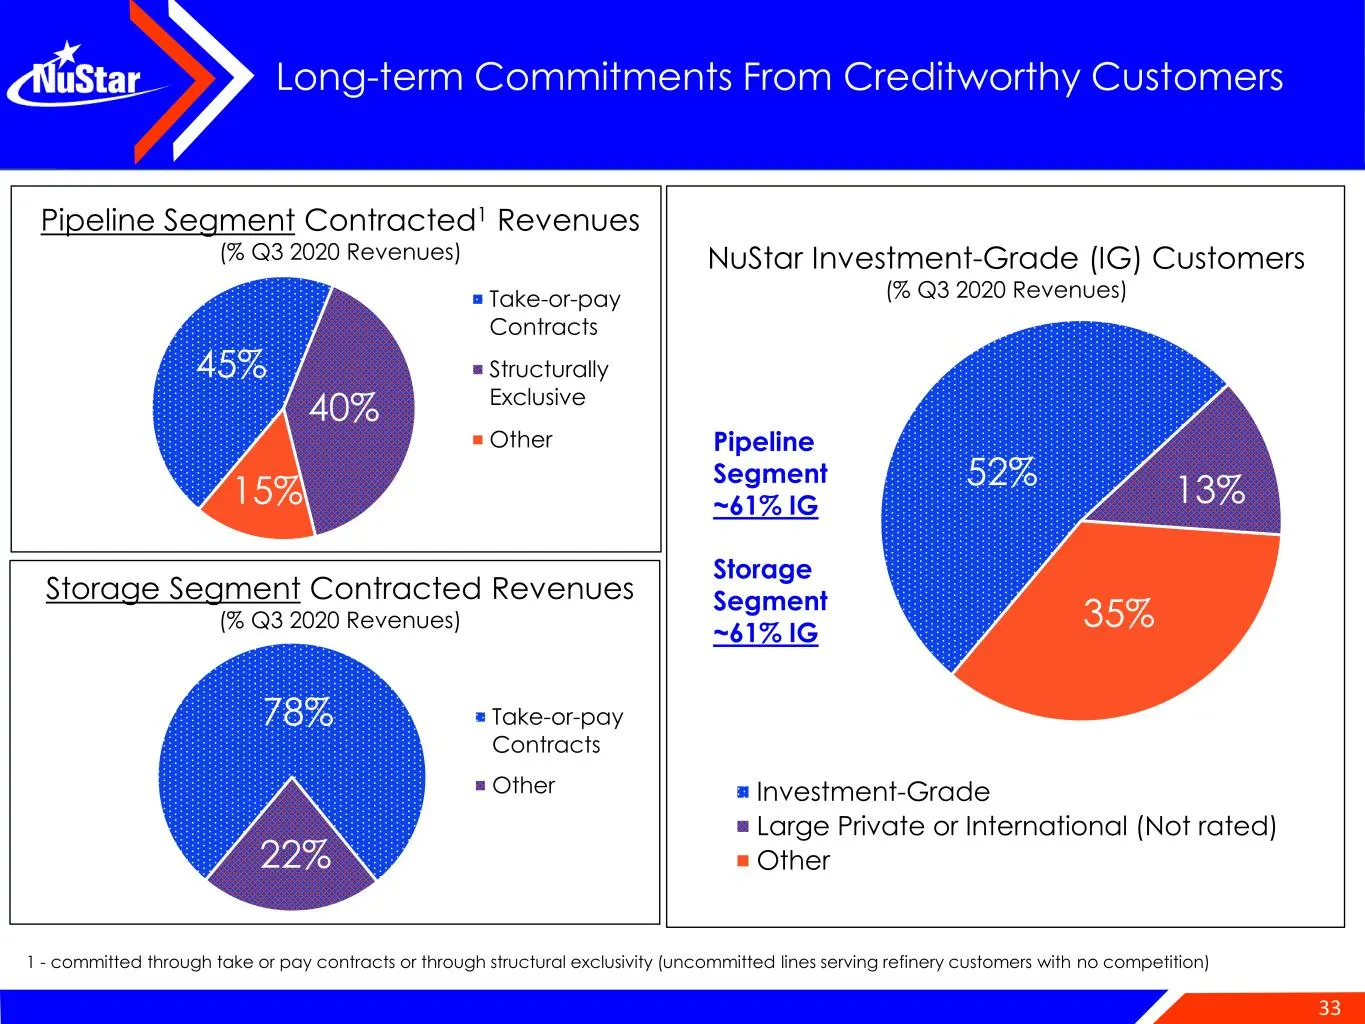
33 Long-term Commitments From Creditworthy Customers 52% 13% 35% Investment-Grade Large Private or International (Not rated) Other NuStar Investment-Grade (IG) Customers (% Q3 2020 Revenues) Pipeline Segment ~61% IG Storage Segment ~61% IG 45% 40% 15% Take-or-pay Contracts Structurally Exclusive Oth
Slide 34: Balance of Our Business Contributes to the Resilience of Our Results
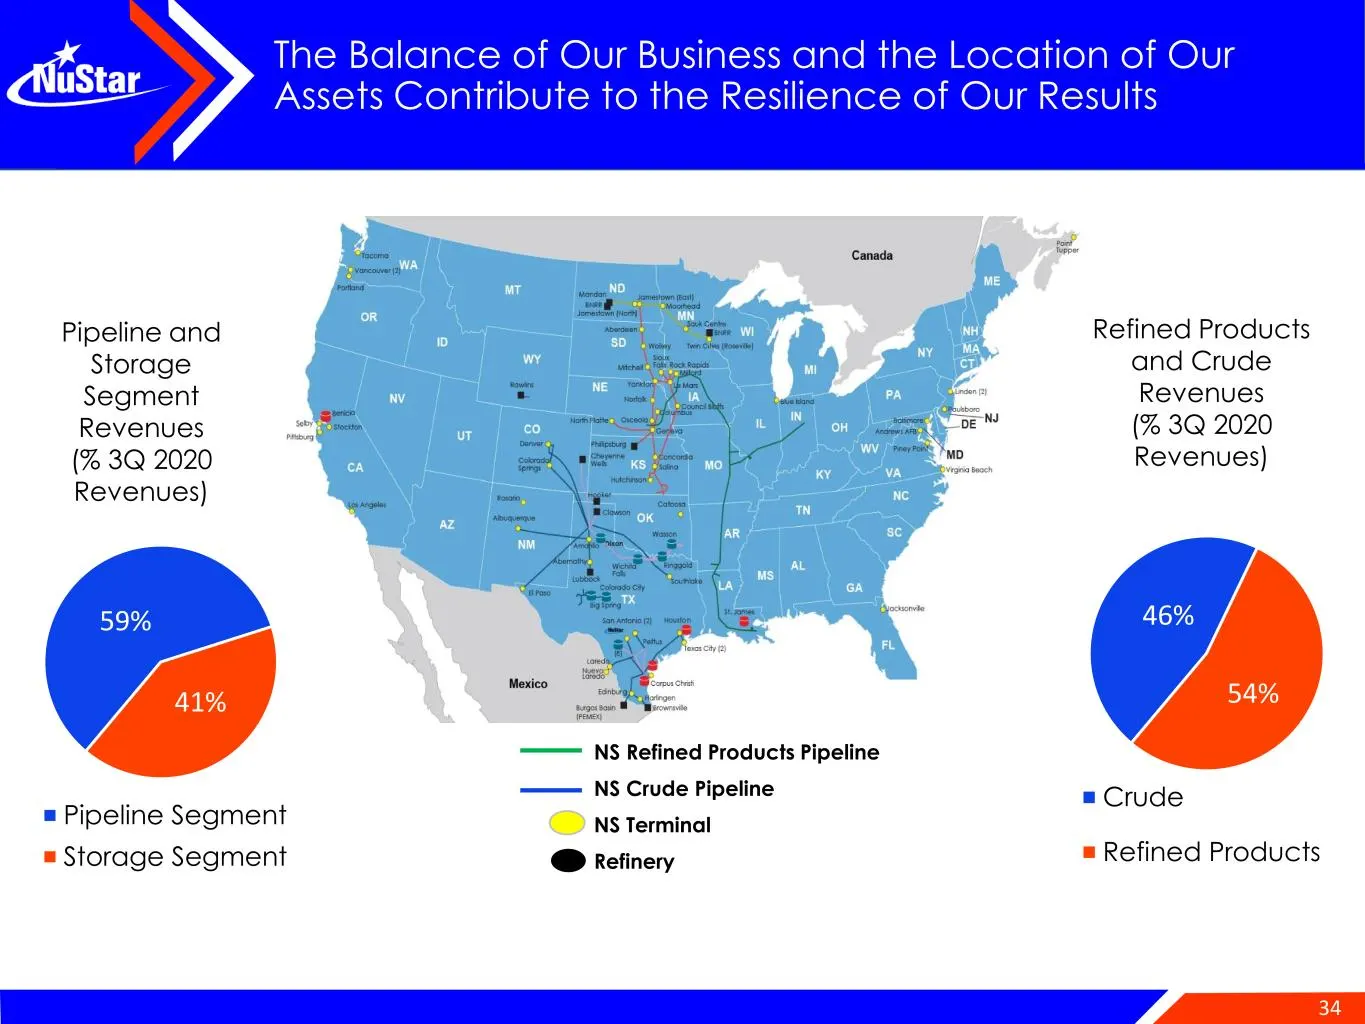
34 The Balance of Our Business and the Location of Our Assets Contribute to the Resilience of Our Results 59% 41% Pipeline Segment Storage Segment Pipeline and Storage Segment Revenues (% 3Q 2020 Revenues) Refined Products and Crude Revenues (% 3Q 2020 Revenues) 46% 54% Crude Refined Products NS Ref
Slide 35: We Acquired Our Permian Crude System for Its Advantaged Acreage
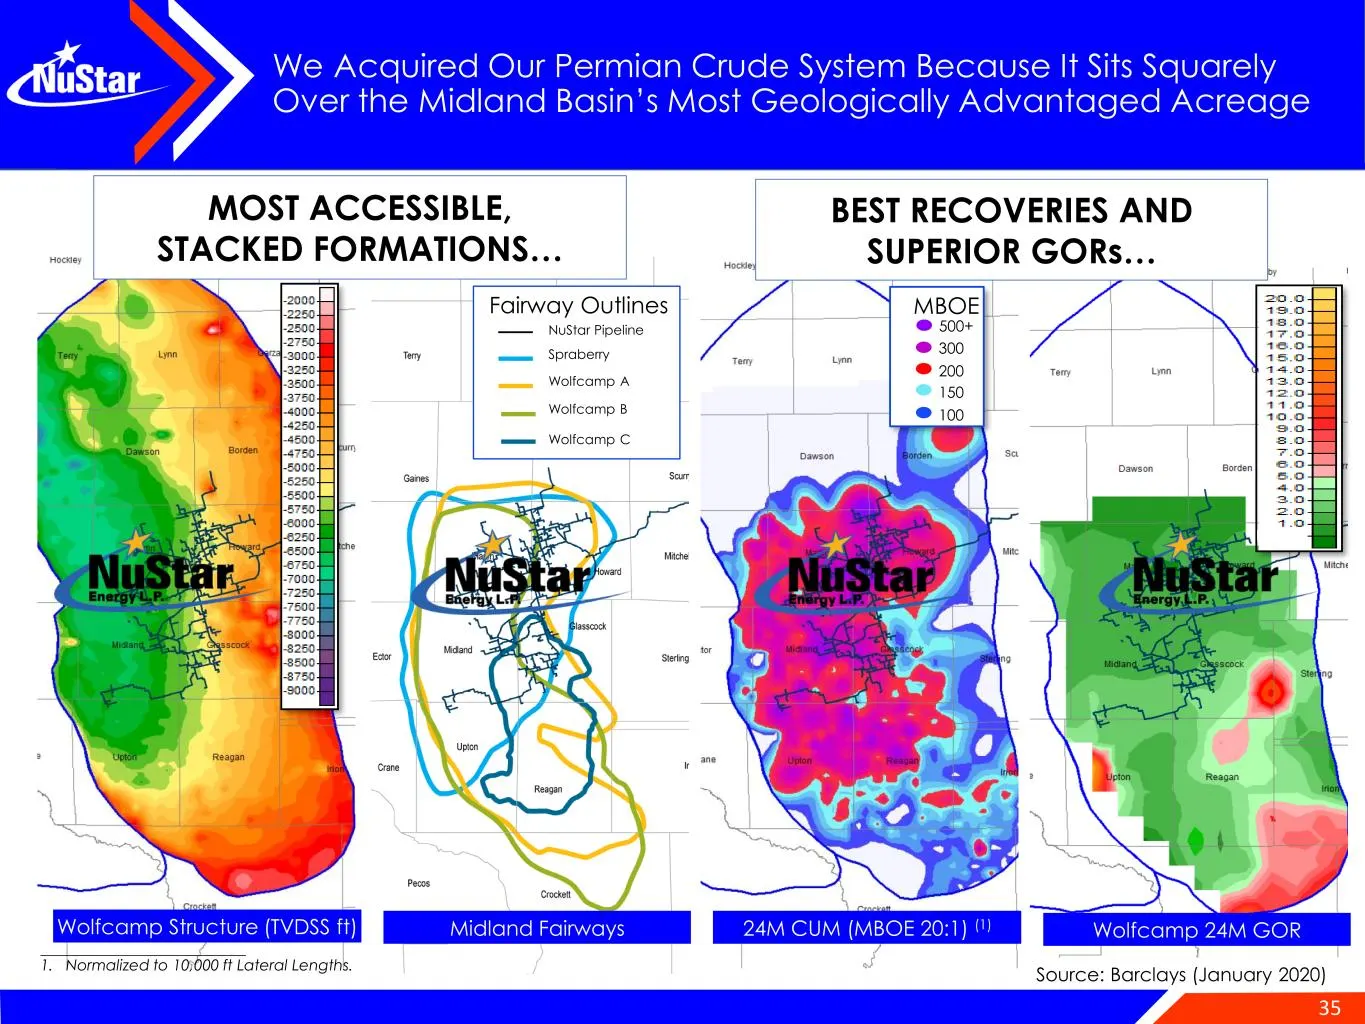
35 We Acquired Our Permian Crude System Because It Sits Squarely Over the Midland Basin’s Most Geologically Advantaged Acreage Source: Barclays (January 2020) ___________________________ 1. Normalized to 10,000 ft Lateral Lengths. Wolfcamp Structure (TVDSS ft) Midland Fairways 24M CUM (MBOE 20:1) (1
Slide 36: Debt Maturity Schedule
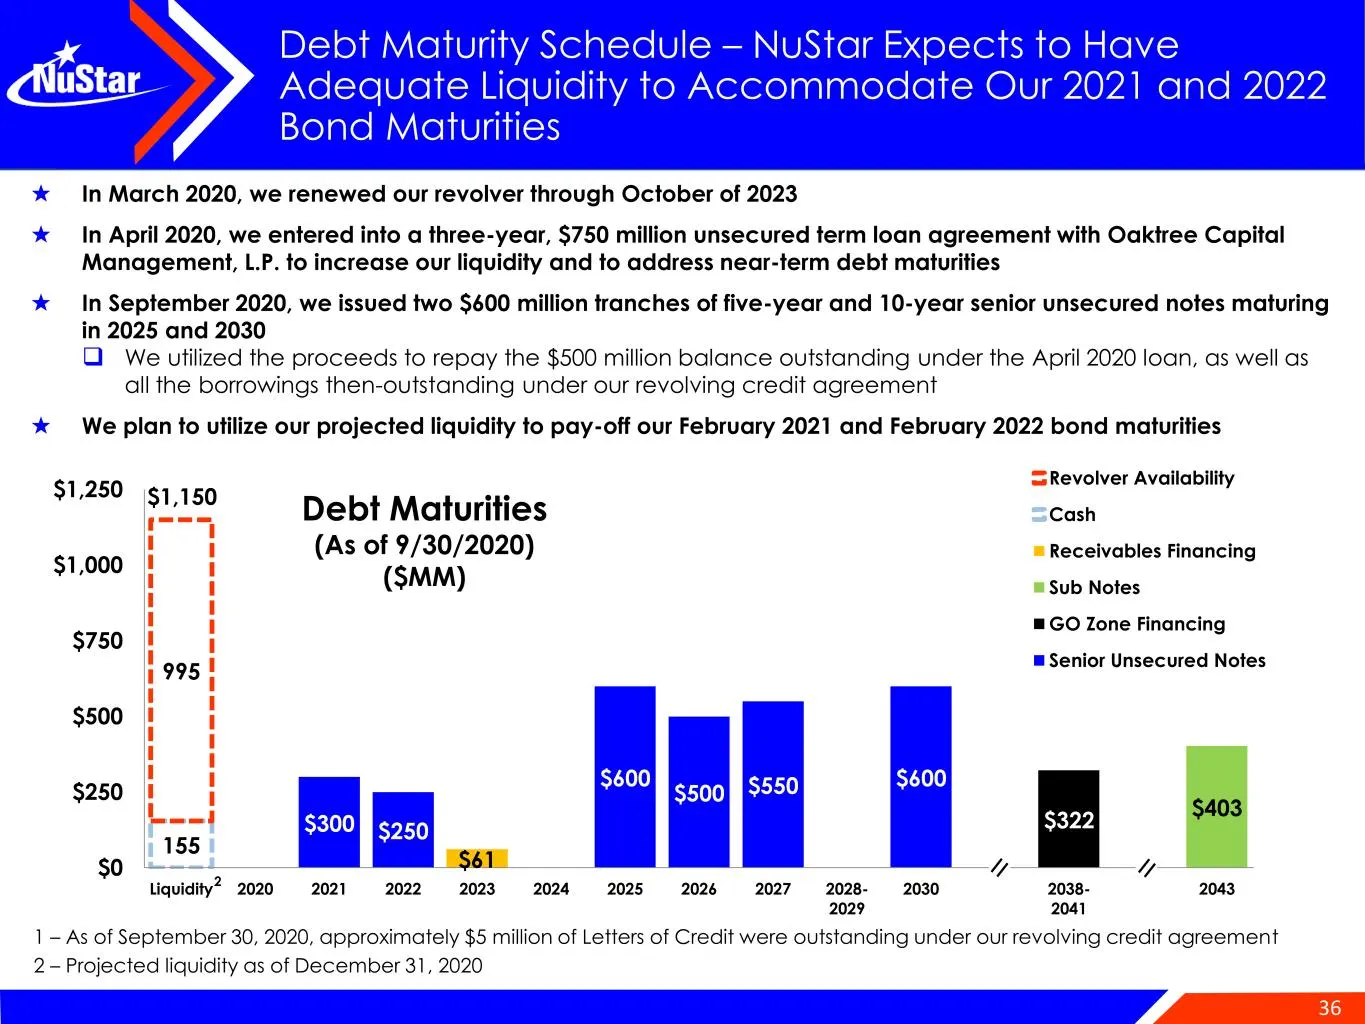
36 $300 $250 $600 $500 $550 $600 $322 $403 $61 155 995 $0 $250 $500 $750 $1,000 $1,250 Liquidity 2020 2021 2022 2023 2024 2025 2026 2027 2028- 2029 2030 2038- 2041 2043 Revolver Availability Cash Receivables Financing Sub Notes GO Zone Financing Senior Unsecured Notes $1,150 Debt Maturity Schedule –
Slide 37: Capital Structure as of September 30, 2020
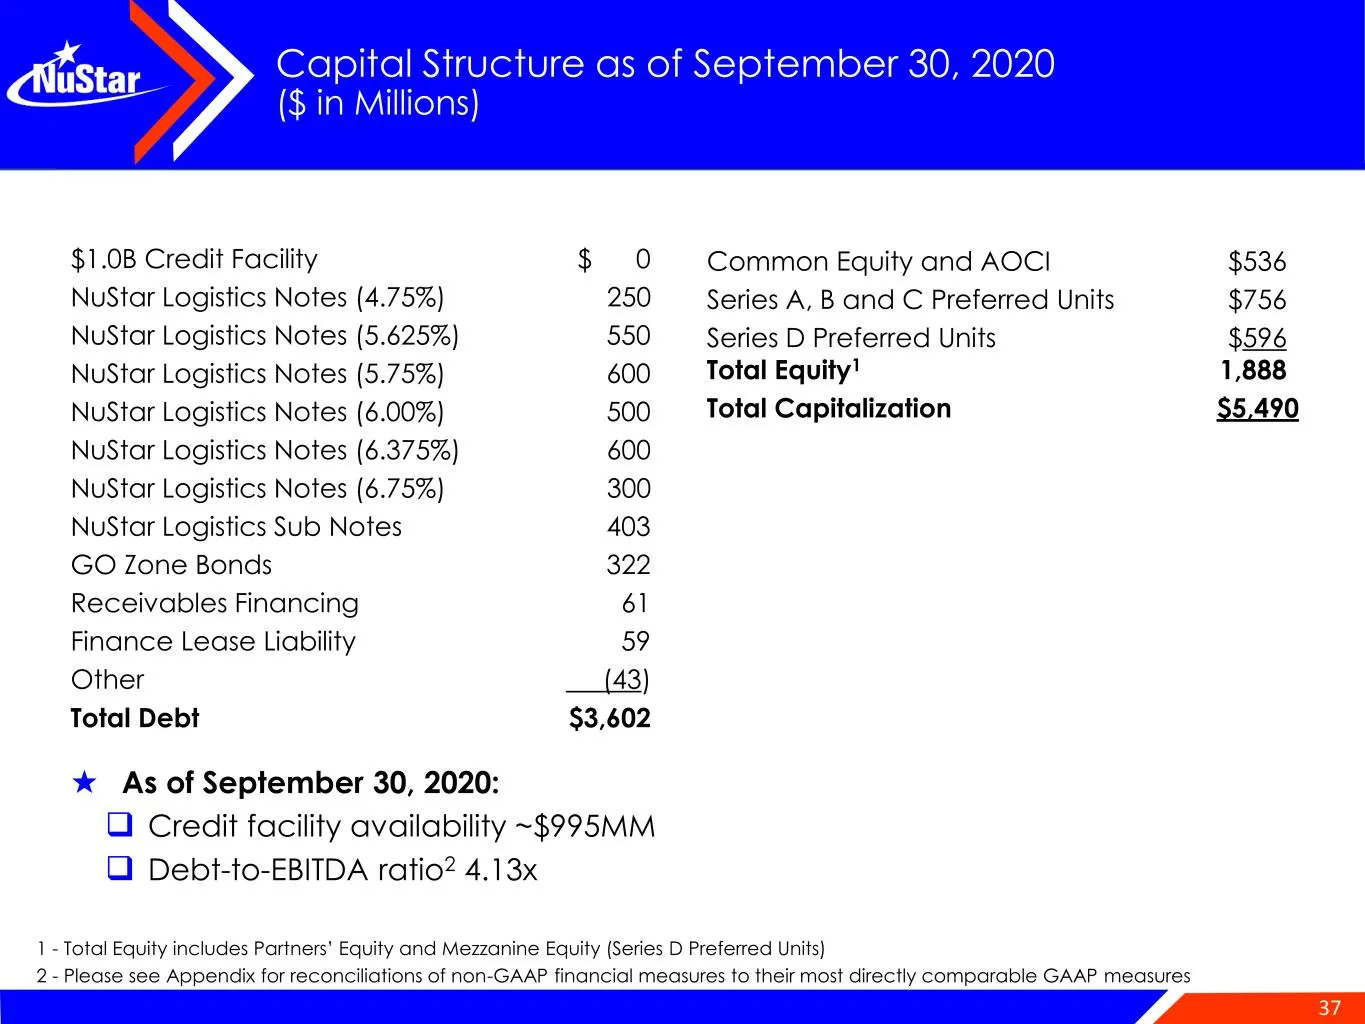
37 Capital Structure as of September 30, 2020 ($ in Millions) $1.0B Credit Facility $ 0 NuStar Logistics Notes (4.75%) 250 NuStar Logistics Notes (5.625%) 550 NuStar Logistics Notes (5.75%) 600 NuStar Logistics Notes (6.00%) 500 NuStar Logistics Notes (6.375%) 600 NuStar Logistics Notes (6.75%) 300
Slide 38: Reconciliation of Non-GAAP Financial Information
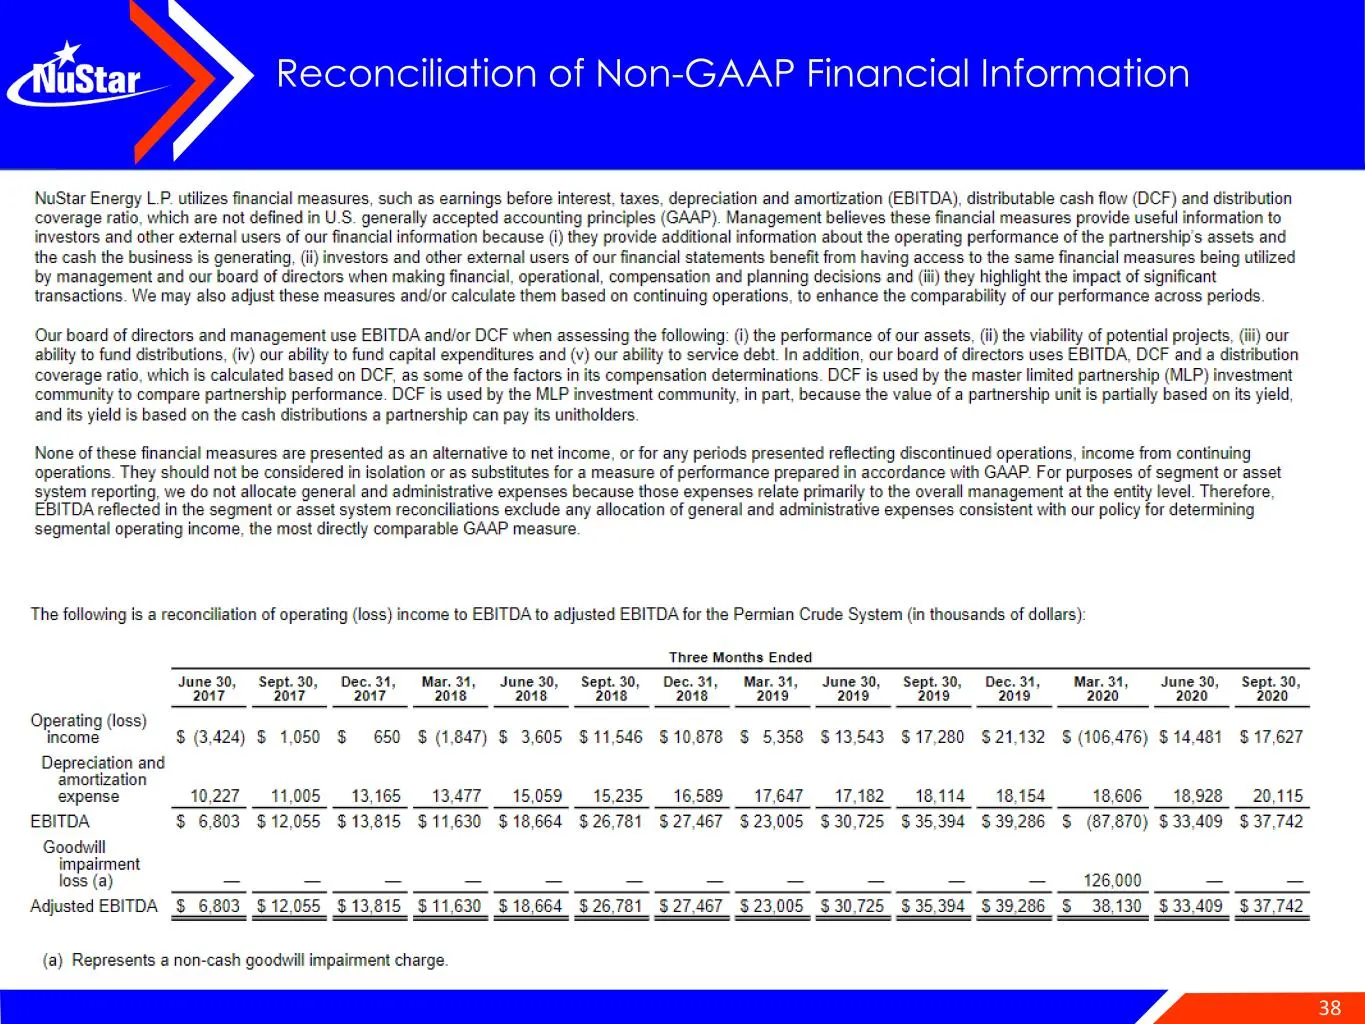
38 Reconciliation of Non-GAAP Financial Information
Slide 39: Reconciliation of Non-GAAP Financial Information (continued)
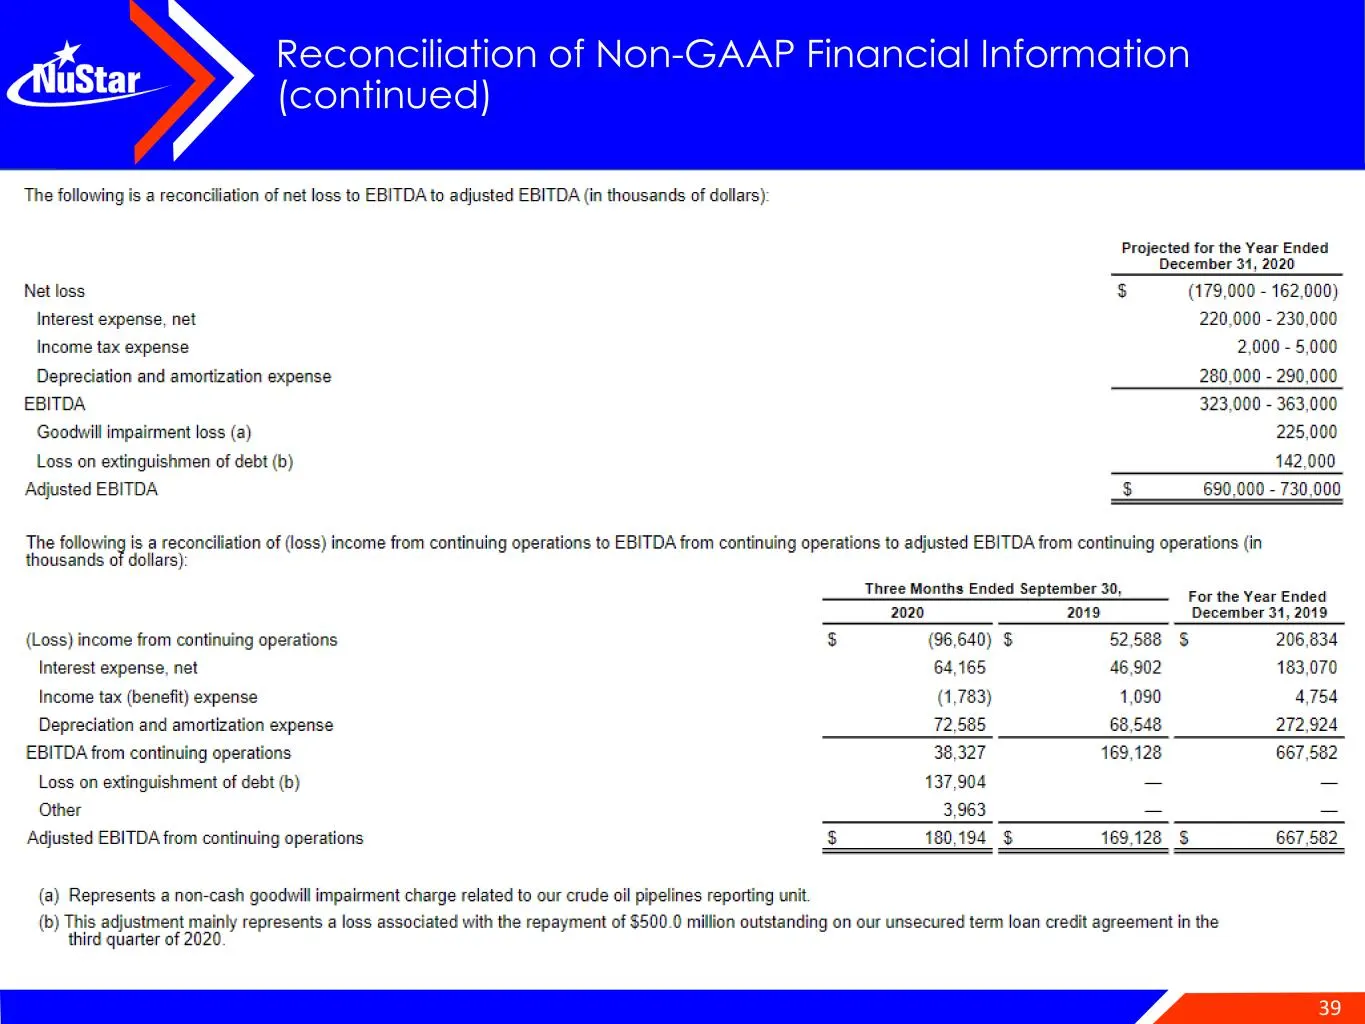
39 Reconciliation of Non-GAAP Financial Information (continued)
Slide 40: Reconciliation of Non-GAAP Financial Information (continued)
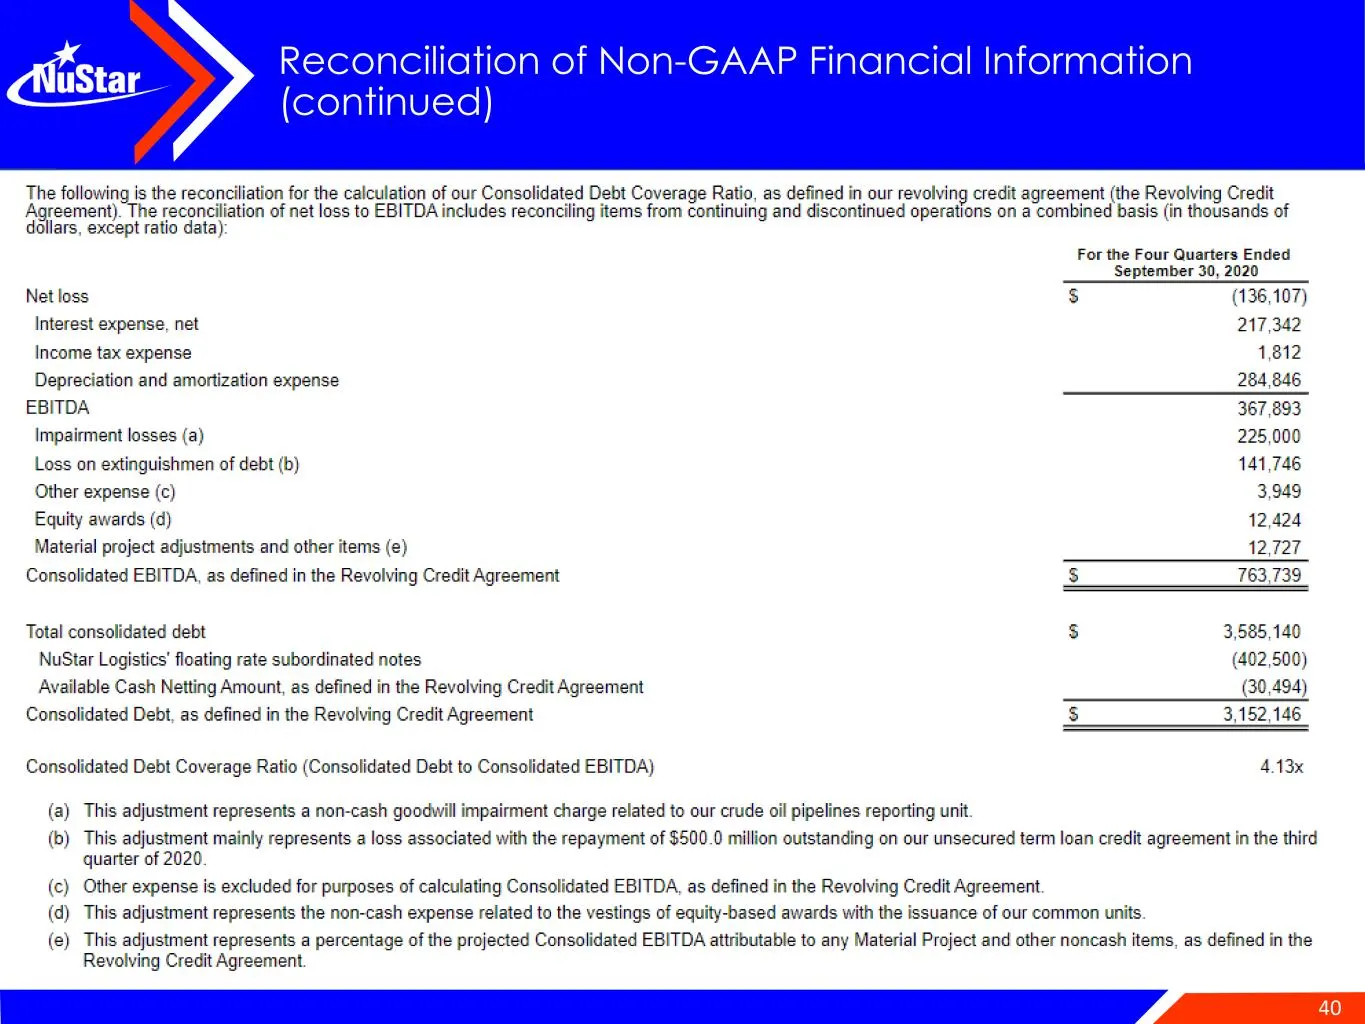
40 Reconciliation of Non-GAAP Financial Information (continued)
Source: SEC EDGAR · 8-K filed Jan 12, 2021
More decks from NuStar Energy LP
 Merger or Acquisition (January 2024)14 slides · Jan 22, 2024
 Investor Presentation (December 2023)35 slides · Dec 5, 2023
 Raymond James Virtual Energy Supply Chain Conference 2023; Pickering Energy Partners TE&MF36 slides · Sep 19, 2023
 Barclays CEO Energy-Power Conference 202336 slides · Sep 6, 2023
 Citi One-on-One Midstream/Energy Infrastructure Conference 202336 slides · Aug 22, 2023
 8th Annual J.P. Morgan Energy, Power & Renewables Conference 202336 slides · Jun 21, 2023