Curo — Stephens Investment Conference 2019
29 slides from Curo's conference presentation, Nov 12, 2019

Slide 1: November 2019 :: Stephens Investment Conference
November 2019 :: Stephens Investment Conference
Slide 2: Disclaimer
Disclaimer IMPORTANT: You must read the following information before continuing to the rest of the presentation. This presentation has been prepared by CURO Group Holdings Corp. and is being provided to you for informational purposes only. Forward-Looking Statements This presentation contains forwar
Slide 3: CURO At a Glance
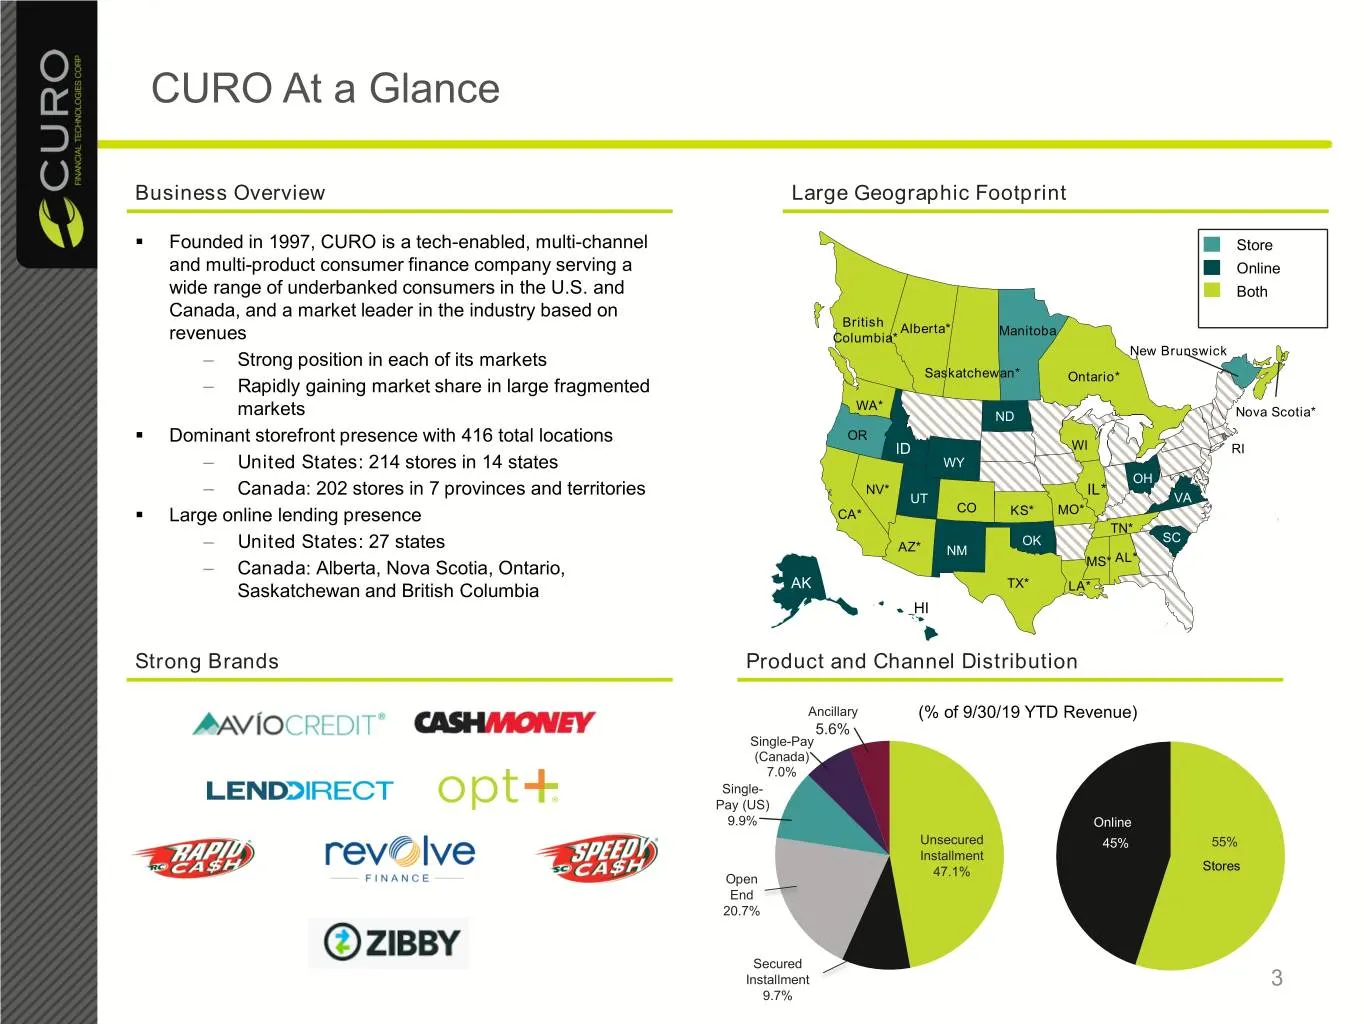
CURO At a Glance Business Overview Large Geographic Footprint . Founded in 1997, CURO is a tech-enabled, multi-channel Store and multi-product consumer finance company serving a Online wide range of underbanked consumers in the U.S. and Both Canada, and a market leader in the industry based on Briti
Slide 4: Key Investment Highlights
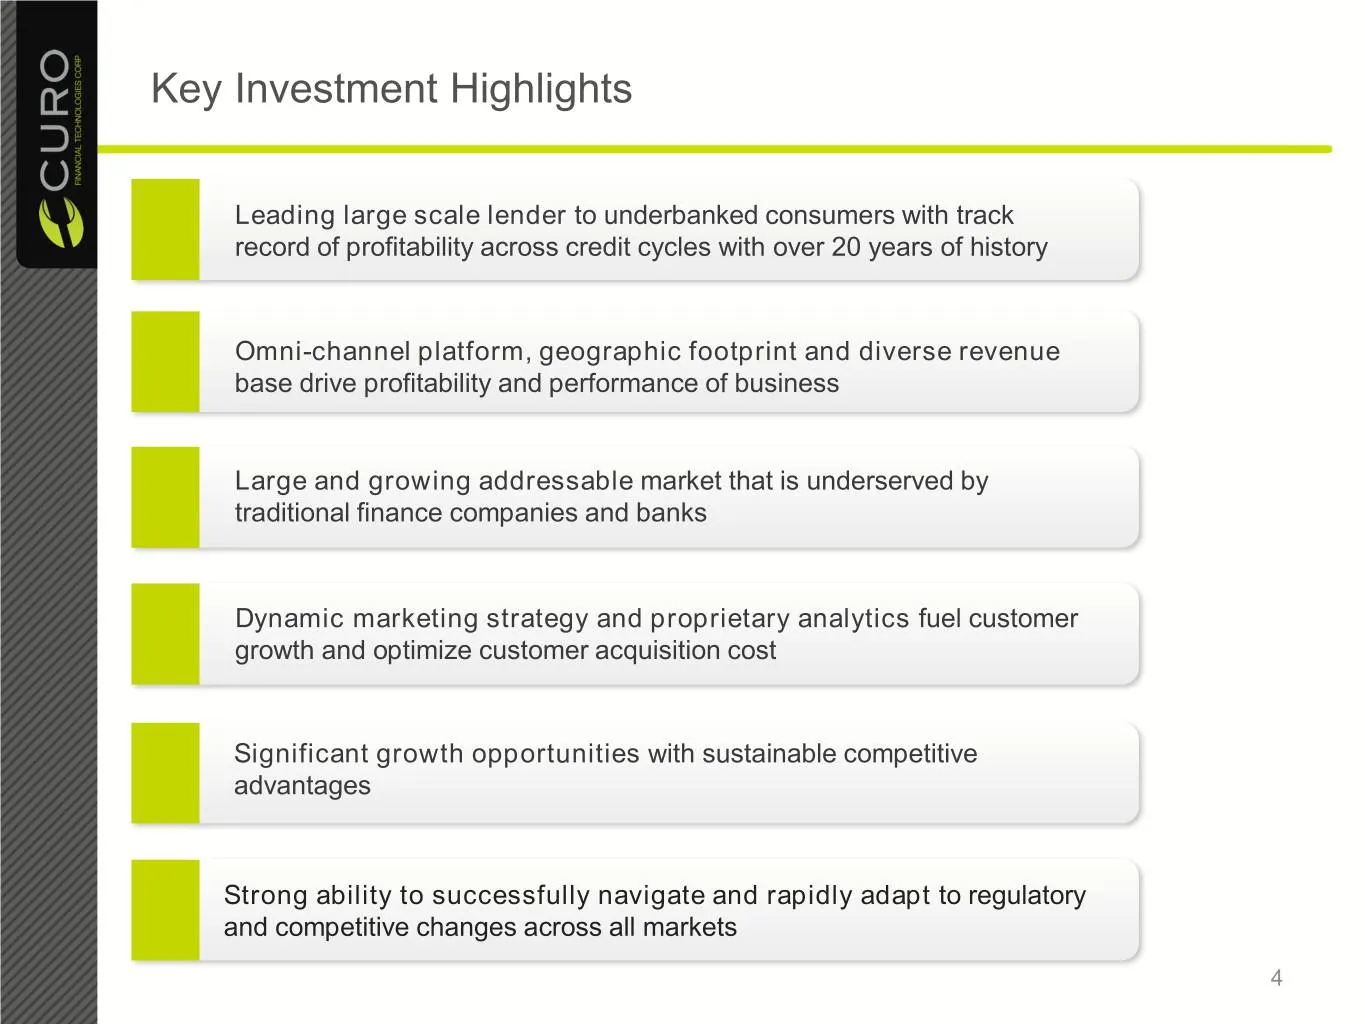
Key Investment Highlights Leading large scale lender to underbanked consumers with track record of profitability across credit cycles with over 20 years of history Omni-channel platform, geographic footprint and diverse revenue base drive profitability and performance of business Large and growing a
Slide 5: Leading Large Scale Lender To Underbanked Consumers With Track Record Of Profitability
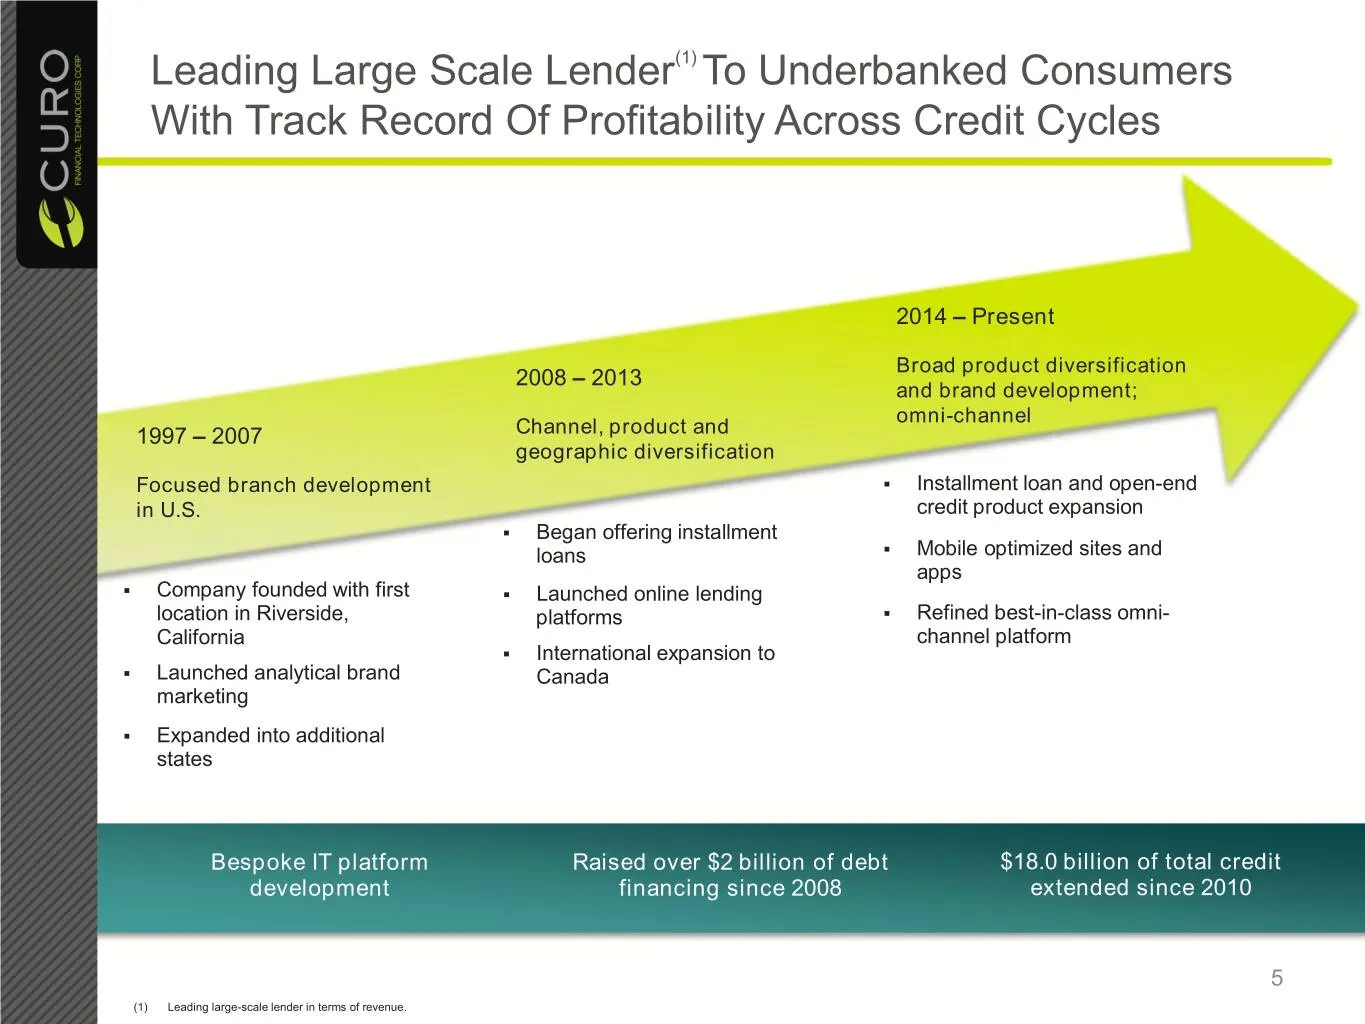
Leading Large Scale Lender(1) To Underbanked Consumers With Track Record Of Profitability Across Credit Cycles 2014 – Present Broad product diversification 2008 – 2013 and brand development; omni-channel 1997 – 2007 Channel, product and geographic diversification Focused branch development . Install
Slide 6: Omni-Channel Platform Supports "Call, Click or Come-In"
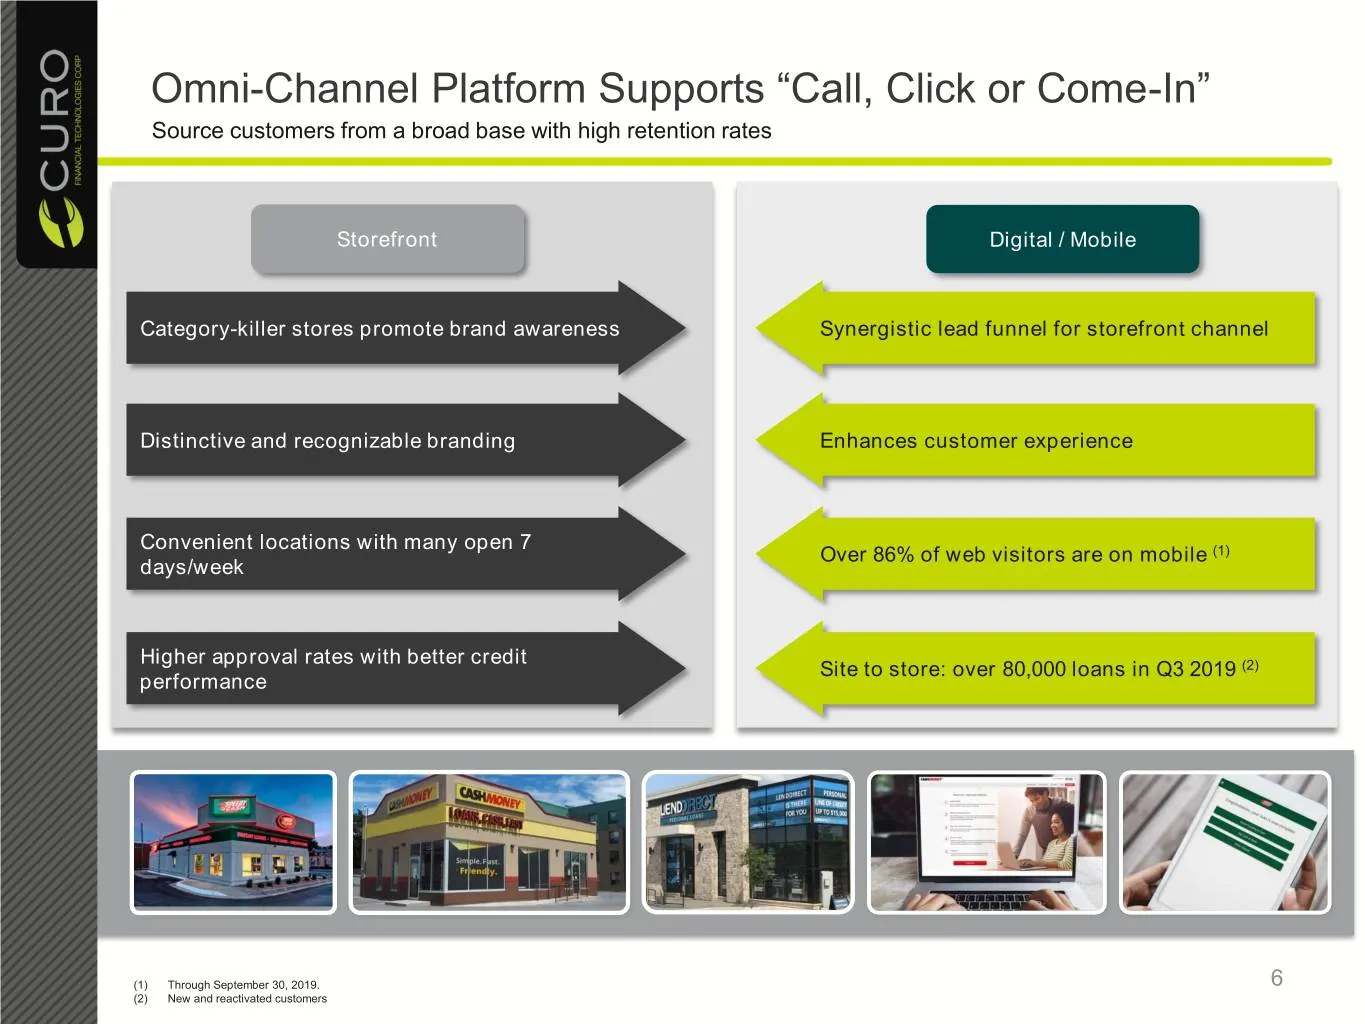
Omni-Channel Platform Supports “Call, Click or Come-In” Source customers from a broad base with high retention rates Storefront Digital / Mobile Category-killer stores promote brand awareness Synergistic lead funnel for storefront channel Distinctive and recognizable branding Enhances customer exper
Slide 7: Comprehensive Product Offerings And Diversified Revenue
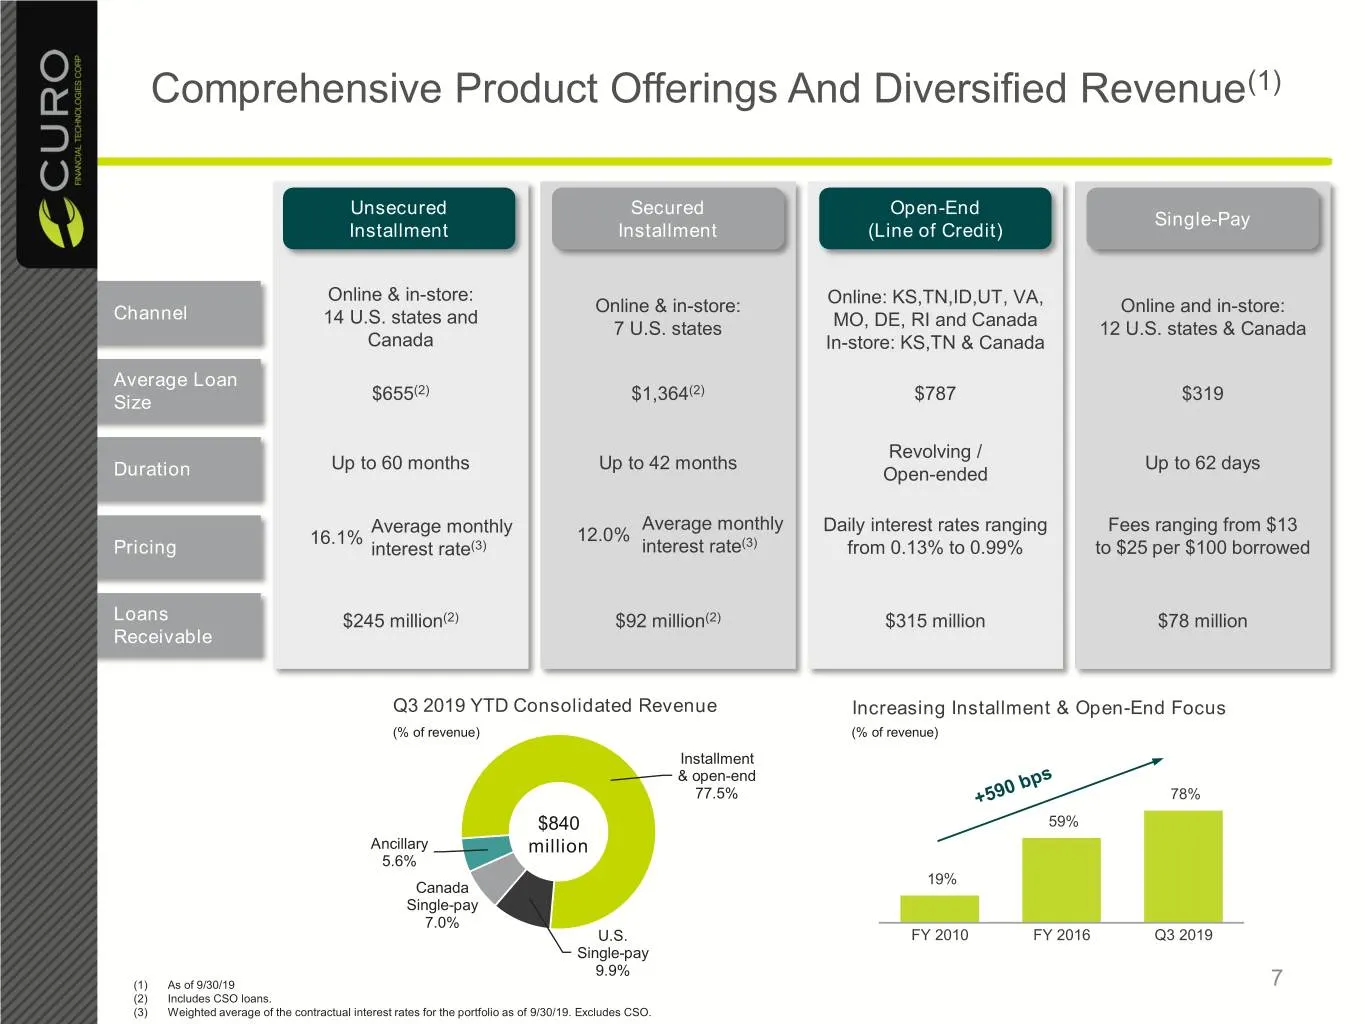
Comprehensive Product Offerings And Diversified Revenue(1) Unsecured Secured Open-End Single-Pay Installment Installment (Line of Credit) Online & in-store: Online & in-store: Online: KS,TN,ID,UT, VA, Online and in-store: Channel 14 U.S. states and 7 U.S. states MO, DE, RI and Canada 12 U.S. states
Slide 8: Large Addressable Market Is Underserved
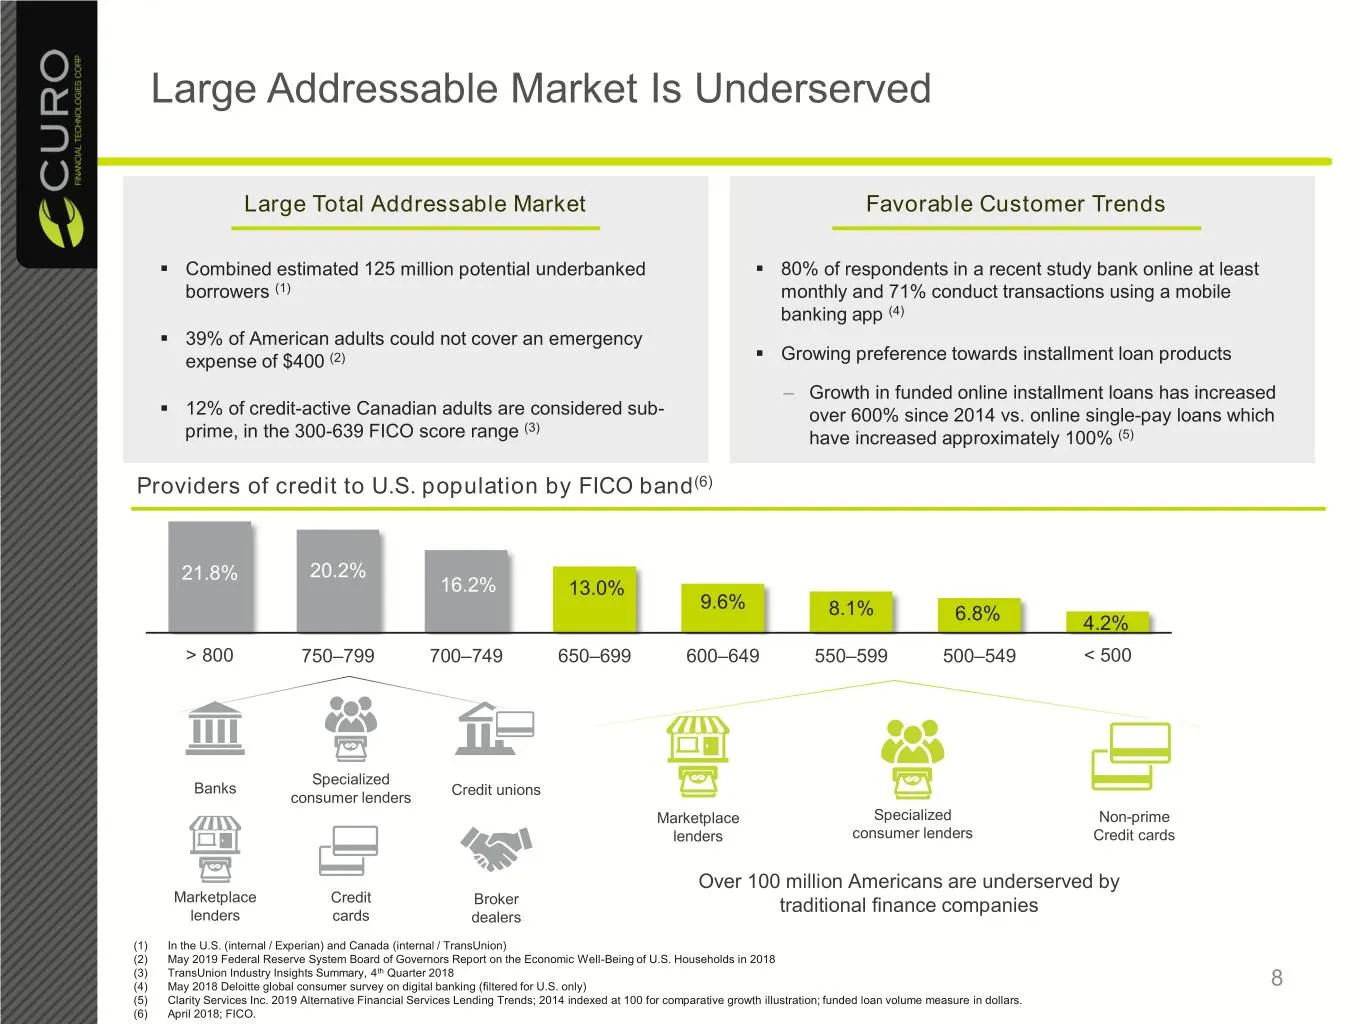
Large Addressable Market Is Underserved Large Total Addressable Market Favorable Customer Trends . Combined estimated 125 million potential underbanked . 80% of respondents in a recent study bank online at least borrowers (1) monthly and 71% conduct transactions using a mobile banking app (4) . 39%
Slide 9: U.S. Market Trends Continue to Favor CURO
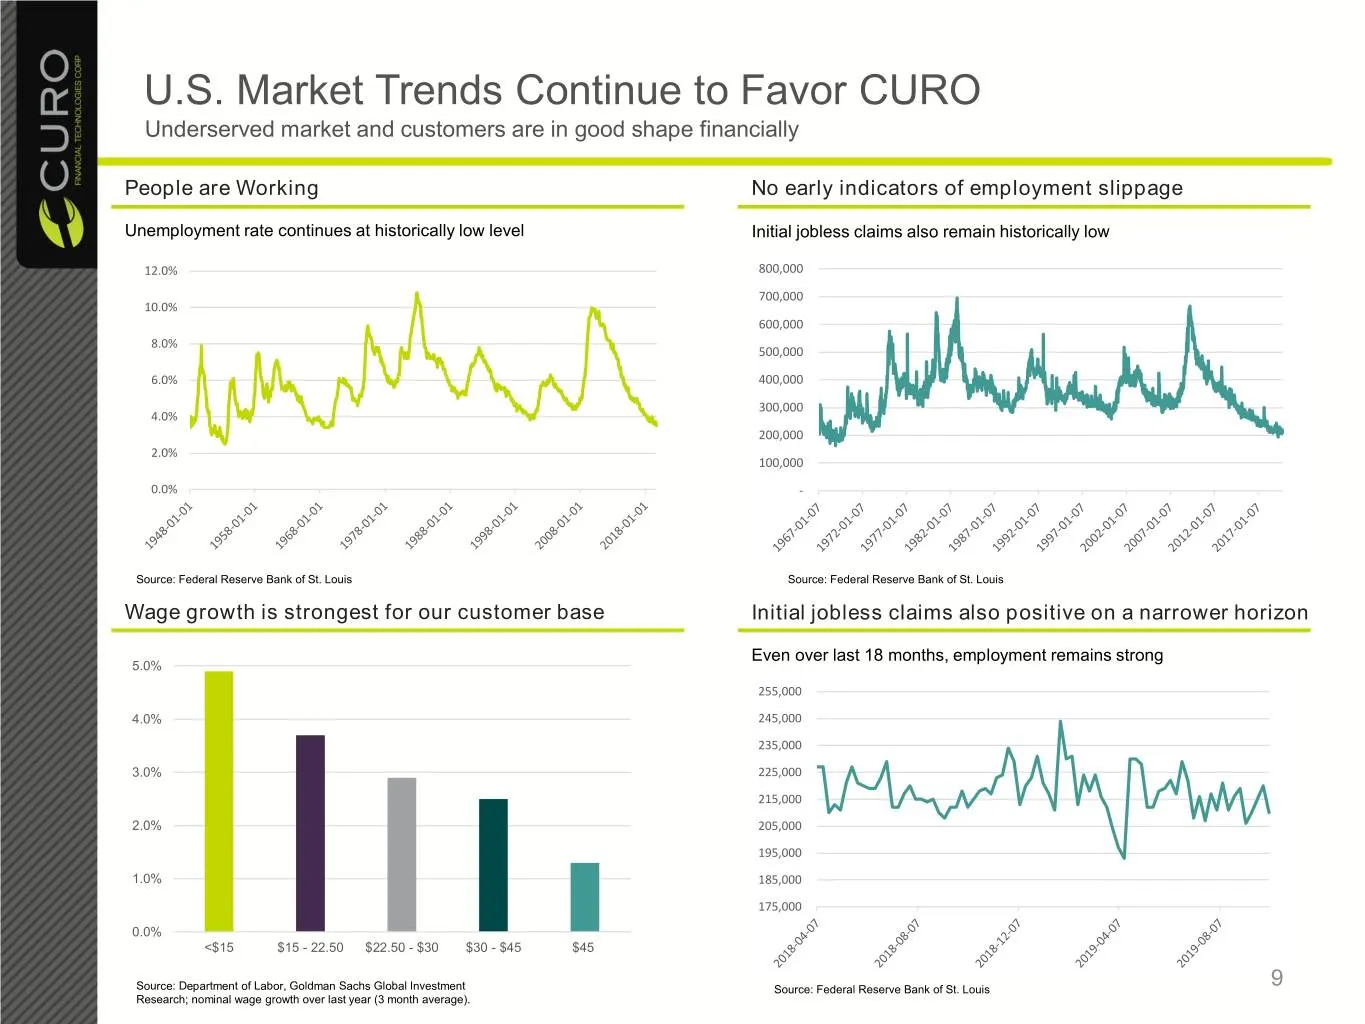
U.S. Market Trends Continue to Favor CURO Underserved market and customers are in good shape financially People are Working No early indicators of employment slippage Unemployment rate continues at historically low level Initial jobless claims also remain historically low 12.0% 800,000 700,000 10.0%
Slide 10: U.S. Economic Indicators Remain Largely Positive
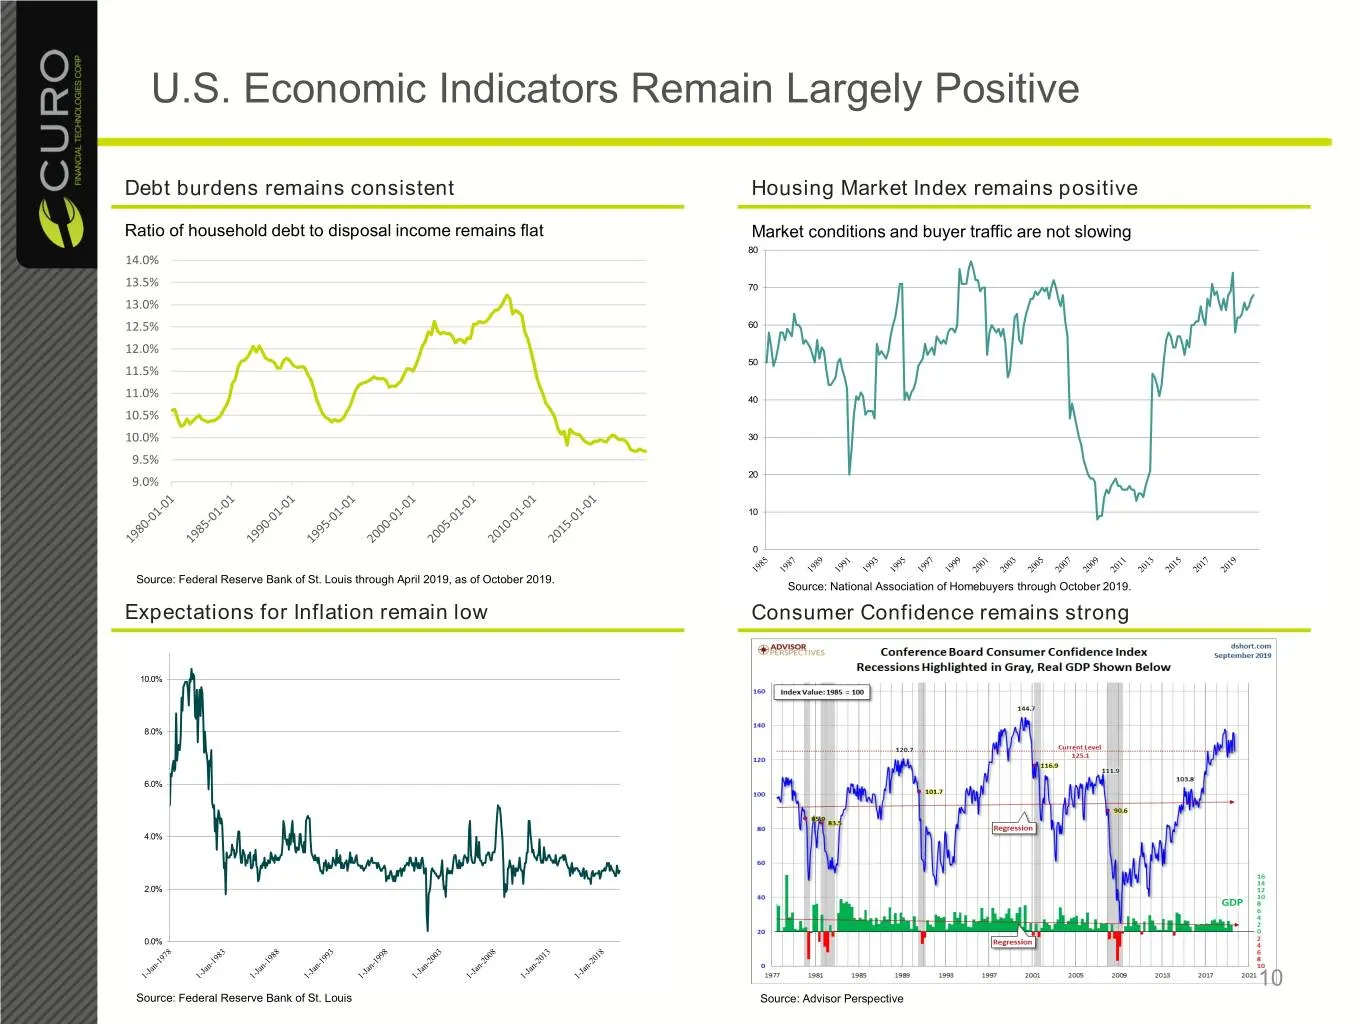
U.S. Economic Indicators Remain Largely Positive Debt burdens remains consistent Housing Market Index remains positive Ratio of household debt to disposal income remains flat Market conditions and buyer traffic are not slowing 80 14.0% 13.5% 70 13.0% 12.5% 60 12.0% 50 11.5% 11.0% 40 10.5% 10.0% 30 9
Slide 11: Delinquency remains stable and below pre-recession levels
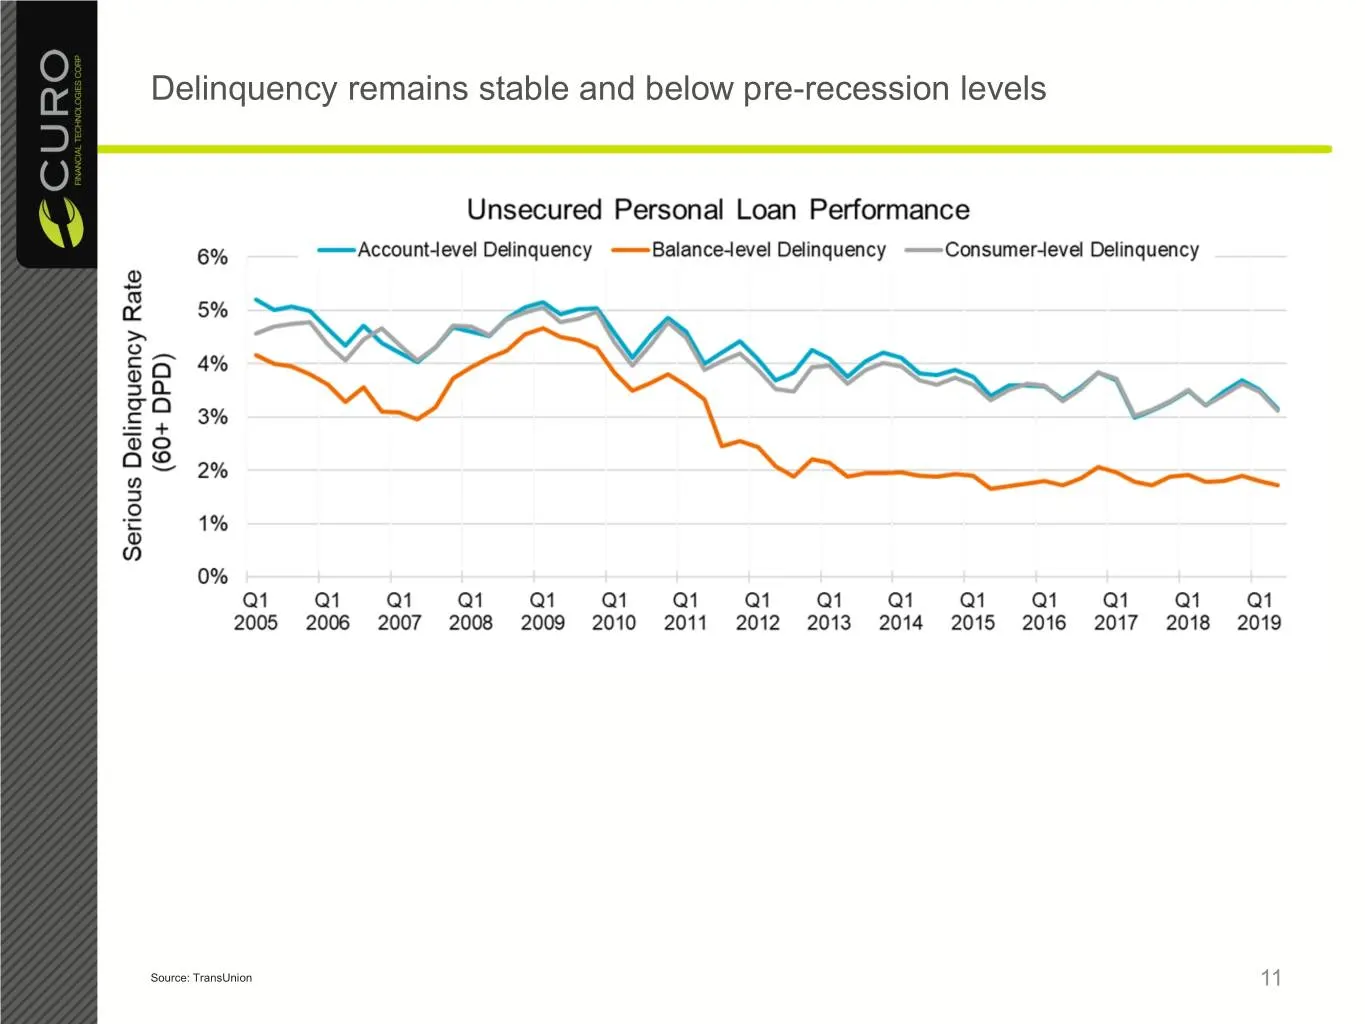
Delinquency remains stable and below pre-recession levels Source: TransUnion 11
Slide 12: Canadian Market Trends are Similar
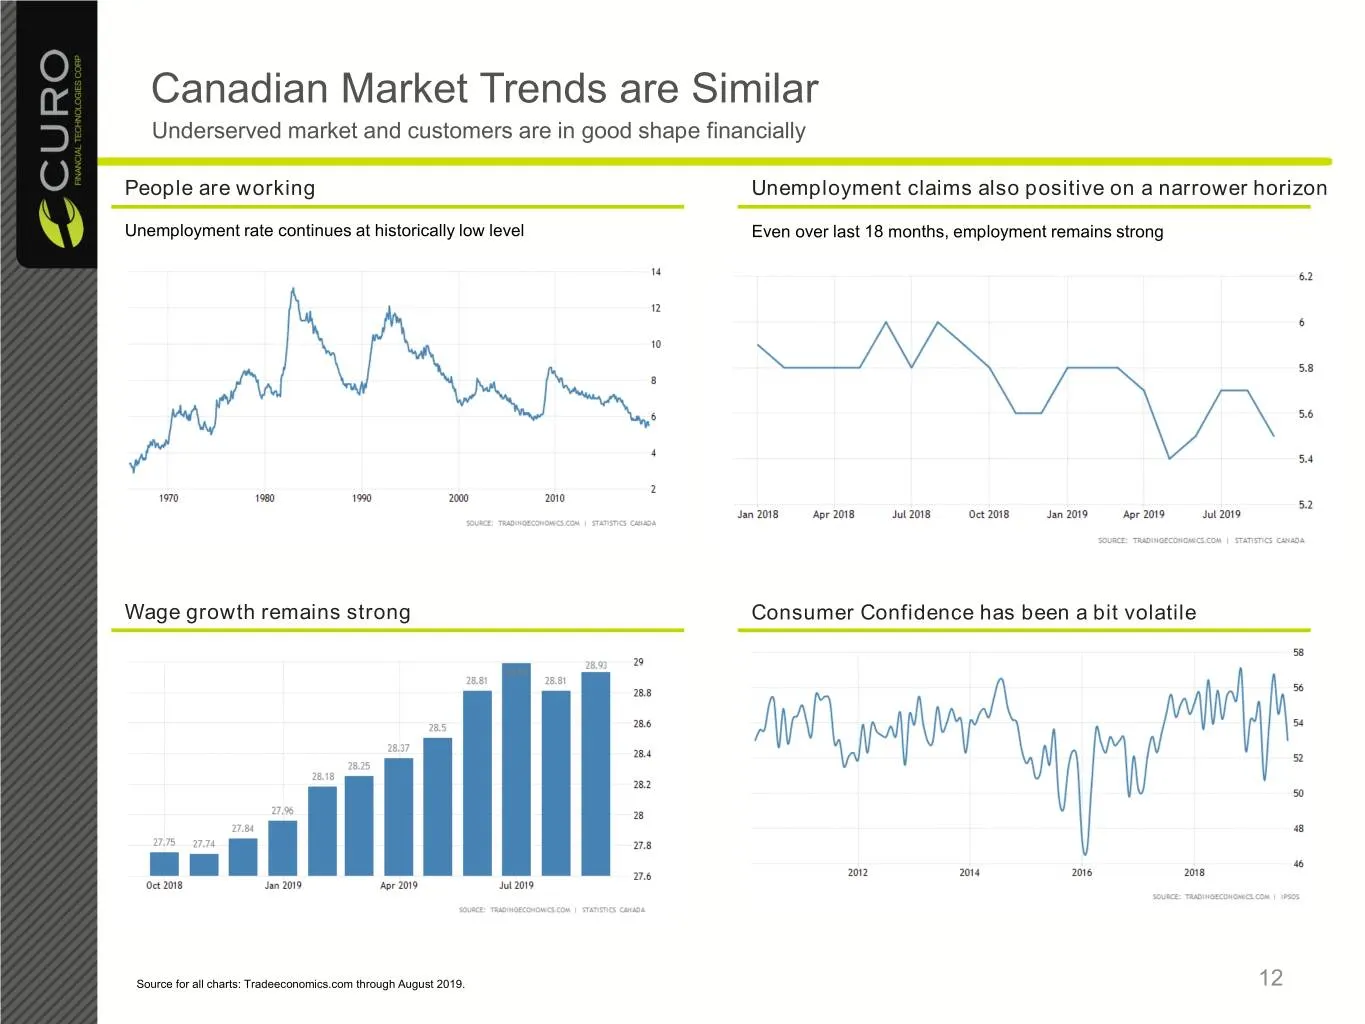
Canadian Market Trends are Similar Underserved market and customers are in good shape financially People are working Unemployment claims also positive on a narrower horizon Unemployment rate continues at historically low level Even over last 18 months, employment remains strong Wage growth remains s
Slide 13: Financial Summary
Financial Summary 13
Slide 14: Financial Results At A Glance
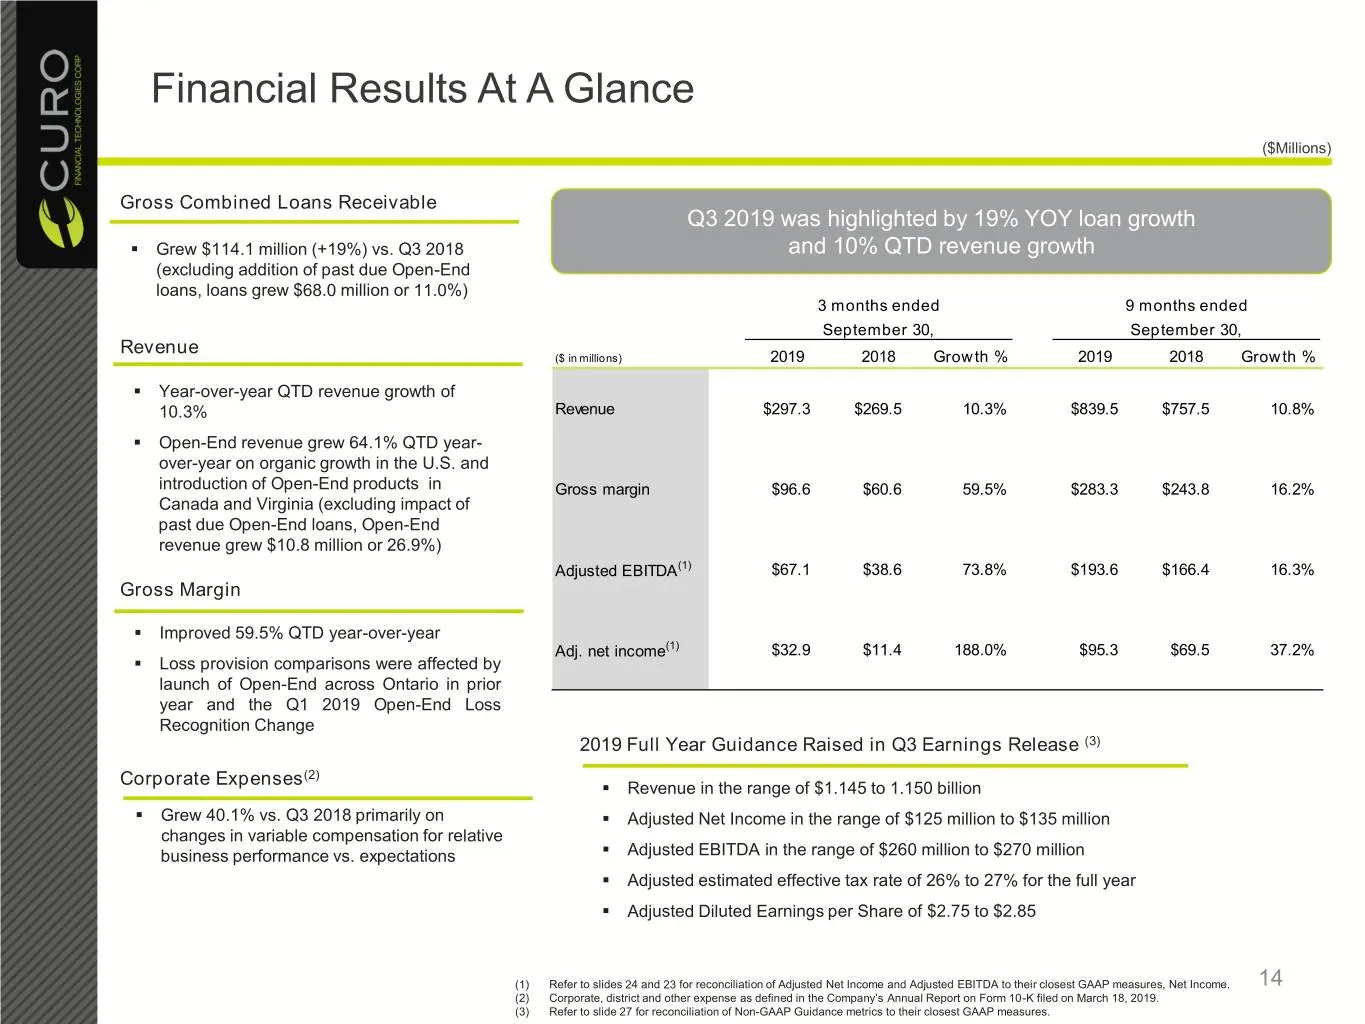
Financial Results At A Glance ($Millions) Gross Combined Loans Receivable Q3 2019 was highlighted by 19% YOY loan growth . Grew $114.1 million (+19%) vs. Q3 2018 and 10% QTD revenue growth (excluding addition of past due Open-End loans, loans grew $68.0 million or 11.0%) 3 months ended 9 months ende
Slide 15: Strong Loan Growth with Managed Mix Shift
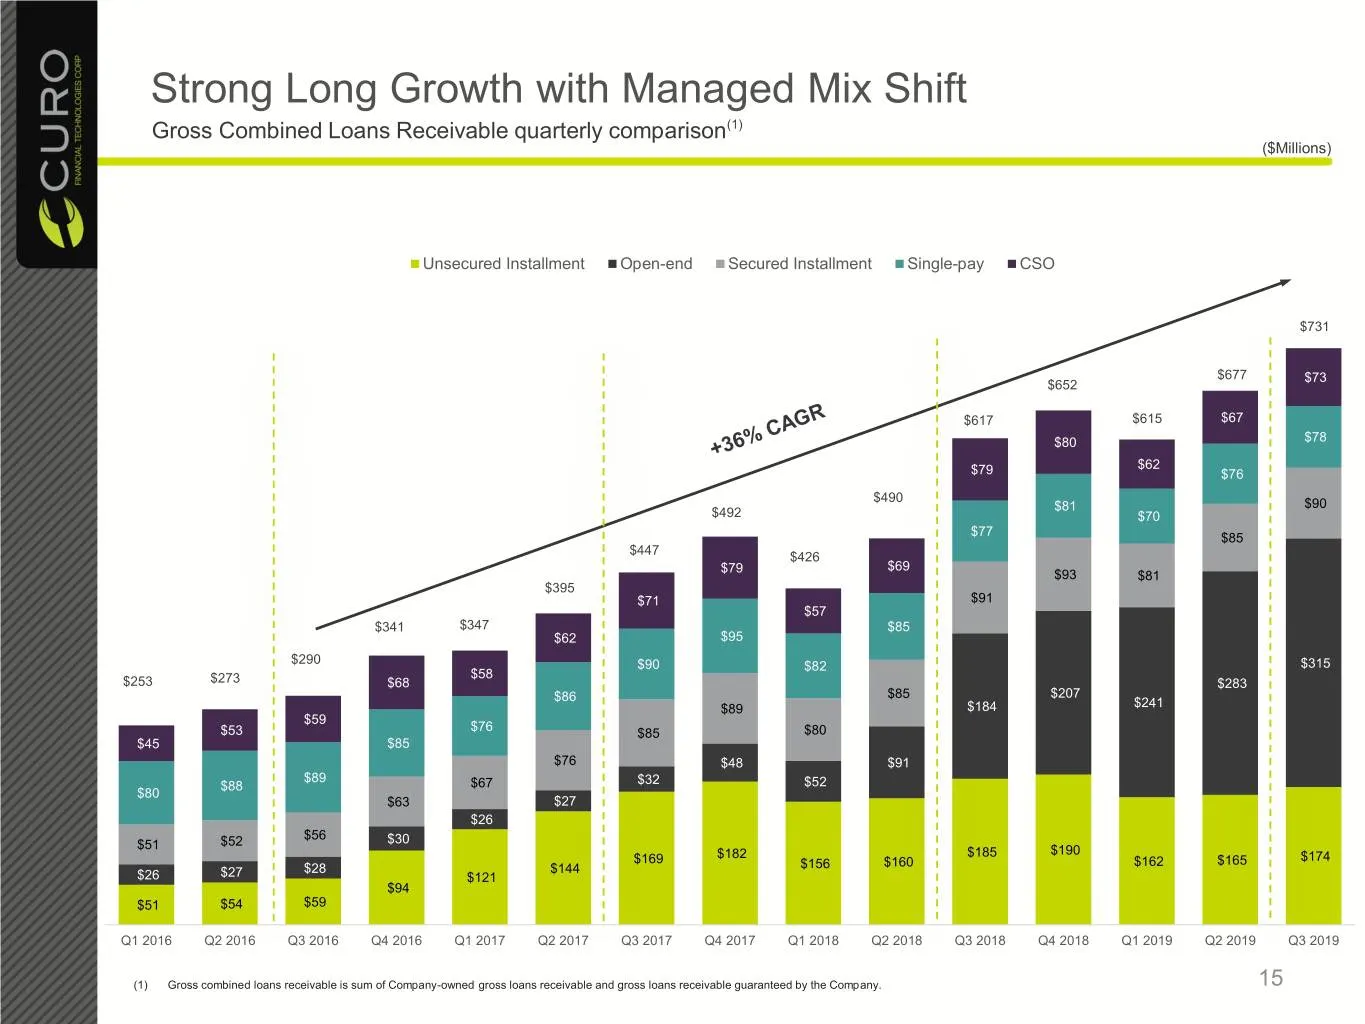
Strong Long Growth with Managed Mix Shift Gross Combined Loans Receivable quarterly comparison(1) ($Millions) Unsecured Installment Open-end Secured Installment Single-pay CSO $731 $677 $73 $652 $617 $615 $67 $80 $78 $62 $79 $76 $490 $81 $90 $492 $70 $77 $85 $447 $426 $79 $69 $93 $81 $395 $71 $91 $5
Slide 16: U.S. Results – Solid growth with YOY margin expansion
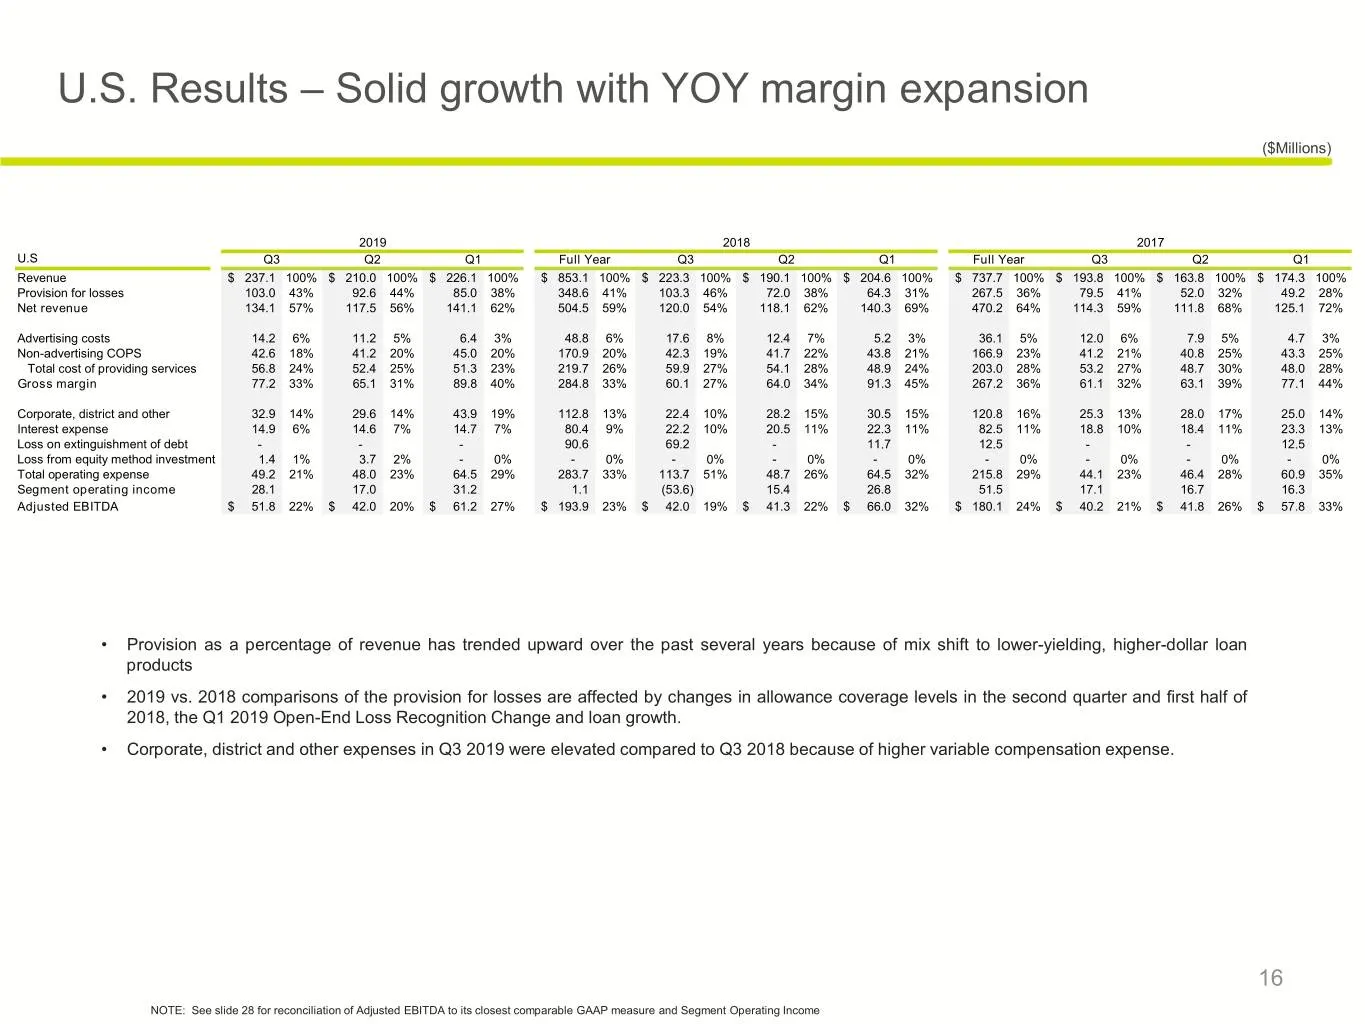
U.S. Results – Solid growth with YOY margin expansion ($Millions) 2019 2018 2017 U.S Q3 Q2 Q1 Full Year Q3 Q2 Q1 Full Year Q3 Q2 Q1 Revenue $ 237.1 100% $ 210.0 100% $ 226.1 100% $ 853.1 100% $ 223.3 100% $ 190.1 100% $ 204.6 100% $ 737.7 100% $ 193.8 100% $ 163.8 100% $ 174.3 100% Provision for los
Slide 17: Canada – Valuable Transition to Multi-Pay Loans
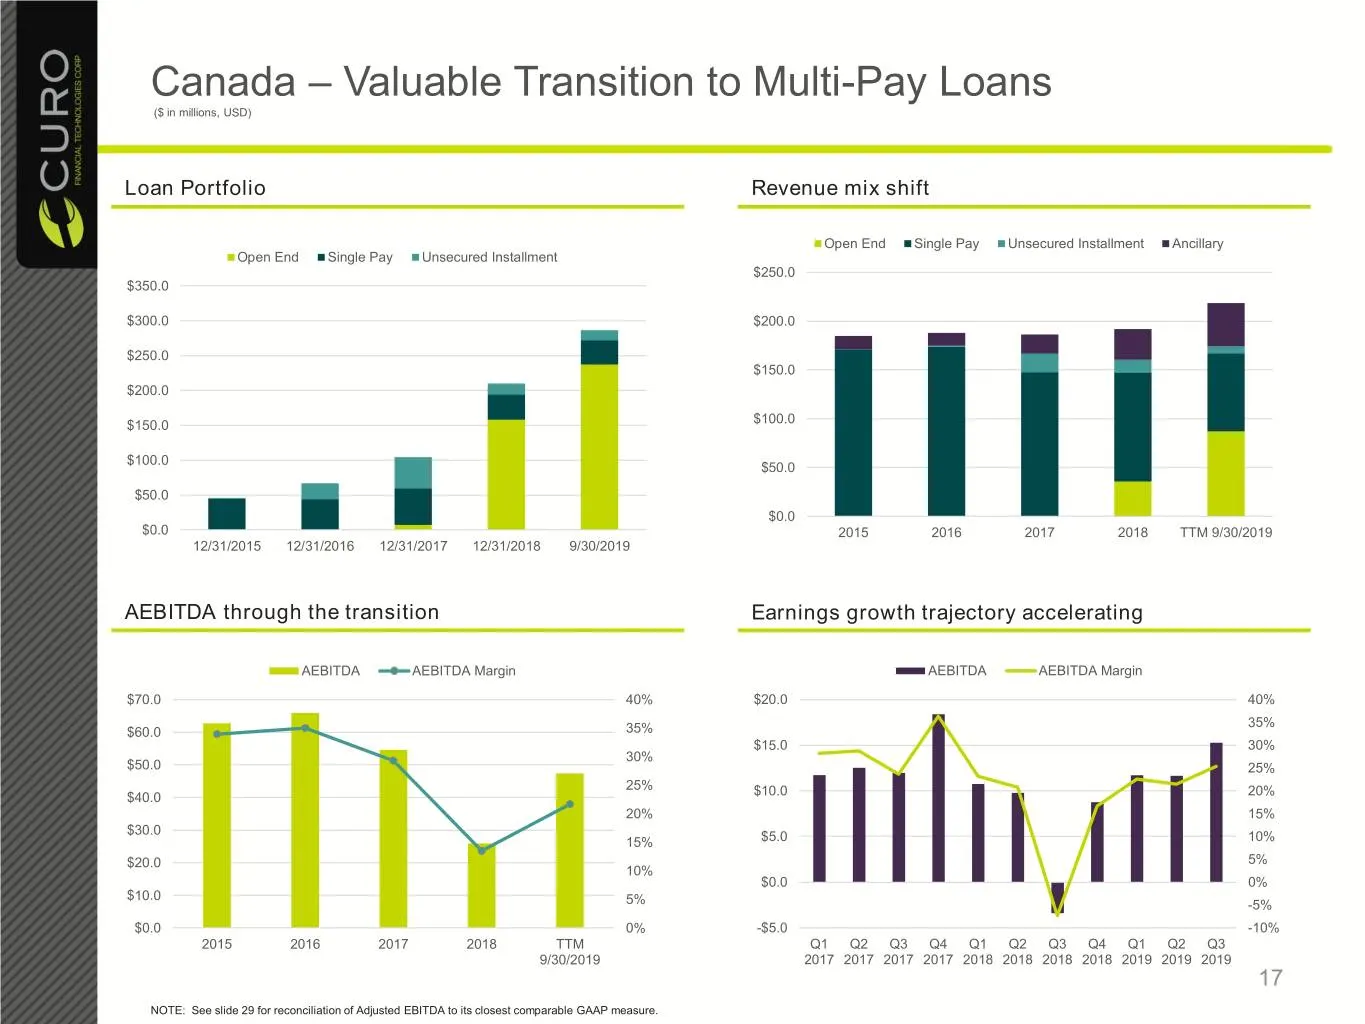
Canada – Valuable Transition to Multi-Pay Loans ($ in millions, USD) Loan Portfolio Revenue mix shift Open End Single Pay Unsecured Installment Ancillary Open End Single Pay Unsecured Installment $250.0 $350.0 $300.0 $200.0 $250.0 $150.0 $200.0 $150.0 $100.0 $100.0 $50.0 $50.0 $0.0 $0.0 2015 2016 20
Slide 18: Improved Quarterly Net Charge-off Rates
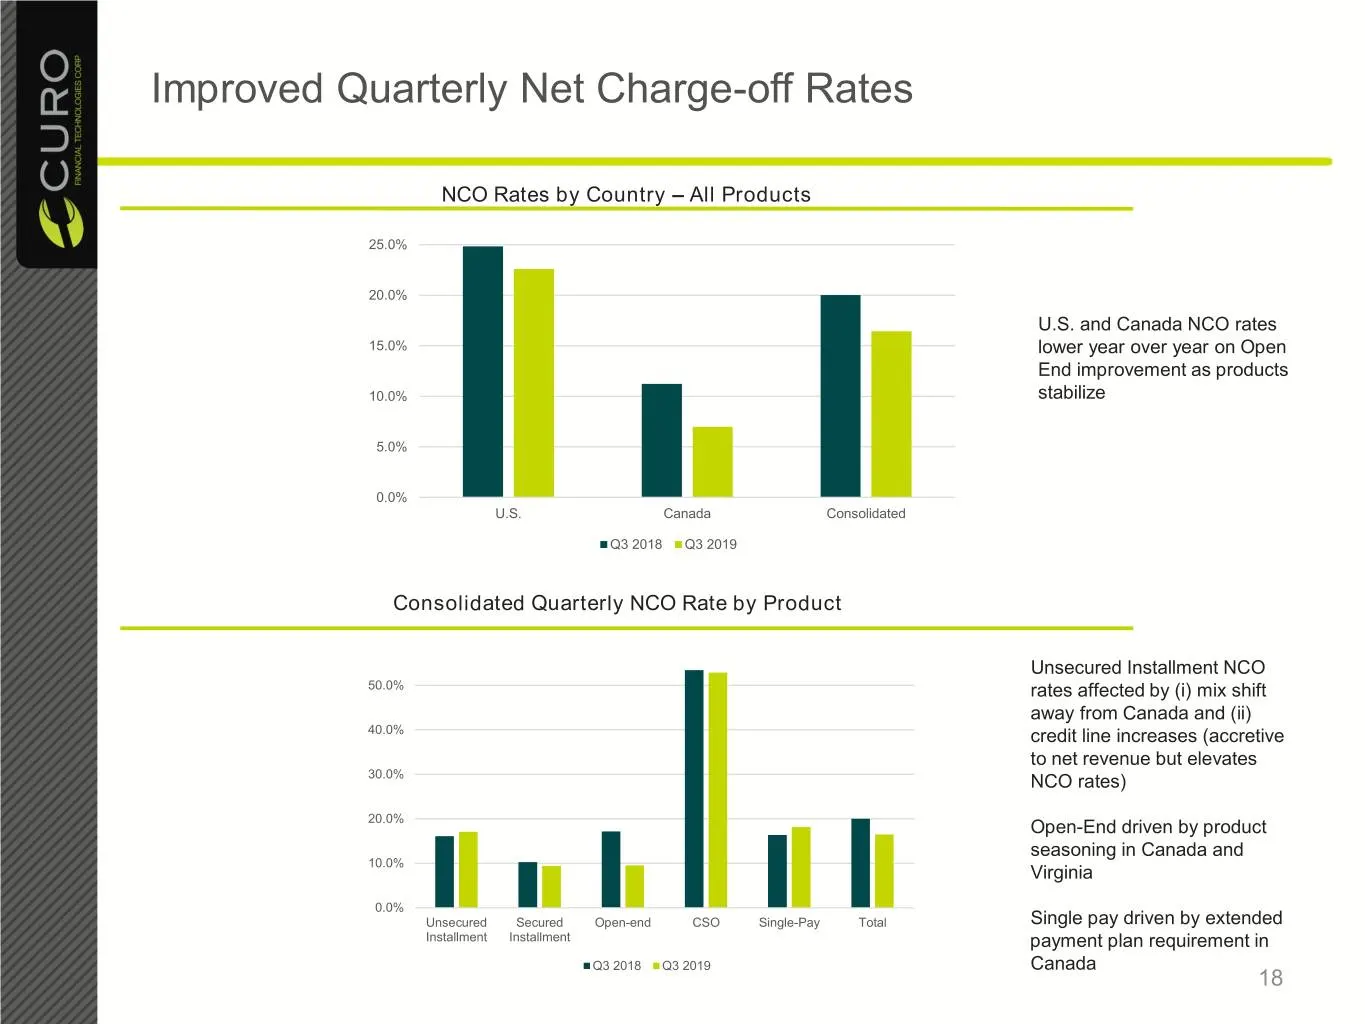
Improved Quarterly Net Charge-off Rates NCO Rates by Country – All Products 25.0% 20.0% U.S. and Canada NCO rates 15.0% lower year over year on Open End improvement as products 10.0% stabilize 5.0% 0.0% U.S. Canada Consolidated Q3 2018 Q3 2019 Consolidated Quarterly NCO Rate by Product Unsecured Ins
Slide 19: Cash Flow, Liquidity and Share Repurchases
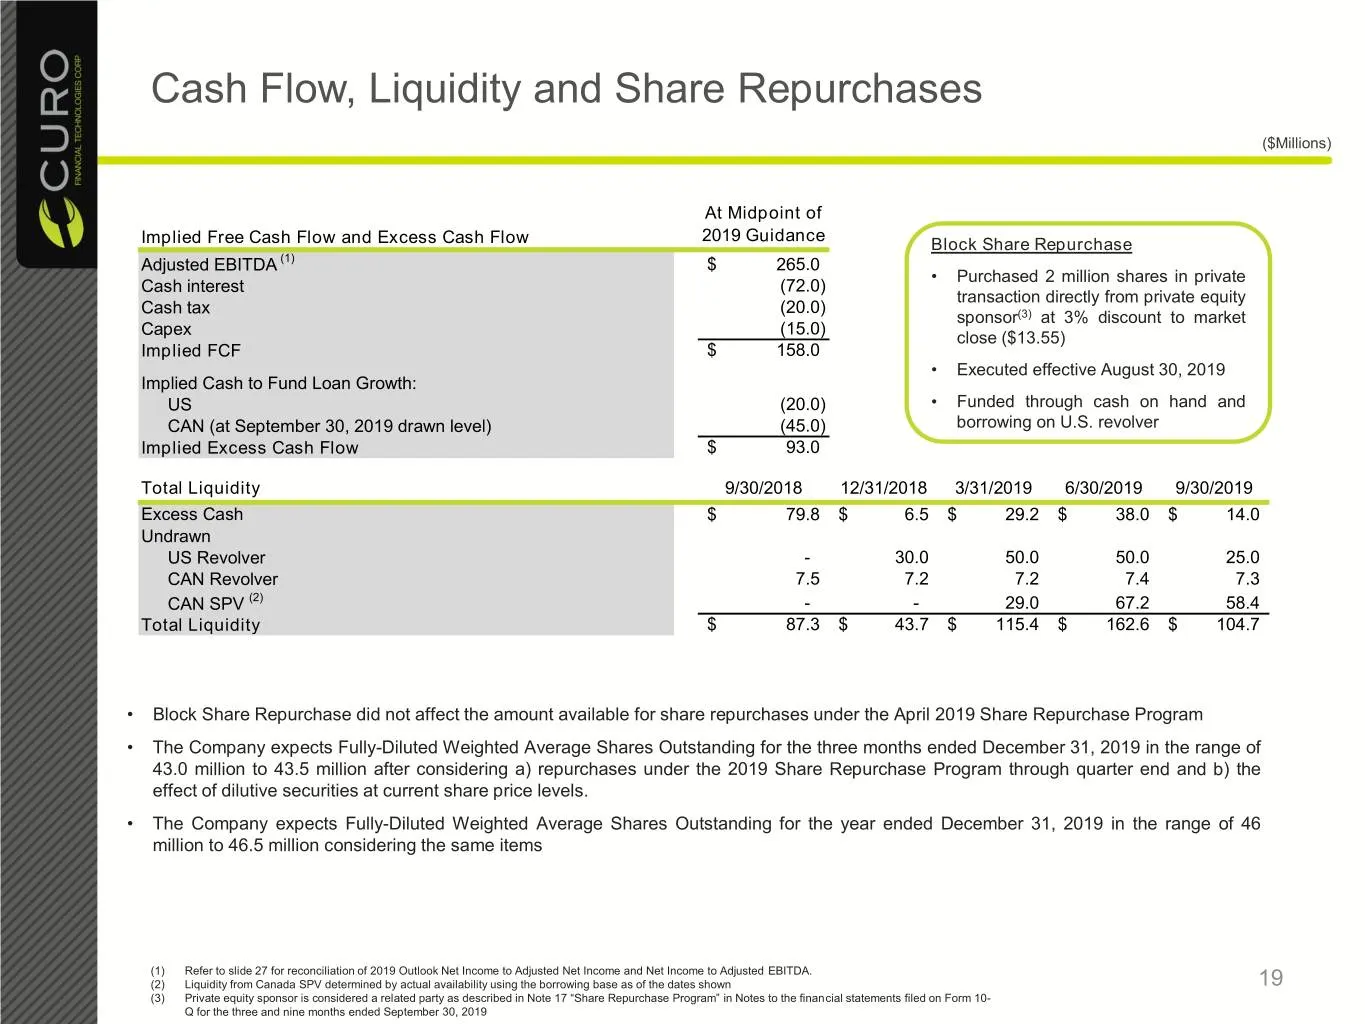
Cash Flow, Liquidity and Share Repurchases ($Millions) At Midpoint of 2019 Guidance Implied Free Cash Flow and Excess Cash Flow Block Share Repurchase Adjusted EBITDA (1) $ 265.0 • Purchased 2 million shares in private Cash interest (72.0) transaction directly from private equity Cash tax (20.0) spo
Slide 20: Consolidated Summary Balance Sheet
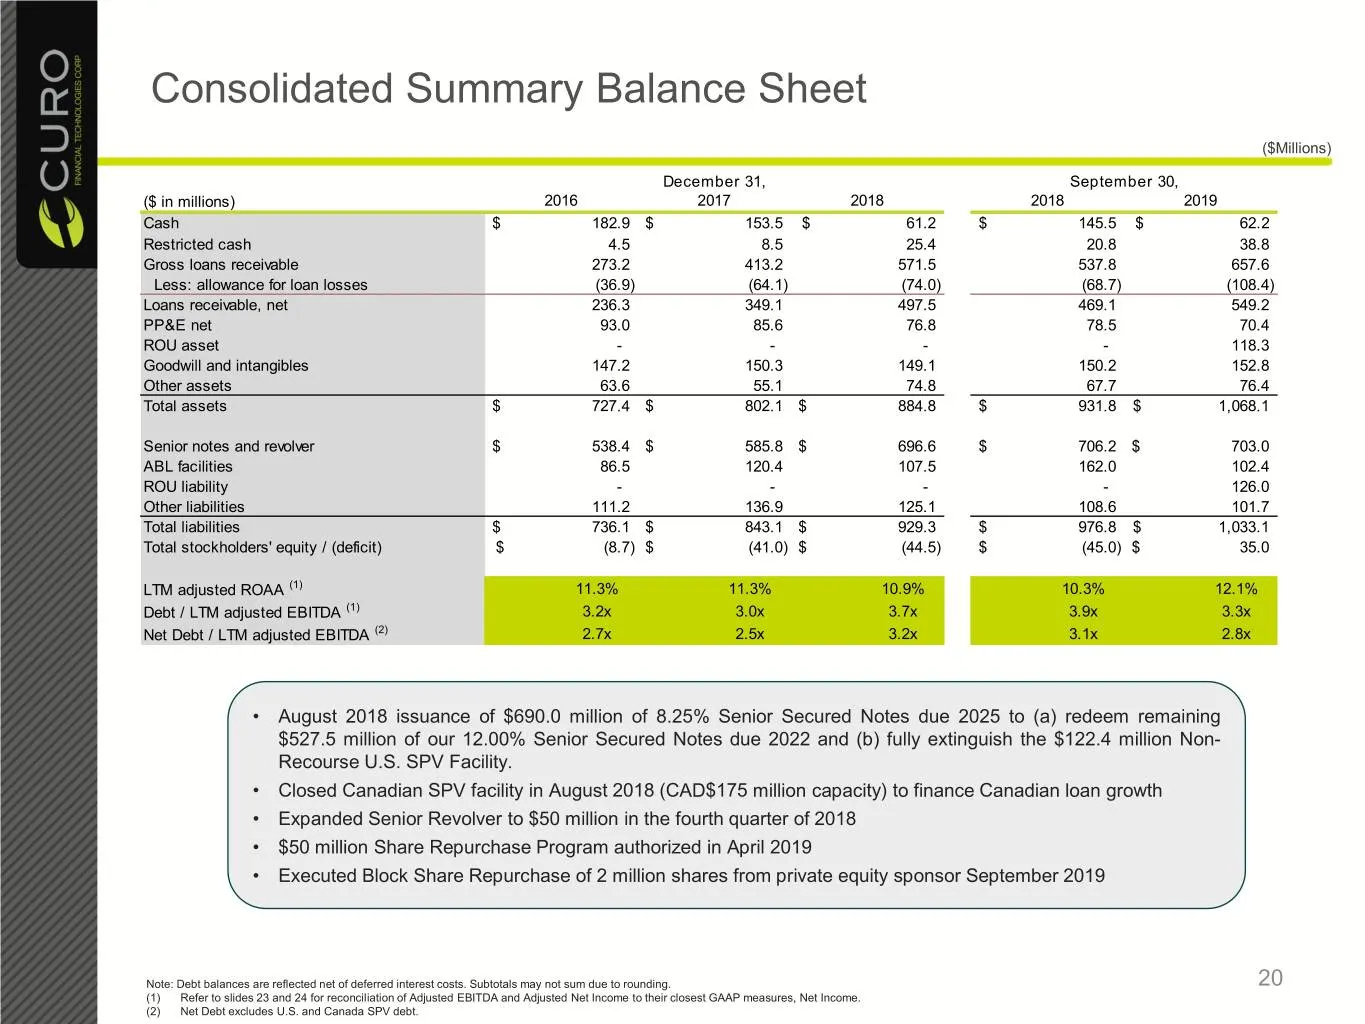
Consolidated Summary Balance Sheet ($Millions) December 31, September 30, ($ in millions) 2016 2017 2018 2018 2019 Cash $ 182.9 $ 153.5 $ 61.2 $ 145.5 $ 62.2 Restricted cash 4.5 8.5 25.4 20.8 38.8 Gross loans receivable 273.2 413.2 571.5 537.8 657.6 Less: allowance for loan losses (36.9) (64.1) (74.
Slide 21: Key Investment Highlights
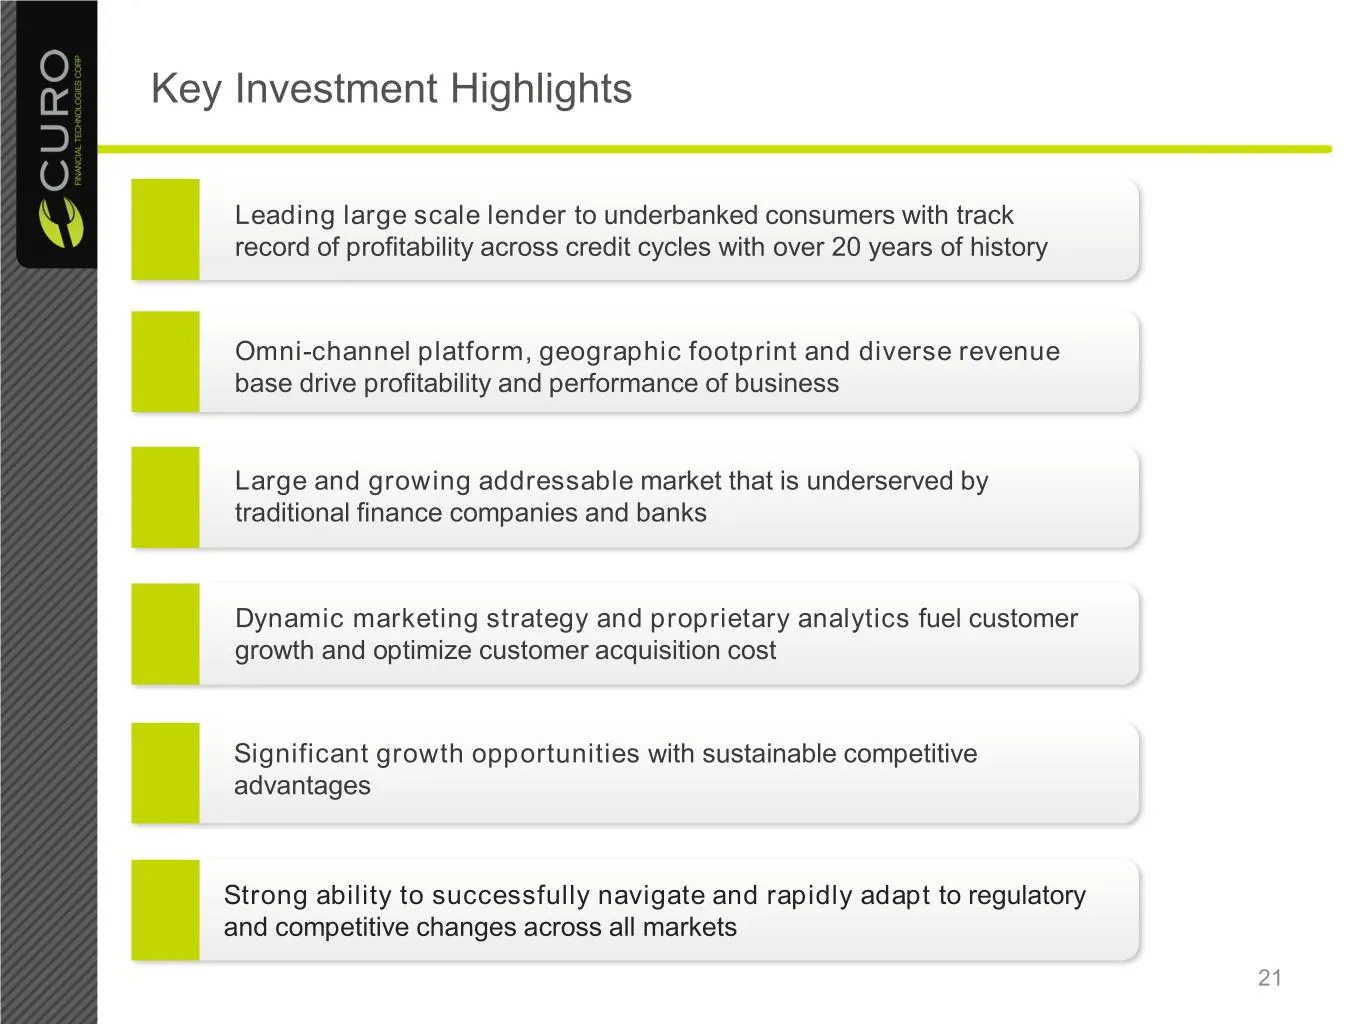
Key Investment Highlights Leading large scale lender to underbanked consumers with track record of profitability across credit cycles with over 20 years of history Omni-channel platform, geographic footprint and diverse revenue base drive profitability and performance of business Large and growing a
Slide 22: Appendix
Appendix 22
Slide 23: Historical Consolidated Adjusted EBITDA Reconciliation
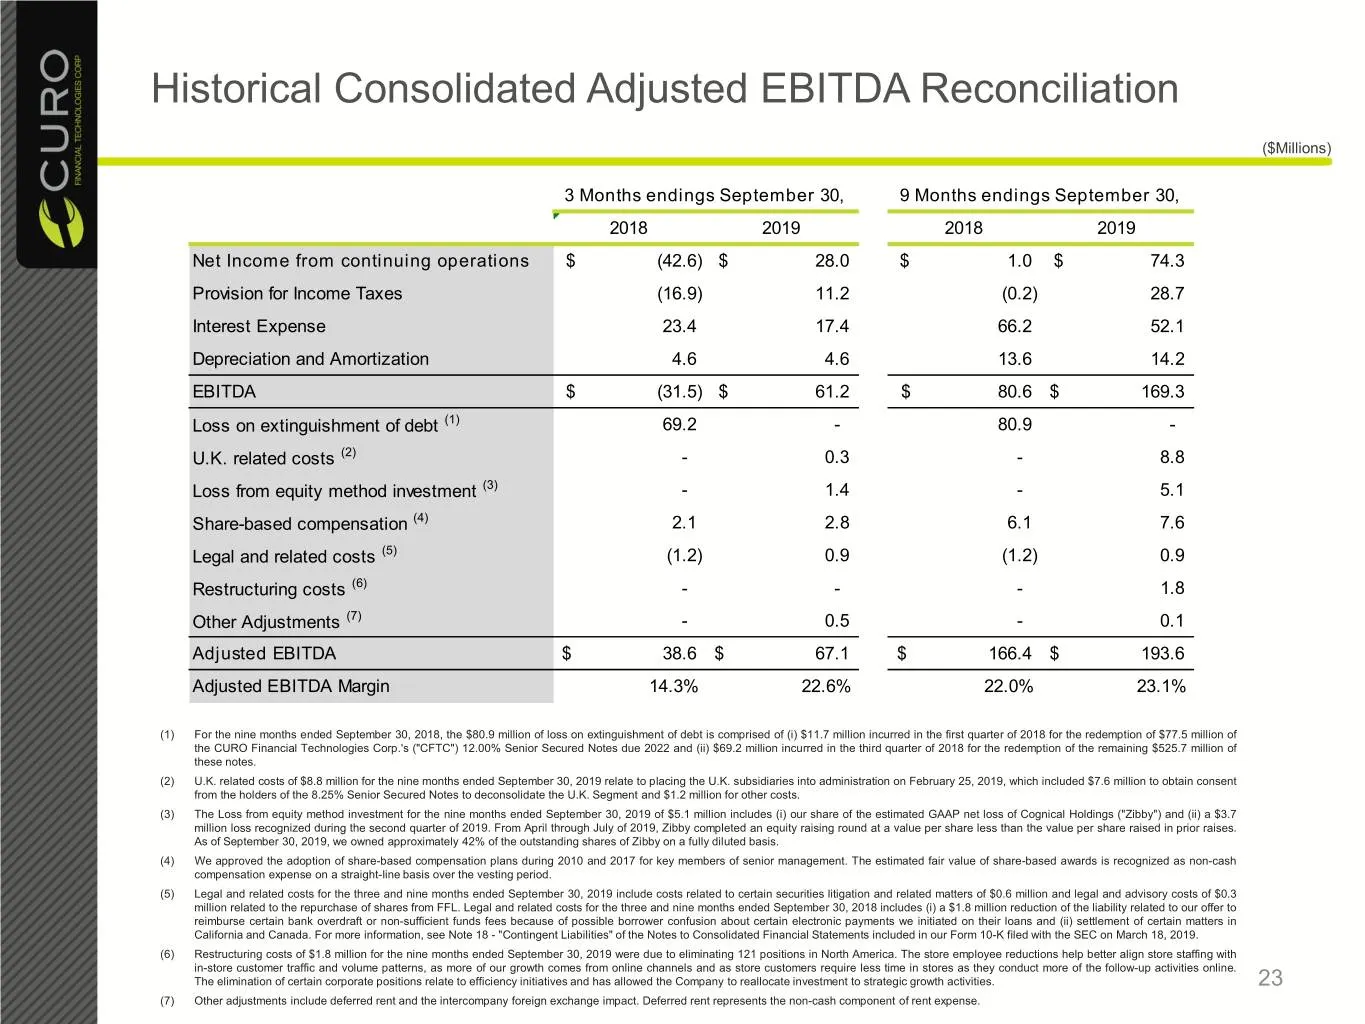
Historical Consolidated Adjusted EBITDA Reconciliation ($Millions) 3 Months endings September 30, 9 Months endings September 30, 2018 2019 2018 2019 Net Income from continuing operations $ (42.6) $ 28.0 $ 1.0 $ 74.3 Provision for Income Taxes (16.9) 11.2 (0.2) 28.7 Interest Expense 23.4 17.4 66.2 52
Slide 24: Historical Consolidated Adjusted Net Income Reconciliation
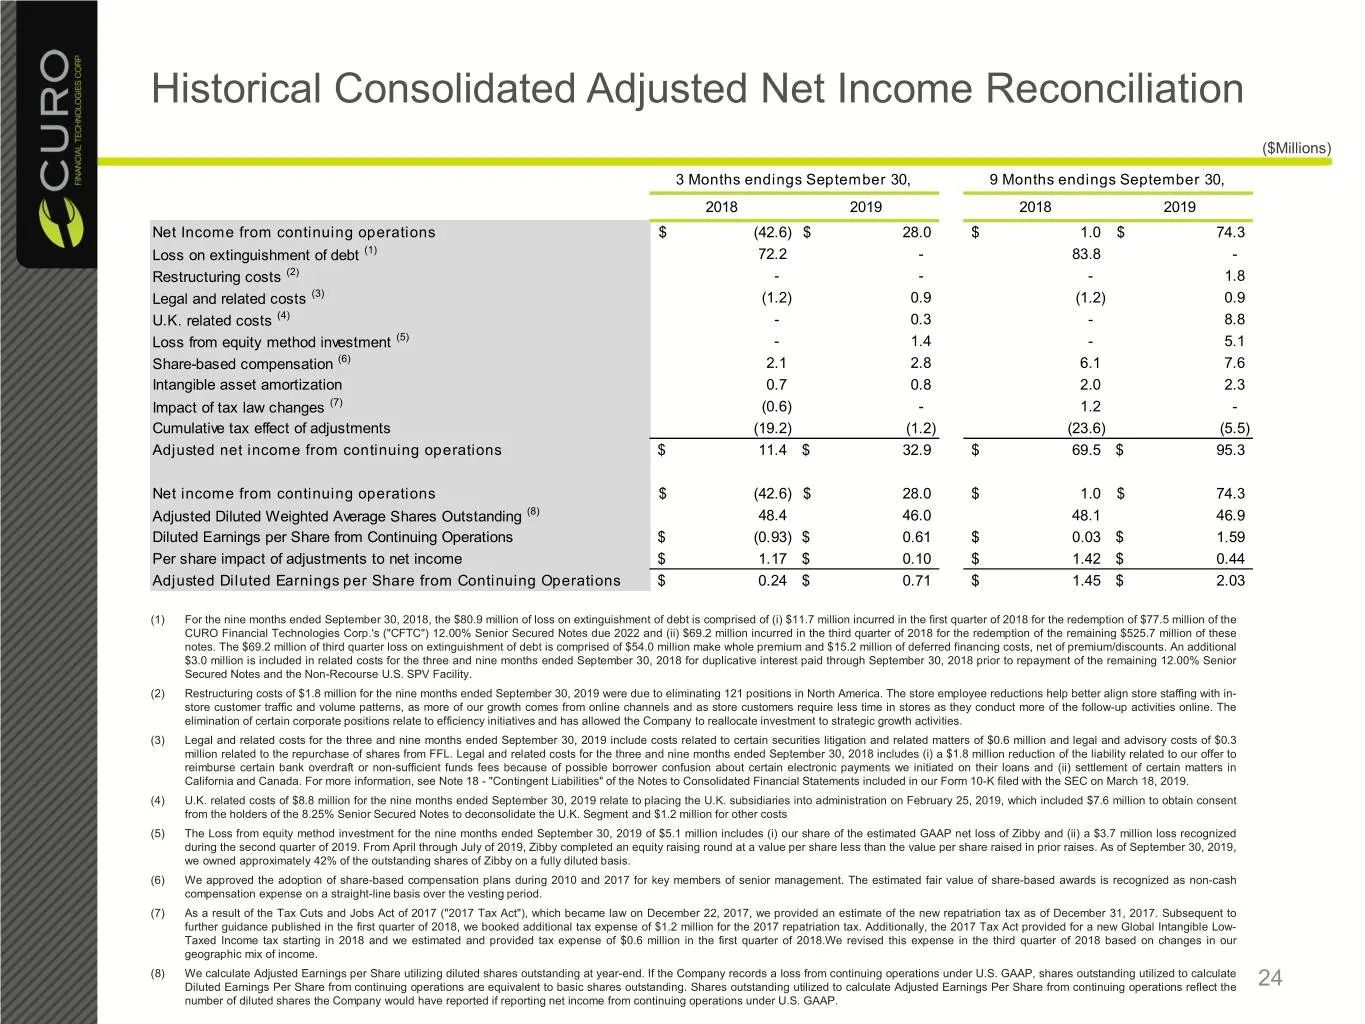
Historical Consolidated Adjusted Net Income Reconciliation ($Millions) 3 Months endings September 30, 9 Months endings September 30, 2018 2019 2018 2019 Net Income from continuing operations $ (42.6) $ 28.0 $ 1.0 $ 74.3 Loss on extinguishment of debt (1) 72.2 - 83.8 - Restructuring costs (2) - - - 1
Slide 25: Historical Gross Combined Loan Receivables And Adjusted ROAA Reconciliations
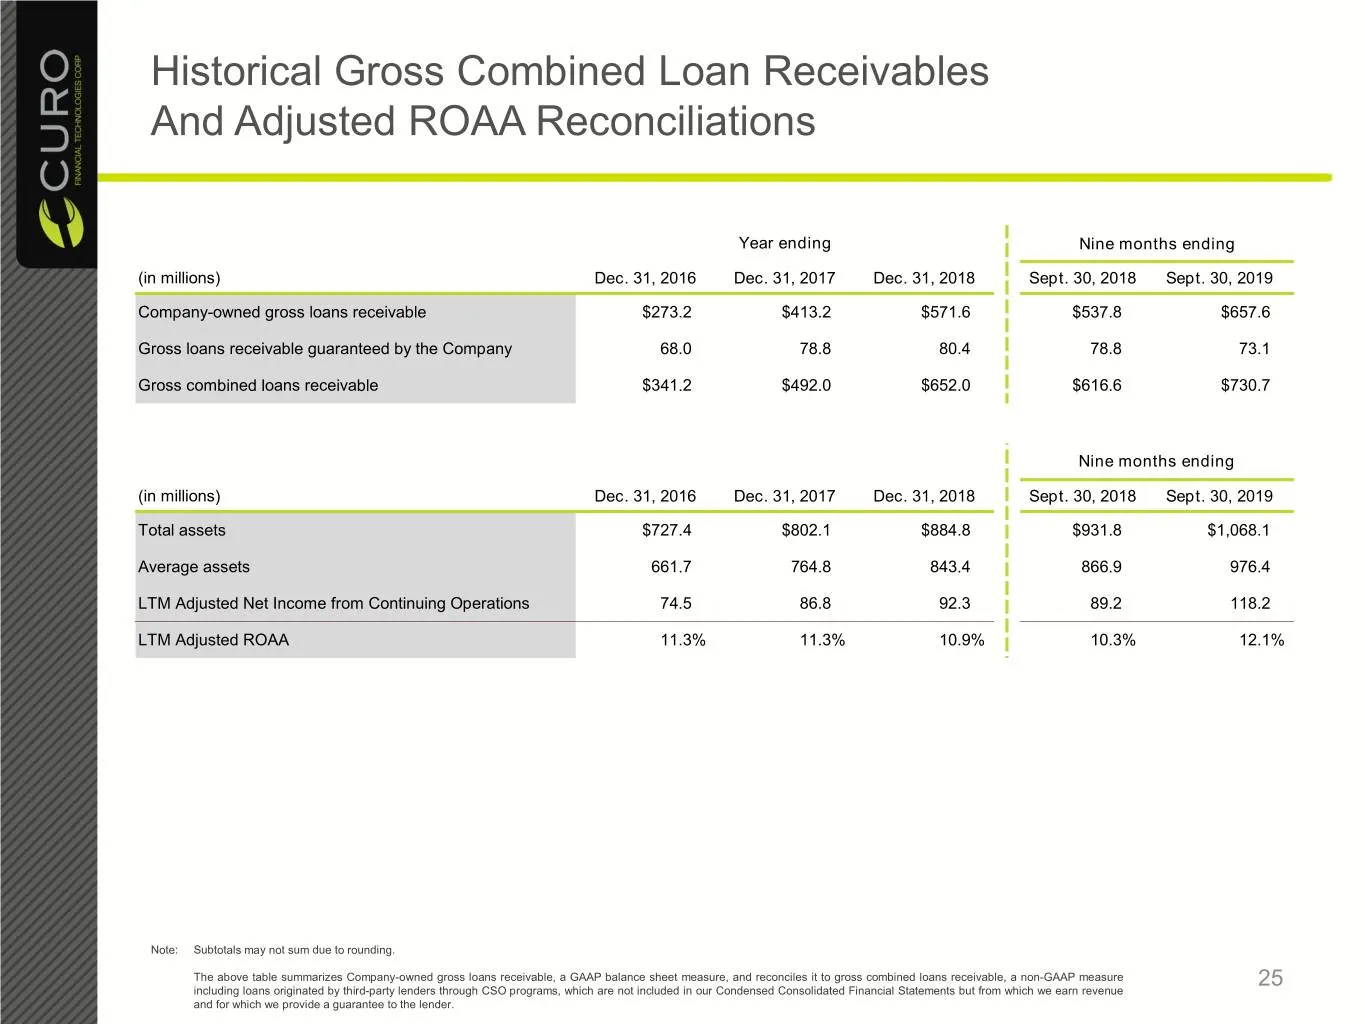
Historical Gross Combined Loan Receivables And Adjusted ROAA Reconciliations Year ending Nine months ending (in millions) Dec. 31, 2016 Dec. 31, 2017 Dec. 31, 2018 Sept. 30, 2018 Sept. 30, 2019 Company-owned gross loans receivable $273.2 $413.2 $571.6 $537.8 $657.6 Gross loans receivable guaranteed
Slide 26: Adjusted Pre-tax income And Adjusted tax Expense Reconciliations
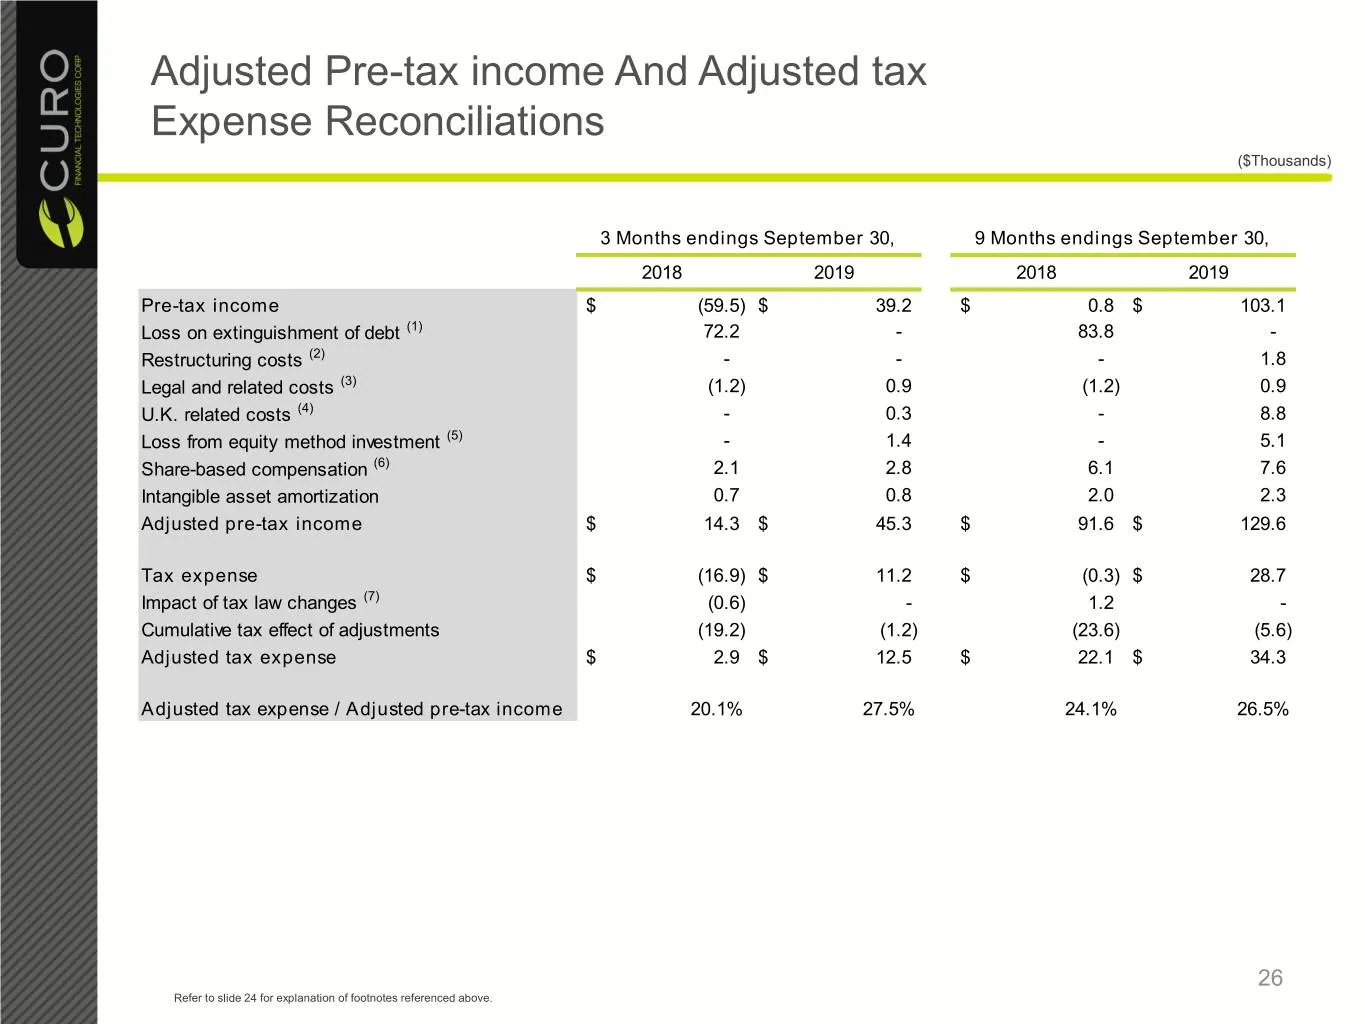
Adjusted Pre-tax income And Adjusted tax Expense Reconciliations ($Thousands) 3 Months endings September 30, 9 Months endings September 30, 2018 2019 2018 2019 Pre-tax income $ (59.5) $ 39.2 $ 0.8 $ 103.1 Loss on extinguishment of debt (1) 72.2 - 83.8 - Restructuring costs (2) - - - 1.8 Legal and re
Slide 27: Guidance Metrics Reconciliations
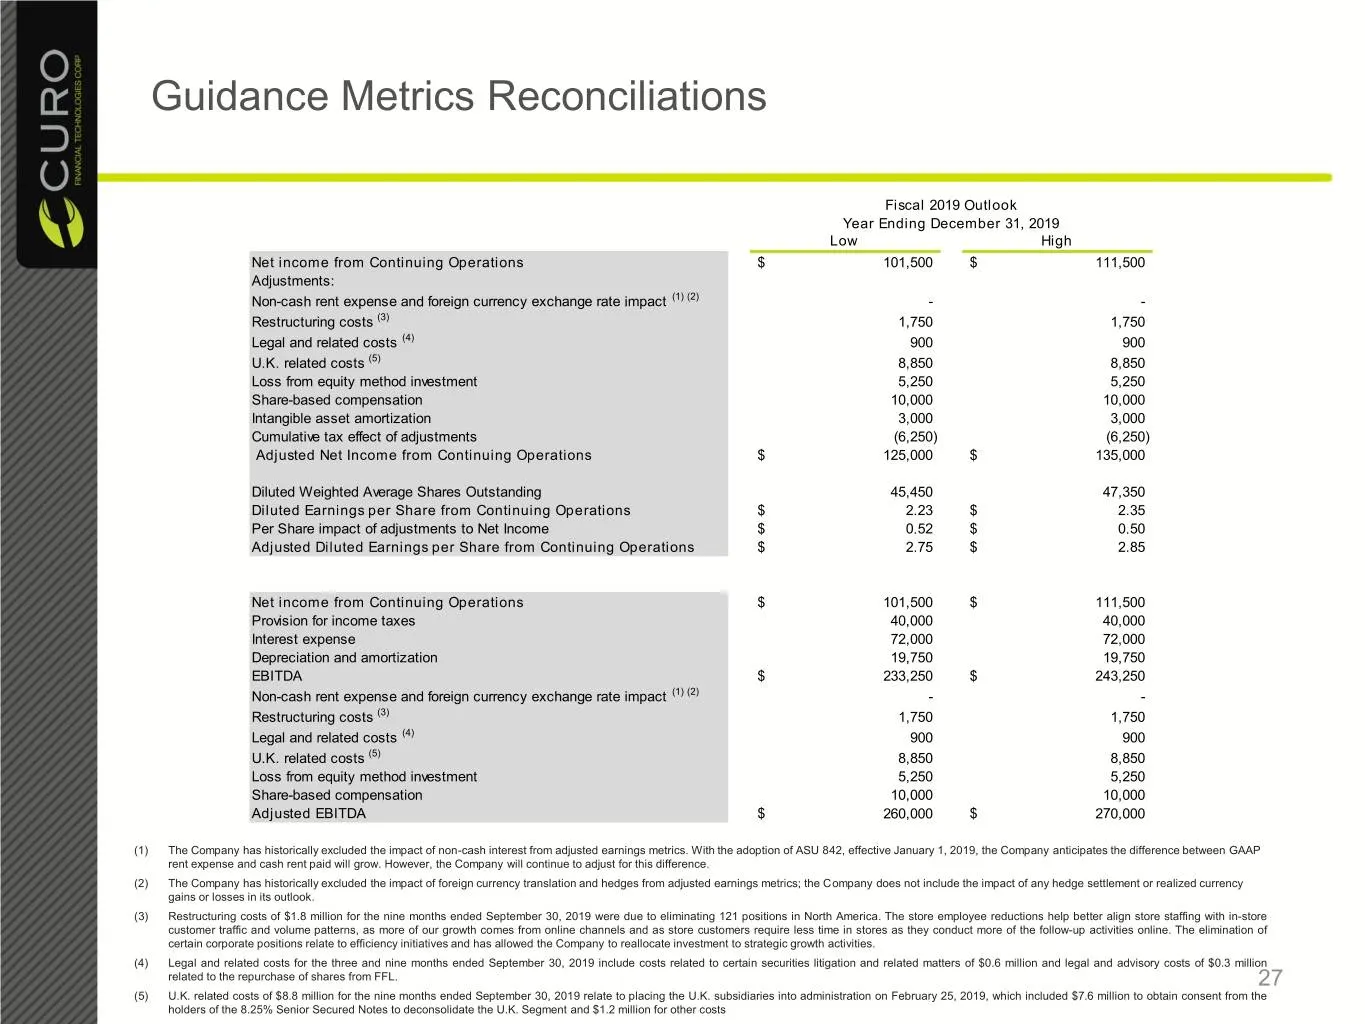
Guidance Metrics Reconciliations Fiscal 2019 Outlook Year Ending December 31, 2019 Low High Net income from Continuing Operations $ 101,500 $ 111,500 Adjustments: Non-cash rent expense and foreign currency exchange rate impact (1) (2) - - Restructuring costs (3) 1,750 1,750 Legal and related costs (
Slide 28: US – AEBITDA Reconciliation to Segment Operating Income
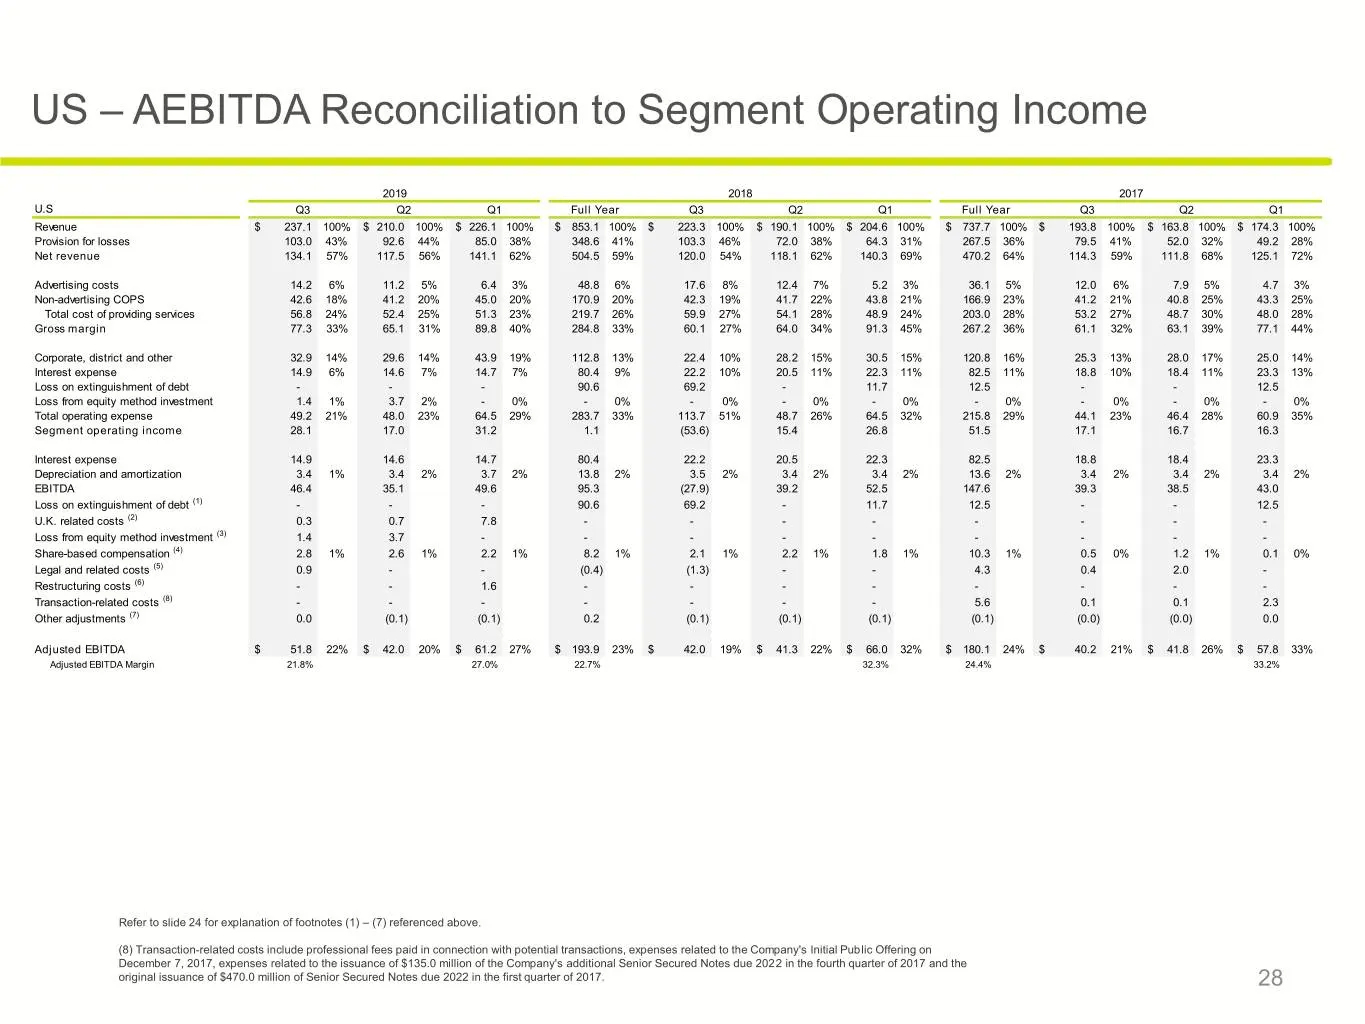
US – AEBITDA Reconciliation to Segment Operating Income 2019 2018 2017 U.S Q3 Q2 Q1 Full Year Q3 Q2 Q1 Full Year Q3 Q2 Q1 Revenue $ 237.1 100% $ 210.0 100% $ 226.1 100% $ 853.1 100% $ 223.3 100% $ 190.1 100% $ 204.6 100% $ 737.7 100% $ 193.8 100% $ 163.8 100% $ 174.3 100% Provision for losses 103.0
Slide 29: Canada – AEBITDA Reconciliation to Segment Operating Income
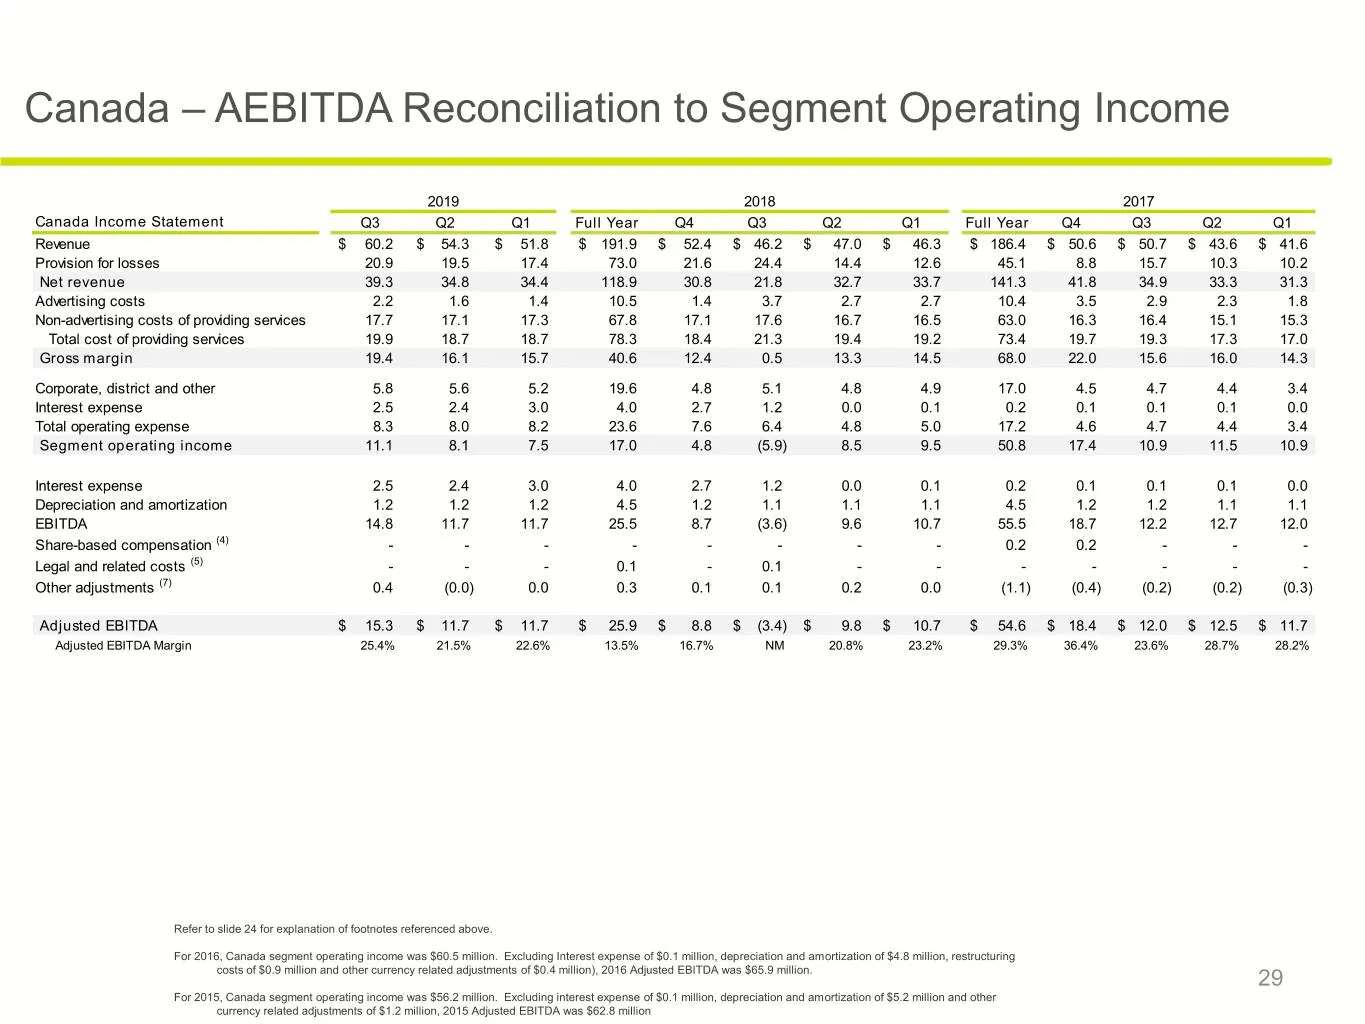
Canada – AEBITDA Reconciliation to Segment Operating Income 2019 2018 2017 Canada Income Statement Q3 Q2 Q1 Full Year Q4 Q3 Q2 Q1 Full Year Q4 Q3 Q2 Q1 Revenue $ 60.2 $ 54.3 $ 51.8 $ 191.9 $ 52.4 $ 46.2 $ 47.0 $ 46.3 $ 186.4 $ 50.6 $ 50.7 $ 43.6 $ 41.6 Provision for losses 20.9 19.5 17.4 73.0 21.6 2
Source: SEC EDGAR · 8-K filed Nov 12, 2019
More decks from Curo Group Holdings Corp
 Q4 2023 Earnings Presentation21 slides · Feb 12, 2024
 Investor Presentation (November 2023)15 slides · Nov 13, 2023
 Q3 2023 Earnings Presentation20 slides · Nov 2, 2023
 Debt Investor Presentation (October 2023)21 slides · Oct 23, 2023
 Investor Presentation (September 2023)15 slides · Sep 25, 2023
 Q2 2023 Earnings Presentation21 slides · Aug 3, 2023