Sunrise Senior Living — Sunrise Assisted Living — Investor Presentation (February 2002)
9 slides from Sunrise Senior Living's investor presentation, Feb 28, 2002
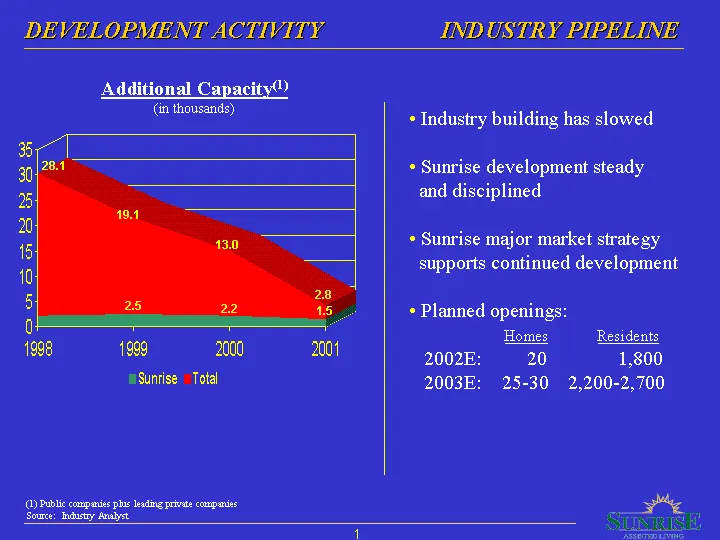
Slide 1: Development Activity
DEVELOPMENT ACTIVITY INDUSTRY PIPELINE Additional Capacity (in thousands) 1998 1999 2000 2001 eSunrise Total (Q) Public companies ps leting private companies Souce: Indasy Analyt + Industry building has slowed + Sunrise development steady and disciplined + Sunrise major market strategy supports cont
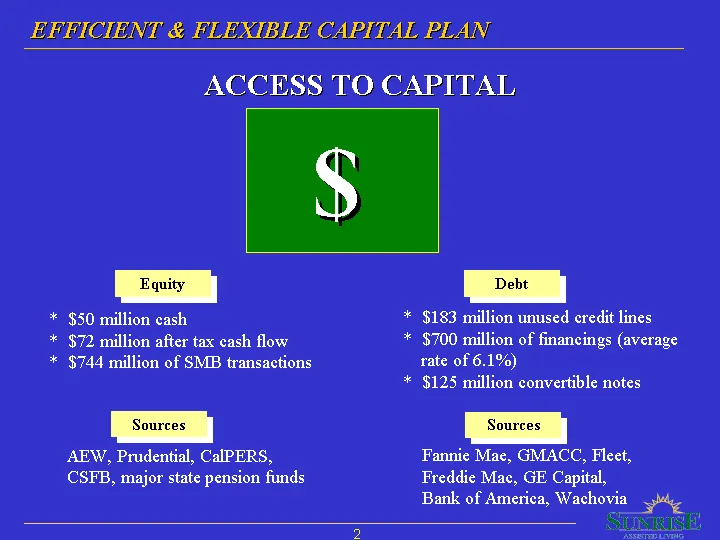
Slide 2: Efficient & Flexible Capital Plan
EEHICIENT & FLEXIBLE CAPITAL PLAN ACCESS TO CAPITAL * $50 million cash * $72 million after tax cash flow * $744 million of SMB transactions AEW, Prudential, CalPERS, CSEB, major state pension funds * $183 million unused credit lines * $700 million of financings (average rate of 6.1%) * $125 million
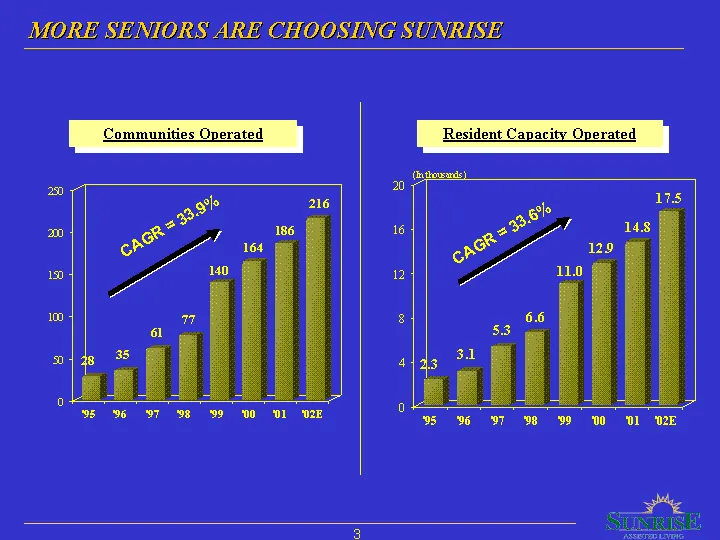
Slide 3: More Seniors Are Choosing Sunrise
MORE SENIORS ARE CHOOSING SUNKISE
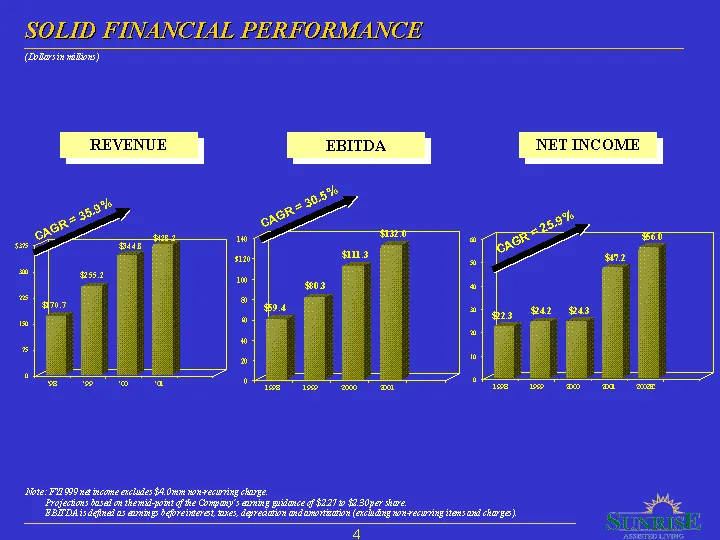
Slide 4: Solid Financial Performance
SOLID FINANCIAL PERFORMANCE (Botasin nde) Note: F900 xa income nls $4 0mm wn vecaring cage ‘rojecons basal ox tein of te Company's ening piace f $227 v $2 30yer sae FAIDATs dgiualas ani dgbretwere nes davracaton andanortzaten (acid wn? ecing ions and charg) a
Slide 5: Management Services Growth
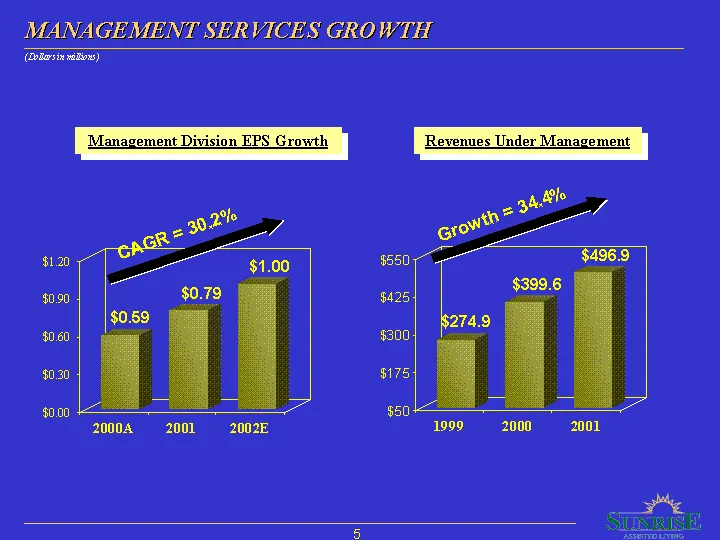
MANAGEMENT SERVICES GROWTH (Botasin nde) 20008 2001 «= 2002E i999 = 2000-2001
Slide 6: Sunrise Reaching Highlights
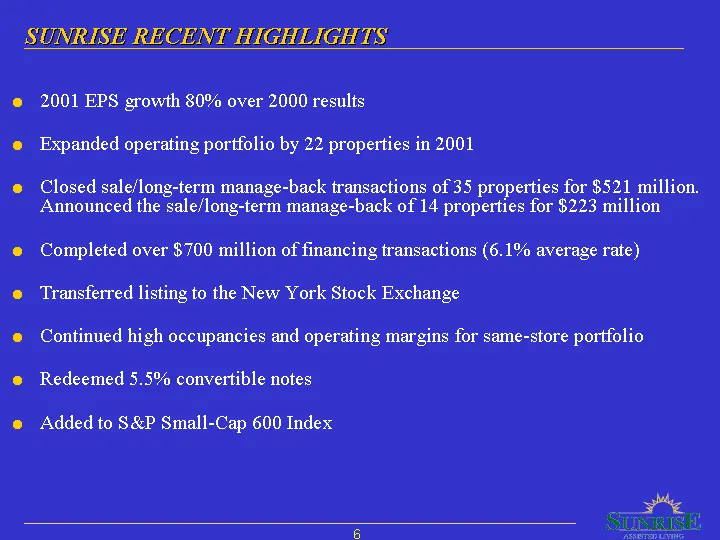
SUNEISH RECHNG HIGHLIGHTS 2001 EPS growth 80% over 2000 results Expanded operating portfolio by 22 properties in 2001 Closed sale/long-term manage-back transactions of 35 properties for $521 million. Announced the sale/long-term manage-back of 14 properties for $223 million Completed over $700 milli
Slide 7: 12/31/01 Capitalization Table
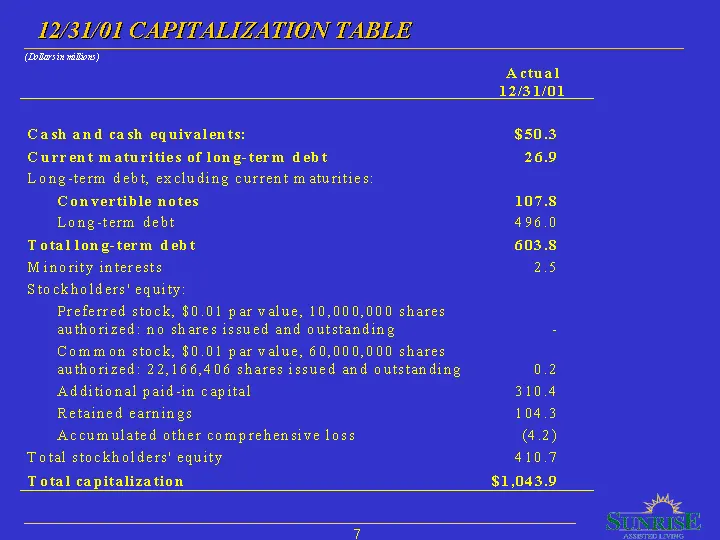
IZ/31/01 CAPITALIZATION TABLE (Botasin nde) Actual 12/31/01 Cash and cash equivalents: $50.3 Current maturities of long-term debt 26.9 Long-term debt, excluding current maturities: Convertible notes 107.8 Long-term debt 496.0 Total long-term debt 603.8 Minority interests 2.5 Stockholders’ equity: Pr
Slide 8: Summary Credit Statistics
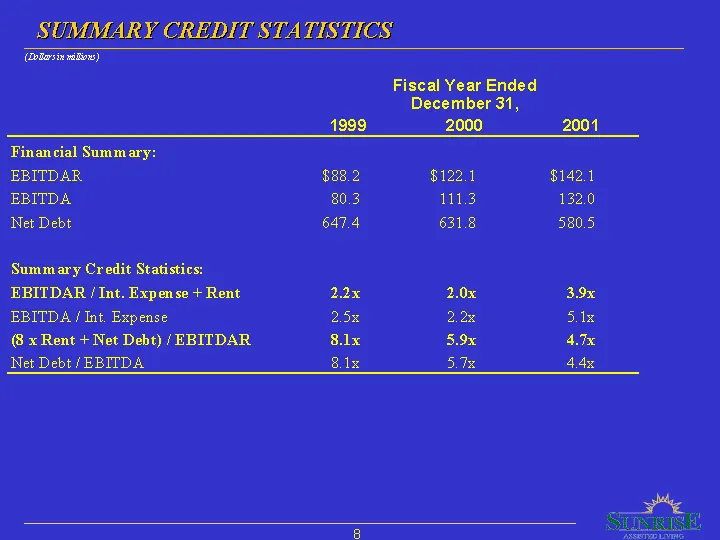
SUMMARY CREDIT STATISTICS (Botasin nde) Fiscal Year Ended December 31, 1999 2000 2001 Financial Summary: EBITDAR $88.2 $122.1 $142.1 EBITDA 80.3 111.3 132.0 Net Debt 647.4 631.8 580.5 Summary Credit Statistics: EBITDAR / Int. Expense + Rent 22x 2.0x 39x EBITDA / Int. Expense 25x 2.28 Six 8 x Rent +
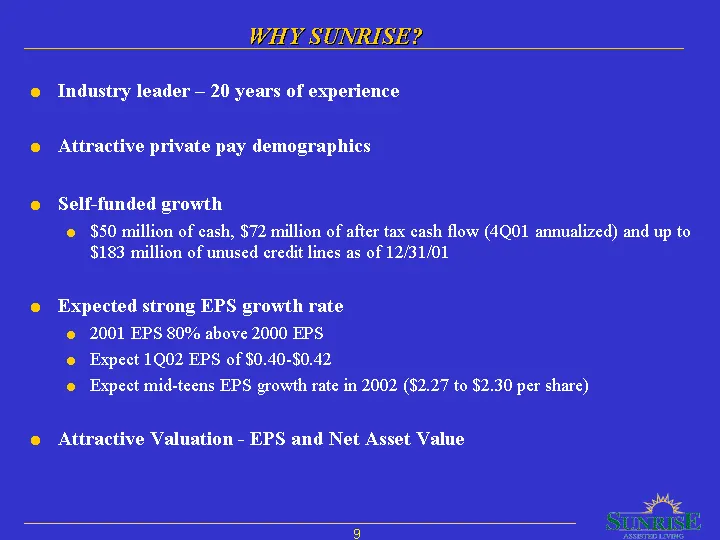
Slide 9: Why Sunrise?
WHY SUNRISE? Industry leader — 20 years of experience Attractive private pay demographics Self-funded growth e $50 million of cash, $72 million of after tax cash flow (4Q01 annualized) and up to $183 million of unused credit lines as of 12/31/01 Expected strong EPS growth rate © 2001 EPS 80% above 2
Source: SEC EDGAR · 8-K filed Feb 28, 2002
More decks from Sunrise Senior Living
 Merger or Acquisition (August 2012)12 slides · Aug 22, 2012
 Investor Presentation (June 2011)27 slides · Jun 14, 2011
 Investor Presentation (May 2008)38 slides · May 21, 2008
 Investor Presentation (May 2008)38 slides · May 14, 2008
 Lehman Brothers Ninth Annual Healthcare Conference 200642 slides · Mar 8, 2006
 Investor Presentation (May 2005)39 slides · May 18, 2005