Novelis — FY2018 Earnings Presentation
19 slides from Novelis's earnings presentation, May 8, 2018
Slide 1: Novelis Q4 & FY Fiscal 2018 Earnings Conference Call
Exhibit 99.2 NOVELIS Q4 & FY FISCAL 2018 EARNINGS CONFERENCE CALL May 8, 2018 Steve Fisher President and Chief Executive Officer Devinder Ahuja Senior Vice President and Chief Financial Officer © 2018 Novelis
Slide 2: Safe Harbor Statement
SAFE HARBOR STATEMENT Forward-looking statements Statements made in this presentation which describe Novelis' intentions, expectations, beliefs or predictions may be forward- looking statements within the meaning of securities laws. Forward-looking statements include statements preceded by, followed
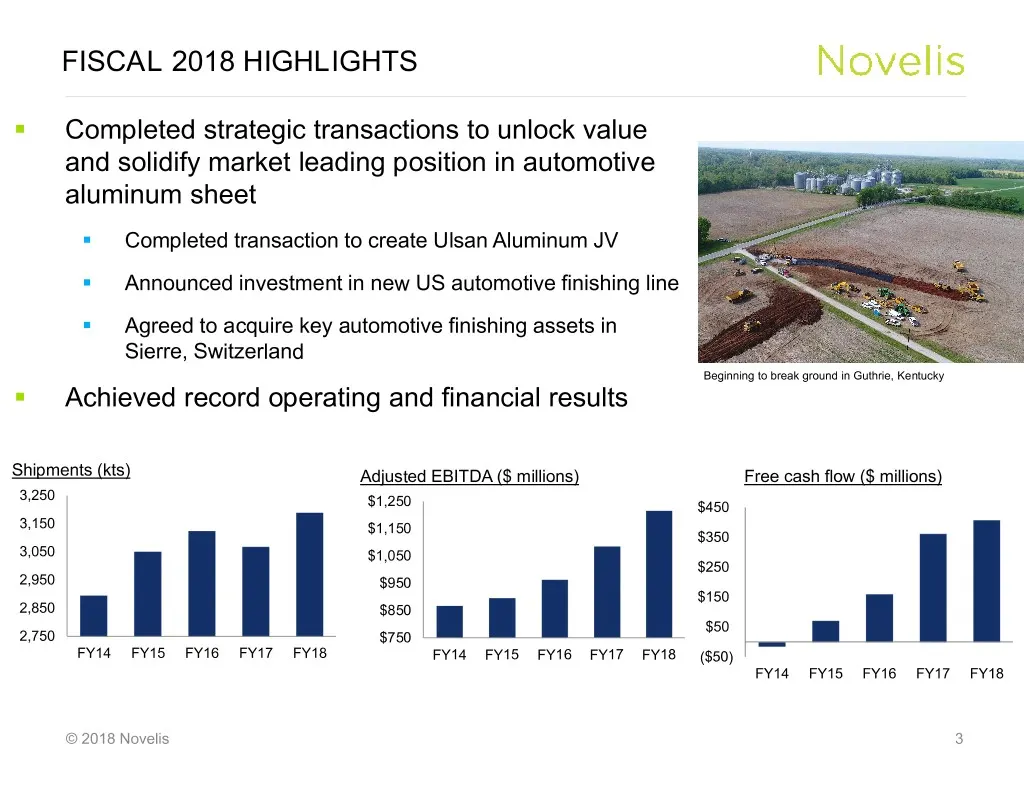
Slide 3: Fiscal 2018 Highlights
FISCAL 2018 HIGHLIGHTS ° Completed strategic transactions to unlock value and solidify market leading position in automotive aluminum sheet ° Completed transaction to create Ulsan Aluminum JV ° Announced investment in new US automotive finishing line ° Agreed to acquire key automotive finishing asse
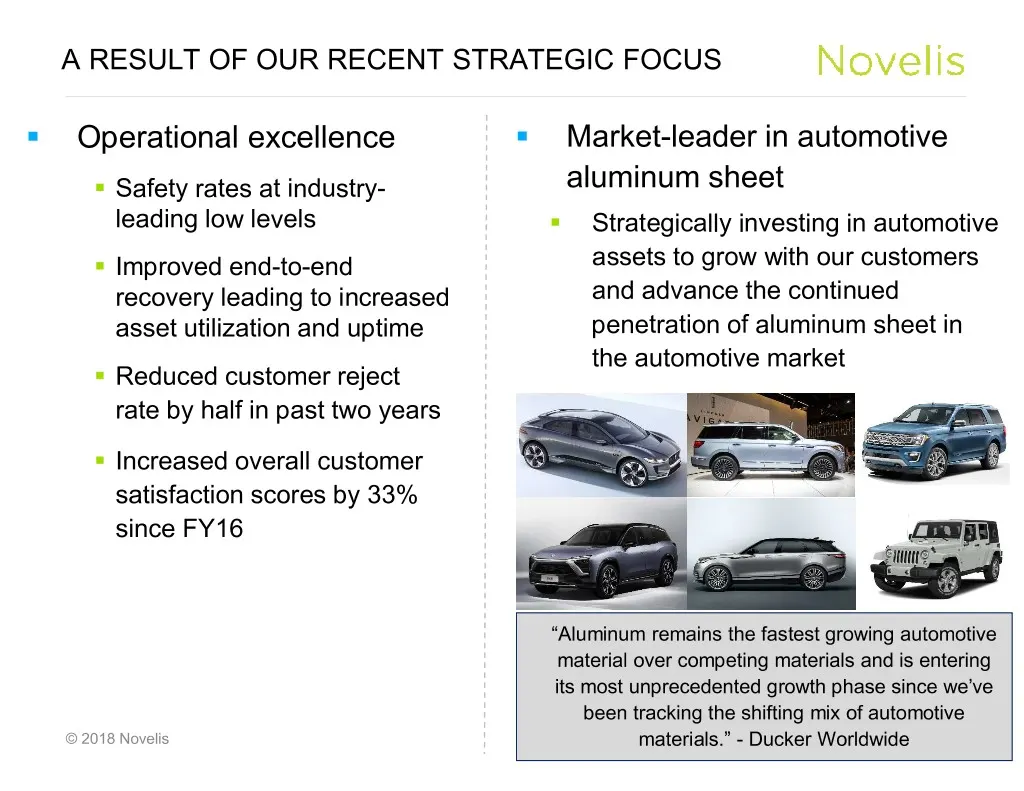
Slide 4: A Result of Our Recent Strategic Focus
A RESULT OF OUR RECENT STRATEGIC FOCUS ° Operational excellence ° Market-leader in automotive ° Safety rates at industry- aluminum sheet leading low levels ° Strategically investing in automotive ° Improved end-to-end assets to grow with our customers recovery leading to increased and advance the co
Slide 5: Successful Transformation in Progress
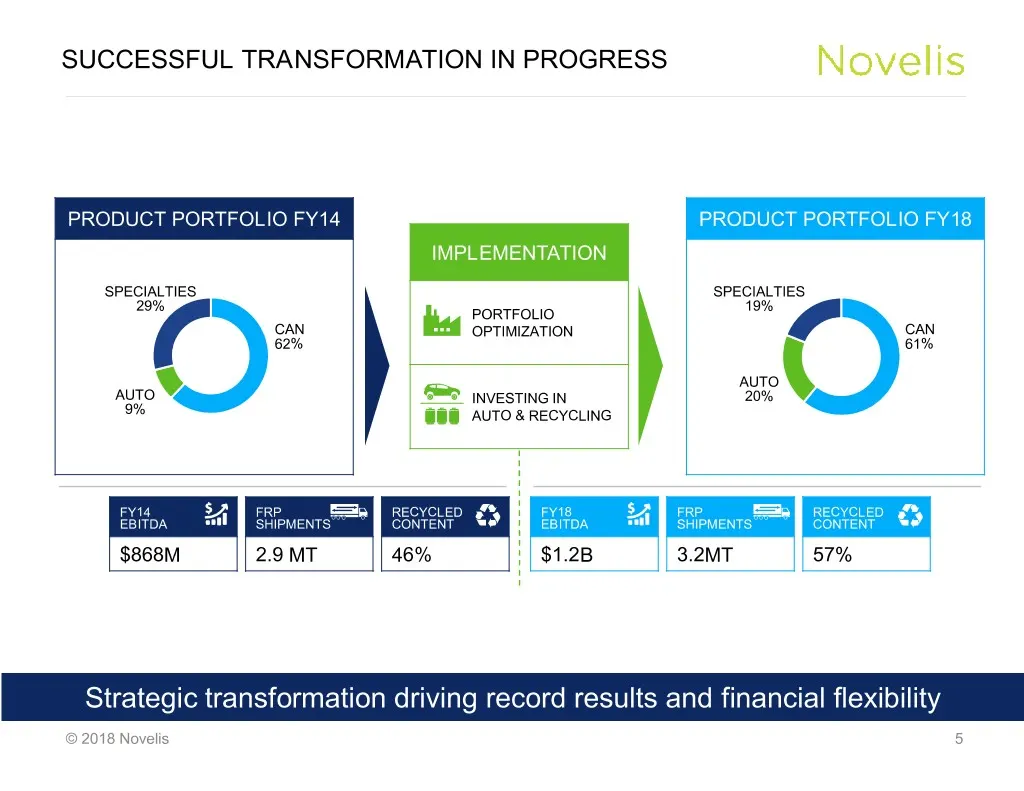
SUCCESSFUL TRANSFORMATION IN PROGRESS PRODUCT PORTFOLIO FY14 PRODUCT PORTFOLIO FY18 IMPLEMENTATION SPECIALTIES SPECIALTIES 29% 19% PORTFOLIO CAN OPTIMIZATION CAN 62% 61% AUTO AUTO INVESTING IN 20% 9% AUTO & RECYCLING FY14 FRP RECYCLED FY18 FRP RECYCLED EBITDA SHIPMENTS CONTENT EBITDA SHIPMENTS CONTE
Slide 6: Financial Highlights
FINANCIAL HIGHLIGHTS © 2018 Novelis
Slide 7: Q4 Fiscal 2018 Financial Highlights
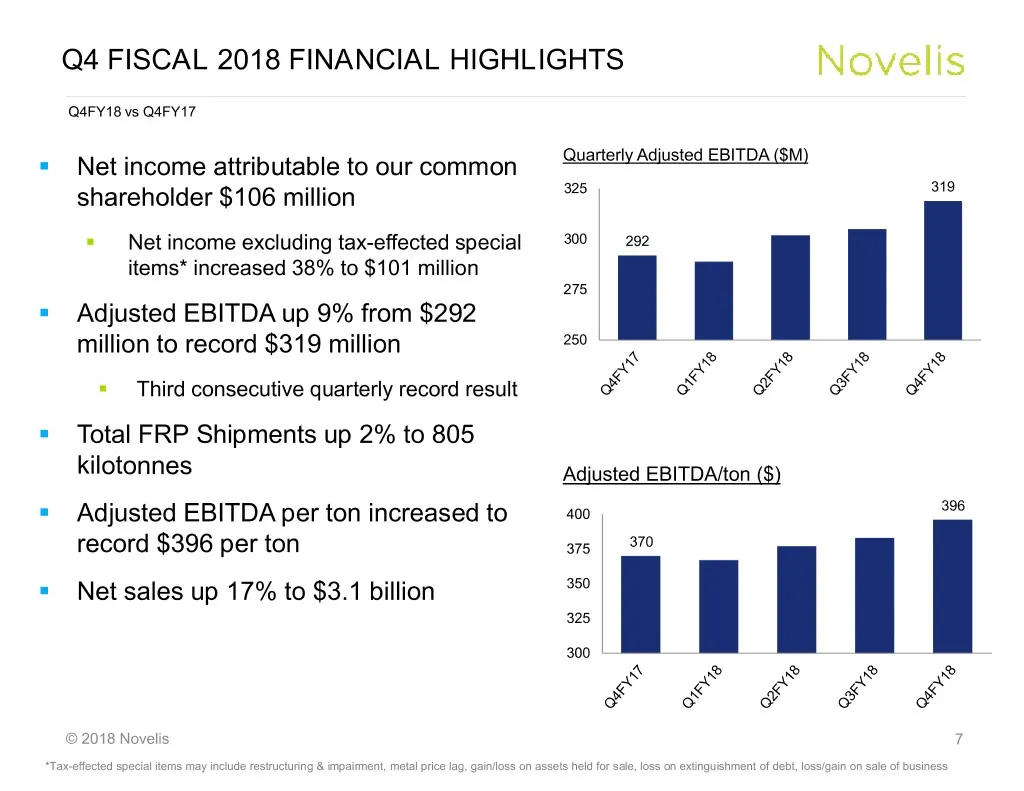
Q4 FISCAL 2018 FINANCIAL HIGHLIGHTS Q4FY18 vs Q4FY17 ° Net income attributable to our common Quarterly Adjusted EBITDA ($M) shareholder $106 million 325 319 ° Net income excluding tax-effected special 300 292 items* increased 38% to $101 million 275 ° Adjusted EBITDA up 9% from $292 million to recor
Slide 8: Q4 Adjusted EBITDA Bridge
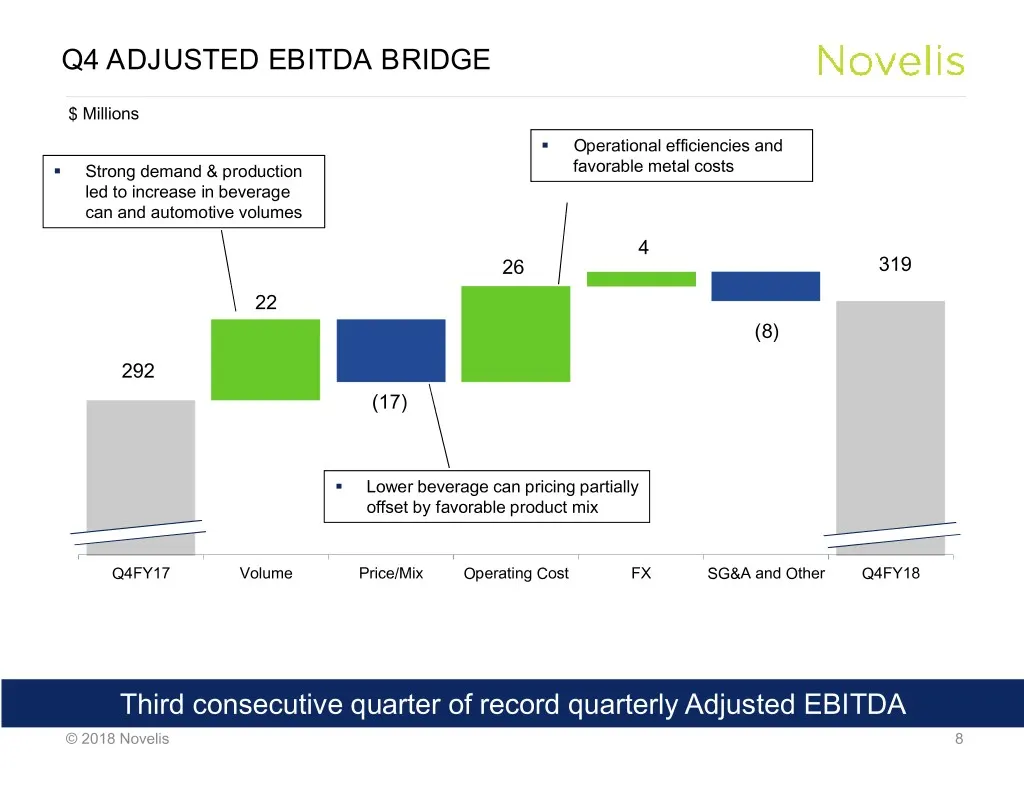
Q4 ADJUSTED EBITDA BRIDGE $ Millions ° Operational efficiencies and ° Strong demand & production favorable metal costs led to increase in beverage can and automotive volumes 4 26 319 22 (8) 292 (17) ° Lower beverage can pricing partially offset by favorable product mix Q4FY17 Volume Price/Mix Operat
Slide 9: Full Year FY18 Financial Highlights
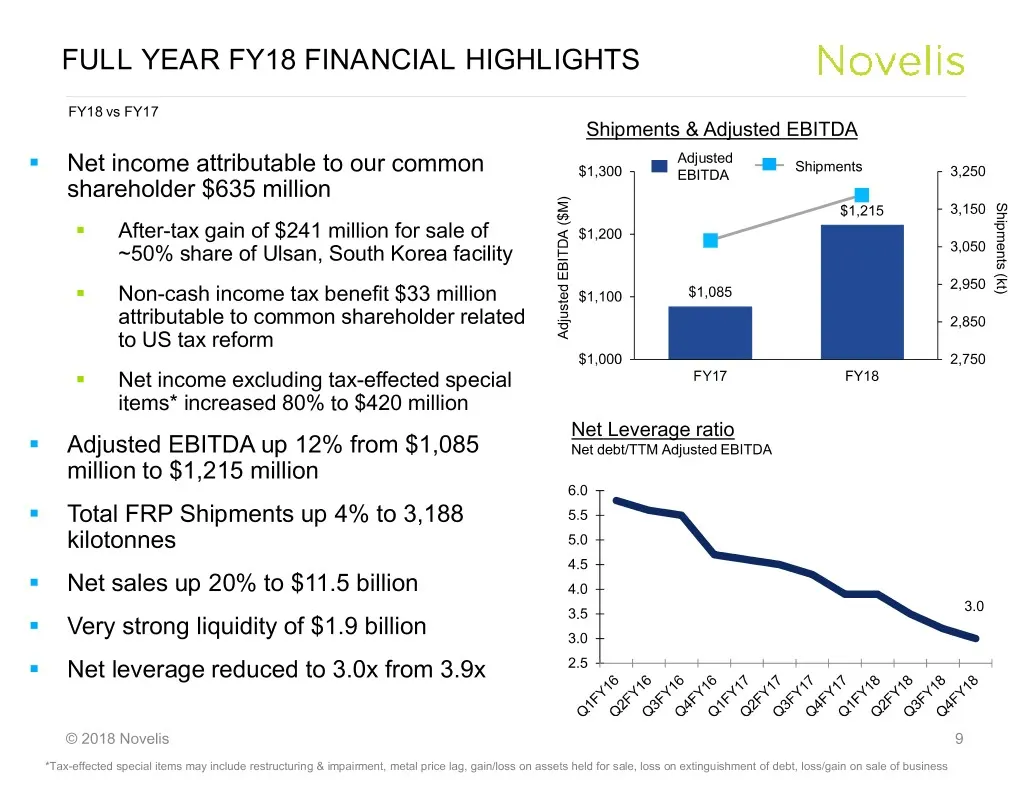
FULL YEAR FY18 FINANCIAL HIGHLIGHTS FY18 vs FY17 Shipments & Adjusted EBITDA Adjusted Shipments ° Net income attributable to our common $1,300 EBITDA 3,250 shareholder $635 million Shipments (kt) $1,215 3,150 ° After-tax gain of $241 million for sale of $1,200 ~50% share of Ulsan, South Korea facili
Slide 10: Full Year Adjusted EBITDA Bridge
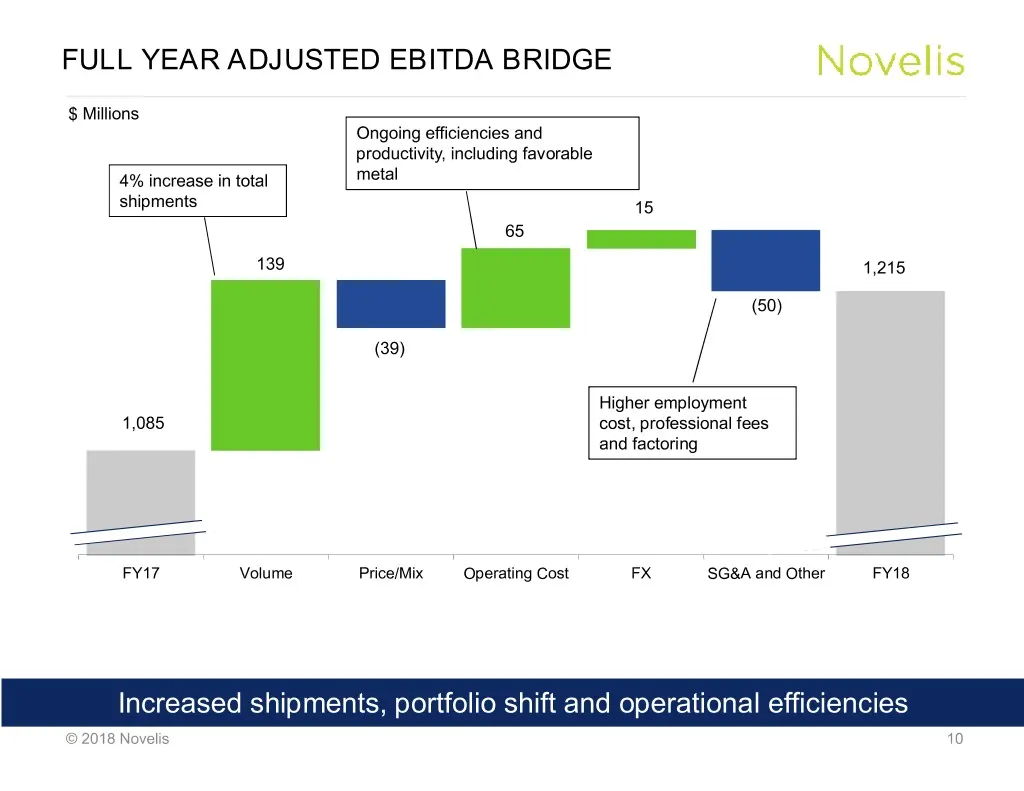
FULL YEAR ADJUSTED EBITDA BRIDGE $ Millions Ongoing efficiencies and productivity, including favorable 4% increase in total metal shipments 15 65 139 1,215 (50) (39) Higher employment 1,085 cost, professional fees and factoring FY17 Volume Price/Mix Operating Cost FX SG&A and Other FY18 Increased sh
Slide 11: Free Cash Flow
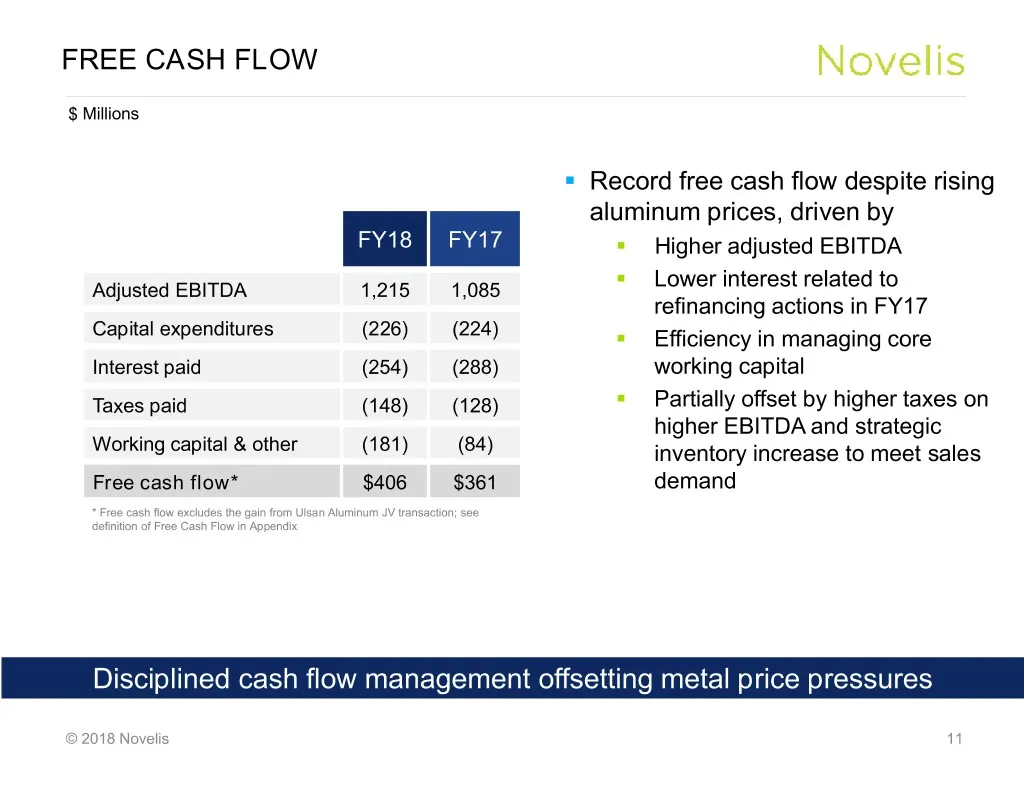
FREE CASH FLOW $ Millions ° Record free cash flow despite rising aluminum prices, driven by FY18 FY17 ° Higher adjusted EBITDA Lower interest related to Adjusted EBITDA 1,215 1,085 ° refinancing actions in FY17 Capital expenditures (226) (224) ° Efficiency in managing core Interest paid (254) (288)
Slide 12: Strategy & Outlook
STRATEGY & OUTLOOK © 2018 Novelis
Slide 13: Sharpening Our Focus
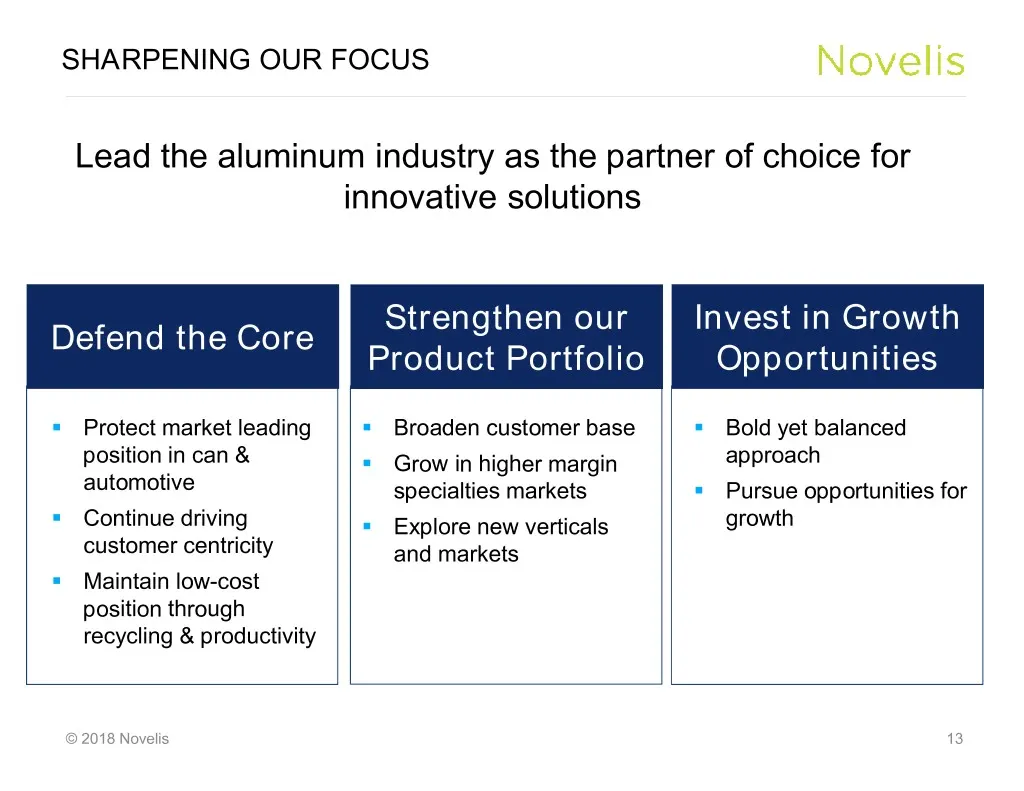
SHARPENING OUR FOCUS Lead the aluminum industry as the partner of choice for innovative solutions Strengthen our Invest in Growth Defend the Core Product Portfolio Opportunities ° Protect market leading ° Broaden customer base ° Bold yet balanced position in can & ° Grow in higher margin approach au
Slide 14: Market and Industry Outlook
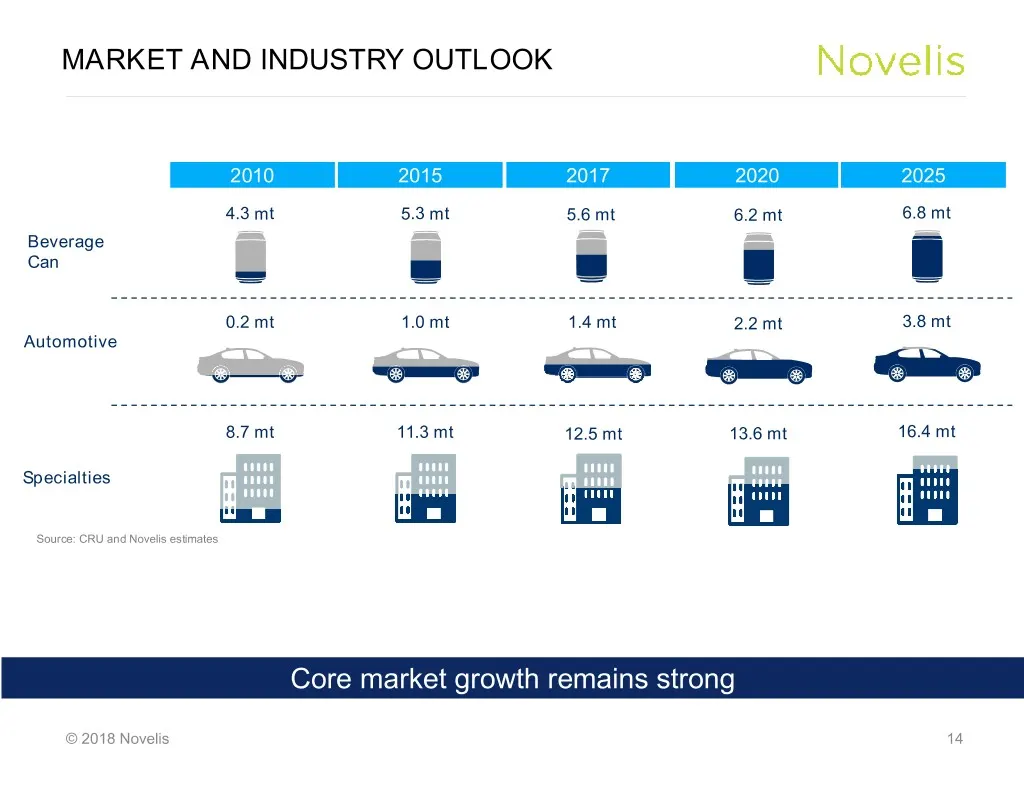
MARKET AND INDUSTRY OUTLOOK 2010 2015 2017 2020 2025 4.3 mt 5.3 mt 5.6 mt 6.2 mt 6.8 mt Beverage Can 0.2 mt 1.0 mt 1.4 mt 2.2 mt 3.8 mt Automotive 8.7 mt 11.3 mt 12.5 mt 13.6 mt 16.4 mt Specialties Source: CRU and Novelis estimates Core market growth remains strong © 2018 Novelis 14
Slide 15: Summary and FY19 Outlook
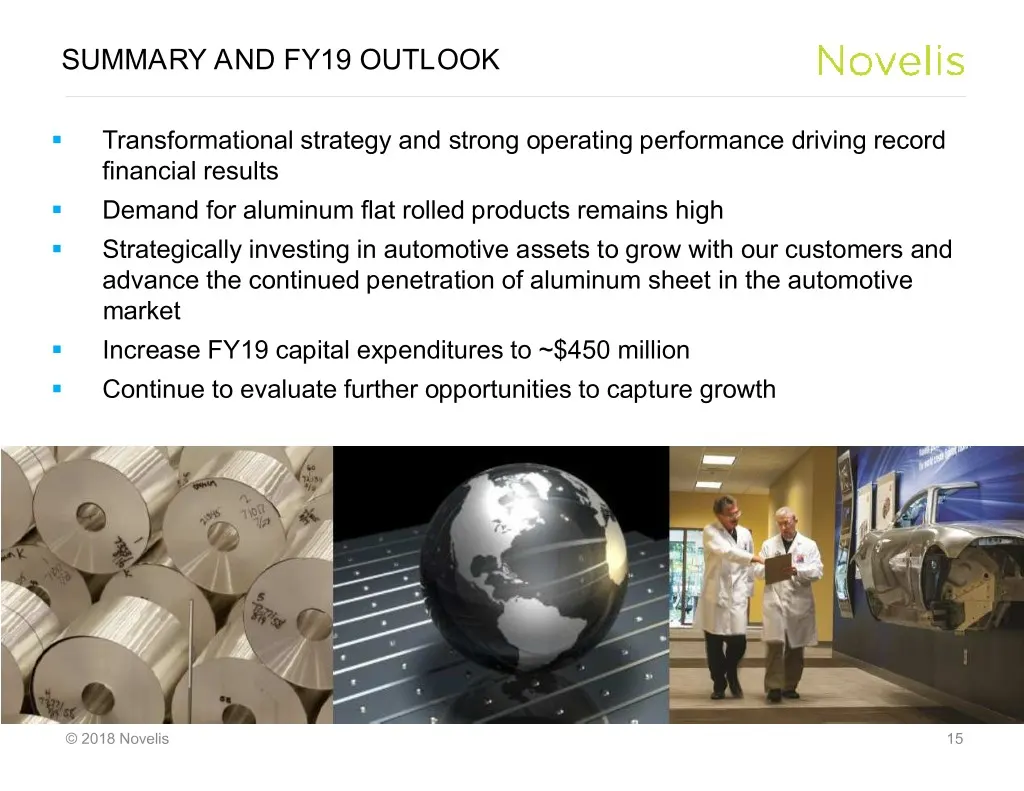
SUMMARY AND FY19 OUTLOOK ° Transformational strategy and strong operating performance driving record financial results ° Demand for aluminum flat rolled products remains high ° Strategically investing in automotive assets to grow with our customers and advance the continued penetration of aluminum s
Slide 16: Thank You and Questions
THANK YOU AND QUESTIONS THANK YOU QUESTIONS? © 2018 Novelis
Slide 17: Appendix
APPENDIX © 2018 Novelis
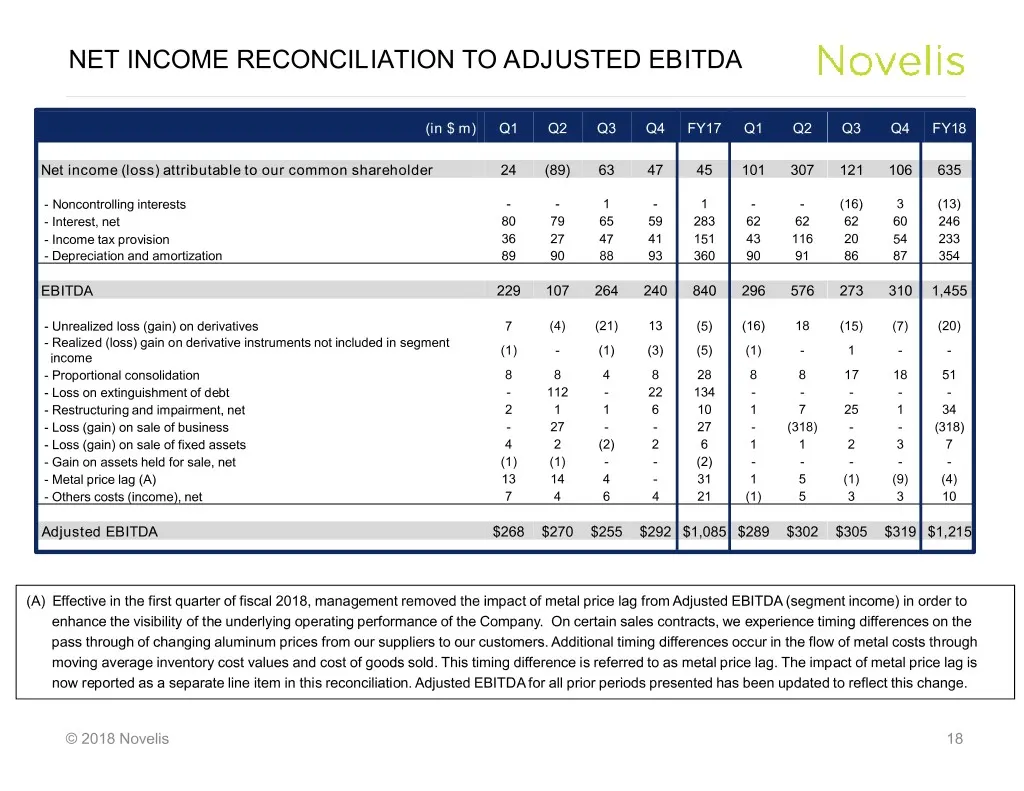
Slide 18: Net Income Reconciliation to Adjusted EBITDA
NET INCOME RECONCILIATION TO ADJUSTED EBITDA (in $ m) Q1 Q2 Q3 Q4 FY17 Q1 Q2 Q3 Q4 FY18 Net income (loss) attributable to our common shareholder 24 (89) 63 47 45 101 307 121 106 635 - Noncontrolling interests - - 1 - 1 - - (16) 3 (13) - Interest, net 80 79 65 59 283 62 62 62 60 246 - Income tax prov
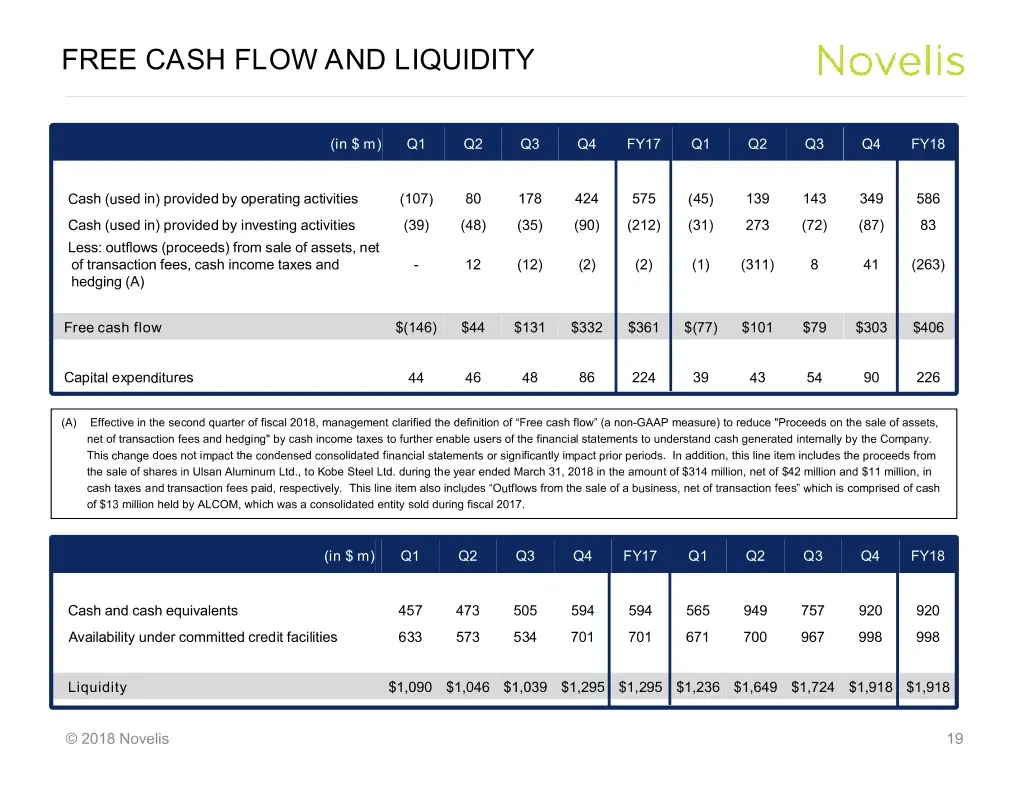
Slide 19: Free Cash Flow and Liquidity
FREE CASH FLOW AND LIQUIDITY (in $ m ) Q1 Q2 Q3 Q4 FY17 Q1 Q2 Q3 Q4 FY18 Cash (used in) provided by operating activities (107) 80 178 424 575 (45) 139 143 349 586 Cash (used in) provided by investing activities (39) (48) (35) (90) (212) (31) 273 (72) (87) 83 Less: outflows (proceeds) from sale of as
Source: SEC EDGAR · 8-K filed May 8, 2018
More decks from Novelis Inc.
 Q2 FY2027 Earnings Presentation20 slides · Nov 5, 2026
 Q2 FY2027 Earnings Presentation31 slides · Nov 5, 2026
 Q1 FY2027 Earnings Presentation21 slides · Aug 5, 2026
 Q1 FY2027 Earnings Presentation31 slides · Aug 5, 2026
 Q4 FY2026 Earnings Presentation33 slides · May 19, 2026
 Q3 FY2026 Earnings Presentation33 slides · Feb 11, 2026