Medco Health Solutions — Investor Day (November 2006)
126 slides from Medco Health Solutions's investor day presentation, Nov 30, 2006

Slide 1: Growing Today, Innovating for a Greater Tomorrow Analyst Day
Growing Today, Innovating for a Greater Tomorrow Analyst Day - November 30, 2006 Medco is a registered trademark of Medco Health Solutions, Inc. Valerie C. Haertel Vice President, Investor Relations Exhibit 99.1

Slide 2: Forward-looking statements
Forward-looking statements This presentation contains “forward-looking statements” as that term is defined in the Private Securities Litigation Reform Act of 1995. These statements involve risks and uncertainties that may cause results to differ materially from those set forth in the statements. No

Slide 3: Forward-looking statements (cont'd)
Forward-looking statements (cont ’ d) These factors include: Risks associated with our acquisition of Accredo Health, Incorporated (“Accredo”), including integration risks, and an increase in credit risk resulting from the payment streams associated with specialty pharmacy accounts receivable Govern
Slide 4: Medco Analyst Day Agenda
Medco Analyst Day Agenda Growing Today, Innovating for a Greater Tomorrow Break Registration & Continental Breakfast V. Haertel Welcome D. Snow Growing Today, Innovating for a Greater Tomorrow J. Reed Growing the Bottom Line T. Wentworth Growing Specialty Pharmacy L. Kornwasser Optimizing Prescripti

Slide 5: Growing Today, Innovating for a Greater Tomorrow
Growing Today Innovating for a Greater Tomorrow Growing Today, Innovating for a Greater Tomorrow Growing the Bottom Line Growing Specialty Pharmacy Growing in the Marketplace Optimizing Prescriptions 11/28/2006 - 10:00pm

Slide 6: Growing Today, Innovating for a Greater Tomorrow
Growing Today, Innovating for a Greater Tomorrow Analyst Day - November 30, 2006 Medco is a registered trademark of Medco Health Solutions, Inc. David B. Snow, Jr. Chairman & Chief Executive Officer

Slide 7: Medco: growth and innovation
Medco: growth and innovation 1 Industry issues: a historical perspective 2 3 2007 and beyond: innovation and specialization 4 Growth trends and drivers through 2006 Industry growth and Medco’s position
Slide 8: Perceived issues: a historical perspective – 2003
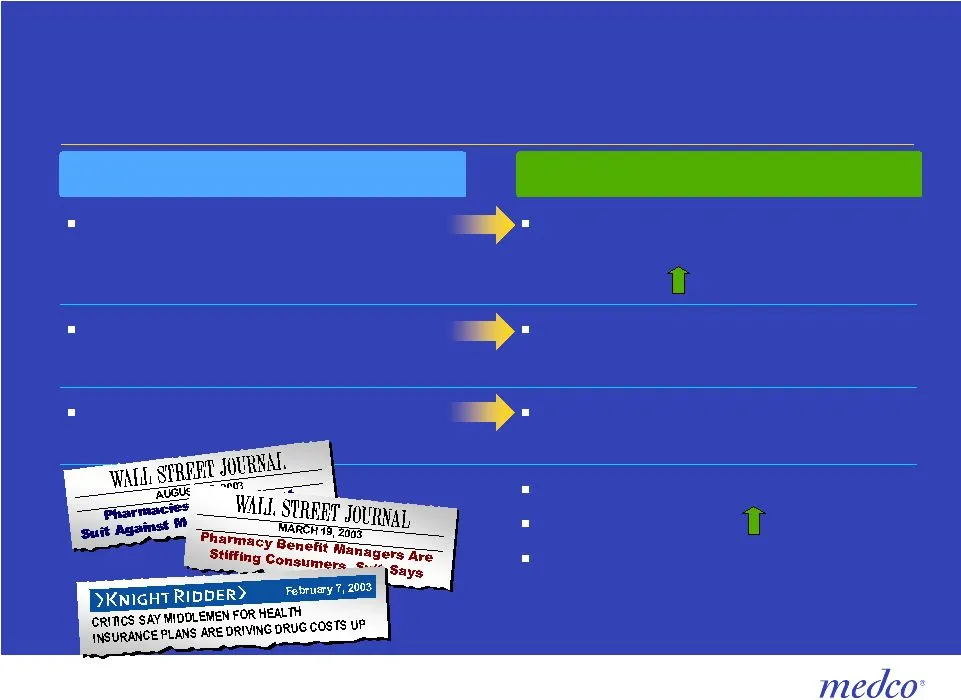
Perceived issues A historical perspective – 2003 Shareholder return of 44.9% GAAP EPS $1.57 18% net income growth GAO report validates value of model PBMs are just “middlemen” Nearly $10 billion in renewals Legal overhang – consequence to retention Transparent model 54% rebates retained, yet EBITDA
Slide 9: Perceived issues: a historical perspective – 2004
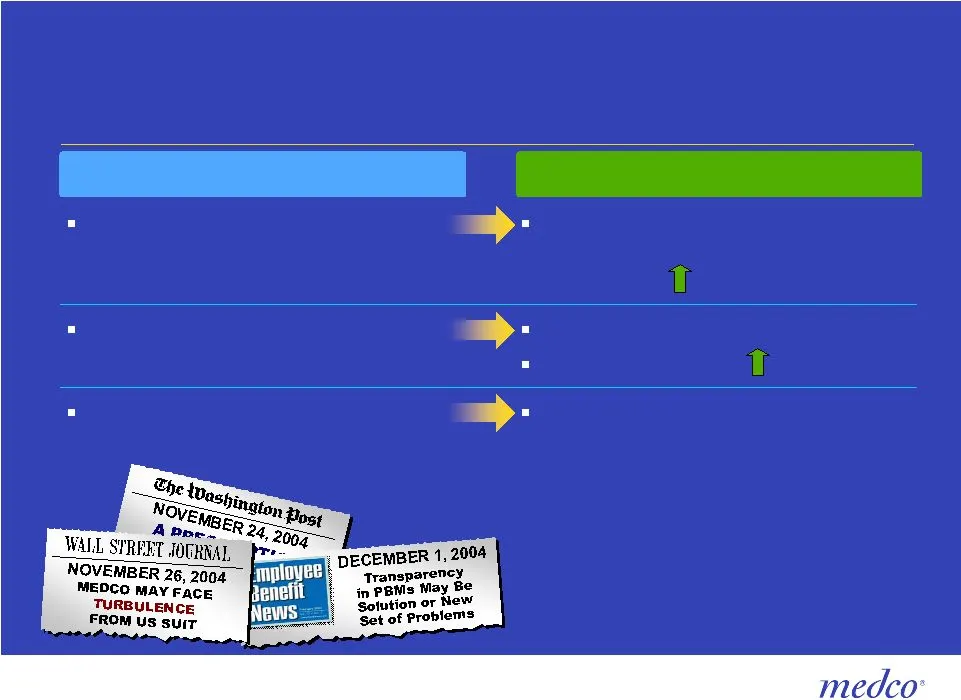
Perceived issues A historical perspective – 2004 $21 billion in renewals Legal overhang – consequence on retention Shareholder return of 23.1% GAAP EPS $1.75, 11.5% Growth prospects Transparent model, 44% rebates retained, yet EBITDA per adj Rx 22% Transparency will harm the model and reduce margins
Slide 10: Perceived issues: a historical perspective – 2005
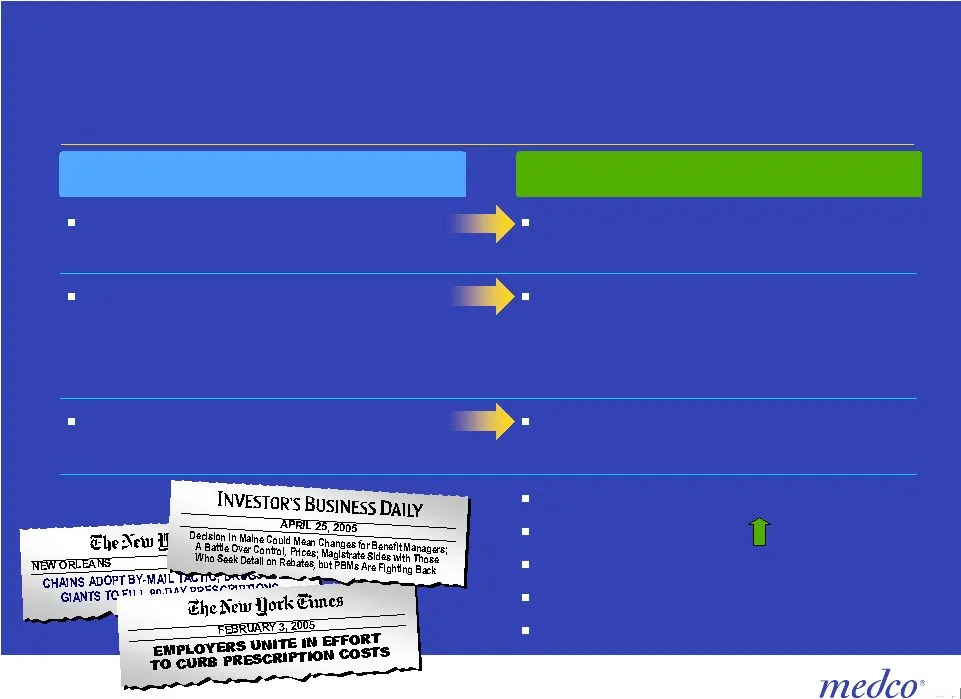
Perceived issues A historical perspective – 2005 Shareholder return of 22.4% GAAP EPS $2.05, 17.1% 25% net income growth $3+ billion new business $10 billion in renewals Medco achieves mail order penetration of 36.6% 90 days at retail would harm PBMs Maine court declared PBMs NOT fiduciaries – Legis
Slide 11: Perceived issues du jour – 2006: Wal-Mart $4 generic plan
Fear 1 Wal-Mart’s $4 generic drug plan is going to negatively impact Medco’s business Perceived issues du jour – 2006 Reality Wal-Mart's program limited to 143 drugs Primarily older, low market share and already low-cost generics Represent approximately 7% of overall drug spend Medco has not seen an
Slide 12: Perceived issues du jour – 2006: AWP settlement
Fear 2 The outcome of the FirstData Bank AWP settlement is going to harm Medco margins Perceived issues du jour – 2006 Reality As early as 2001, Medco anticipated future changes to this benchmark pricing methodology, contracting with our clients to hold both parties economically neutral in the event
Slide 13: Perceived issues du jour – 2006: Caremark/CVS merger
As proposed, the Caremark/CVS merger offers no premium to Caremark – how does that reflect on the future of the PBM industry? Perceived issues du jour – 2006 Reality Medco remains highly confident in the strength of our model and in our long-term growth prospects 2006 guidance raised and narrowed to
Slide 14: Perceived issues du jour – 2006: Democratic control of Congress
Democratic control of Congress may not be conducive to growth in the PBM industry Perceived issues du jour – 2006 Reality Medicare Part D is a success Focus is on manufacturers, not PBMs Democrats generally bullish on generics and defining biogenerics Federal checks and balances remain, mitigating e
Slide 15: Pharmacy – the fastest growing component of health care
Pharmacy – the fastest growing component of the health care industry Aging of America By 2010, seniors aged 55-64 will increase by nearly 50% 1 Seniors consume 3 times the average drug spend of younger consumers (more than 30 Rx’s each) Drug spend inflation & the need to control costs CMS projects d
Slide 16: Medco Health Solutions: Leading Pharmacy Benefit Manager
Medco Health Solutions: Leading Pharmacy Benefit Manager Industry Leading Drug Trend Management Leading Internet Pharmacy Largest Specialty Pharmacy Largest Mail Order Pharmacy Largest Drug Spend Under Management Fortune 100 company with estimated annualized 2006 revenues of ~$42 Billion Fortune 100
Slide 17: Our strategy 2003 through 2007
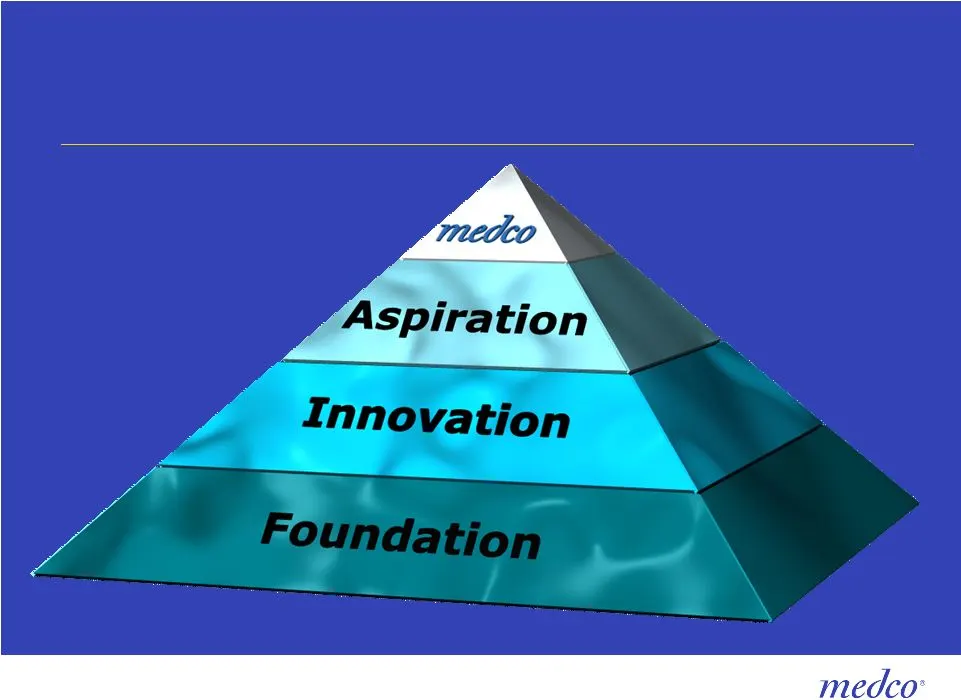
Our 5 year strategy 2003 through 2007
Slide 18: Our long-term growth trends: EBITDA per adjusted script
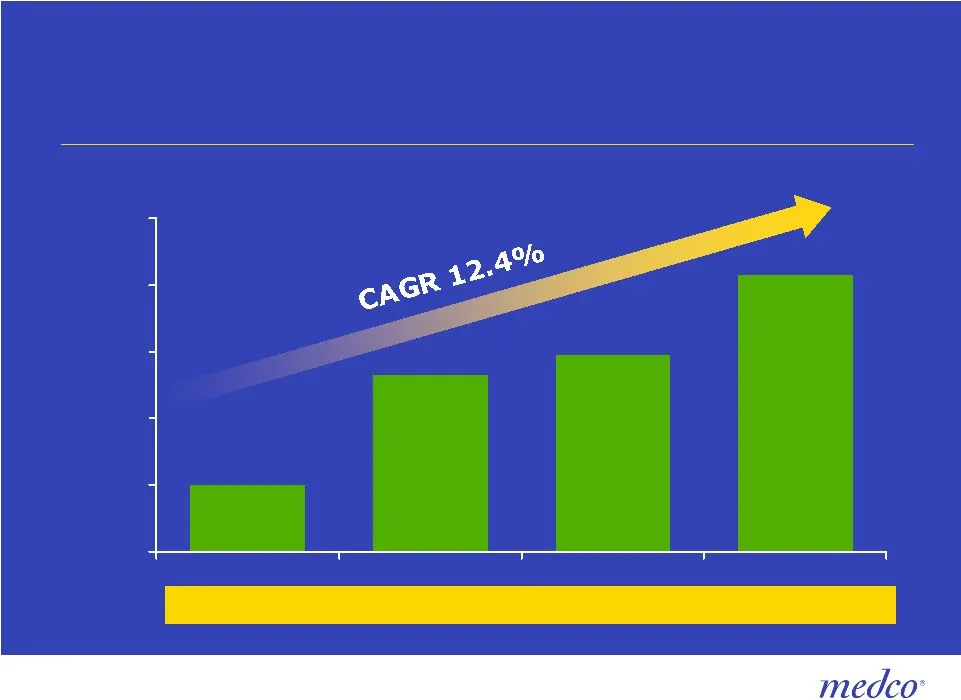
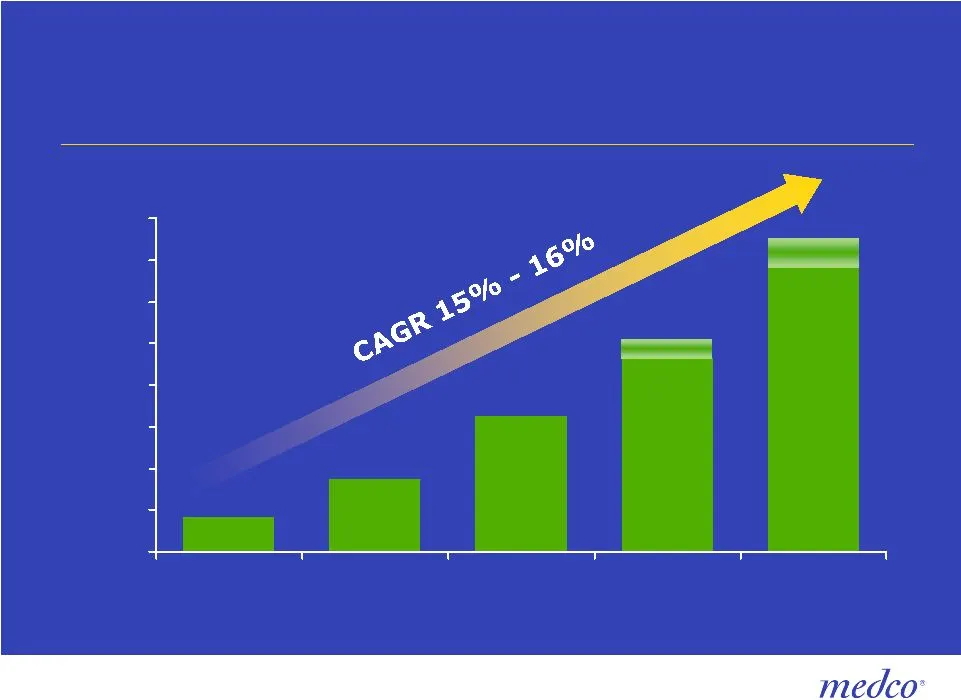
$1.50 $1.83 $1.89 $2.13 $1.30 $1.50 $1.70 $1.90 $2.10 $2.30 2003 2004 2005 9 mos 2006* Our long-term growth trends EBITDA per adjusted script * Excludes first quarter 2006 legal settlements charge Q3 2006 EBITDA per adj Rx = $2.30
Slide 19: Our long-term growth trends: Earnings per share
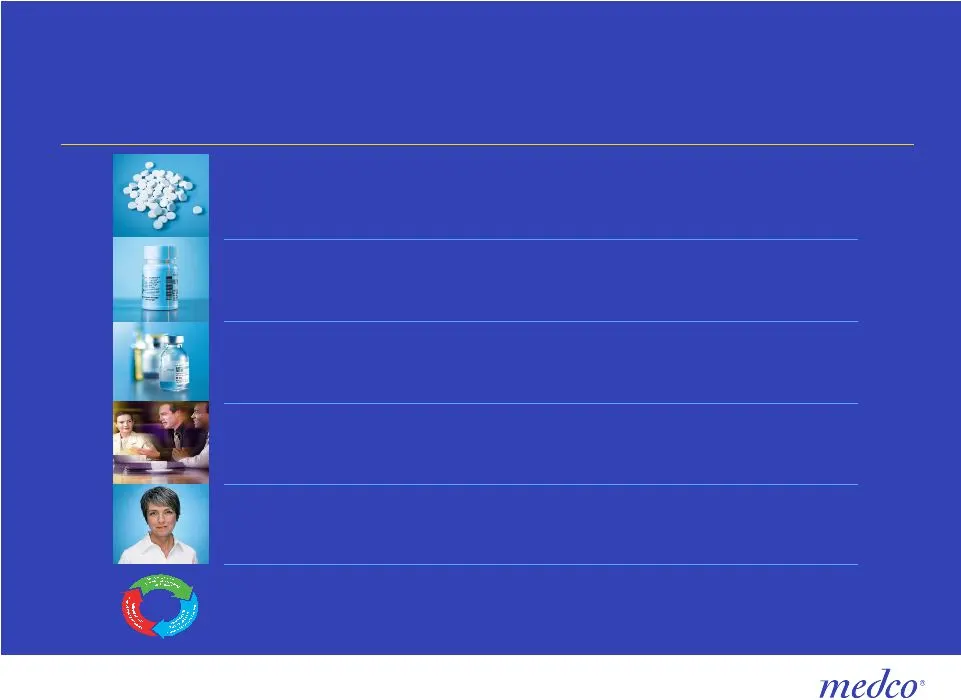
Our long-term growth trends Earnings per share $1.40 $1.60 $1.80 $2.00 $2.20 $2.40 $2.60 $2.80 $3.00 2003 2004 2005 2006E* 2007E * Excludes first quarter 2006 legal settlements charge $1.57 $1.75 $2.05 $2.33 - $2.36 $2.76 - $2.83
Slide 20: medco
medco
Slide 21: Drivers for growth: Grow generic dispensing rate
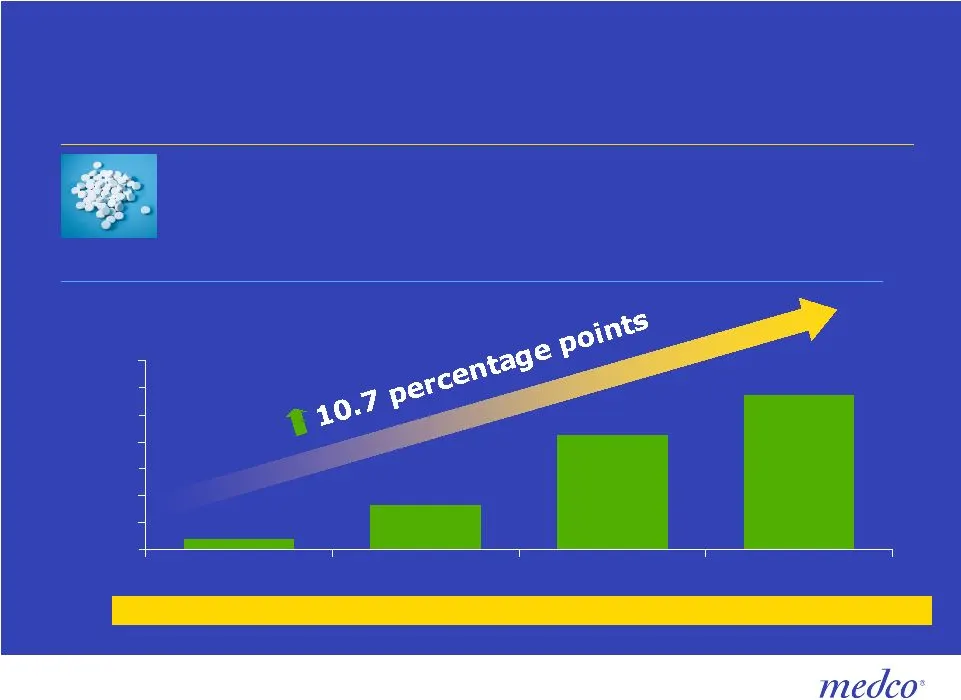
Generic dispensing rate (GDR) 43.8% 46.3% 51.5% 54.5% 43% 45% 47% 49% 51% 53% 55% 57% 2003 2004 2005 9 mos 2006 Medco drivers for long-term growth and profitability Grow generic dispensing rate On average, every point increase in GDR = approximately $25MM (pre-tax)
Slide 22: Drivers for growth: Grow mail
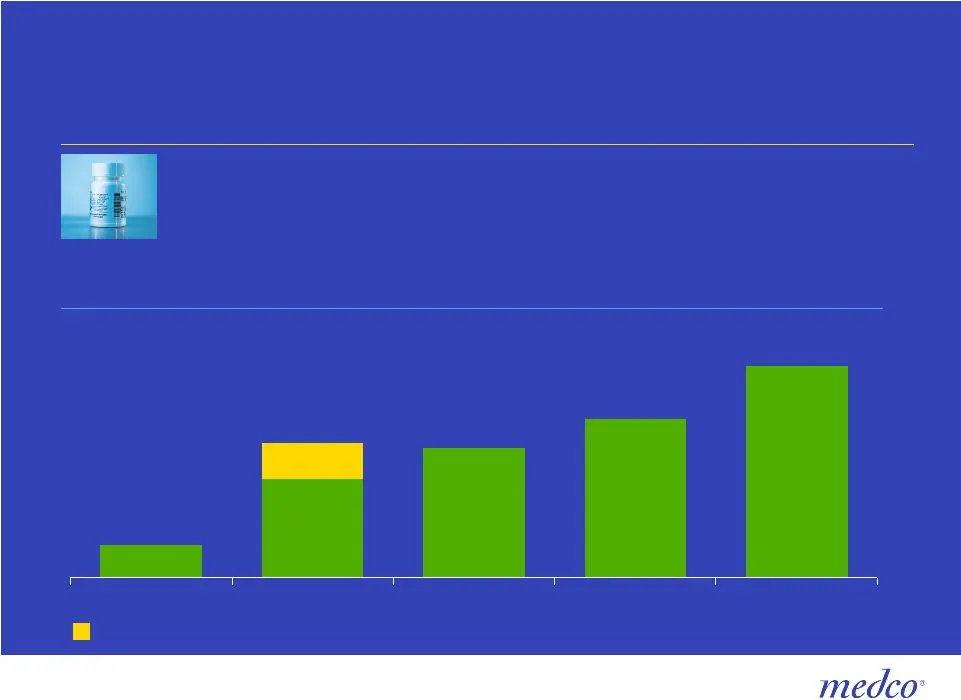
Medco drivers for long-term growth and profitability 78.1 87.7 87.3 90 95 2003 2004 2005 2006E 2007E 10 million FEHBP Rx’s Mail Rx Growth Grow mail ~ ~
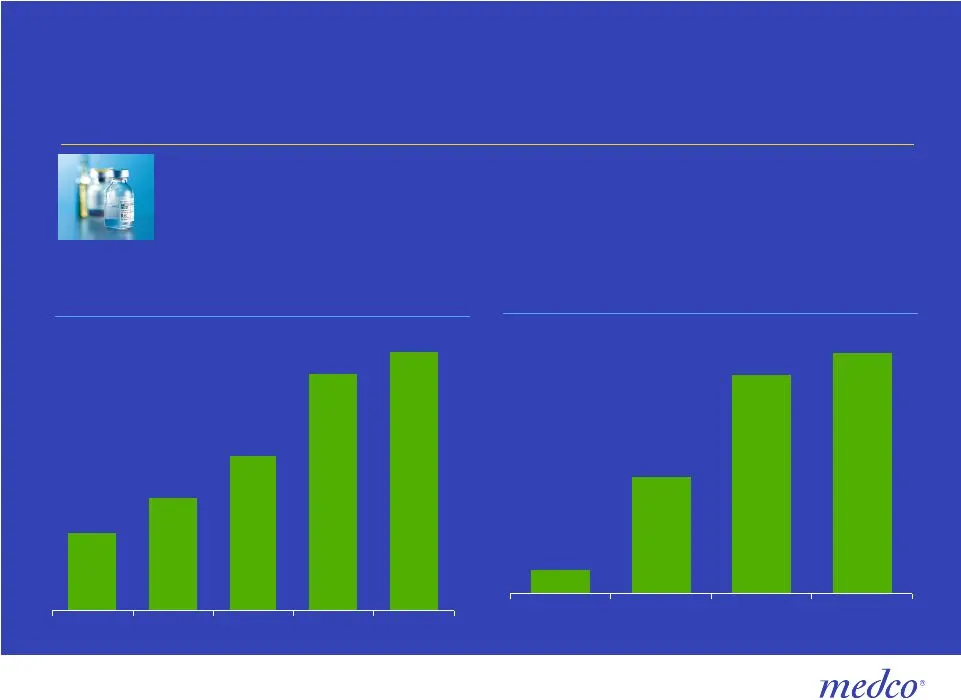
Slide 23: Drivers for growth: Grow specialty pharmacy
Medco drivers for long-term growth and profitability Specialty pharmacy lives (MM) Grow specialty pharmacy 1.8 2.6 3.6 5.5 6.0 2003 2004 2005 2006E 2007E Specialty pharmacy revenue ($B) 4.3 20.6 38.5 42.5 2003 2004 2005 9 mos 2006 ~ ~
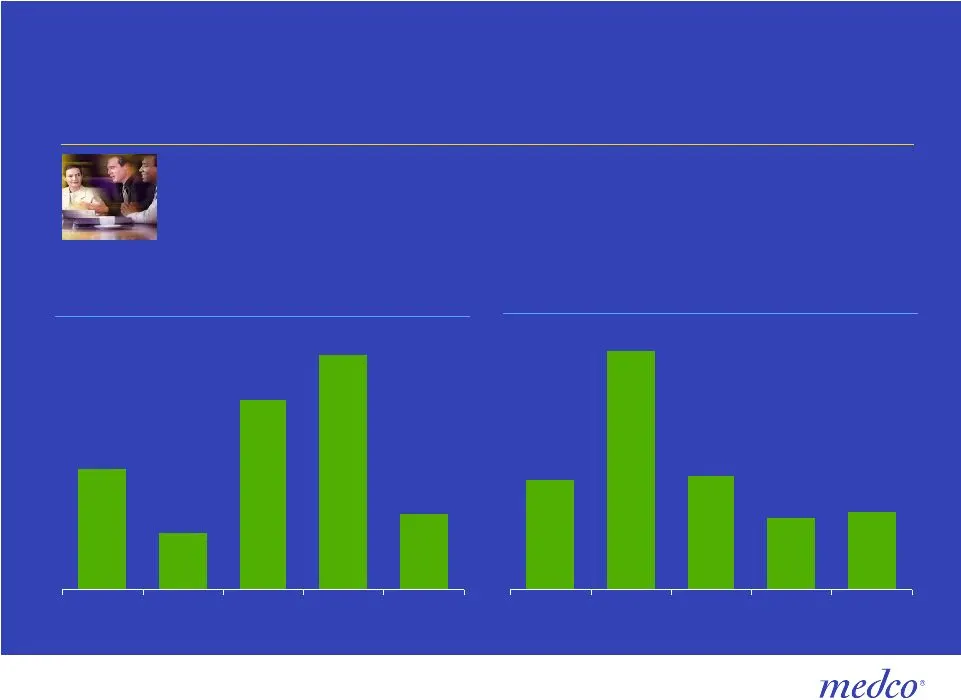
Slide 24: Drivers for growth: Grow net-new sales
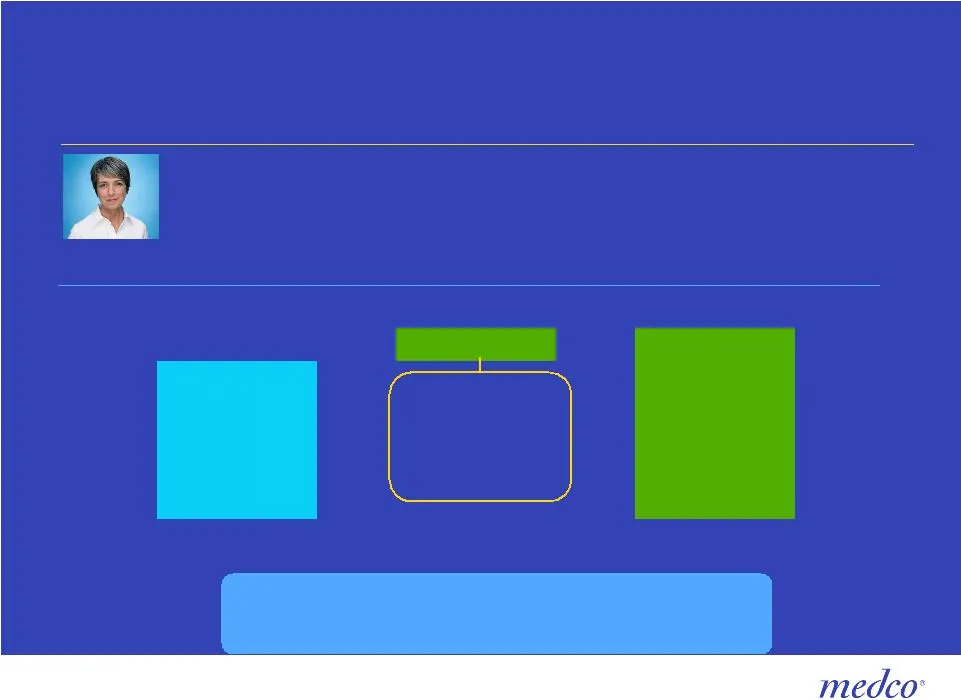
Medco drivers for long-term growth and profitability Renewals ($B) Grow net-new sales New named business ($B) 9.7 21.0 10.0 6.3 6.9 2003 2004 2005 2006E 2007 to date * Includes estimated calendarization, growth & erosion. 1.9 0.9 3.0 3.7 1.2 2003 2004 2005 2006E 2007 to date
Slide 25: Drivers for growth: Grow Medicare Part D
Medco drivers for long-term growth and profitability Employer retiree base revenues Medicare revenues Total Medicare- eligible revenues $2.6 B $12.4 B $15.0 B Medco co-logo partner enrollees 900,000+ to date Medco PDP 100,000 members Medicare 2007 revenues Grow Medicare Part D $0.20–$0.26 per share

Slide 26

Slide 27
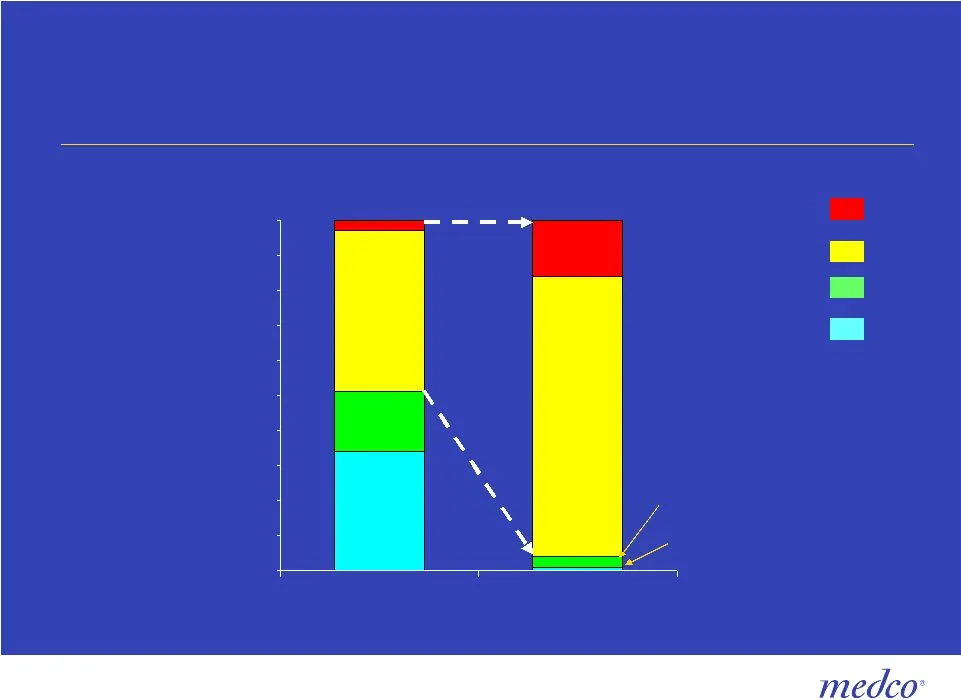
Slide 28: Engage those who spend the money
Engage those who spend the money 0% 10% 20% 30% 40% 50% 60% 70% 80% 90% 100% % Members % Rx Cost 3% 1% 3% Complex Chronic Acute Well 46% 17% 34% 16% 80%
Slide 29: Chronic and complex patients are the high cost groups
Chronic and complex patients are the high cost groups 10% 19% % Medical Cost $1,263 $1,212 Plan Medical Cost/Eligible 17% 34% % Book of Business $47 $6 Member Rx Copay/Eligible $103 $13 Plan Rx Cost/Eligible 3% 1% % Rx Cost 11% 60% $8,466 $2,819 3% 46% $691 $317 $3,980 $1,046 16% 80% Complex Chronic
Slide 30: A plan is only good if members follow it
A plan is only good if members follow it -- Our solution goes beyond plan design. medco
Slide 31: Effective member engagement model
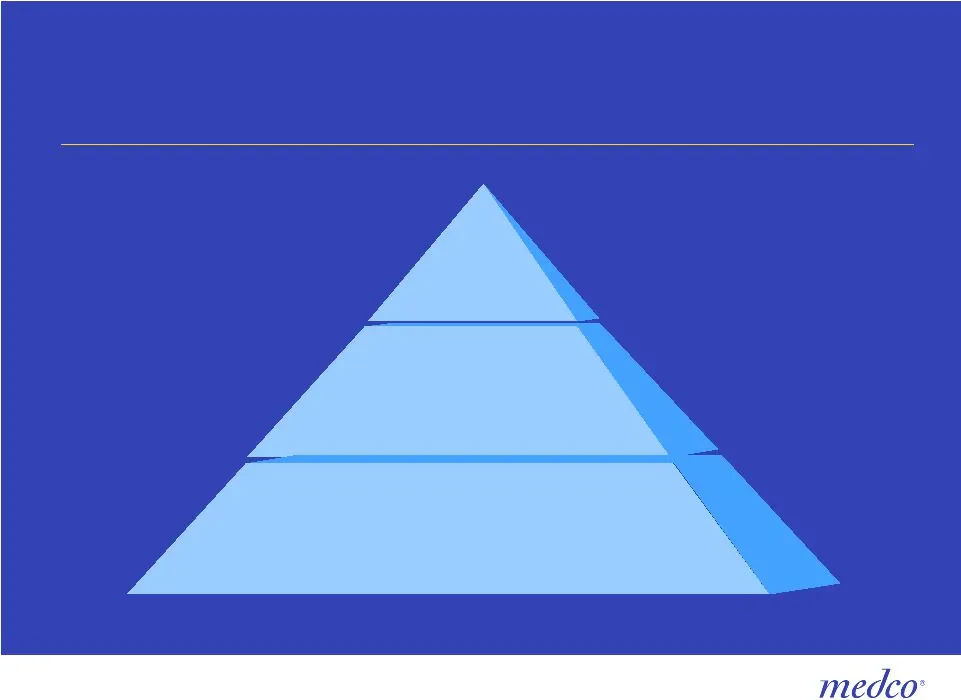
Effective member engagement model Teachable Moments Teachable Teachable Moments Moments Trusted Trusted Advisor Advisor Incentives Incentives
Slide 32: Our pharmacists have the teachable moments and trusted advisor role
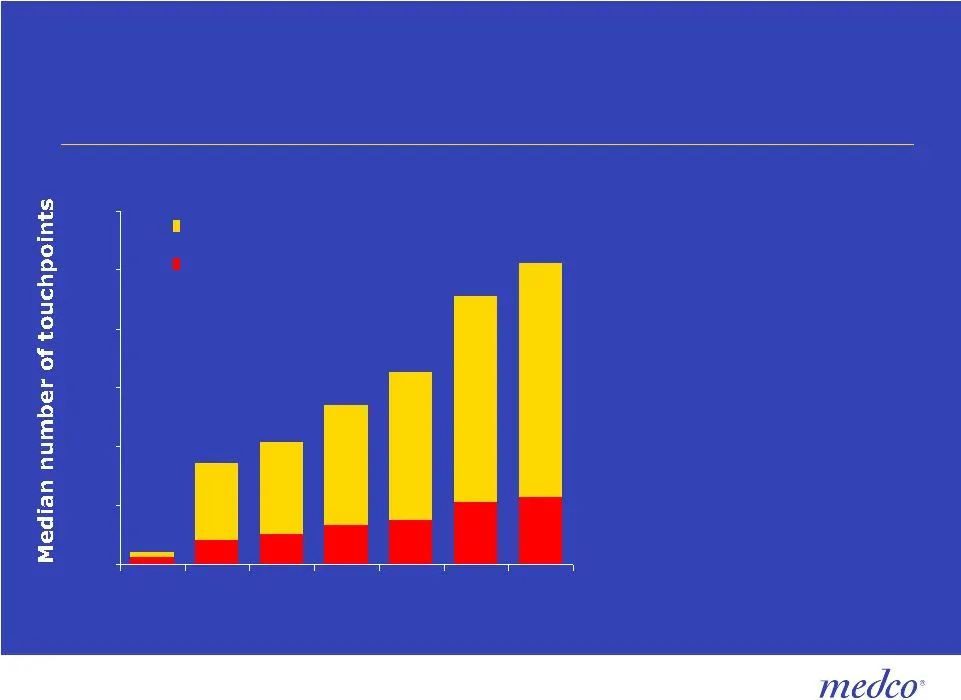
Our pharmacists have the teachable moments and trusted advisor role 0 20 40 60 80 100 120 All Top 15% Top 10% Top 5% Top 3% Top 1% Top 0.5% Pharmacist Doctor Risk Severity Source: Medco data Source: Gallup Pharmacists #1 for honesty and ethics for 9 straight years
Slide 33: Historic approach to pharmacy
Pharmacists Physicians General Pharmacy Site General Pharmacy Site General Pharmacy Site General Pharmacy Site General Pharmacy Site General Pharmacy Site General Pharmacy Site Historic approach Pharmacists Patients Physicians
Slide 34: New state – Therapeutic Resource Centers
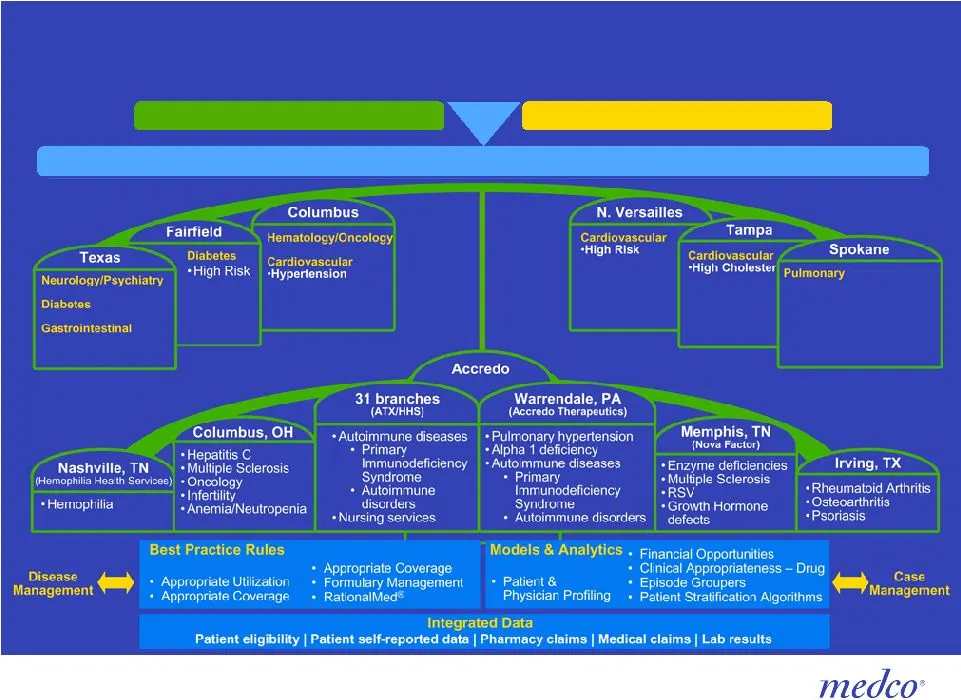
Specially Trained Pharmacists Physicians New state – Therapeutic Resource Centers Healthcare Value Map Specially Trained Pharmacists Patients Physicians
Slide 35: Therapeutic Resource Centers by patient group
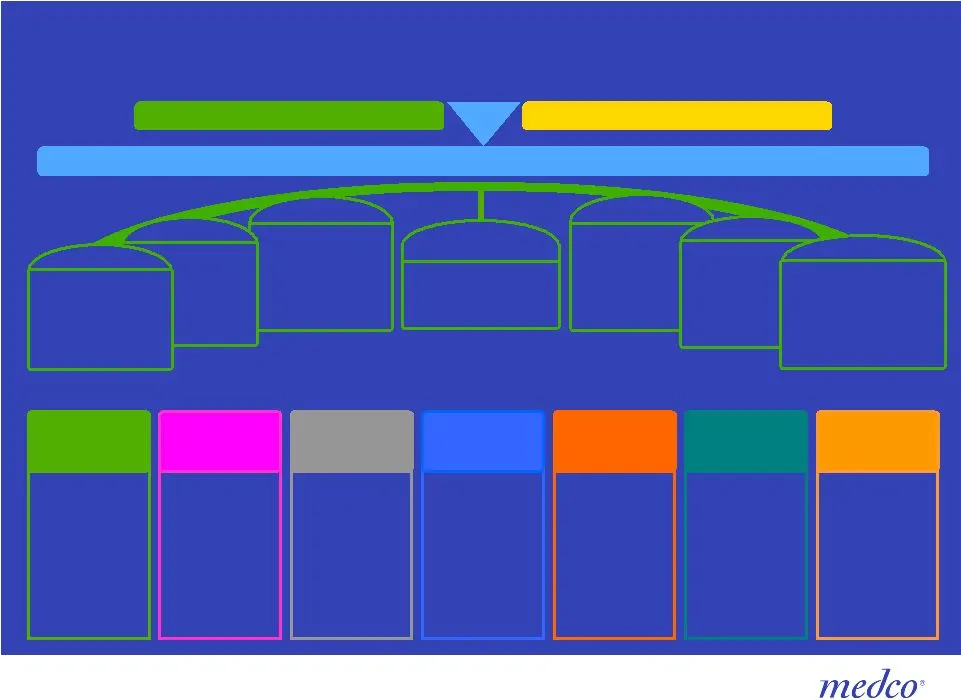
Accredo Columbus • Hypertension N. Versailles Specially Trained Pharmacists Physicians New state – Therapeutic Resource Centers Healthcare Value Map Fairfield • High Risk Texas • High Risk Tampa • High Cholesterol Spokane Rare & Specialty 0.19 MM Patients 42 Sites Hematology Oncology 0.6 MM Patients
Slide 36: Creating value from Therapeutic Resource Centers
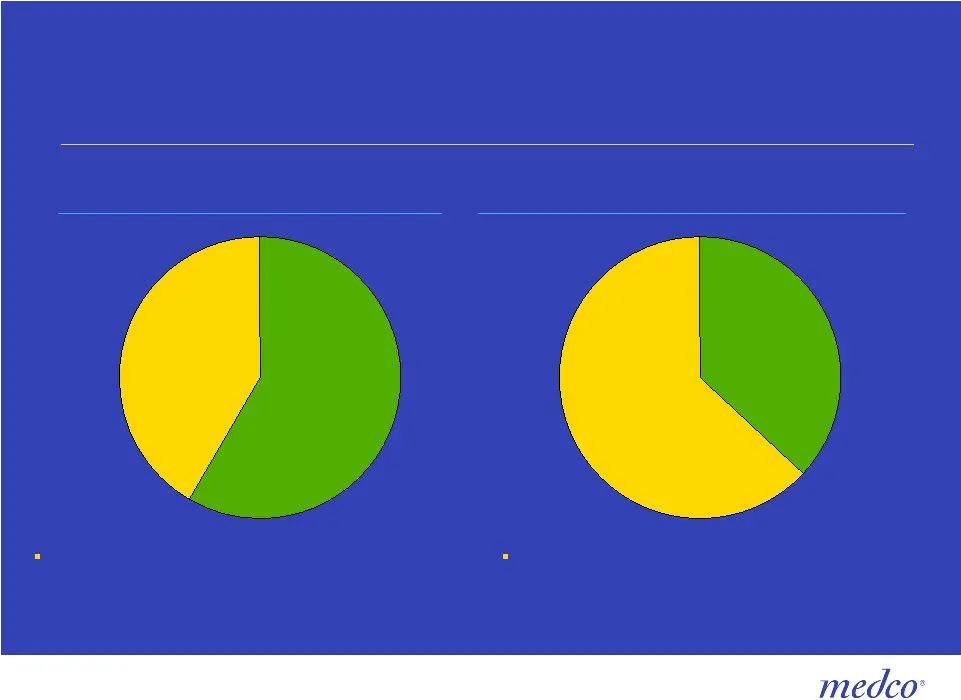
Creating value from Therapeutic Resource Centers Remaining Retail Pharmacy Conversion Opportunity Current Mail Penetration Remaining Pharmacy Opportunity Chronic medication Rx’s* Specialty channel Current Penetration For each 1% increase in mail penetration or generic dispensing rates, Medco can ear
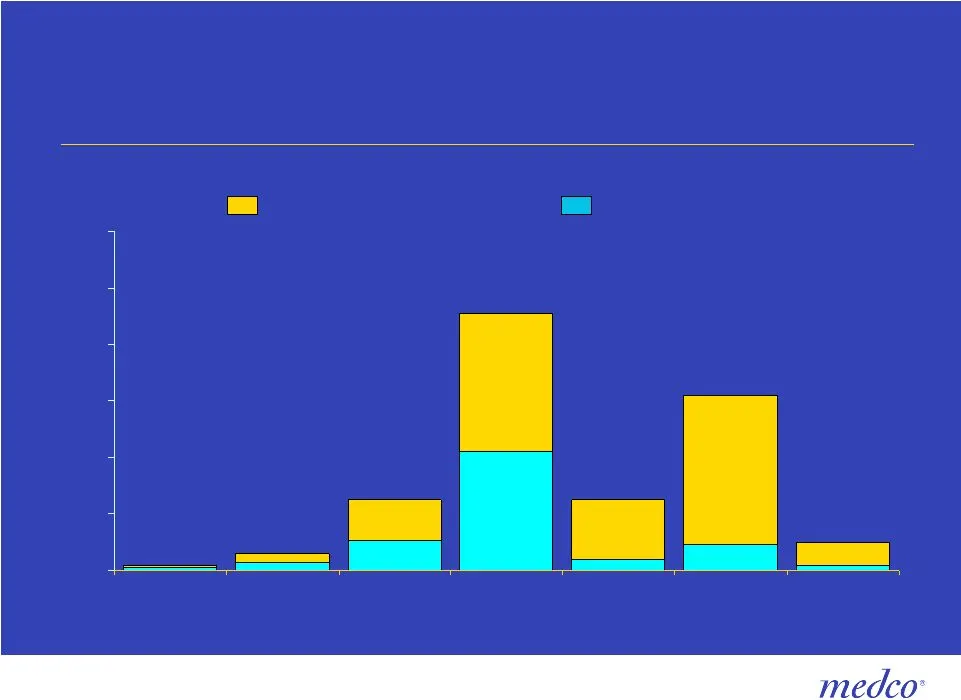
Slide 37: Each center will drive drug mix, channel optimization and safety
Each center will drive for drug mix, channel optimization, AND safety 0 2 4 6 8 10 12 Rare & Specialty Hematology Oncology Diabetes Cardiovascular Pulmonary Neurology Psychiatry Gastrointestinal Retail patients Mail patients 0.19MM 0.6MM 2.5MM 9.1MM 2.5MM 6.2MM 1.0MM
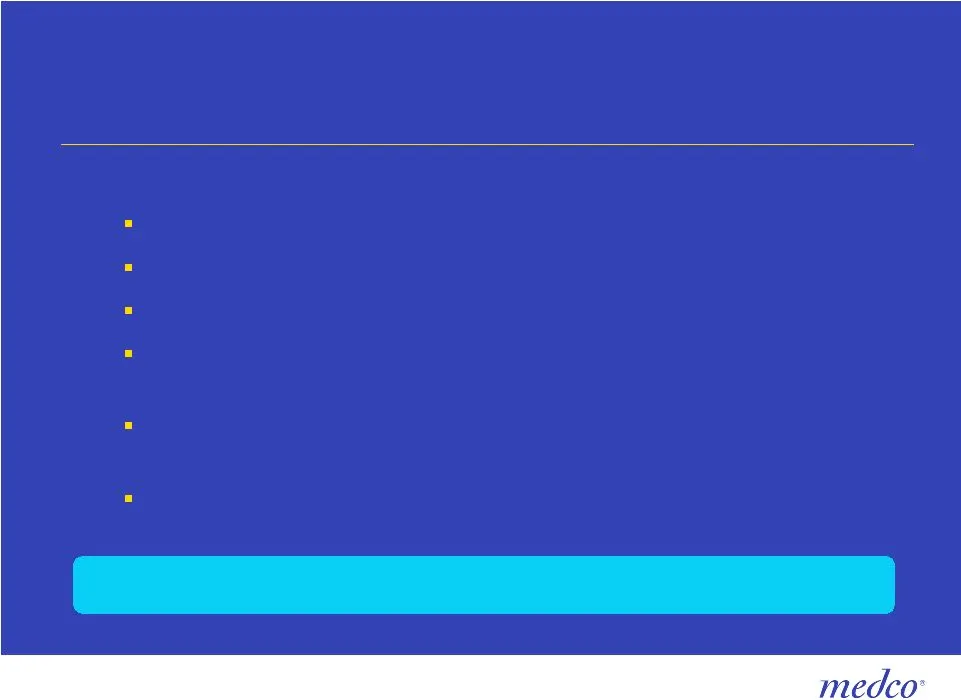
Slide 38: Therapeutic Resource Centers: A sustainable brandable difference
Therapeutic Resource Centers: A sustainable brandable difference Requires significant volume by practice area Requires distinct front end and back end pharmacy operations Requires single IT platform, using real time data Requires ability to price and display hundreds of millions of therapeutic optio
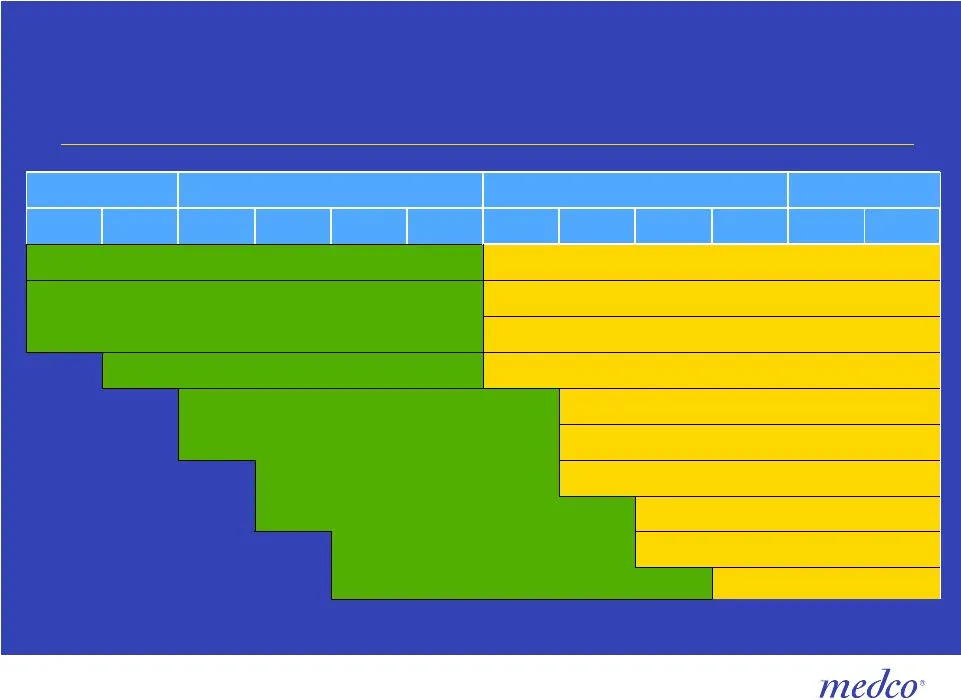
Slide 39: Specialized pharmacies launching and fully implemented in 2007
The specialized pharmacies are launching and will be fully implemented in 2007 Business Planning & Development Specialist Training Curriculum Integrated Contact Mgmt Medco Analytic Engine Stratification Rx Order Routing Implementation HEM-ONC 19% –OH PULMONARY 11% – WA CV-HIGH RISK 15% – PA CV-HYPER
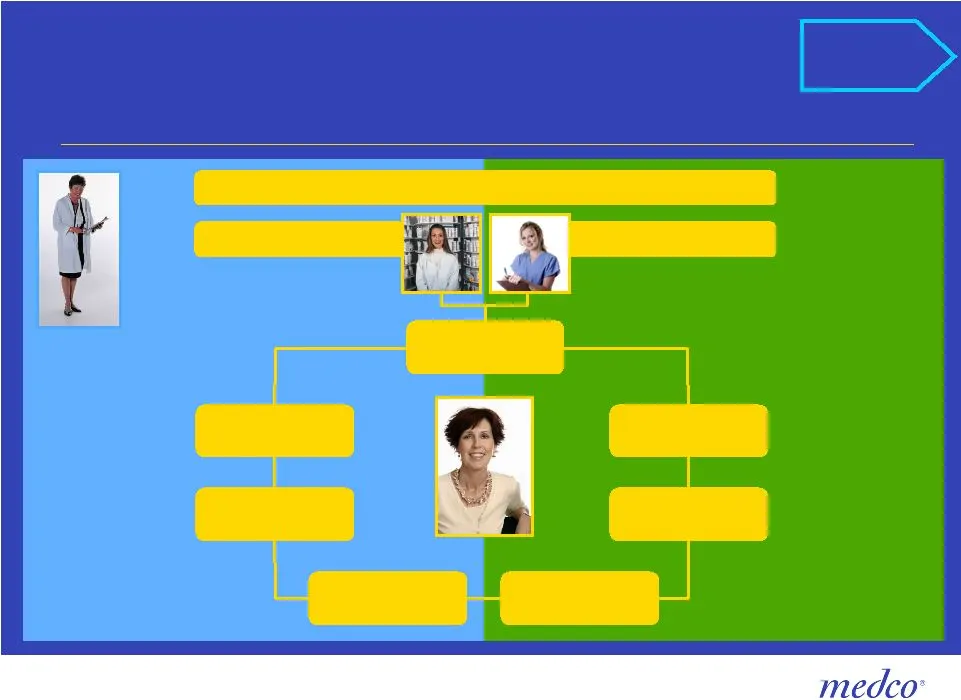
Slide 40: Optimal Health and the Healthways alliance
Optimal Health ® & the Healthways alliance Physician Patient Specialist Pharmacist At The Center Health Coach Through Optimal Health Maintain Wellness Manage Conditions High Risk Care Support Safety Plan Policies Savings Enrollment Medco Member Engagement Program Pharmacy Health $40B $40B $160B $160
Slide 41: Today's chasing model without enrollment
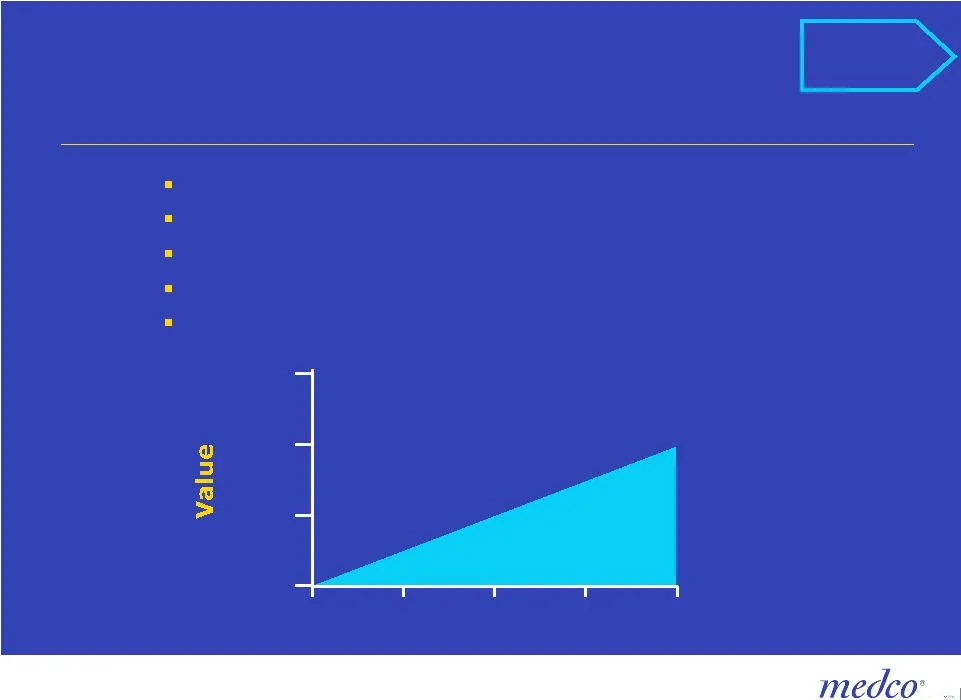
Today’s chasing model without enrollment 0 1 2 3 4 Members sent general information Member fills script PBMs react to script with “Chasing Programs” Pharmacists contact physicians on company’s behalf Lower member engagement. Lower savings. Time (Years) 100% 66% 33% 0% My Rx Choices
Slide 42: My Rx Choices will generate faster, greater savings
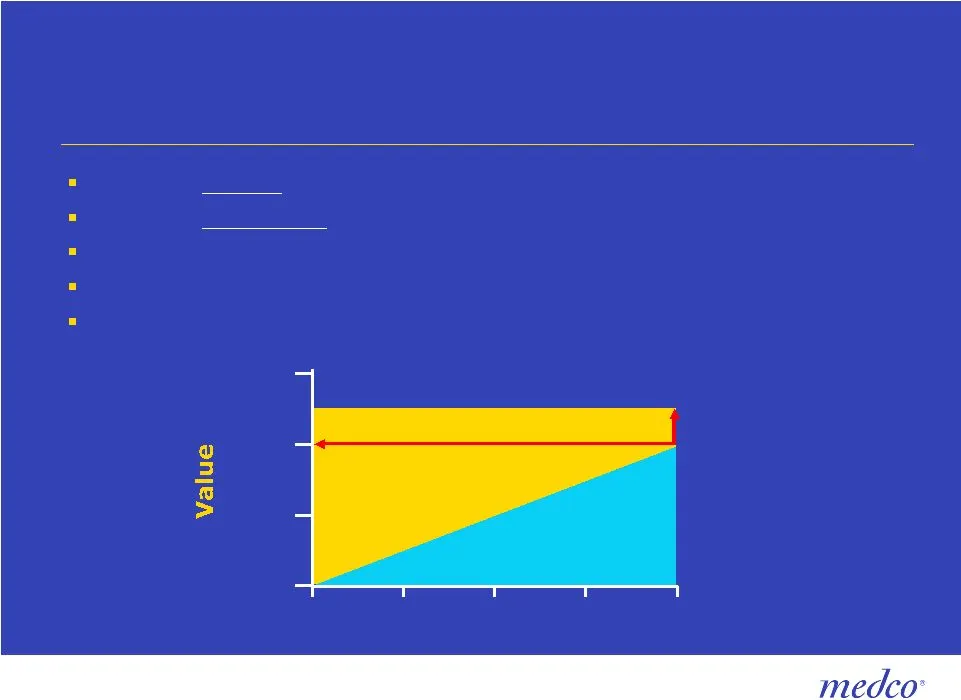
My Rx Choices will generate faster, greater savings Member enrolls into choices via My Rx Choices Member authorizes Medco to change prescriptions Specialist pharmacists engage physicians on member’s behalf Specialist pharmacists identifies “at risk” patients for Optimal Health Faster savings. Increa
Slide 43: My Rx Choices simplifies decision making
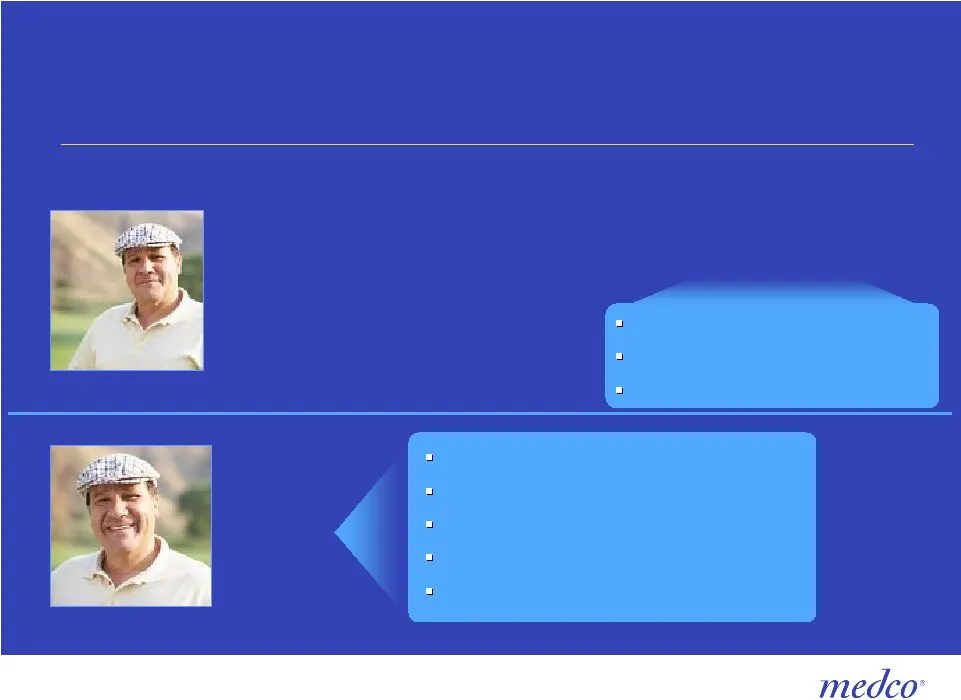
My Rx Choices simplifies decision making Options Maintenance Drugs Alternative Per Drug Channels The Member’s Best Choice = x x = = All options pre-evaluated All drugs price compared Lowest cost options displayed Choose with single click Physician assistance Unaware of choices Minimal cost informati
Slide 44: My Rx Choices has launched
My Rx Choices has launched Launched October 2006 Available for 5MM lives Encouraging results: 16-23% conversion Rollout April, 2007 High client and prospect interest Targeting 11MM lives Beta Test Book of Business Rollout
Slide 45: Creating value through My Rx Choices
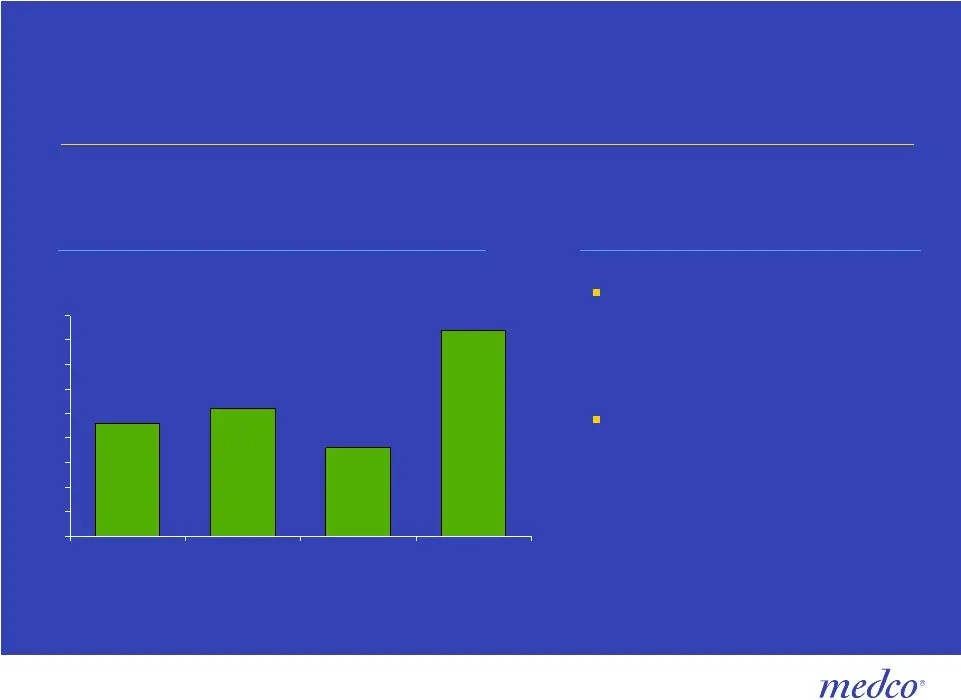
Creating value through My Rx Choices 0 0.5 1 1.5 2 2.5 3 3.5 4 4.5 National Key Health Plans Systemed Opportunity to enroll 10.9MM lives into My Rx Choices in 2007 Margin of $15MM through improved generic dispensing and mail penetration rates and our clients save multiples of that Potential Enrollee

Slide 46: Optimizing member engagement: what does this mean for the future?
Optimizing member engagement What does this mean for the future? Greater client drug savings Greater client medical savings Greater member savings Improved clinical outcomes for members Medco margin expansion

Slide 47: Growing Today, Innovating for a Greater Tomorrow
Growing Today Innovating for a Greater Tomorrow Growing Today, Innovating for a Greater Tomorrow Growing the Bottom Line Growing Specialty Pharmacy Growing in the Marketplace Optimizing Prescriptions

Slide 48: Growing the Bottom Line
Growing the Bottom Line Analyst Day - November 30, 2006 Medco is a registered trademark of Medco Health Solutions, Inc. JoAnn Reed Senior Vice President, Finance & Chief Financial Officer
Slide 49: Growing the bottom line
Growing the bottom line 1 Industry issues 2 3 2007 Guidance 4 Opportunity for growth in 2007 Third-quarter 2006 financial performance

Slide 50: Impact from Wal-Mart generic program
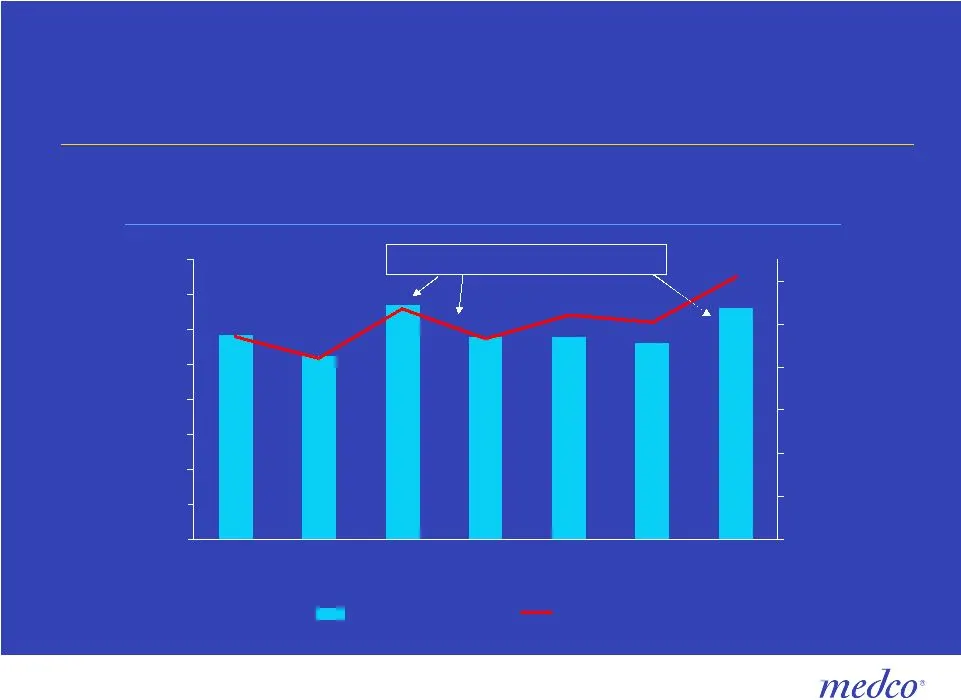
Of the 143 drugs available under the Wal-Mart program, Medco dispensed more than 8,000 mail prescriptions to the Tampa area over the last 14 weeks Represents approximately 7% of the drug spend in Tampa Medco’s mail share and generic dispensing rates for these drugs in the Tampa Bay area over the las
Slide 51: Mail penetration in Tampa area increases
Mail penetration in Tampa area increases 0 200 400 600 800 1,000 1,200 1,400 1,600 8/25 9/8 9/22 10/6 10/20 11/3 11/17 10% 12% 14% 16% 18% 20% 22% MHS mail Rxs Mail penetration Tampa – mail volume Wal-Mart announcements

Slide 52: Wal-Mart sampling analysis
Wal-Mart sampling analysis If a Medco-by-Mail member, who takes one or more of the products on the limited Wal-Mart list, chooses to move all prescriptions to Wal-Mart, the average cost would increase $290 per patient per year based on current utilization With 331 GCN’s*, the Wal-Mart list comprises
Slide 53: Average wholesale price (AWP)
Average wholesale price (AWP) What this means to Medco Should this settle, bottom line impact will be immaterial To date, Medco has 93% of its drug spend covered by the contractual provision that holds both parties neutral to methodology or pricing benchmark changes By the time of potential implemen
Slide 54: Average manufacturer price (AMP)
Average manufacturer price (AMP) Currently AMP is not a publicly available price file Used for government contracting only (i.e., Medicaid business) AMP is simply another benchmark price; it is not the acquisition cost If AMP becomes a new standard, Medco’s contractual provision would hold parties n
Slide 55: Solid third-quarter financial results
Solid third-quarter financial results + 29.2% + 24.6% $0.48 $0.57 $0.62 $0.71 GAAP diluted EPS Diluted EPS adj. for intangibles (2005 pro forma to include stock option expense) + 4.5 pts 51.5% 56.0% Generic dispensing rate + 28.2% $463.1MM 5.0 % $593.5MM 5.7% Gross margin % of net revenues + 30.4% $
Slide 56: Generic dispensing rates continue on an upward trend
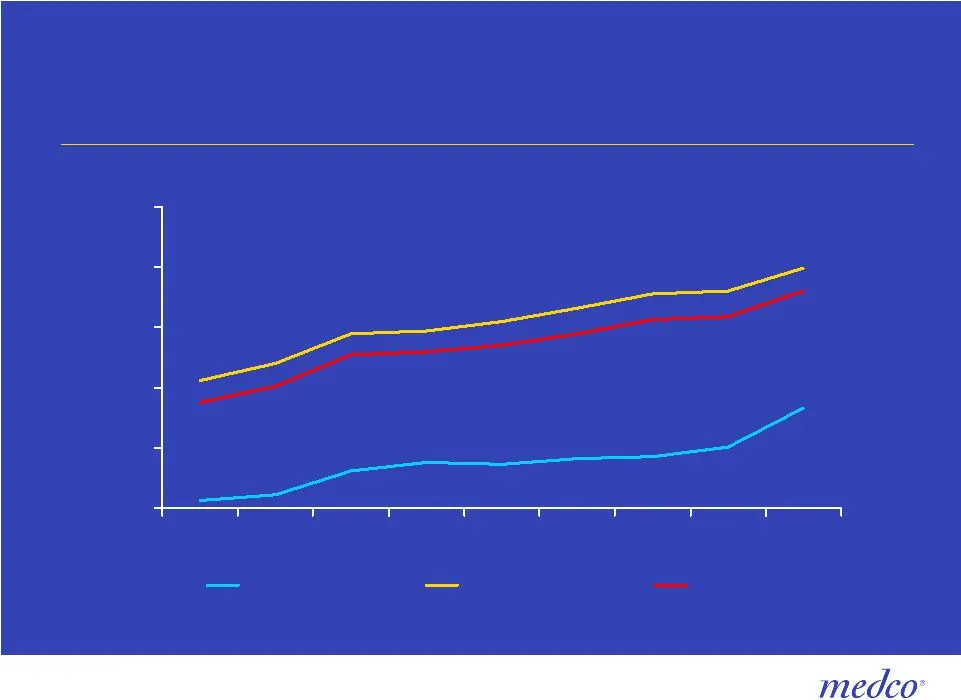
Generic dispensing rates (% Rxs) continue on an upward trend 38% 43% 48% 53% 58% 63% 3Q04 4Q04 1Q05 2Q05 3Q05 4Q05 1Q06 2Q06 3Q06 Mail Retail Total
Slide 57: Capitalization
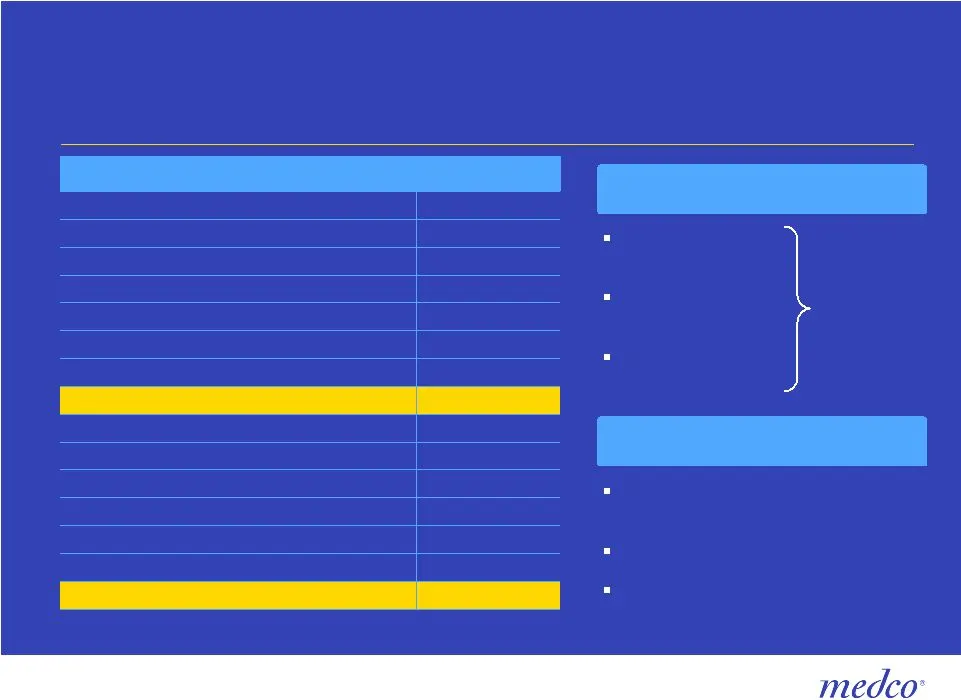
Capitalization S&P: BBB (stable outlook) Moody’s: Baa3 (positive outlook) Fitch: BBB+ (stable outlook) 2,460 Accounts receivable, net 1,617 Inventories, net 525 Current debt 5,117 Goodwill, net 2,578 Intangibles, net 752 Other assets 627 Property and equipment, net $519 Cash and investments 7,549 Eq
Slide 58: Cash flow generation
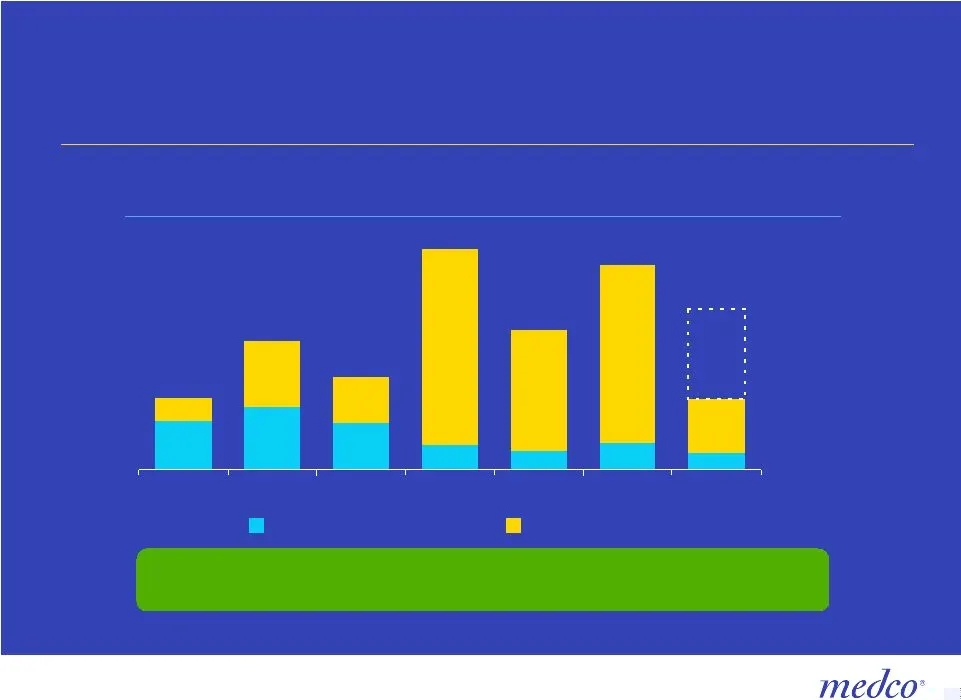
2000 2001 2002 2003 2004 2005 9 mos 2006 Cash flow generation Cash flow from operations ($MM) $366 $659 $470 $1,124 $712 Capital expenditures Free cash flow 1 1 $1,041 $822* Note: Free cash flow = cash from operations – capital expenditures 1 Pro forma presentation assuming SFAS 142 was in effect fo
Slide 59: Medco opportunity for growth: progress and expectations for 2007
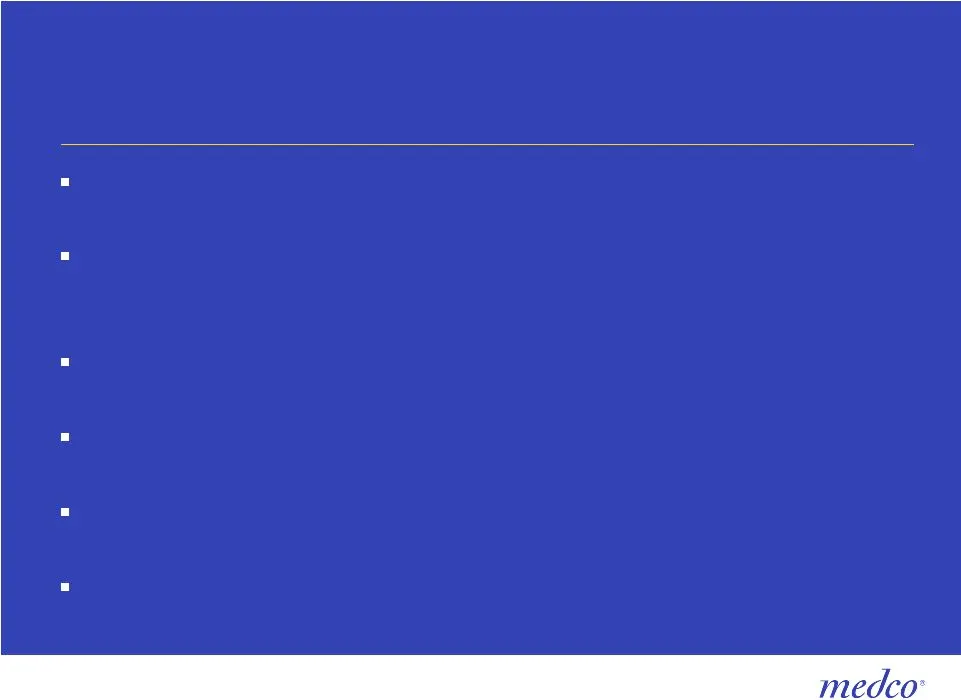
Medco opportunity for growth Progress and expectations for 2007 Sales growth – Addition of $1.2B in new 2007 business, to-date Generics growth – Nearly $7.1B in drugs coming off patent in 2007 – Incremental contribution of $0.06–$0.08 per share Mail impact – 5.6% increase in 2007 to approximately 95
Slide 60: Net positive sales in 2006
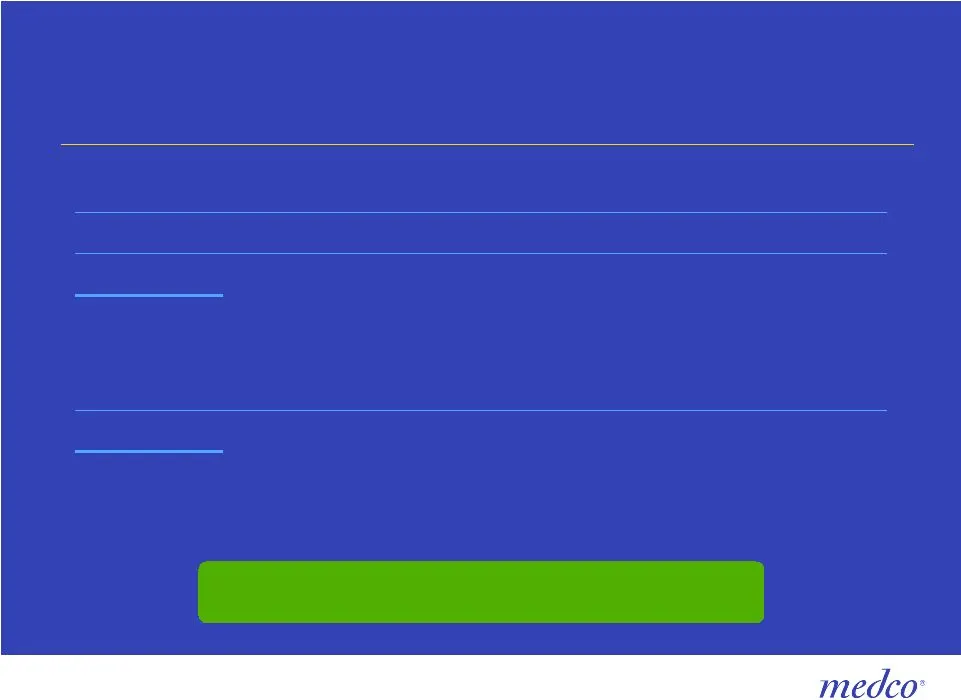
Medco: Net positive sales in 2006 Erosion & calendarization ($0.8 B) Lost sales ($1.0 B) Calendarization $0.8 B Growth in existing clients $2.1 B New sales (Commercial, ASO, Medicare PDP) $2.2 B $3.3B net new, to date ($1.8 B) $5.1 B $3.3B net new, to date
Slide 61: Net positive sales in 2007 to date
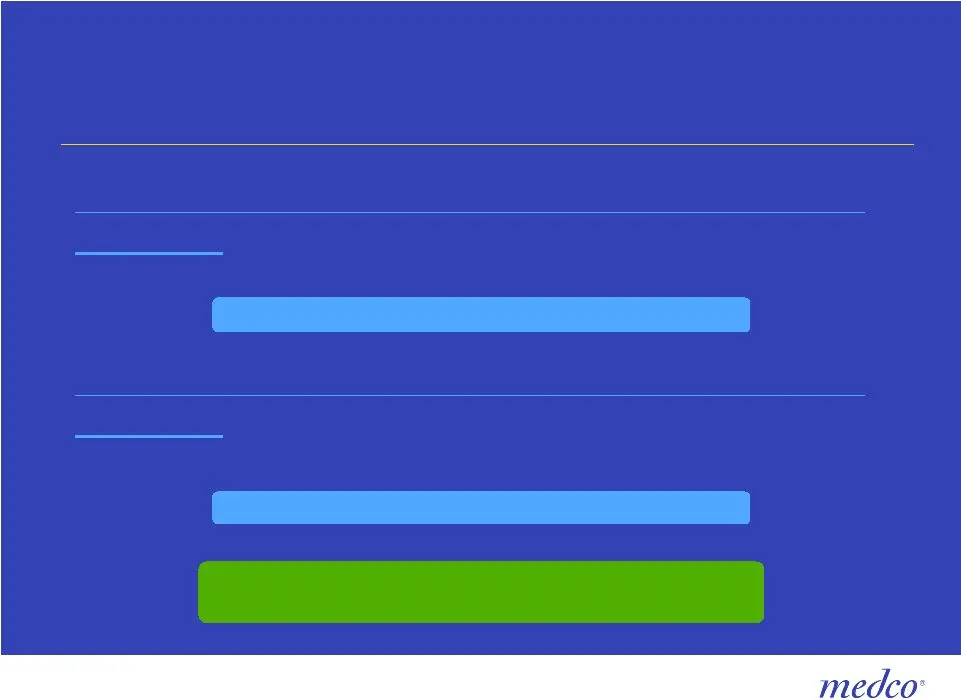
$0.4B net new, to date Medco: Net positive sales in 2007 to date Erosion & calendarization ($0.6 B) Lost sales ($1.2 B) Growth & calendarization $1.0 B New sales (Commercial & ASO only) $1.2 B New sales mail penetration rate of 40% Lost sales mail penetration rate of 20% $0.4B net new, to date ($1.8
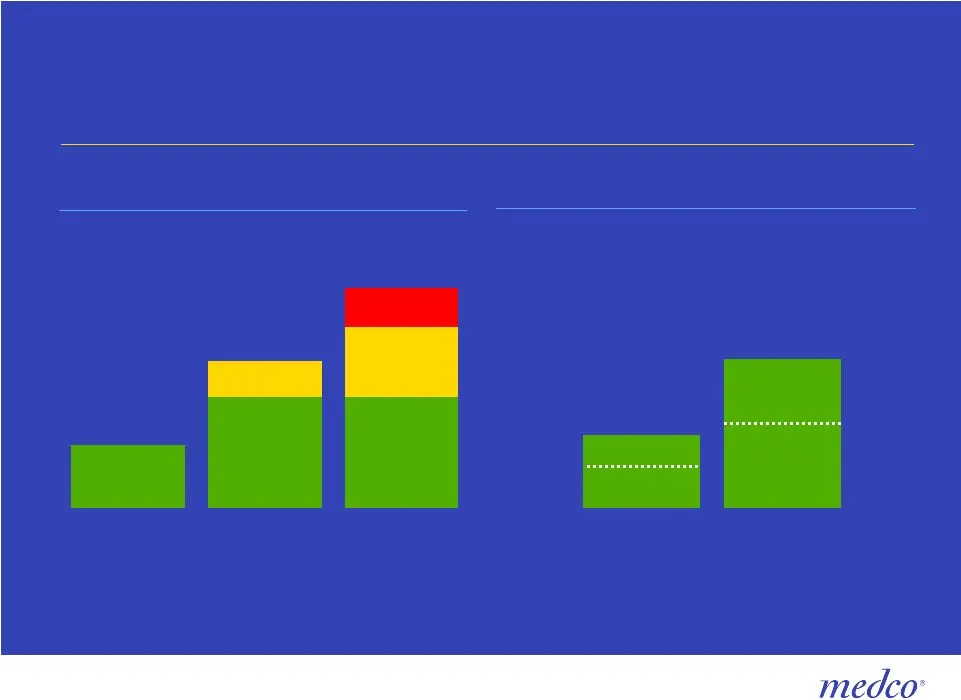
Slide 62: Fiscal year impact of 2006 generic introductions
Fiscal year impact of 2006 generic introductions * Includes Plavix, $2.7B annual US spend. † Excludes Plavix Source: U.S. Drug spend estimates are based on IMS Health data for 2005, compounded amounts prorated for mid-term expirations. Brand drug expirations based on expected patent expiration dates
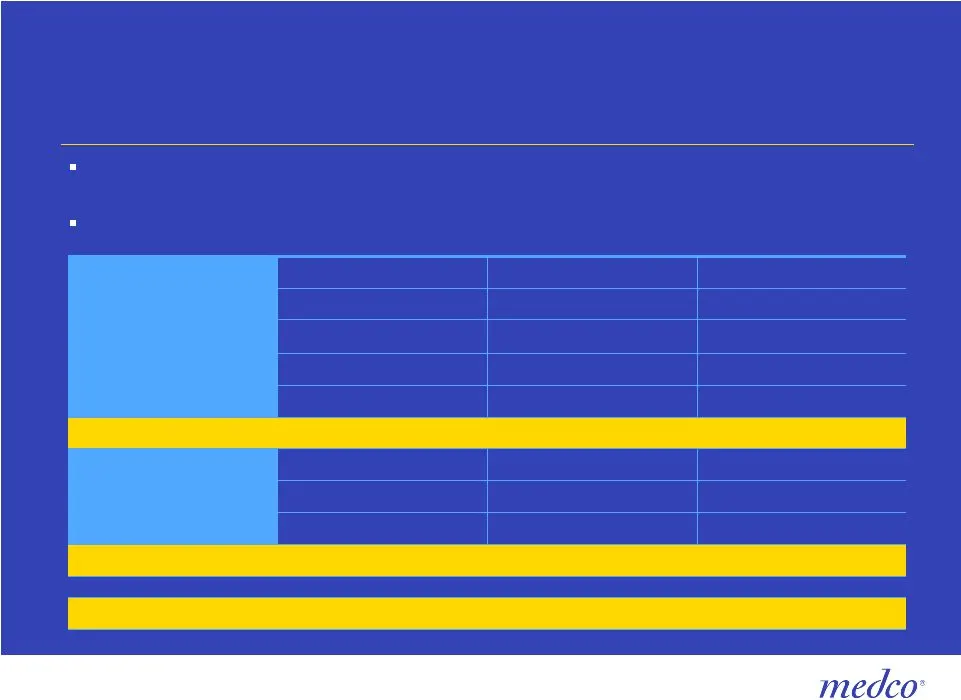
Slide 63: 2007 generic pipeline
2007 generic pipeline 10/07 162 MM Prilosec ® 7/07 365 MM Paxil CR ® Acute 2/07 72 MM Cipro XR ® Chronic 5/07 2,104 MM Ambien ® 10/07 23 MM Precose ® 10/07 912 MM Coreg ® 1/07 1,266 MM Toprol XL ® $2,167 MM 10/07 Norvasc ® Source: Medco and IMS data Of the nearly $7.1B in anticipated brand expiratio
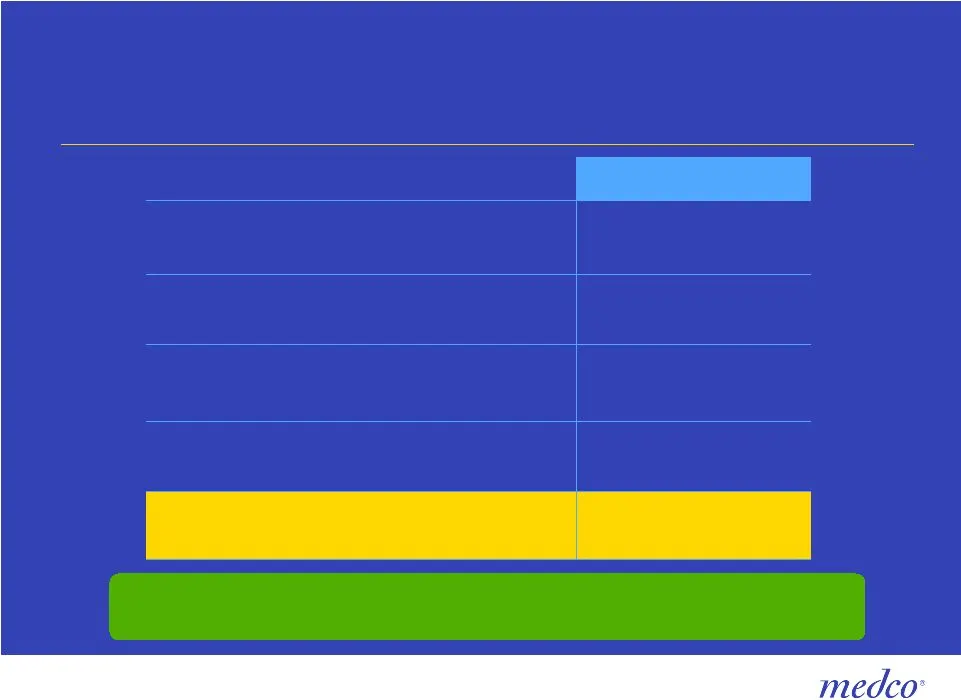
Slide 64: 2007 generic pipeline margin opportunity
2007 generic pipeline $408MM Portion on Medco formulary $2.1B Fiscal year impact $416MM Medco’s average share ~ 20% $4.5B Total annual branded drug spend – chronic 2007 Results in $150–$200MM client savings $30 – $40MM Margin opportunity 2007 Results in $150–$200MM client savings
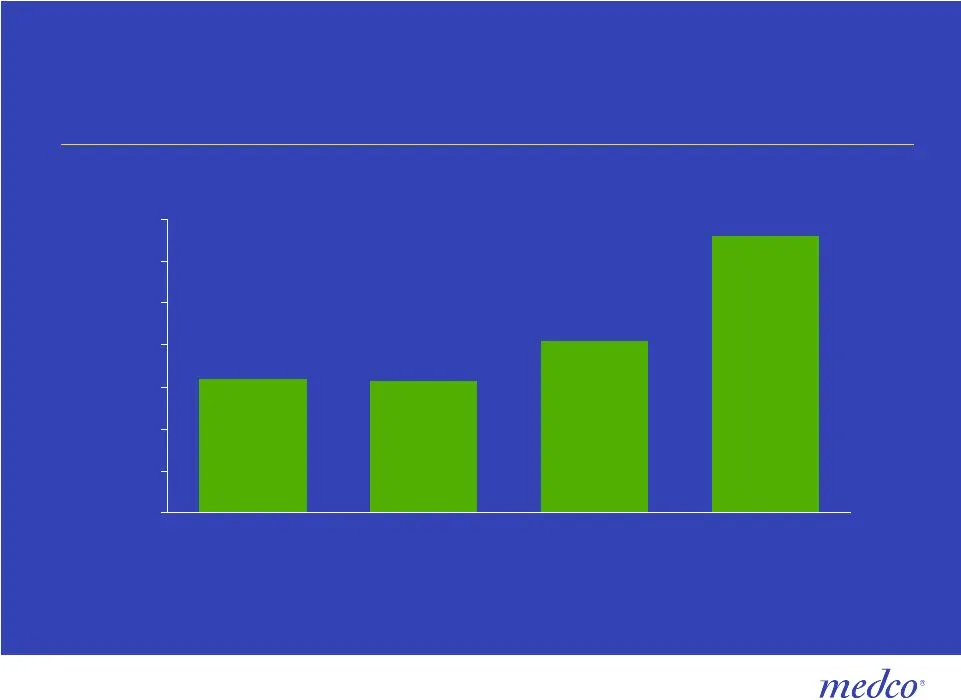
Slide 65: Historical generic discount levels for generic introductions
Historical generic discount levels over last two years for generic introductions 0% 10% 20% 30% 40% 50% 60% 70% Single source Single source authorized generic 3 generics >3 generics
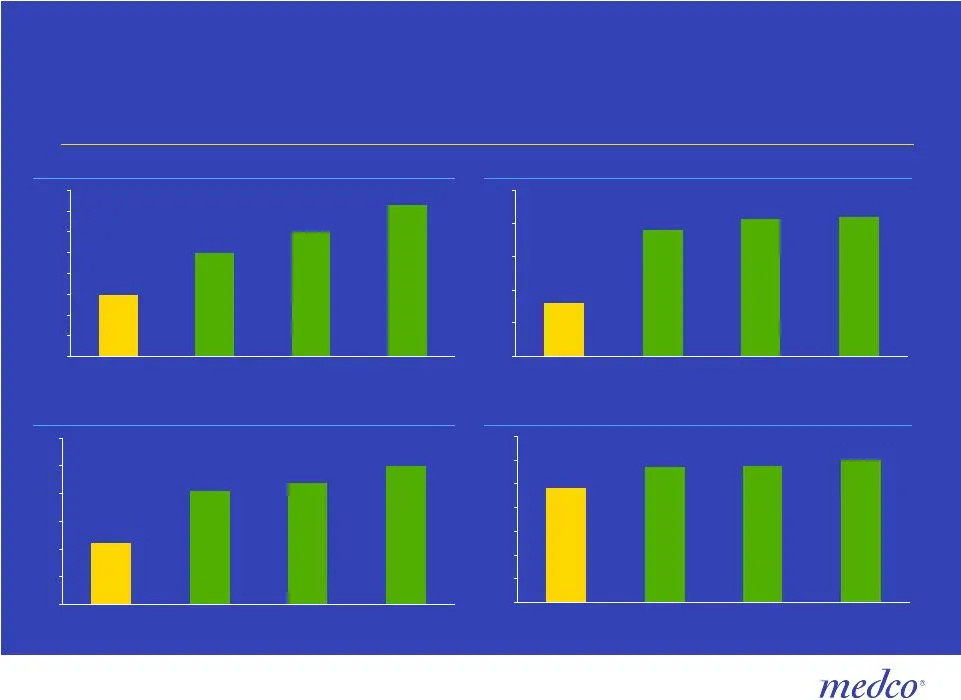
Slide 66: Brand drug pricing comparison
Brand drug pricing comparison $125 $130 $135 $140 $145 $150 $155 $160 $165 CVS.com Walgreens.com Wal-Mart Medco $70 $75 $80 $85 $90 $95 CVS.com Walgreens.com Wal-Mart Medco $65 $70 $75 $80 $85 $90 $95 CVS.com Walgreens.com Wal-Mart Medco $0 $10 $20 $30 $40 $50 $60 $70 CVS.com Walgreens.com Wal-Mart
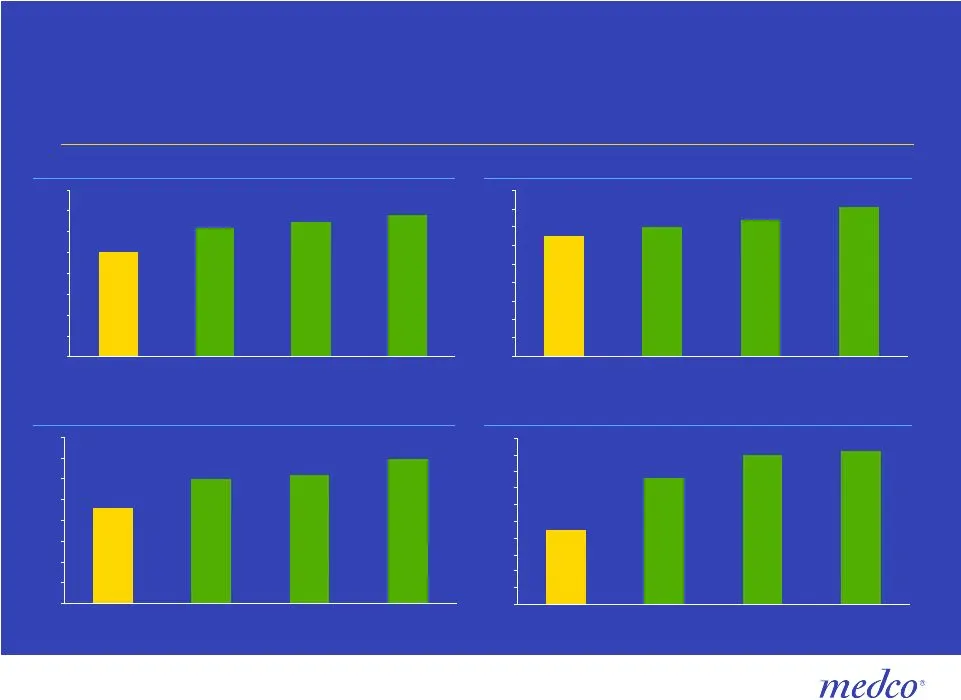
Slide 67: Generic drug pricing comparison
Generic drug pricing comparison $0 $20 $40 $60 $80 $100 $120 $140 $160 CVS.com Walgreens.com Wal-Mart Medco $0 $10 $20 $30 $40 $50 $60 $70 $80 $90 CVS.com Walgreens.com Wal-Mart Medco $0 $10 $20 $30 $40 $50 $60 $70 $80 CVS.com Walgreens.com Wal-Mart Medco $0 $5 $10 $15 $20 $25 $30 $35 $40 $45 $50 CV
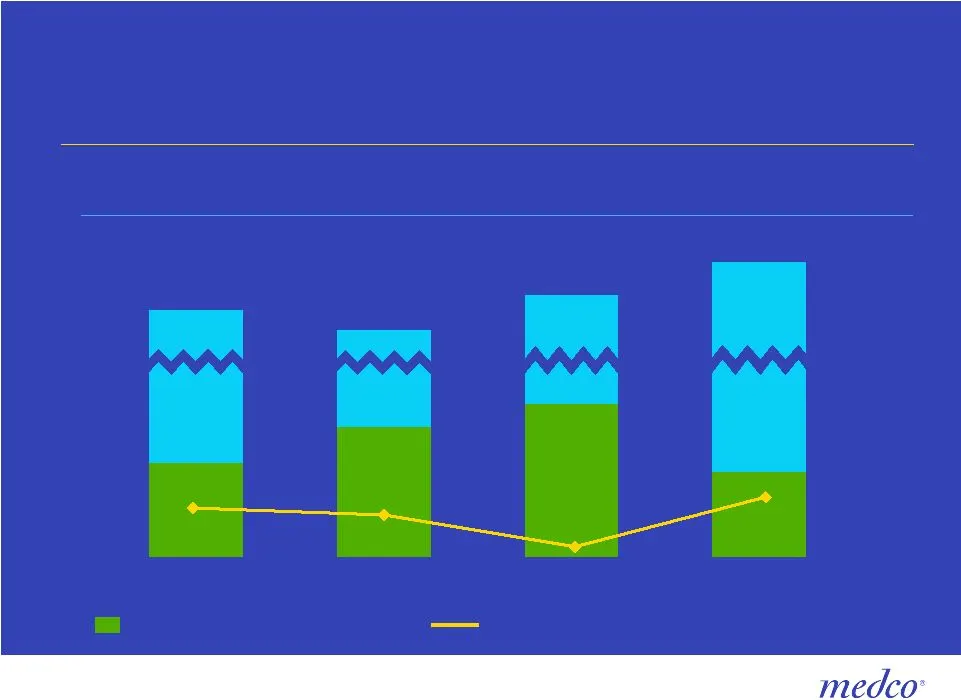
Slide 68: Mail penetration rate for new business
Mail penetration rate for new business Rx volume (in millions) Mail opportunity Annualized new business 2004A 2005A 2006 2007 YTD 35% 32% 18% 40% 88 MM 87 MM ~90 MM 1.9 MM 3.2 MM 3.7 MM ~95 MM 1.2 MM
Slide 69: Medicare Part D continued growth
Medicare Part D Continued growth Incremental retiree net income contribution 2007 assumptions for Medco PDP 34%–36% mail penetration rate 57%–59% generic dispensing rate $0.20–$0.26 per share incremental growth $100–$135MM gross margin $3–$8MM SG&A $60–$75MM net income Lives: PDP 75k – 125k*, Other
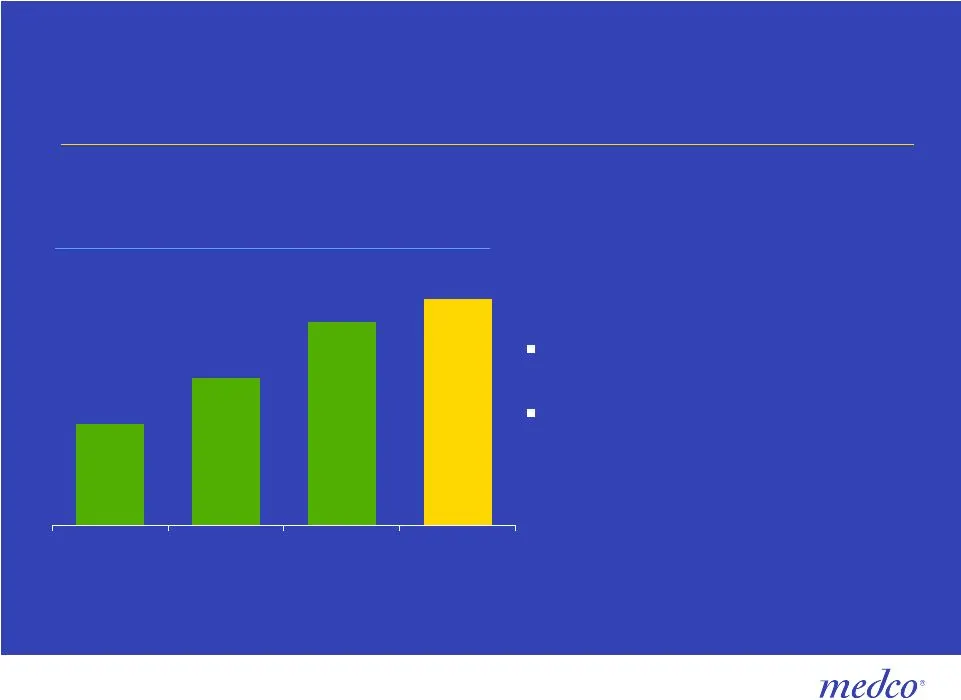
Slide 70: Accredo Health Group 2007 Outlook
Accredo Health Group 2007 Outlook Revenue to reach nearly $6B EPS contribution of $0.23 to $0.26 per share 1.8 2.6 3.6 4.0 2003 2004 2005 9 mos 2006 Specialty pharmacy revenue ($B)
Slide 71: Share guidance
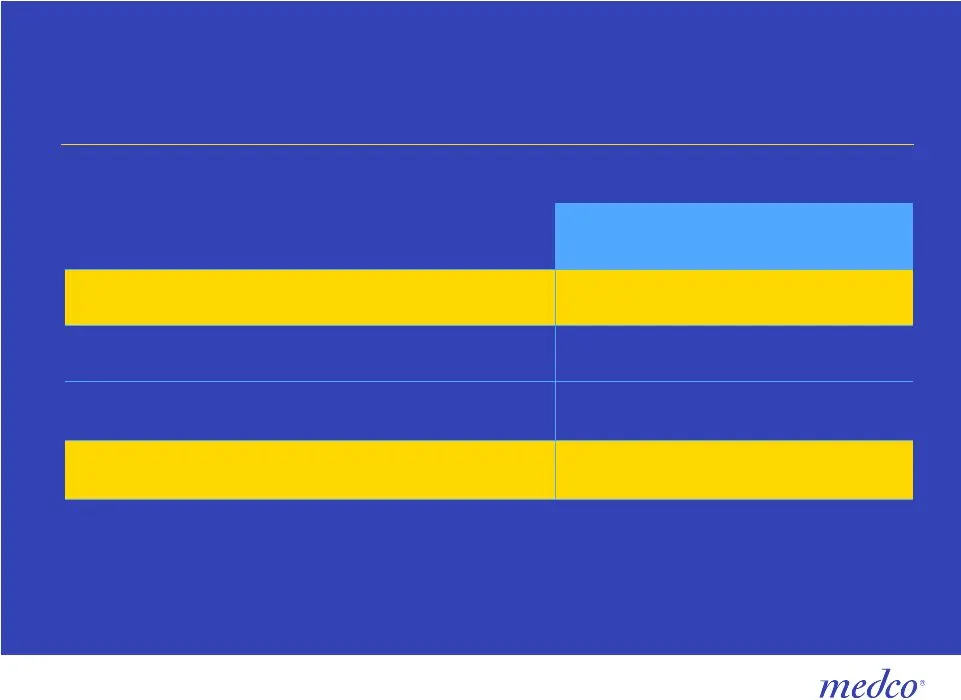
Share guidance 7.5MM 2007 Estimated options dilution (12.5MM) 2007 Estimated share repurchases Weighted average diluted shares 300MM – 305MM 3Q06 Guidance for 2006 295MM – 300MM 2007 Guidance Weighted average diluted shares
Slide 72: Share repurchase program
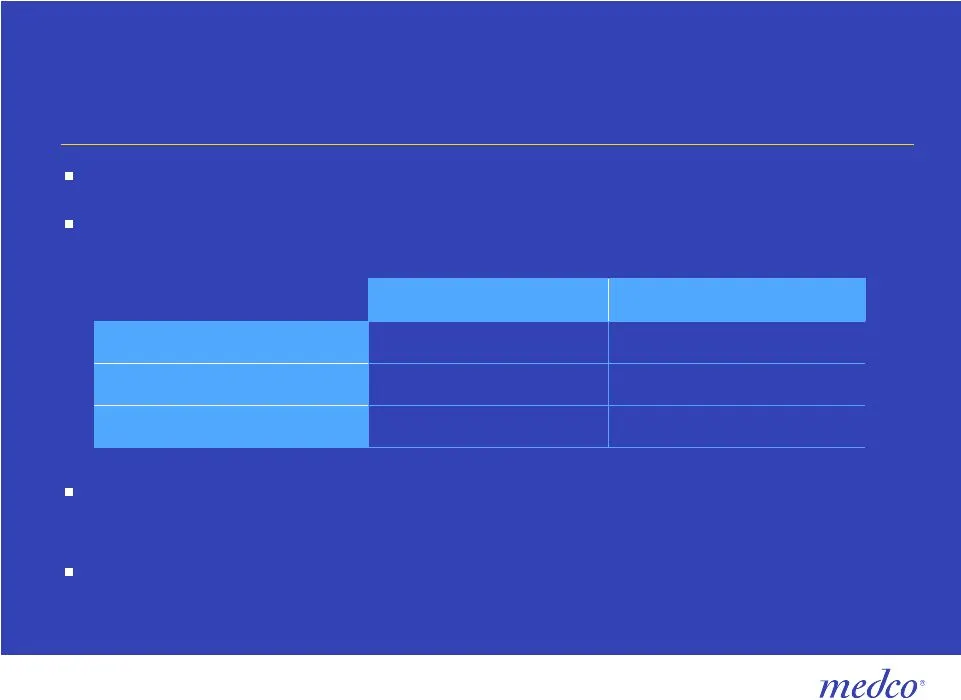
Share repurchase program Board authorized program for up to $2.5B through 2008 Repurchases to date: Utilizing 10b5-1 and discretionary trading in non-blackout periods Periodic review by Board of Directors for trading guidelines and additional repurchase authorizations $272.5MM 5.2MM 4Q06 to date Inc
Slide 73: 2007 guidance
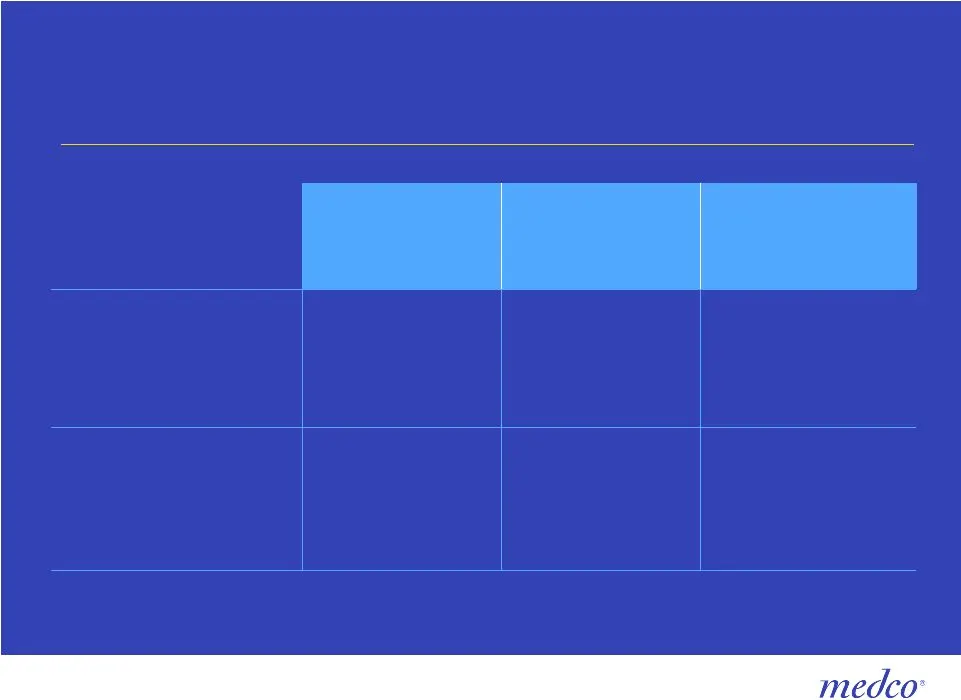
2007 guidance $3.12–$3.19 $2.76–$2.83 2007 guidance 15%–19% $2.69–$2.72 EPS (adj. for intangible amortization) 17%–21% $2.33–$2.36 EPS 2006 guidance* % growth * Excludes legal settlements charge 2007 guidance 2006 guidance* % growth

Slide 74: Growing Today, Innovating for a Greater Tomorrow
Growing Today Innovating for a Greater Tomorrow Growing Today, Innovating for a Greater Tomorrow Growing the Bottom Line Growing Specialty Pharmacy Growing in the Marketplace Optimizing Prescriptions

Slide 75: Growing Specialty Pharmacy
Growing Specialty Pharmacy Analyst Day - November 30, 2006 Medco is a registered trademark of Medco Health Solutions, Inc. Timothy C. Wentworth President & Chief Executive Officer, Accredo Health Group, Inc.
Slide 76: Specialty pharmacy market opportunity
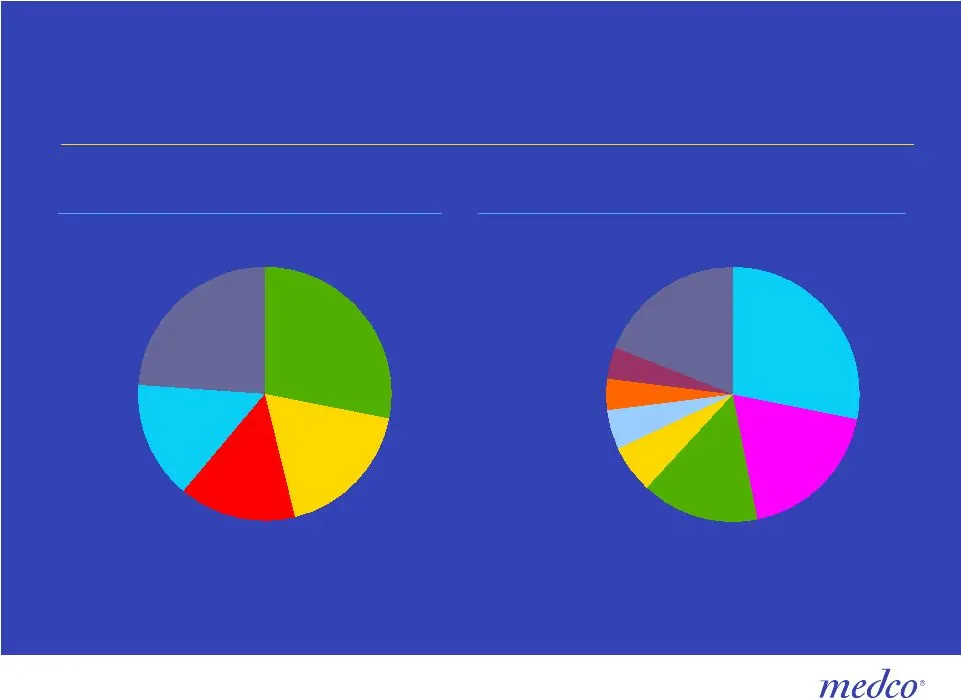
Specialty pharmacy market opportunity Medical Benefit (approx $27-32B)* Cancer Anemia Neutropenia Rheumatoid arthritis All other Pharmacy Benefit (approx $22-27B)* Cancer Multiple sclerosis Growth hormone All other Rheumatoid arthritis Anemia Hepatitis C Deep vein thrombosis/ Anti-coagulation *Sourc
Slide 77: Biotechnology drug pipeline
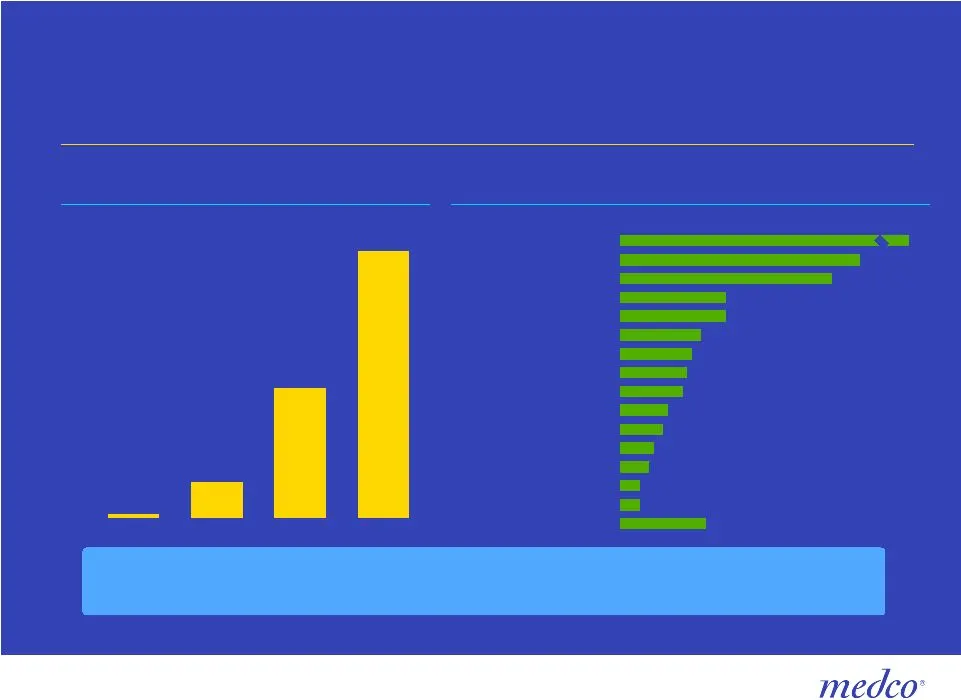
Biotechnology drug pipeline Over 400 drugs in development <1 11 33 82 1995 2000 2006E 2010E Specialty pharmacy drug spend* ($ in billions) CAGR 1995-2010 = 34.1% More than 400 drugs in development pipeline* Source: Medco Estimates *Excludes oncology spend of approximately $20 - $25B *Source: PhRMA 2
Slide 78: Specialty pharmacy growth opportunity
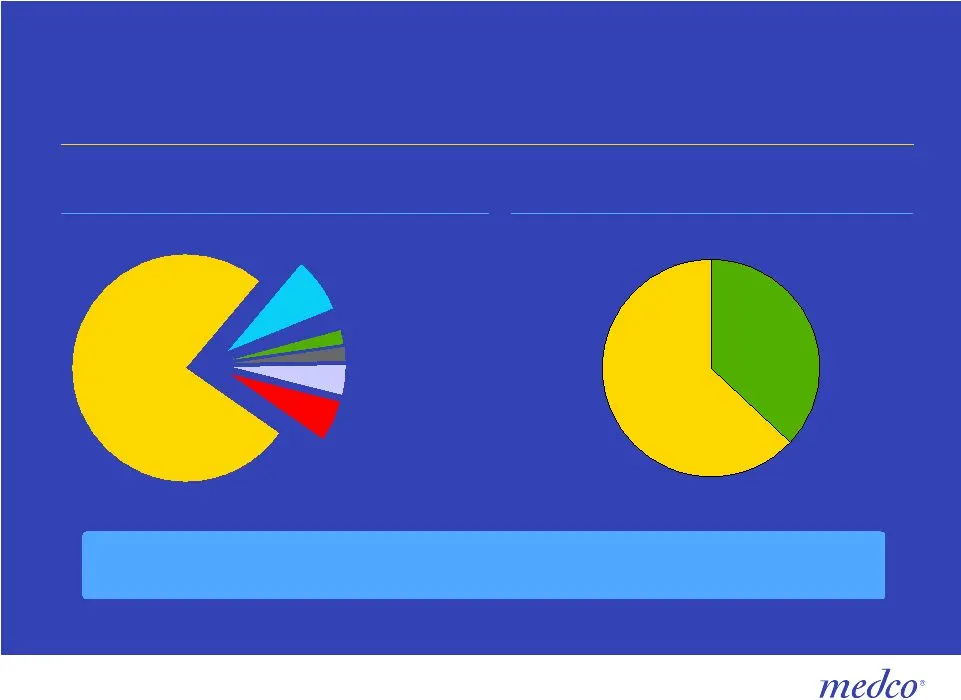
Specialty pharmacy growth opportunity 6% 2% 2% Accredo * Based on 2005 results Sources: AIS Specialty Pharmacy: Stakeholders, Strategies & Markets (October 2006). Company estimates, Wall Street research. Specialty Pharmacy Market Walgreens Caremark CVS/PharmaCare Express/Priority Market Share* Incre

Slide 79: Specialty pharmacy – dynamic landscape
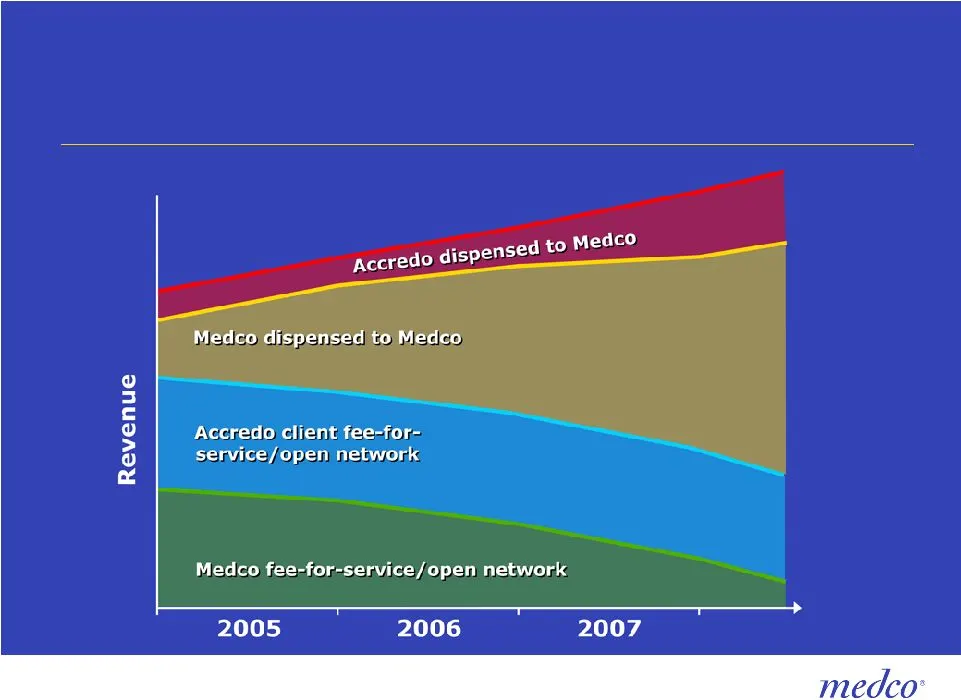
Specialty pharmacy – dynamic landscape Significant move underway in marketplace from "unmanaged" fee-for-service providers to managed/PBM platform Large health plans attempting to manage and dispense specialty drugs themselves Smaller unaligned specialty pharmacies under significant pressure as mark
Slide 80: Industry replatforming from fee-for-service to managed care
Industry replatforming from fee-for-service to managed care

Slide 81: Accredo is the superior choice for plans and manufacturers
Accredo is THE superior choice for plans and manufacturers in a changing market Initial partnership Purchase of ACDO Most complete access to limited distribution drugs
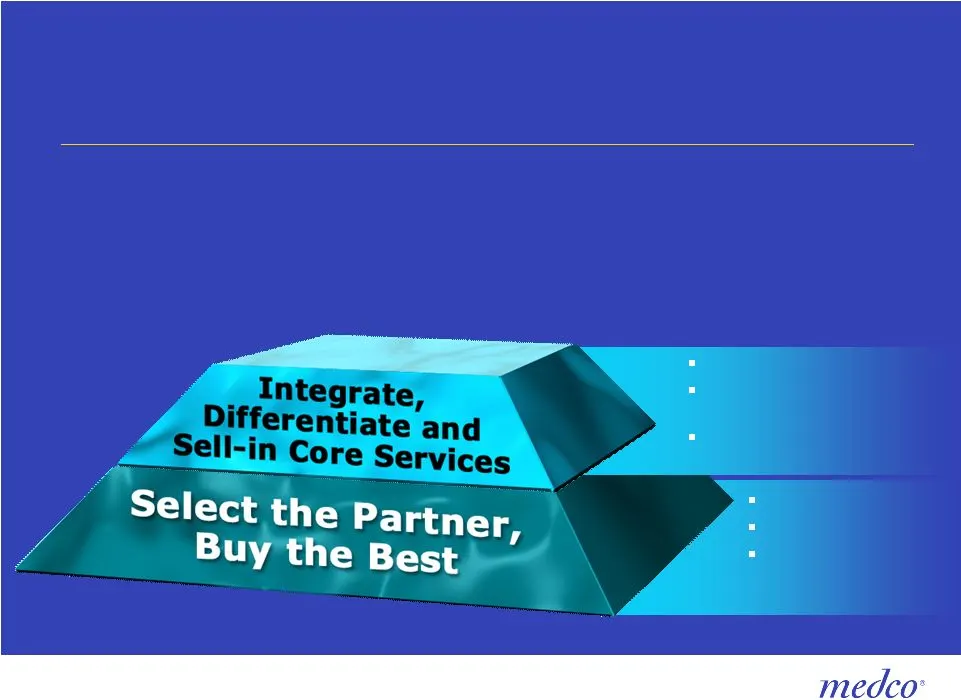
Slide 82: Accredo is the superior choice for plans and manufacturers
Accredo is THE superior choice for plans and manufacturers in a changing market Initial partnership Purchase of ACDO Most complete access to limited distribution drugs 42 MM lives $0.23–$0.26 2007 contribution First Therapeutic Resource Center (TRC)
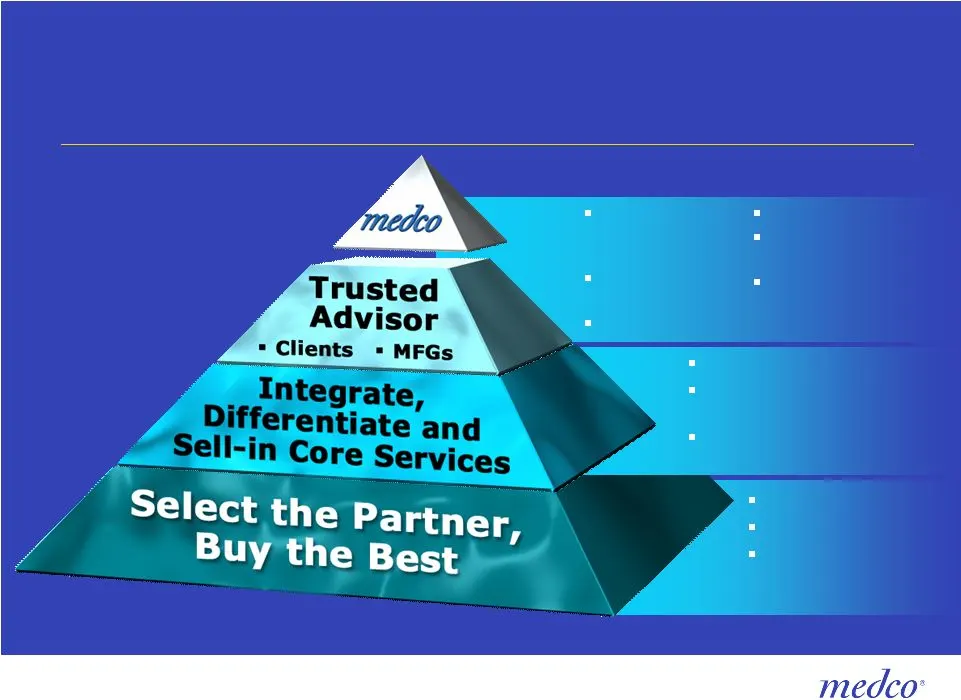
Slide 83: Accredo is the superior choice for plans and manufacturers
Accredo is THE superior choice for plans and manufacturers in a changing market Initial partnership Purchase of ACDO Most complete access to limited distribution drugs 7 new limited distribution drugs Flolan ® exclusivity Oncology Formulary Manufacturer services Major med; preferred provider initiat
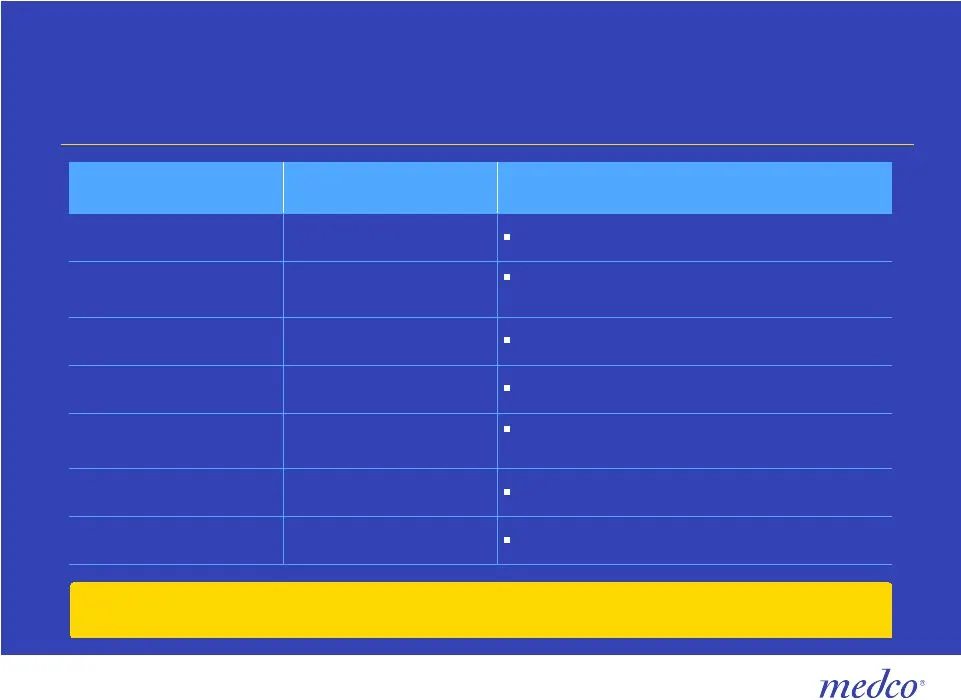
Slide 84: New limited distribution medications 2006
New limited distribution medications 2006 Renal cell carcinoma Bayer 4. Nexavar MDS (myelodysplastic syndrome) Celgene 3. Revlimid Iron overload due to blood transfusions Novartis 2. Exjade Hunter syndrome Pompe disease Immunoglobin replacement therapy IGF-1 deficiency Treatment Shire 7. Elaprase Ge
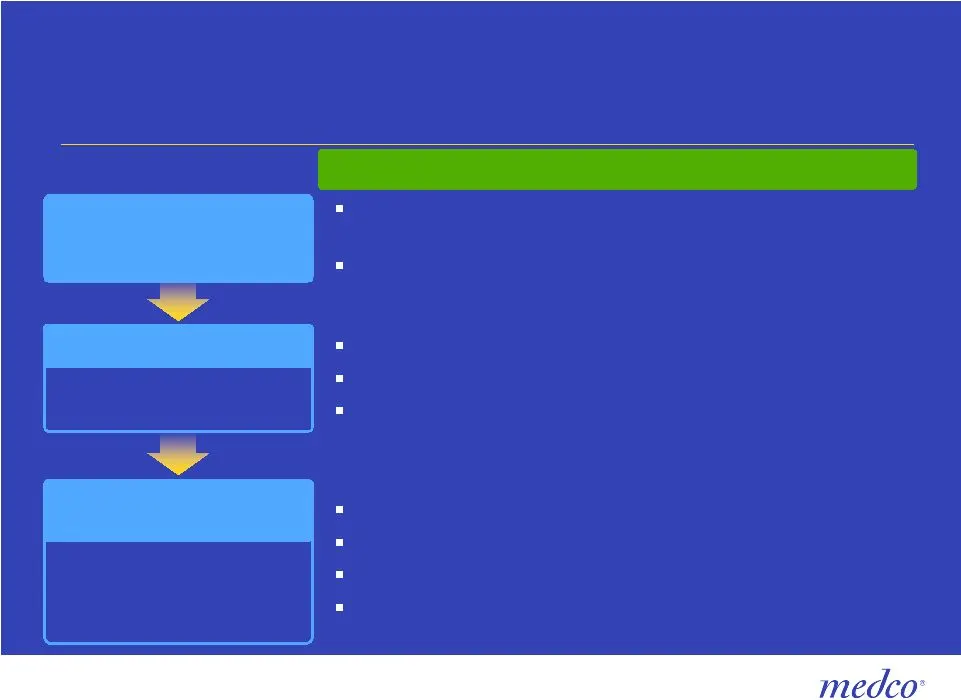
Slide 85: Pricing/value equation drives client opportunity
Pricing/value equation drives client opportunity Leverage preferred provider Consolidate targeted major medical volume More restricted Consolidate all Rx specialty volume Accredo In-network Value Utilization management: e.g., reduced days supply; off-label usage Therapy management for Accredo script
Slide 86: Accredo's growth opportunity is multi-faceted
Accredo’s growth opportunity is multi-faceted New client wins for combined organization Medco book of business Narrowing network Major med opportunity “Long list” to Accredo clients Productivity enhancements New products Oncology Formulary – biogenerics Services Acquisition/M&A New client wins for c

Slide 87: Growing Today, Innovating for a Greater Tomorrow
Growing Today Innovating for a Greater Tomorrow Growing Today, Innovating for a Greater Tomorrow Growing the Bottom Line Growing Specialty Pharmacy Growing in the Marketplace Optimizing Prescriptions

Slide 88: Optimizing Prescriptions
Analyst Day - November 30, 2006 Optimizing Prescriptions Medco is a registered trademark of Medco Health Solutions, Inc. Laizer Kornwasser Senior Vice President, Channel and Generic Strategy
Slide 89: Generic growth opportunity
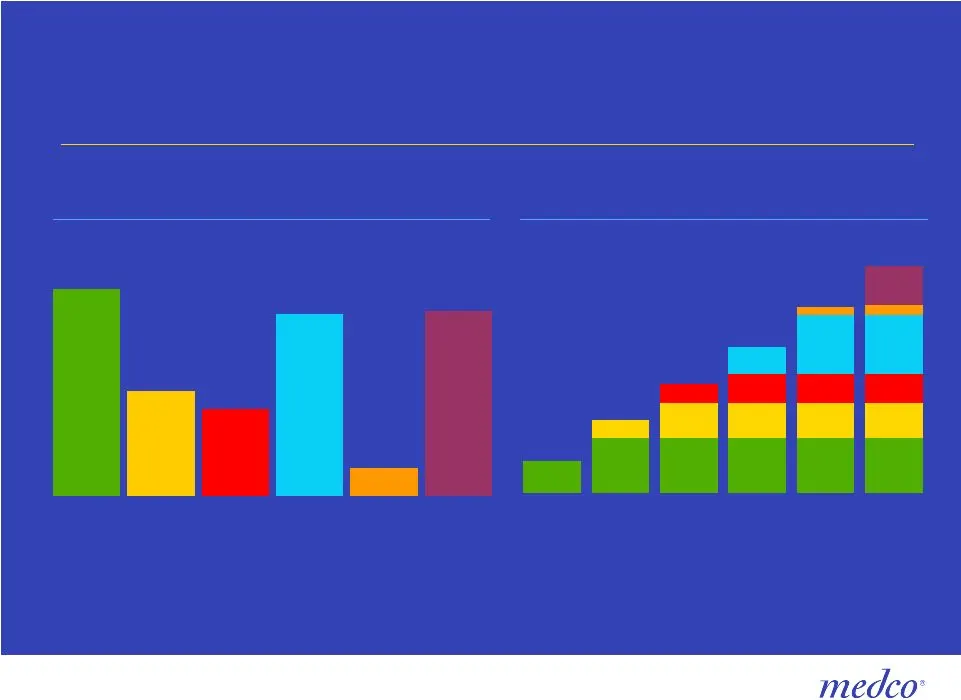
Generic growth opportunity $51B † brand drugs off-patent through 2011 Off-patent compounding effect ($ Billions, prorated) 14.0 7.1 5.9 12.3 1.9 12.5 2006 2007 2008 2009 2010 2011 $51B in US off-patent Brand-name drug spend ($ Billions, annualized) Zocor ® Zoloft ® Fosamax ® Zyrtec ® Risperdal ® 6.5

Slide 90: How will Medco maximize the opportunity?
How will Medco maximize the opportunity? Financial incentives Education & communication Step therapy rules

Slide 91: Financial incentives
Financial incentives Education & communication Step therapy rules

Slide 92: Financial incentives
Financial incentives Incentive formulary / preferred drug alignment Mail alignment Member pay the difference Co-pay waivers Financial incentives Education & communication Step therapy rules Incentive formulary / preferred drug alignment Mail alignment Member pay the difference Co-pay waivers

Slide 93: Impact of member pays the difference on generic rates
Impact of “member pays the difference” (MPD) on generic rates 1 Source: Based on a sample of Medco data. Generic dispensing rates 1 Managed Sensitive No MPD program 49.5% 55.9% 57.2% Financial incentives Education & communication Step therapy rules
Slide 94: Financial incentives drive results
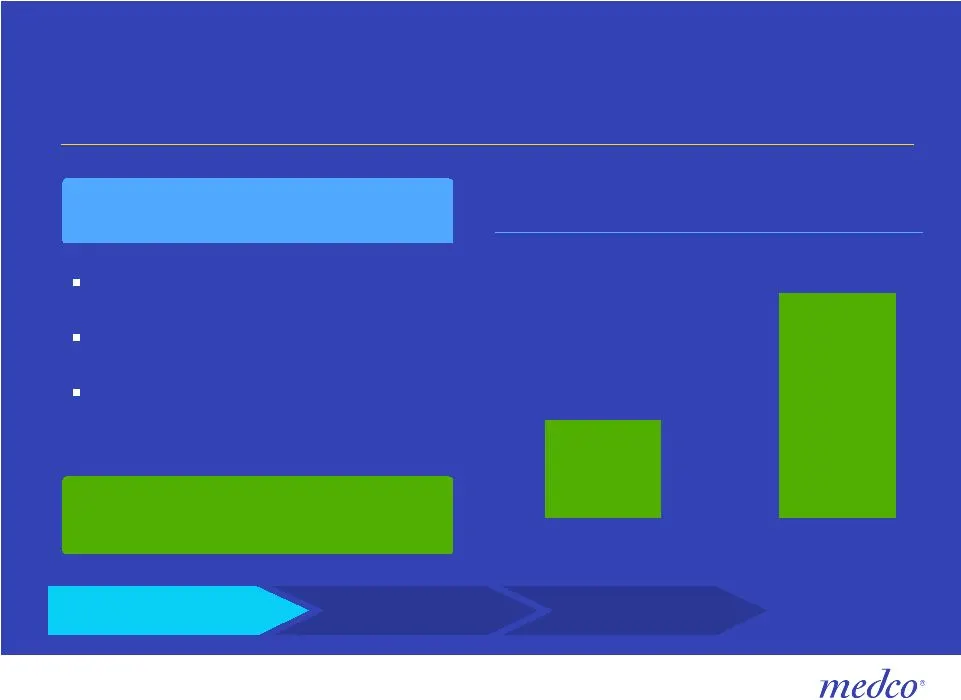
Financial incentives drive results National account case study 2005 retail: $10/25/35/50 2006 retail: $10/30/40/55 Added member pay the difference Client saved 4% of drug spend Co-pay changes GDR 55.4% 3Q2005 62.4% 3Q2006 Client saved 4% of drug spend Co-pay changes Financial incentives Education &
Slide 95: Mail alignment maximizes clients' generic opportunity
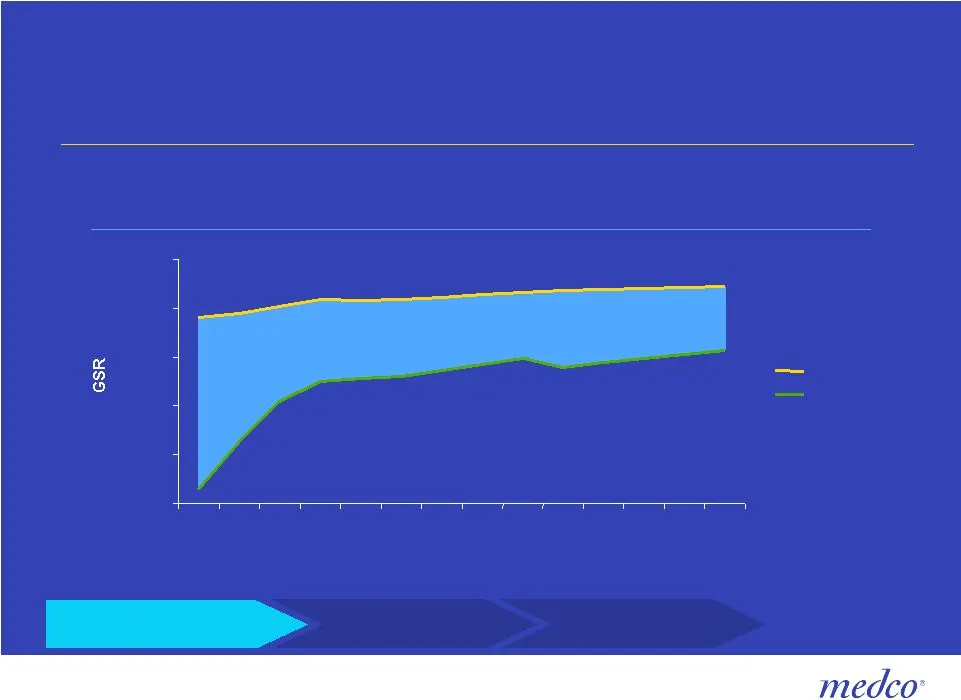
Mail alignment will allow our clients to maximize on its generic opportunity Generic substitution rate New chronic generics over the past 2 years Days Note: Savings based on the gap over the past 2 years and applying it to the generics listed on earlier slide 75% 80% 85% 90% 95% 100% 7 14 30 60 90 1

Slide 96: Education & communication
Financial incentives Education & communication Step therapy rules
Slide 97: Awareness deepens members' understanding of generics
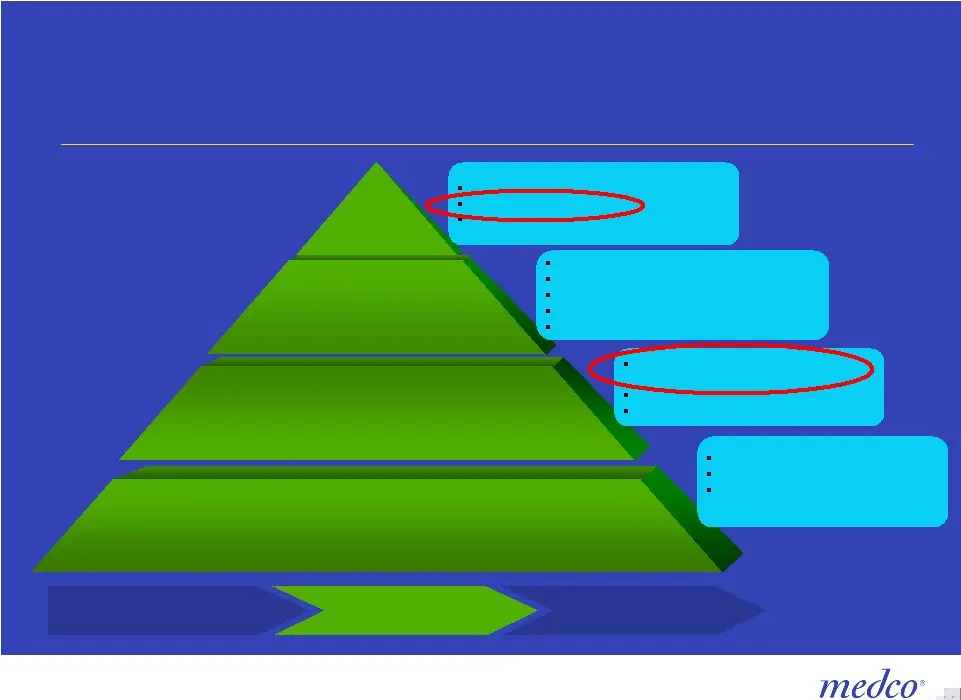
Awareness deepens members’ understanding of generics Pre-script mailings Post-script mailings Internet Trusted advisor Pre-script mailings Welcome kit Generic education Open enrollment/ Benefit information Post-script mailings Targeted drug mailings/ Consumer Reports Mail conversion programs EOB’s I
Slide 98: Step therapy rules
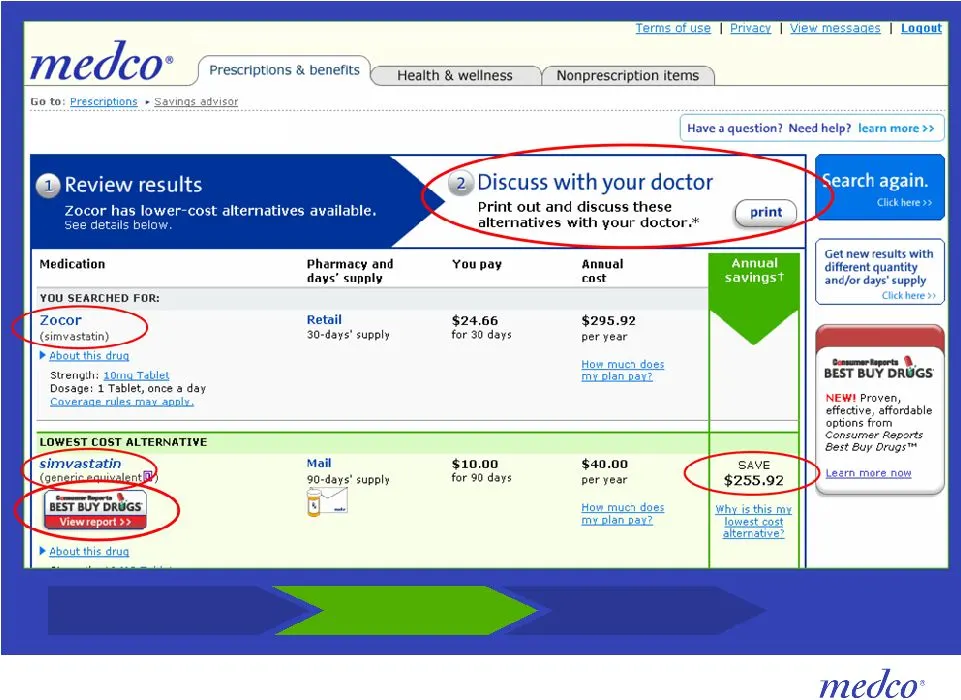
Financial incentives Education & communication Step Therapy Rules
Slide 99: Consumer Reports Best Buy Drug Ratings
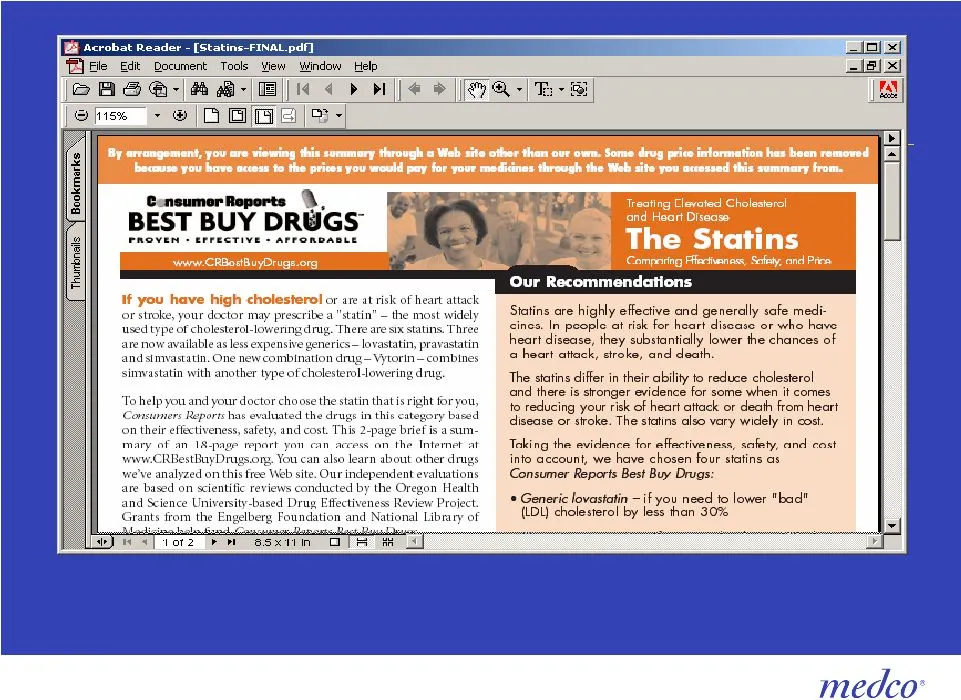
Consumer Reports Best Buy Drug Ratings provide proven, effective, and affordable options for consumers who take maintenance medications. These independent ratings for safety, effectiveness and relative cost of drugs help consumers make better decisions about the alternatives available to them and to
Slide 100: New generics education for statins
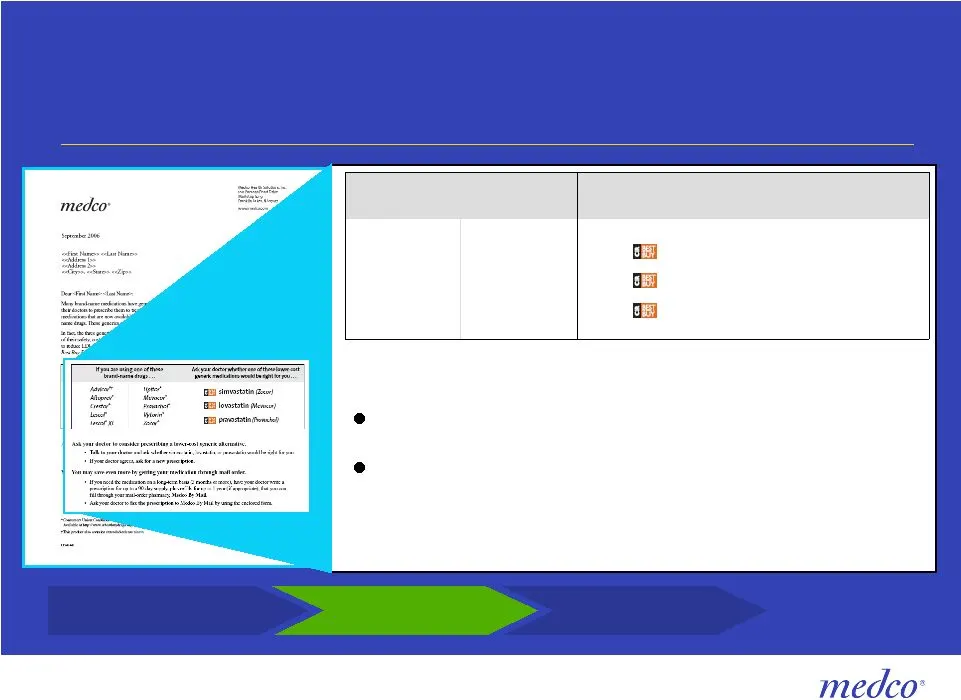
New generics education for statins Ask your doctor to consider prescribing a lower-cost generic alternative. Talk to your doctor and ask whether simvastatin, lovastatin, or pravastatin would be right for you. If your doctor agrees, ask for a new prescription. * Consumers Union:Consumer Reports Best
Slide 101: Our communications drive results
Our communications drive results Non-formulary PPI drug Strategy Results Impact on GDR Educational mailing 150,000 members Non-formulary drug market share dropped 50% Generic omeprazole up 30% Source: Medco data. Strategy Results Impact on GDR Financial incentives Education & communication Step ther

Slide 102: Step therapy rules
Financial incentives Education & communication Step therapy rules

Slide 103: Step therapy
Step therapy Co-pay and coverage options drive generics and lower cost brands Effective communication High success rate with minimal member noise Step therapy for new and existing users: Financial incentives Education & communication Step therapy rules
Slide 104: PPI case study
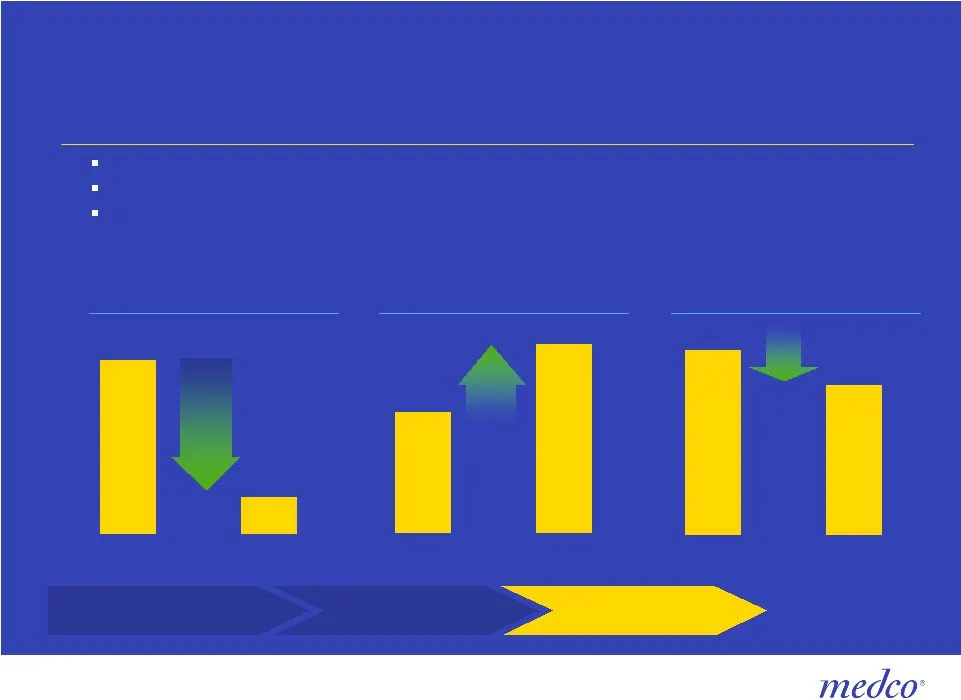
$222 $181 Pre-Program Post-Program 42% 9% Pre-Program Post-Program 58% 91% Pre-Program Post-Program PPI case study 79% decrease in non-preferred market share 57% increase in formulary compliance Clients cost/Rx reduced by 18.4% for the category – Generic share increased by 53% Avg 79% Non-preferred

Slide 105: Opportunity to capitalize on our PPI success
Medco has an opportunity to capitalize on our PPI success 0.8 3.8 6.9 2004 2005 2006 PPI step therapy enrollment (Member lives MM) Financial incentives Education & communication Step therapy rules

Slide 106: A win-win solution
A win-win solution Optimizing prescriptions Lower client drug trend Increase EBITDA per Rx

Slide 107: Growing Today, Innovating for a Greater Tomorrow
Growing Today Innovating for a Greater Tomorrow Growing Today, Innovating for a Greater Tomorrow Growing the Bottom Line Growing Specialty Pharmacy Growing in the Marketplace Optimizing Prescriptions

Slide 108: Growing in the Marketplace
Growing in the Marketplace Analyst Day - November 30, 2006 Medco is a registered trademark of Medco Health Solutions, Inc. Brian T. Griffin Group President Health Plans Group
Slide 109: 2006 selling season: Winning on superior execution and innovation
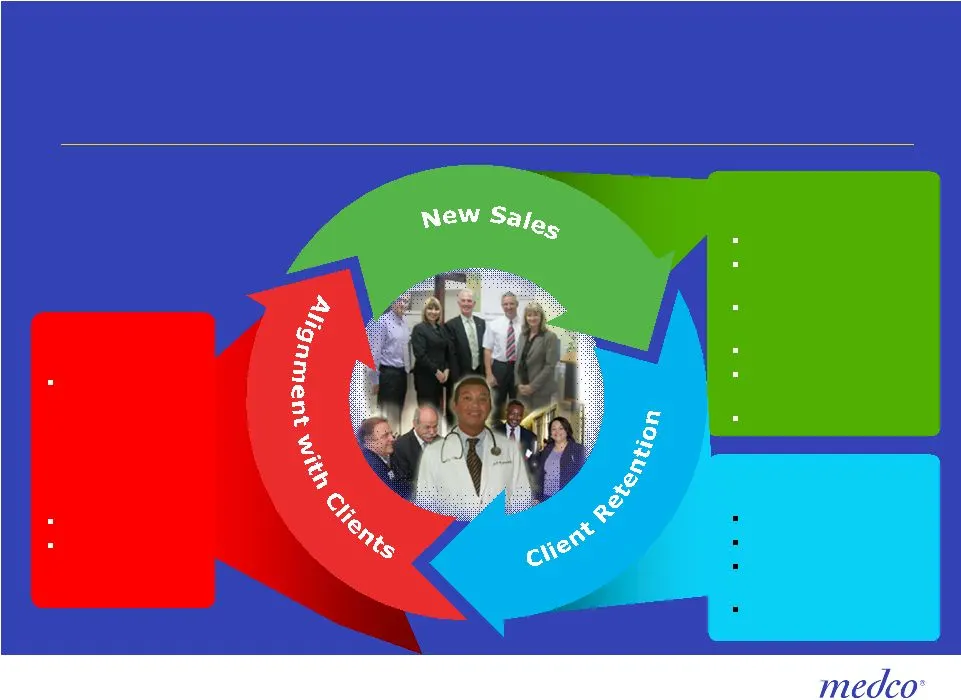
2006 selling season: Winning on superior execution and innovation Medco’s unique value proposition: Single-digit drug trend Award-winning client and member service Flexibility and customization Technology leadership Industry-leading client analytical tools Clinical innovation Alignment and Execution
Slide 110: 2006 Results in the marketplace
2006 Results in the marketplace Net-new sales 2006, to date (includes Medicare) 2006 renewals (above $10B renewals in 2005) New annualized business for 2007 New annualized business in 2006 Client retention rate – average contract length 4.5 years $3.3B $6.3B+ $1.2B+ $3.7B+ 97.5%
Slide 111: Medco New 2006 business
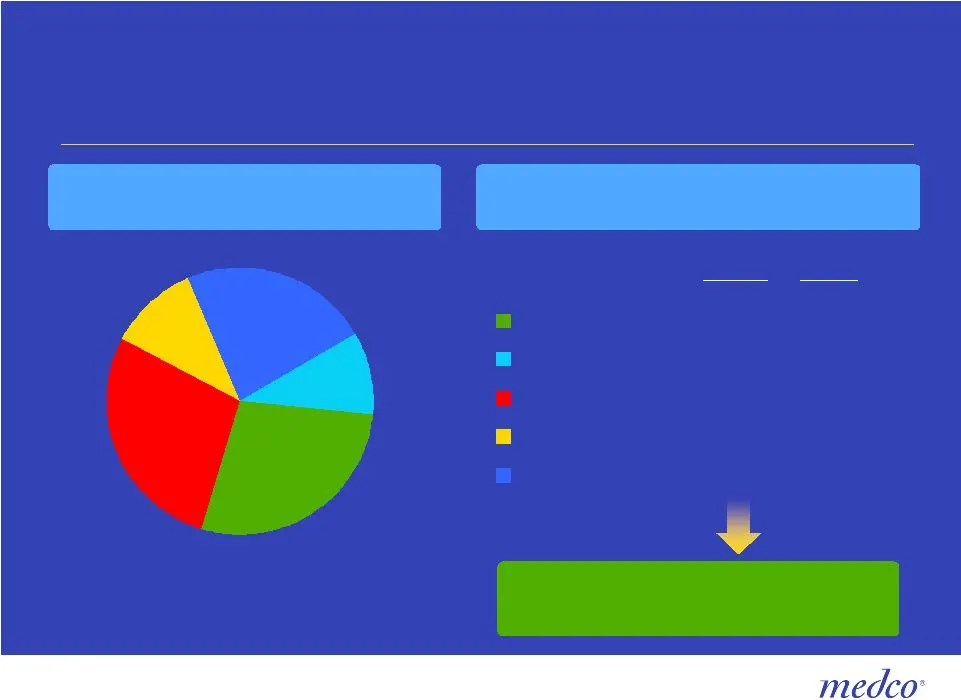
Medco New 2006 business $3.7B+ annualized new business wins in 2006 Average mail penetration by client group 2006 new business 2006 existing Key Accounts 24% 41% National 26% 52% Health Plans 5% 28% Systemed 24% 41% Medicare PDP 11% 11% Substantial growth opportunity to immediately increase mail ser
Slide 112: New 2006 business by incumbent
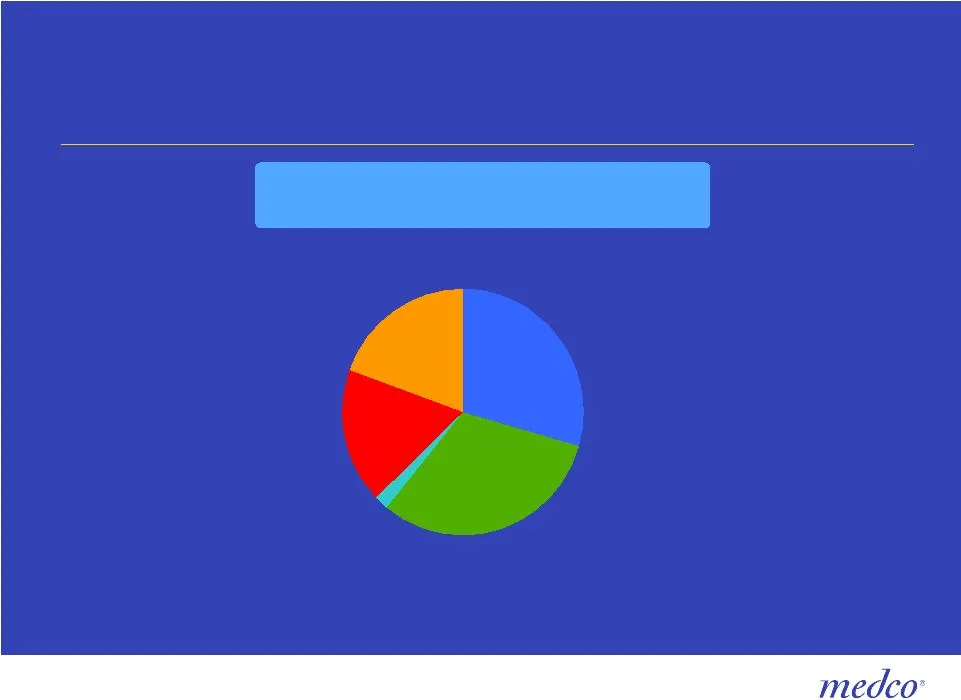
Medco New 2006 business by incumbent 2006 annual drug spend (% by incumbent) Caremark Express Scripts Wellpoint Other NMHC 2006 annual drug spend (% by incumbent) 29% 31% 2% 18% 20%
Slide 113: New 2007 business
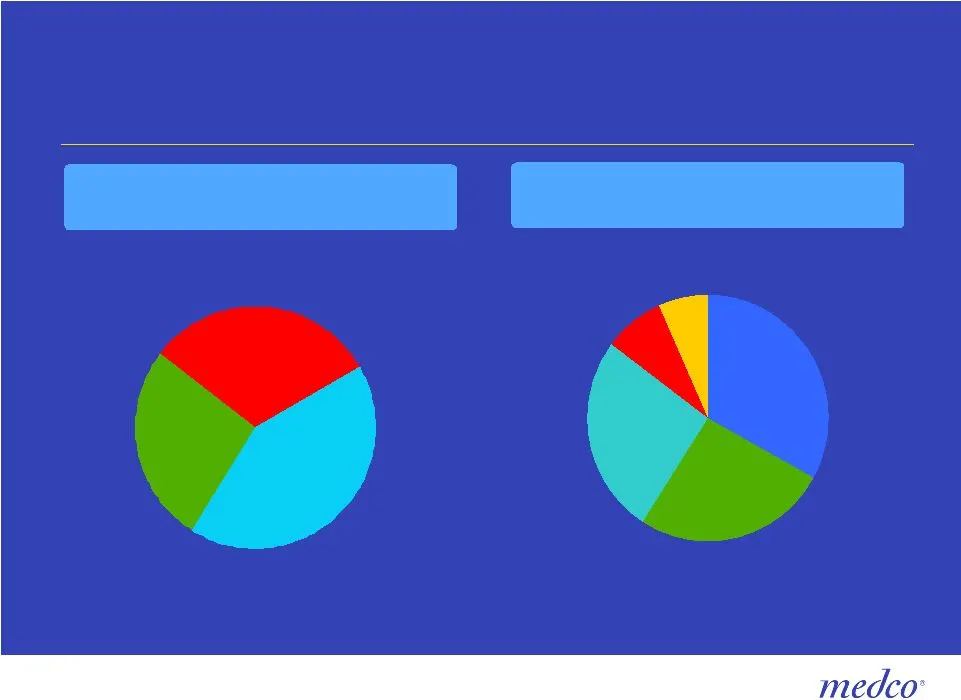
Medco New 2007 business $1.2B+ annualized new business wins for 2007 2007 annual drug spend (% by incumbent) Caremark Express Scripts Wellpoint Other NMHC Health Plans Key Accounts Employer $1.2B+ annualized new business wins for 2007 2007 annual drug spend (% by incumbent) 31% 42% 27% 26% 8% 7% 26%

Slide 114: Leveraging Medco specialty solutions for market and margin expansion
Leveraging Medco specialty solutions for market and margin expansion Growing specialty across all market groups Maintaining pricing discipline Meeting the demand for integrated pharmacy solutions and component specialty services Driving incremental value by focusing on: – Superior patient care – Red
Slide 115: Leveraging specialty solutions to win across all markets
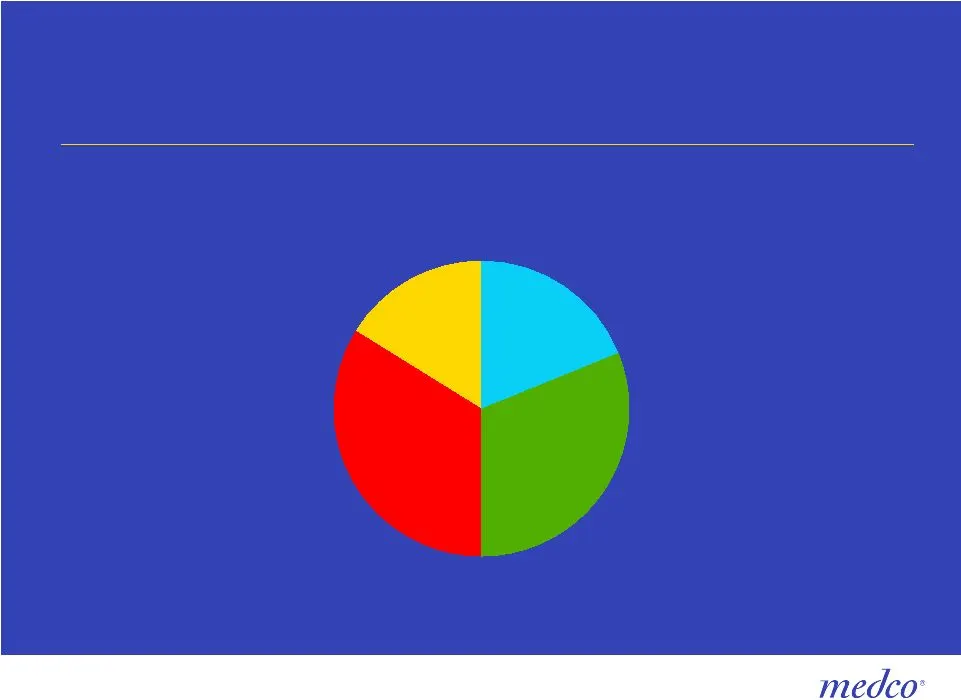
Leveraging Medco specialty solutions to win across all markets $113M annualized new name specialty business in 2006 Health Plans National Accounts Key Accounts Systemed 16% 31% 34% 19%
Slide 116: Delivering client value: drug trend management
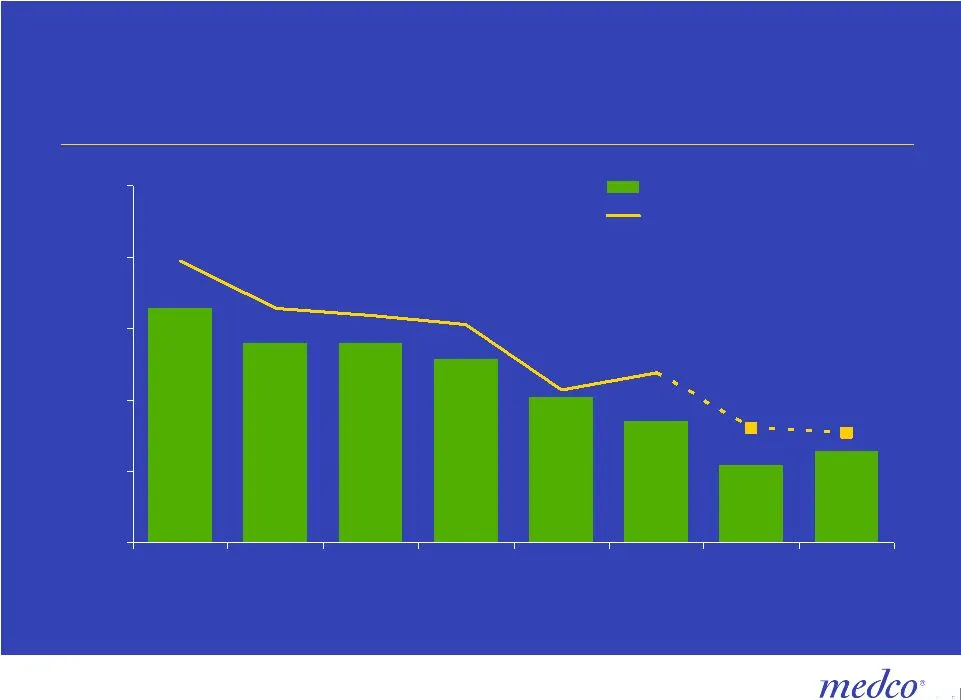
Delivering client value Drug trend management 6.4E 10.2 12.9 8.5 14.0 14.0 16.4 5.4 19.7 16.4 15.9 15.3 11.9 8.0 7.7 10.7 0.0 5.0 10.0 15.0 20.0 25.0 1999 2000 2001 2002 2003 2004 2005 9M YTD 2006 Medco book of business CMS estimates Note : 2006 includes Part D/MA - PD lives; does not reflect subsid
Slide 117: Winning on superior execution and innovation: consumer driven health
Winning on superior execution and innovation Market leader in CDH functionality – Most sophisticated data integration capabilities – Industry-recognized thought leadership and expertise – Most advanced member engagement tools in the industry, driving an enhanced member experience – Experienced, know

Slide 118: Captured 1/3 of the CDH market
Winning on superior execution and innovation Captured 1/3 of the CDH market Seamless integration of medical and pharmacy administration with over 30 carriers including all the national players and the CDH market leaders (e.g., UHG/Definity, Aetna, Wellpoint/Lumenos, CIGNA, etc.) Real-time capability
Slide 119: Capturing marketplace advantage through clinical leadership
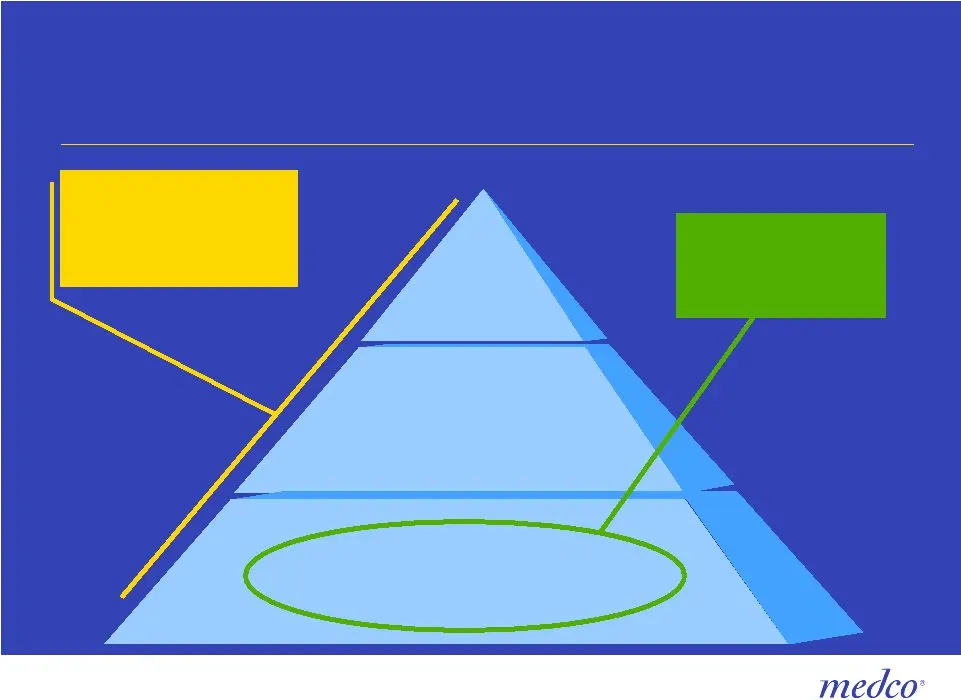
Capturing marketplace advantage through clinical leadership and innovation Most CDHPs deliver only this Teachable moments Trusted Trusted advisor advisor Incentives Incentives Personalized member engagement

Slide 120: Capturing marketplace advantage through clinical leadership and innovation
Capturing marketplace advantage through clinical leadership and innovation Maximizing client and member savings through a proactive review of maintenance medications and facilitation to mail service Reducing pharmacy and total healthcare costs through a more expert, personalized approach to pharmacy
Slide 121: Clinical product solutions' growth accelerated in 2006
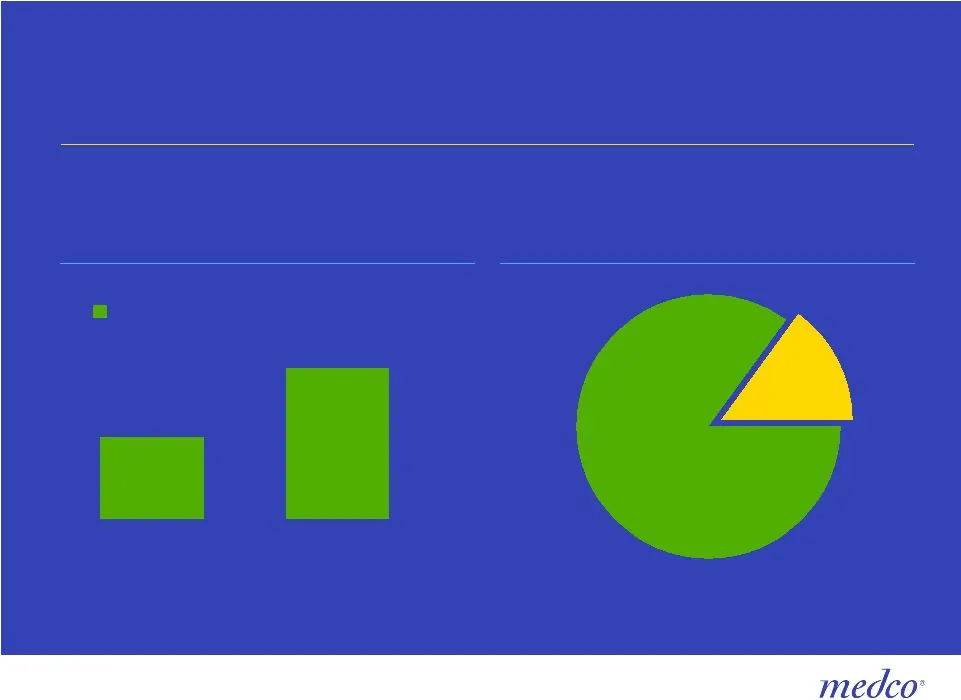
Clinical product solutions’ growth accelerated in 2006, and significant room for continued growth exists 24% 13% 2005 2006E Total revenue Growth opportunity Share captured 85% Clinical & therapeutic solutions products annual growth rate Estimated market potential within Medco’s existing book-of-busi
Slide 122: Clinical and therapeutic solutions offer new market growth opportunities
Our clinical and therapeutic solutions offer new market growth opportunities 7.2M 11.3M 2005 2006E Launched Optimal Health in collaboration with Healthways, Inc. in May 2006 Existing Medco client base offers $300M+ in potential product revenue Over 40 active prospects 57% growth RationalMed safety s

Slide 123: Medco's brandable difference
Medco’s brandable difference Client-facing organizational structure enhances our ability to meet the needs of the individual client Consistent record of award winning service quality, flexibility and customization, mail superiority, technology leadership, client-facing analytical tools, and member e

Slide 124: Growing Today, Innovating for a Greater Tomorrow
Growing Today Innovating for a Greater Tomorrow Growing Today, Innovating for a Greater Tomorrow Growing the Bottom Line Growing Specialty Pharmacy Growing in the Marketplace Optimizing Prescriptions
Slide 125: medco
medco

Slide 126: Selected Information (Unaudited)
Medco Health Solutions, Inc. Selected Information (Unaudited) (In millions, except for per share data) Quarter Ended September 24, 2005 Net Income Net Income per Diluted Share Pro forma 2005 with stock option expense effect: As reported $ 156.7 $ 0.53 Pro forma stock option expense effect, net (14.2
Source: SEC EDGAR · 8-K filed Nov 30, 2006
More decks from Medco Health Solutions Inc
 Merger or Acquisition (July 2011)20 slides · Jul 22, 2011
 Sanford C. Bernstein 27th Annual Strategic Decisions Conference 201125 slides · Jun 1, 2011
 Deutsche Bank 36th Annual Health Care Conference 201130 slides · May 3, 2011
 Investor Presentation (March 2011)36 slides · Mar 24, 2011
 Barclays Capital 2011 Global Health Care Conference36 slides · Mar 17, 2011
 Citi 2011 Global Health Care Conference37 slides · Mar 1, 2011