First Niagara Financial Group Inc
First Niagara Financial — KBW Bank Conference 2013
24 slides from First Niagara Financial's conference presentation, Feb 27, 2013
Slide 1: First Niagara Financial Group - KBW Bank Conference
First Niagara Financial Group John R. Koelmel President & Chief Executive Officer Daniel E. Cantara Chief Banking Officer Gregory W. Norwood Chief Financial Officer KBW Bank Conference February 27, 2013
Slide 2: Safe Harbor Statement
Safe Harbor Statement Any statements contained in this presentation regarding the outlook for FNFG’s business and markets, such as projections of future earnings performance, statements of FNFG’s plans and objectives, forecasts or market trends and other matters, are forward-looking statements based
Slide 3: 2013 Priority: Deliver Improved Results - John Koelmel
2013 Priority: Deliver Improved Results John Koelmel – Chief Executive Officer 3
Slide 4: 2013 Priority: Deliver Improved Results
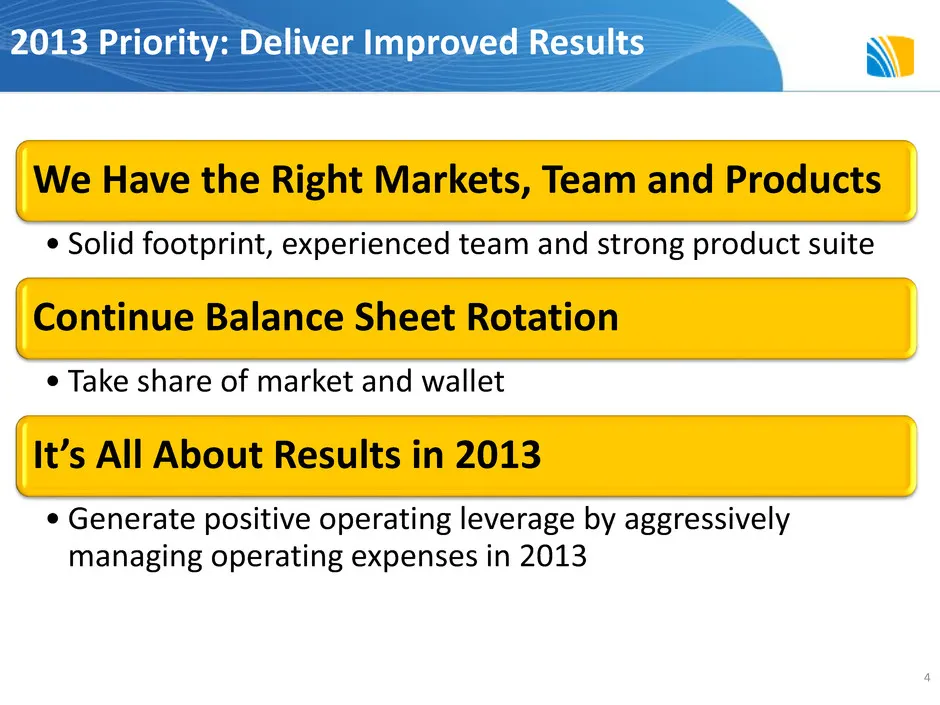
We Have the Right Markets, Team and Products • Solid footprint, experienced team and strong product suite Continue Balance Sheet Rotation • Take share of market and wallet It’s All About Results in 2013 • Generate positive operating leverage by aggressively managing operating expenses in 2013 2013 P
Slide 5: 2013 Priority: Deliver Improved Results - Dan Cantara
2013 Priority: Deliver Improved Results Dan Cantara – Chief Banking Officer 5
Slide 6: Balance Sheet Rotation: Focused Roadmap to Drive Growth and Improved Profitability
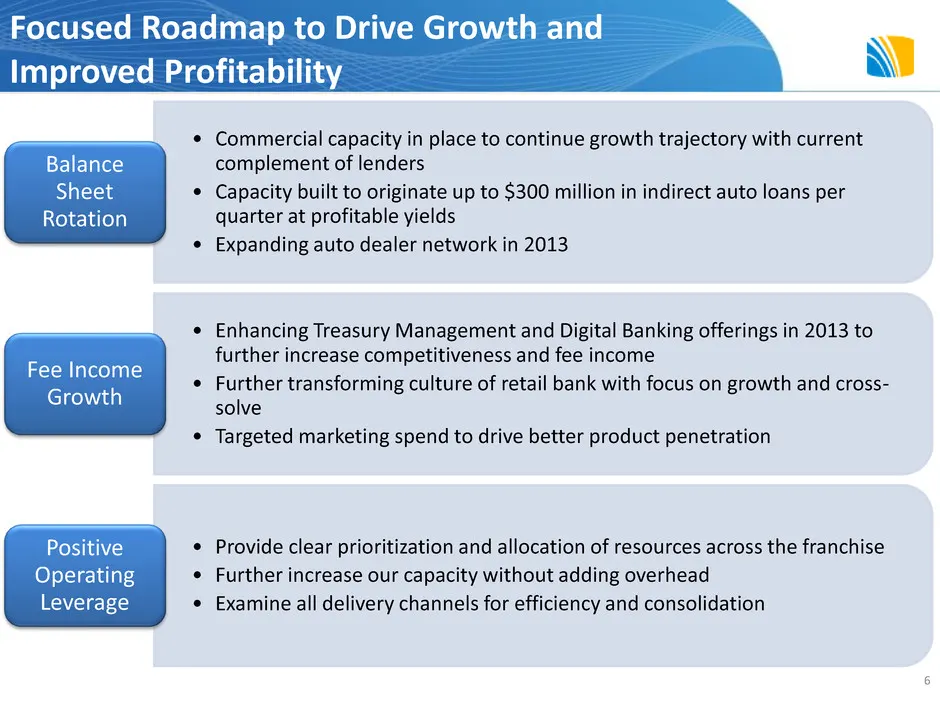
Balance Sheet Rotation Focused Roadmap to Drive Growth and Improved Profitability 6 • Commercial capacity in place to continue growth trajectory with current complement of lenders • Capacity built to originate up to $300 million in indirect auto loans per quarter at profitable yields • Expanding aut
Slide 7: We Like Our Footprint
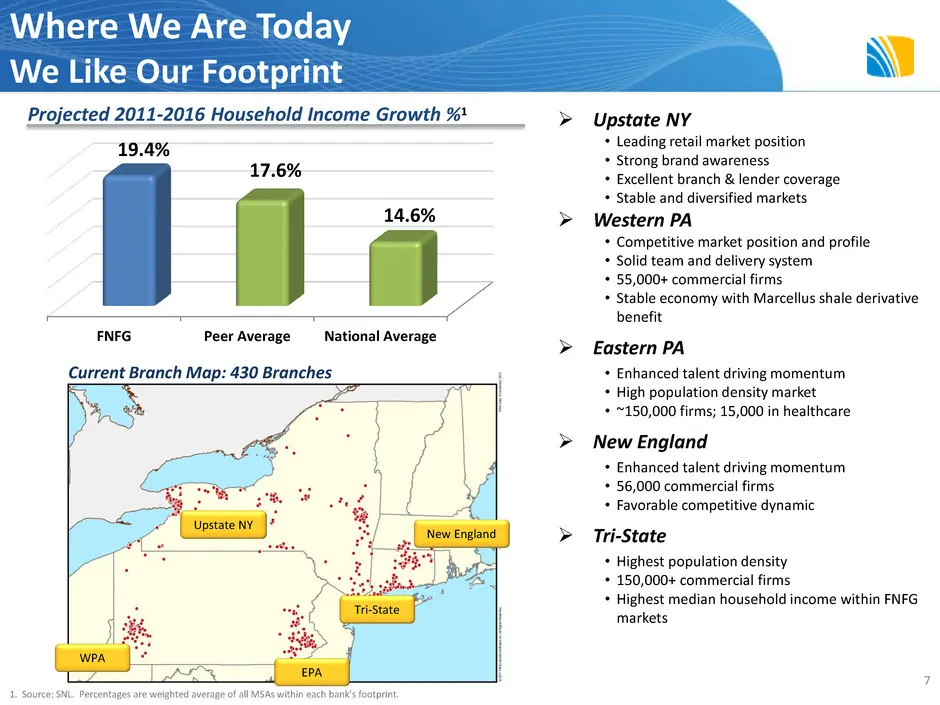
FNFG Peer Average National Average 19.4% 17.6% 14.6% Where We Are Today We Like Our Footprint 1. Source: SNL. Percentages are weighted average of all MSAs within each bank’s footprint. 7 Upstate NY • Leading retail market position • Strong brand awareness • Excellent branch & lender coverage • Sta
Slide 8: Capacity Exists to Continue Commercial Growth Trajectory
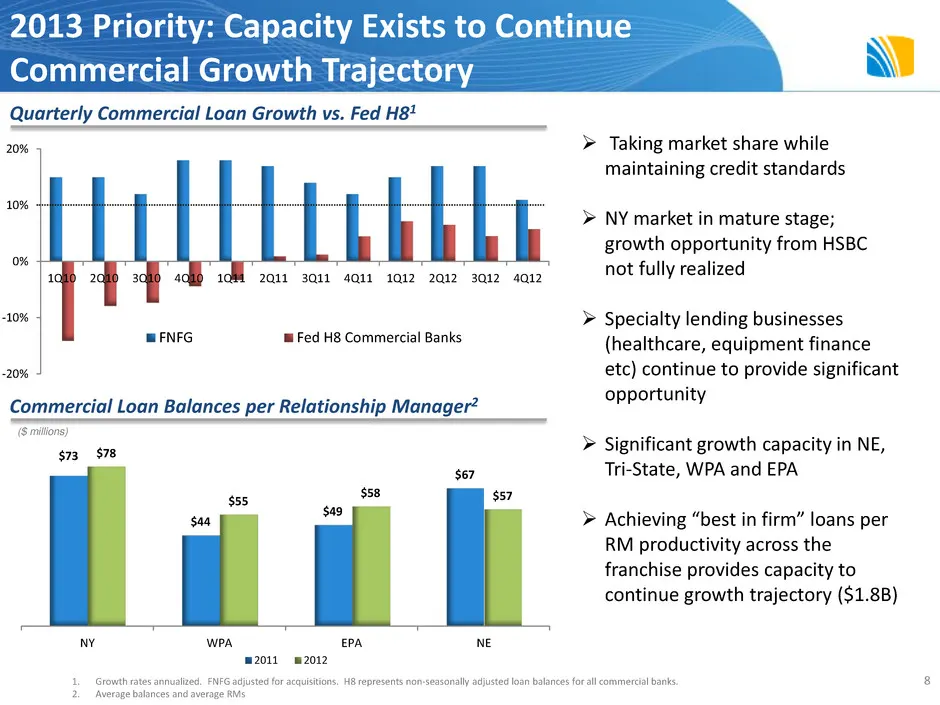
-20% -10% 0% 10% 20% 1Q10 2Q10 3Q10 4Q10 1Q11 2Q11 3Q11 4Q11 1Q12 2Q12 3Q12 4Q12 FNFG Fed H8 Commercial Banks 2013 Priority: Capacity Exists to Continue Commercial Growth Trajectory Commercial Loan Balances per Relationship Manager2 $73 $44 $49 $67 $78 $55 $58 $57 NY WPA EPA NE 2011 2012 Quarterly C
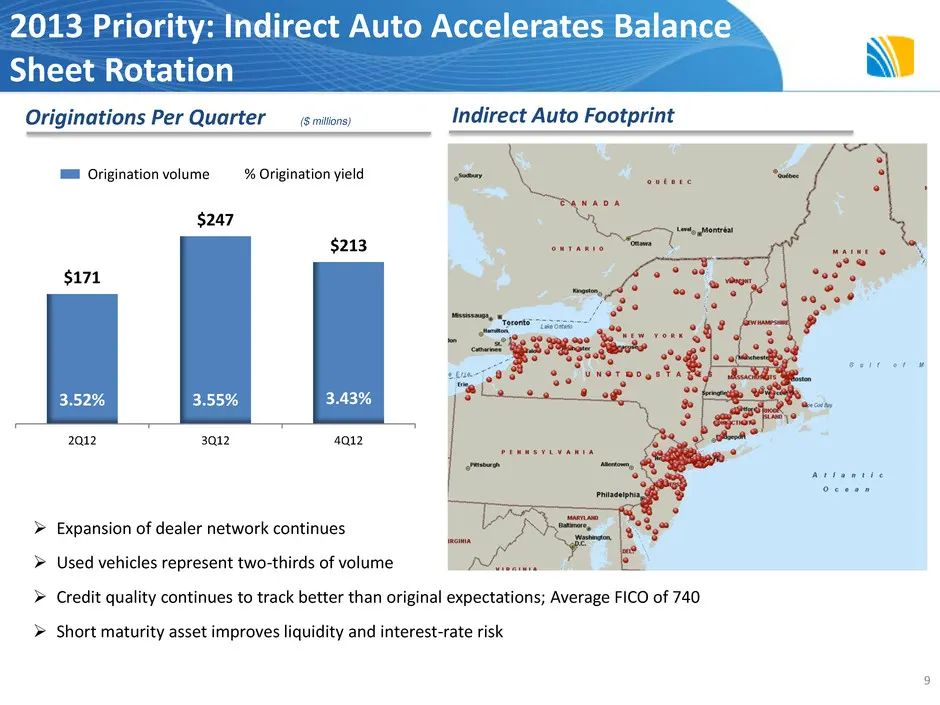
Slide 9: Indirect Auto Accelerates Balance Sheet Rotation
$171 $247 $213 2Q12 3Q12 4Q12 2013 Priority: Indirect Auto Accelerates Balance Sheet Rotation 9 ($ millions) Originations Per Quarter 3.52% 3.55% 3.43% Origination volume % Origination yield Expansion of dealer network continues Used vehicles represent two-thirds of volume Credit quality conti
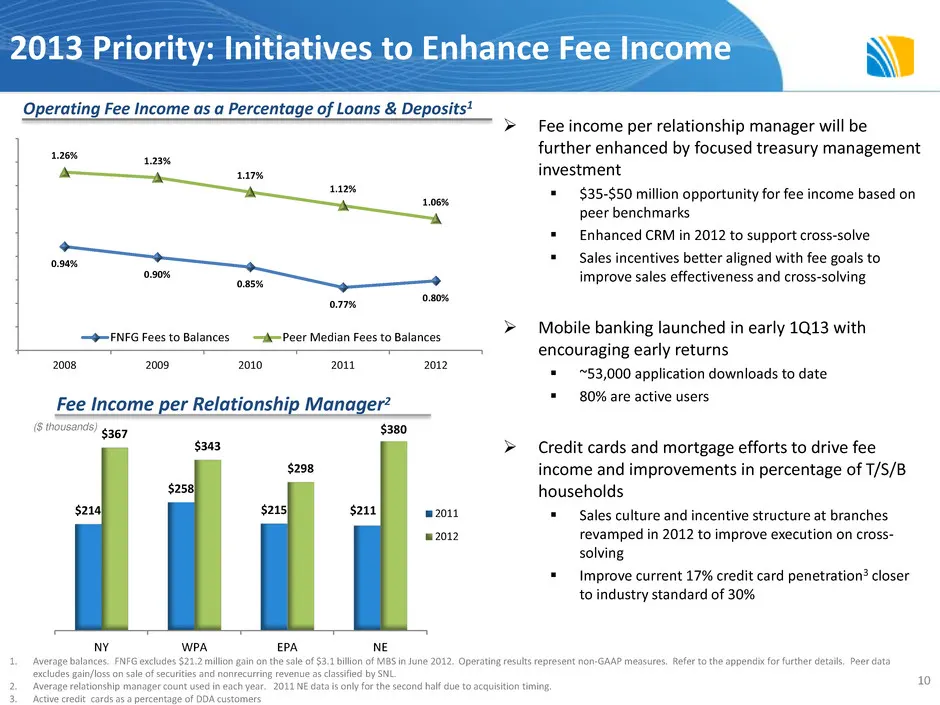
Slide 10: Initiatives to Enhance Fee Income
0.94% 0.90% 0.85% 0.77% 0.80% 1.26% 1.23% 1.17% 1.12% 1.06% 2008 2009 2010 2011 2012 FNFG Fees to Balances Peer Median Fees to Balances 2013 Priority: Initiatives to Enhance Fee Income 10 Fee income per relationship manager will be further enhanced by focused treasury management investment $35-$
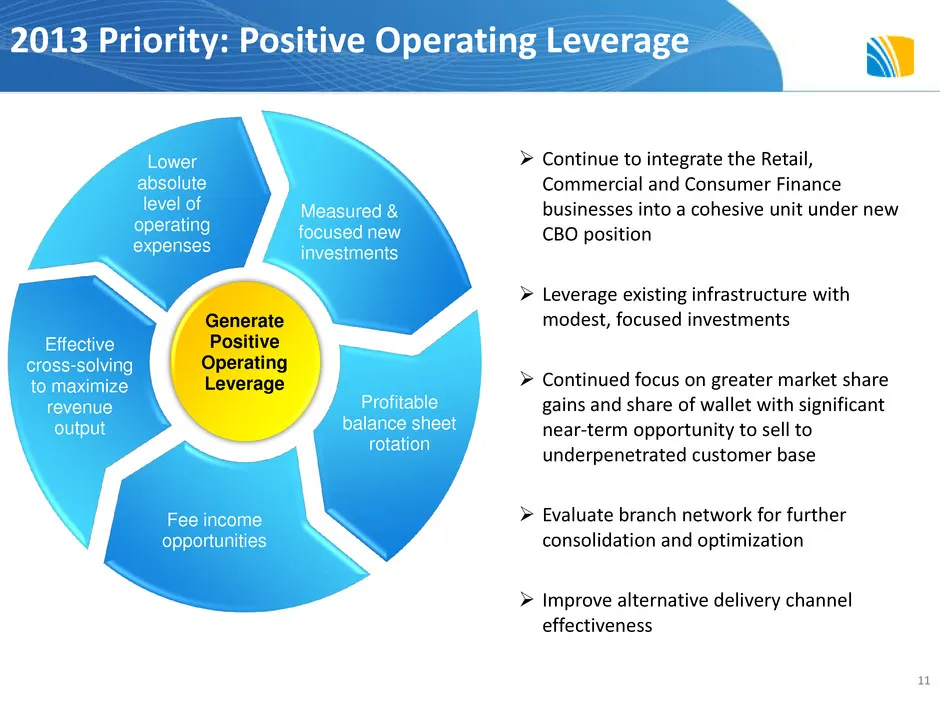
Slide 11: 2013 Priority: Positive Operating Leverage
2013 Priority: Positive Operating Leverage Continue to integrate the Retail, Commercial and Consumer Finance businesses into a cohesive unit under new CBO position Leverage existing infrastructure with modest, focused investments Continued focus on greater market share gains and share of walle
Slide 12: 2013 Priority: Deliver Improved Results - Greg Norwood
2013 Priority: Deliver Improved Results Greg Norwood – Chief Financial Officer 12
Slide 13: Managing Our Expense Base
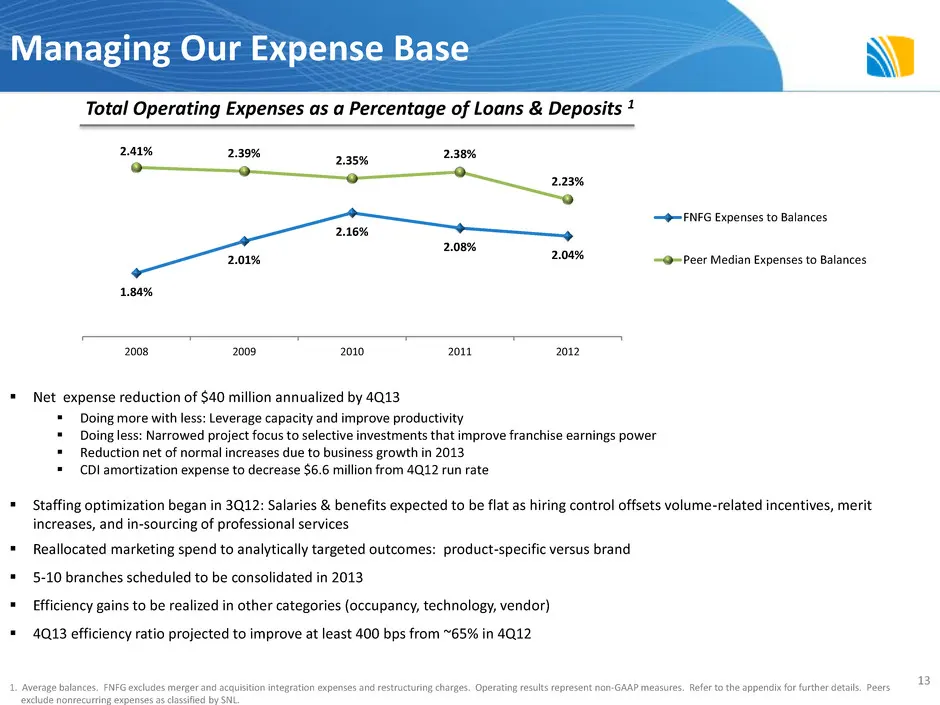
1.84% 2.01% 2.16% 2.08% 2.04% 2.41% 2.39% 2.35% 2.38% 2.23% 2008 2009 2010 2011 2012 FNFG Expenses to Balances Peer Median Expenses to Balances Managing Our Expense Base Net expense reduction of $40 million annualized by 4Q13 Doing more with less: Leverage capacity and improve productivity Doi
Slide 14: Investment Securities: Managing the Portfolio
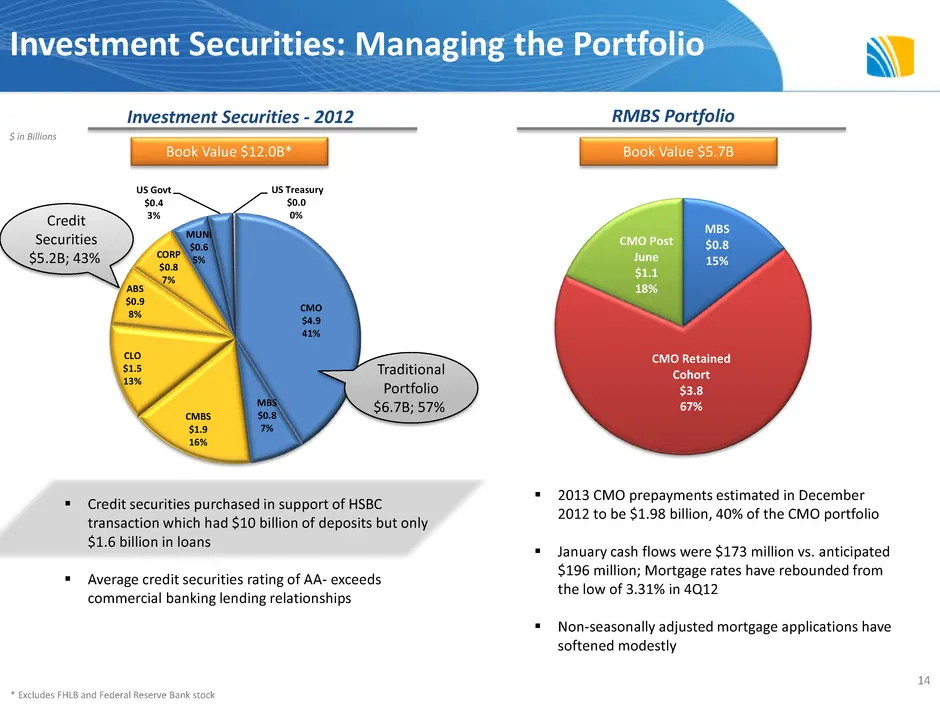
CMO $4.9 41% MBS $0.8 7% CMBS $1.9 16% CLO $1.5 13% ABS $0.9 8% CORP $0.8 7% MUNI $0.6 5% US Govt $0.4 3% US Treasury $0.0 0% Investment Securities: Managing the Portfolio Book Value $12.0B* $ in Billions * Excludes FHLB and Federal Reserve Bank stock Traditional Portfolio $6.7B; 57% Credit Securiti
Slide 15: Low Risk CMBS Portfolio
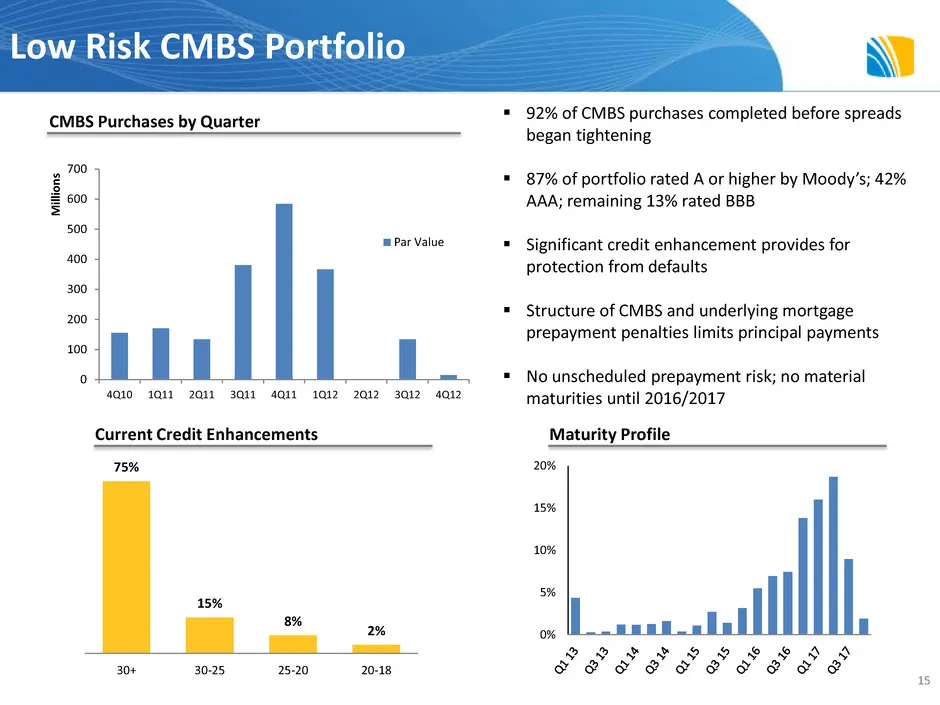
0 100 200 300 400 500 600 700 4Q10 1Q11 2Q11 3Q11 4Q11 1Q12 2Q12 3Q12 4Q12 M ill io n s Par Value CMBS Purchases by Quarter 92% of CMBS purchases completed before spreads began tightening 87% of portfolio rated A or higher by Moody’s; 42% AAA; remaining 13% rated BBB Significant credit enhance
Slide 16: Low Risk CLO Portfolio
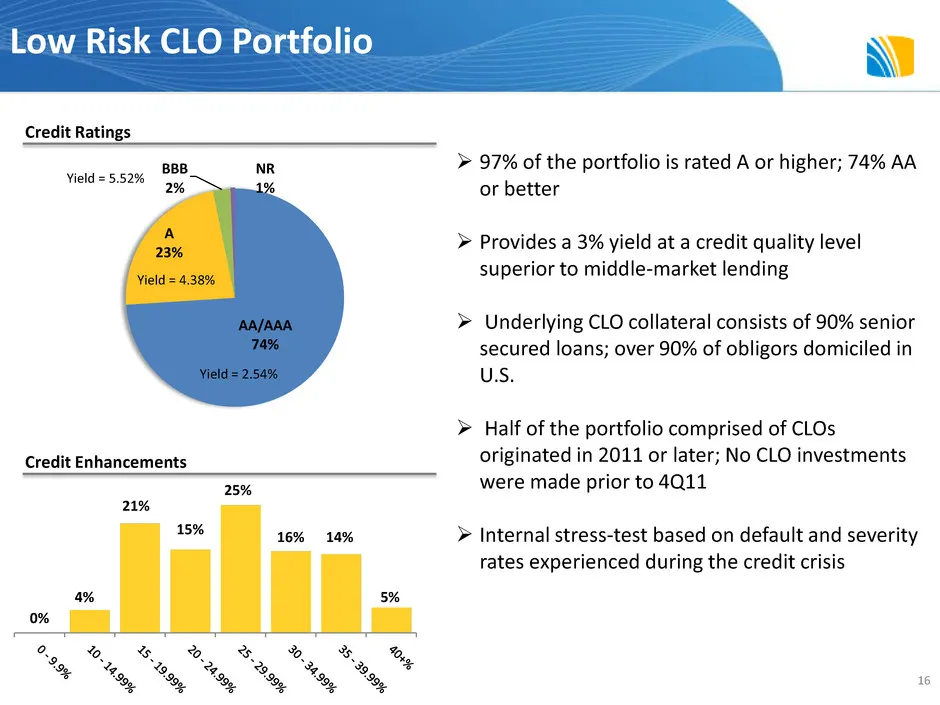
AA/AAA 74% A 23% BBB 2% NR 1% Yield = 2.54% Yield = 4.38% Yield = 5.52% 97% of the portfolio is rated A or higher; 74% AA or better Provides a 3% yield at a credit quality level superior to middle-market lending Underlying CLO collateral consists of 90% senior secured loans; over 90% of obligo
Slide 17: Maintain Superior Credit Quality
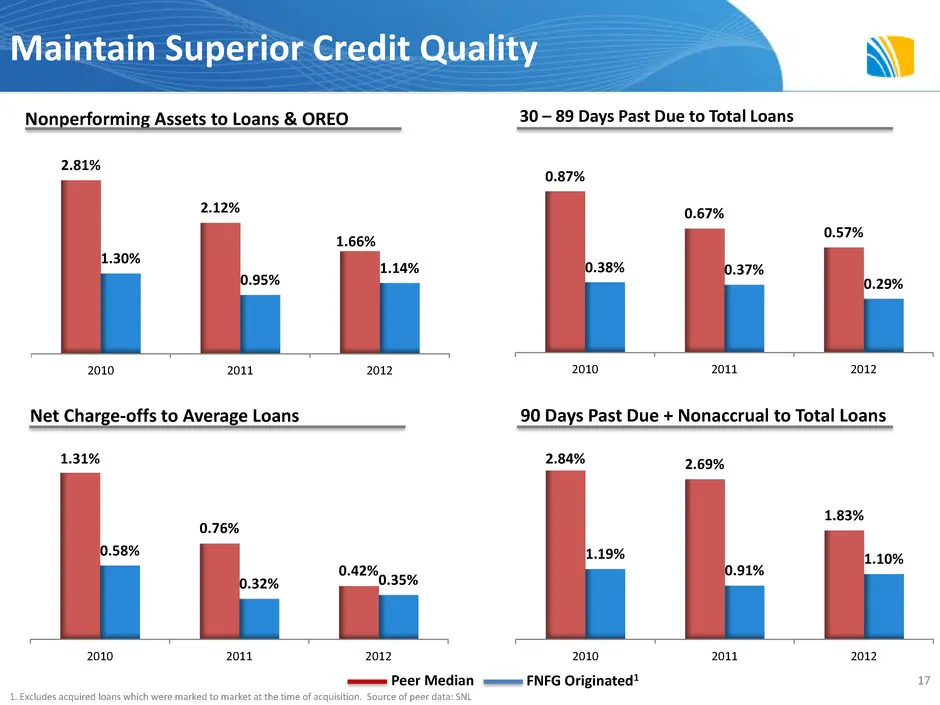
2.84% 2.69% 1.83% 1.19% 0.91% 1.10% 2010 2011 2012 0.87% 0.67% 0.57% 0.38% 0.37% 0.29% 2010 2011 2012 2.81% 2.12% 1.66% 1.30% 0.95% 1.14% 2010 2011 2012 Maintain Superior Credit Quality Nonperforming Assets to Loans & OREO 30 – 89 Days Past Due to Total Loans Net Charge-offs to Average Loans 90 Days
Slide 18: Current Capital Levels Reflect Low Risk Balance Sheet
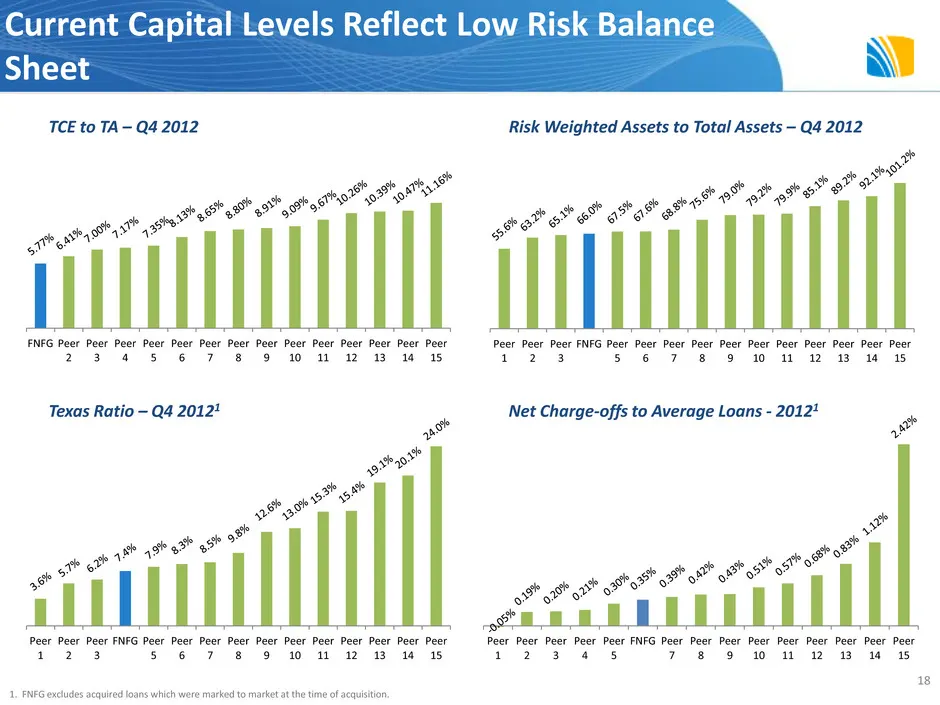
Peer 1 Peer 2 Peer 3 FNFG Peer 5 Peer 6 Peer 7 Peer 8 Peer 9 Peer 10 Peer 11 Peer 12 Peer 13 Peer 14 Peer 15 FNFG Peer 2 Peer 3 Peer 4 Peer 5 Peer 6 Peer 7 Peer 8 Peer 9 Peer 10 Peer 11 Peer 12 Peer 13 Peer 14 Peer 15 Current Capital Levels Reflect Low Risk Balance Sheet Risk Weighted Assets to Tota
Slide 19: Capital Update
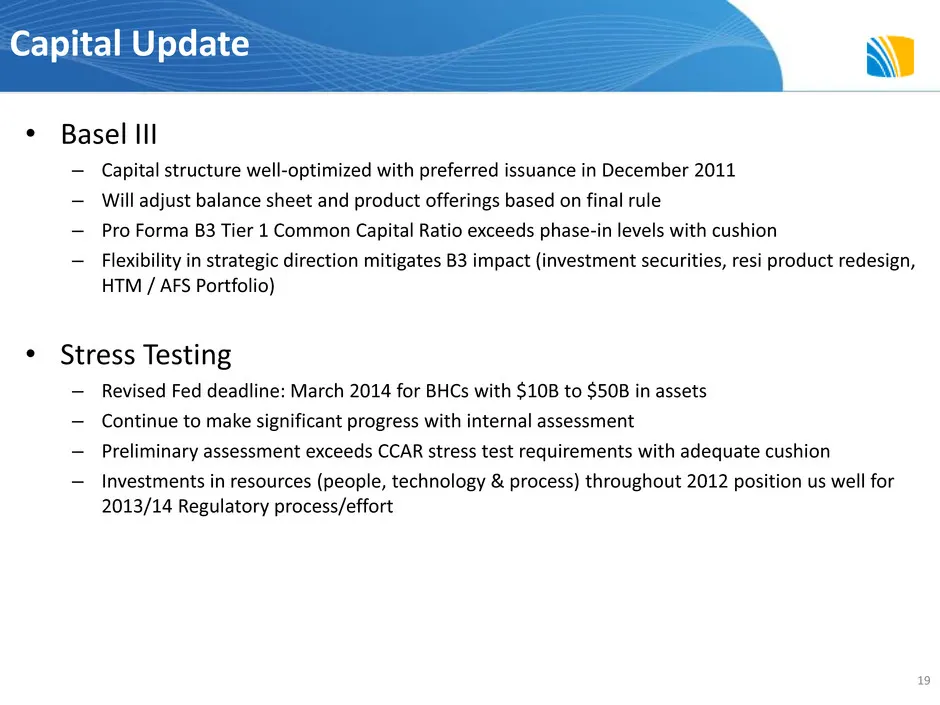
Capital Update • Basel III – Capital structure well-optimized with preferred issuance in December 2011 – Will adjust balance sheet and product offerings based on final rule – Pro Forma B3 Tier 1 Common Capital Ratio exceeds phase-in levels with cushion – Flexibility in strategic direction mitigates
Slide 20: 2013 Outlook Update
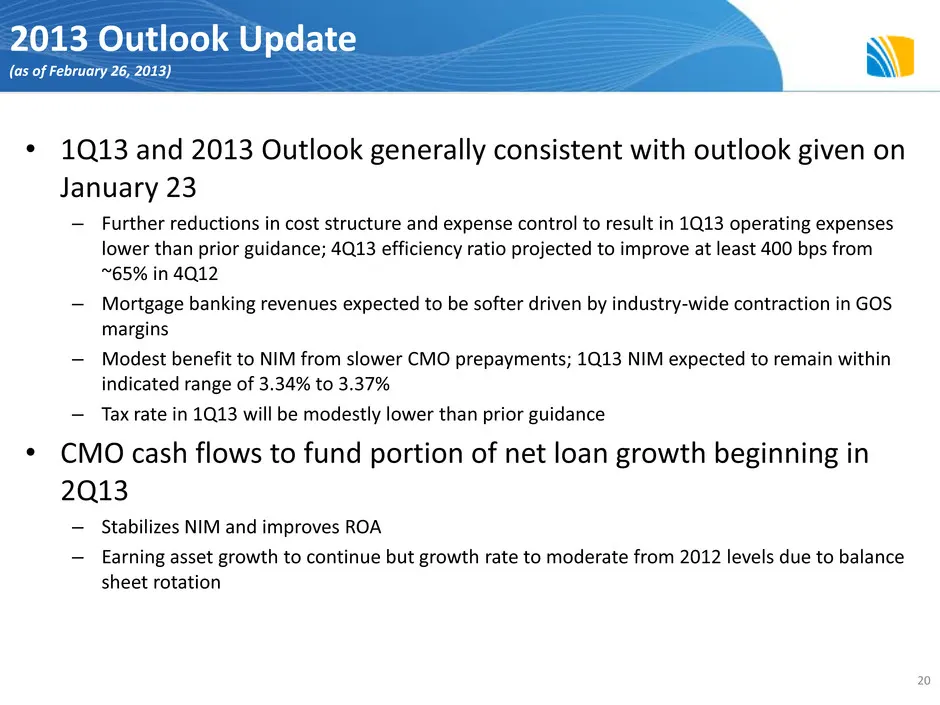
2013 Outlook Update (as of February 26, 2013) • 1Q13 and 2013 Outlook generally consistent with outlook given on January 23 – Further reductions in cost structure and expense control to result in 1Q13 operating expenses lower than prior guidance; 4Q13 efficiency ratio projected to improve at least 4
Slide 21: First Niagara Financial Group - KBW Bank Conference
First Niagara Financial Group John R. Koelmel President & Chief Executive Officer Daniel E. Cantara Chief Banking Officer Gregory W. Norwood Chief Financial Officer KBW Bank Conference February 27, 2013
Slide 22: Appendix
\\ | Appendix
Slide 23: GAAP to Non-GAAP Reconciliation
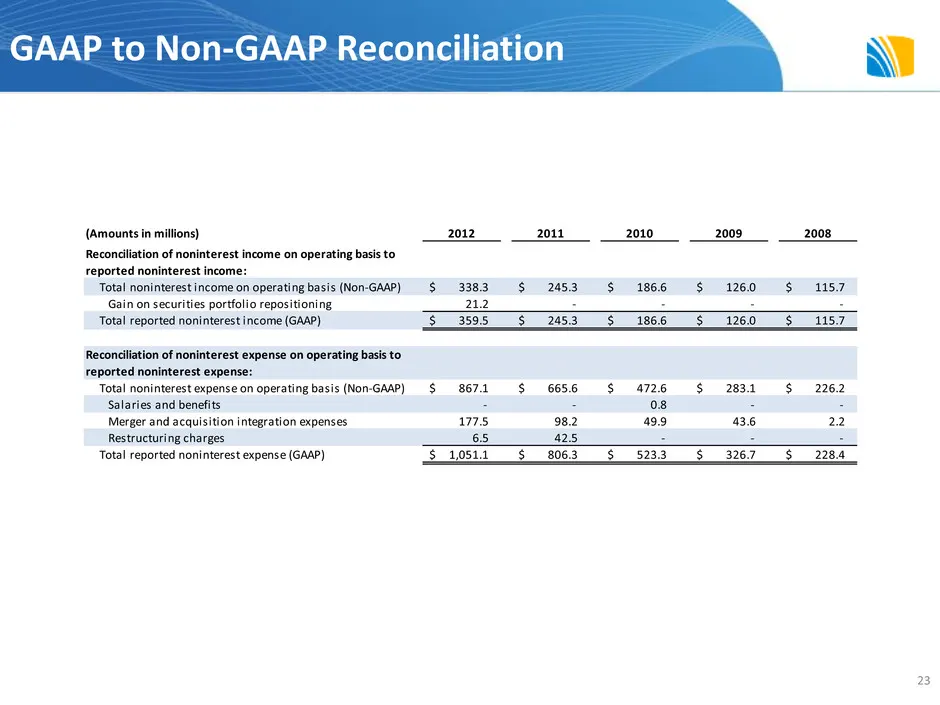
GAAP to Non-GAAP Reconciliation (Amounts in millions) 2012 2011 2010 2009 2008 Total noninterest income on operating basis (Non-GAAP) 338.3$ 245.3$ 186.6$ 126.0$ 115.7$ G in securities portf lio r positioning 21.2 - - - - Total reported noninterest income (GAAP) 359.5$ 245.3$ 186.6$ 126.0$ 115.7$ To
Slide 24: Benchmarking Peer Group
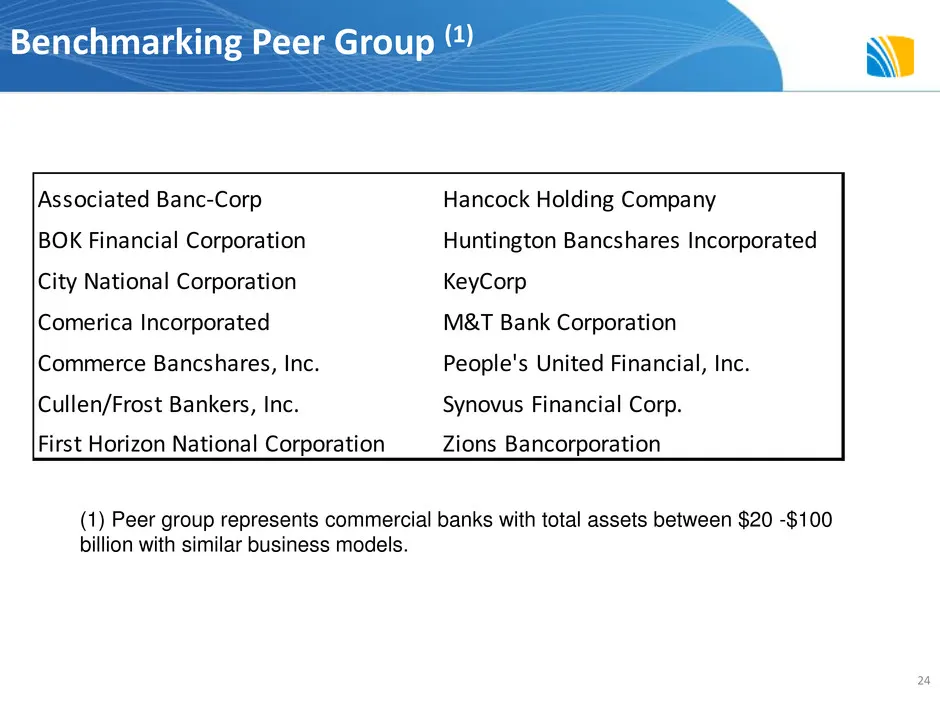
Associated Banc-Corp Hancock Holding Company BOK Financial Corporation Huntington Bancshares Incorporated City National Corporation KeyCorp Comerica Incorporated M&T Bank Corporation Commerce Bancshares, Inc. People's United Financial, Inc. Cullen/Frost Bankers, Inc. Synovus Financial Corp. First Ho
Source: SEC EDGAR · 8-K filed Feb 27, 2013
More decks from First Niagara Financial Group Inc
 Q4 2015 Earnings Presentation27 slides · Jan 21, 2016
 Merger or Acquisition (October 2015)18 slides · Oct 30, 2015
 Q3 2015 Earnings Presentation20 slides · Oct 23, 2015
 Q2 2015 Earnings Presentation20 slides · Jul 24, 2015
 Presentation (June 2015)11 slides · Jun 16, 2015
 Q1 2015 Earnings Presentation20 slides · Apr 24, 2015