Comstock Holding Companies, Inc. · NASDAQ:CHCI
Comstock Holding Companies — Investor Presentation (June 2021)
25 slides from Comstock Holding Companies's investor presentation, June 2021
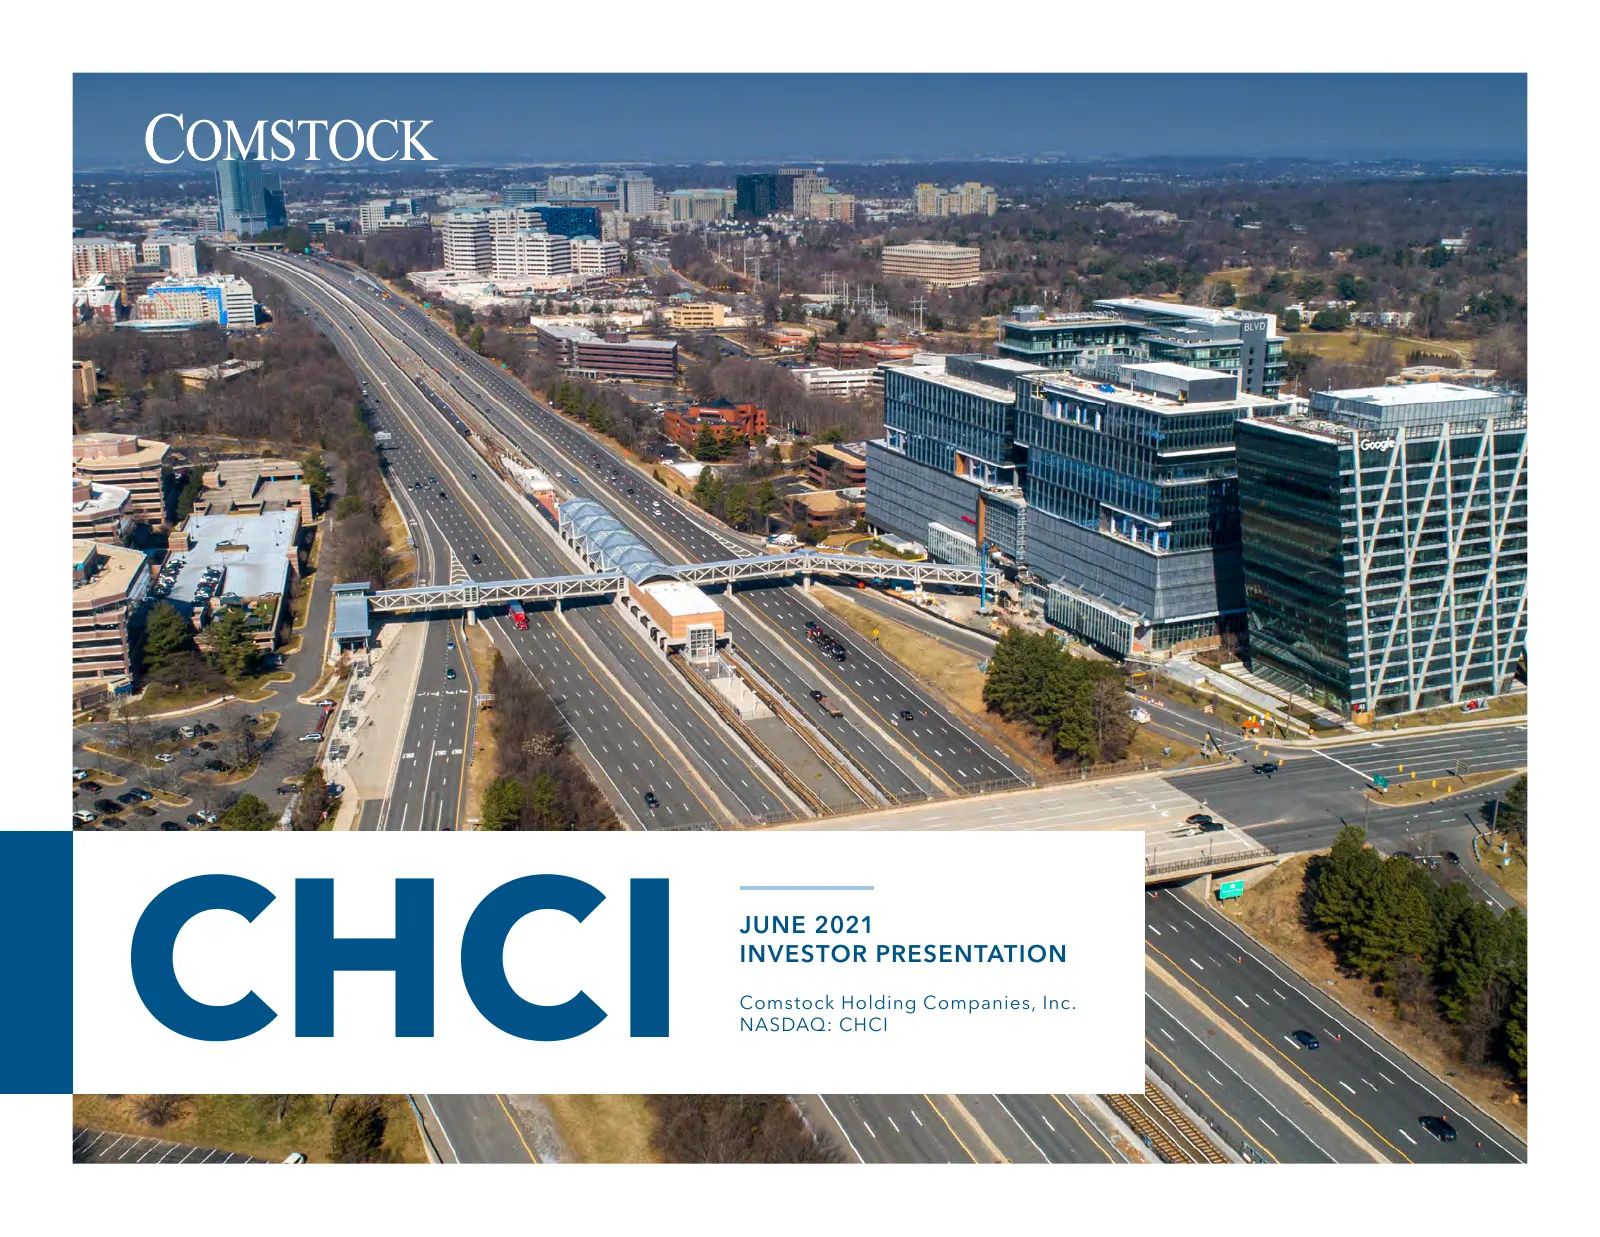
Slide 1: CHCI June 2021 Investor Presentation
CHCI JUNE 2021 INVESTOR PRESENTATION Comstock Holding Companies, Inc. NASDAQ: CHCI
Slide 2: Disclosures
Disclosures This release includes “forward-looking” statements that are made pursuant to the safe harbor provisions of the Private Securities Litigation Reform Act of 1995. These forward-looking statements can be identified by use of words such as “anticipate,” “believe,” “estimate,” “may,” “intend,
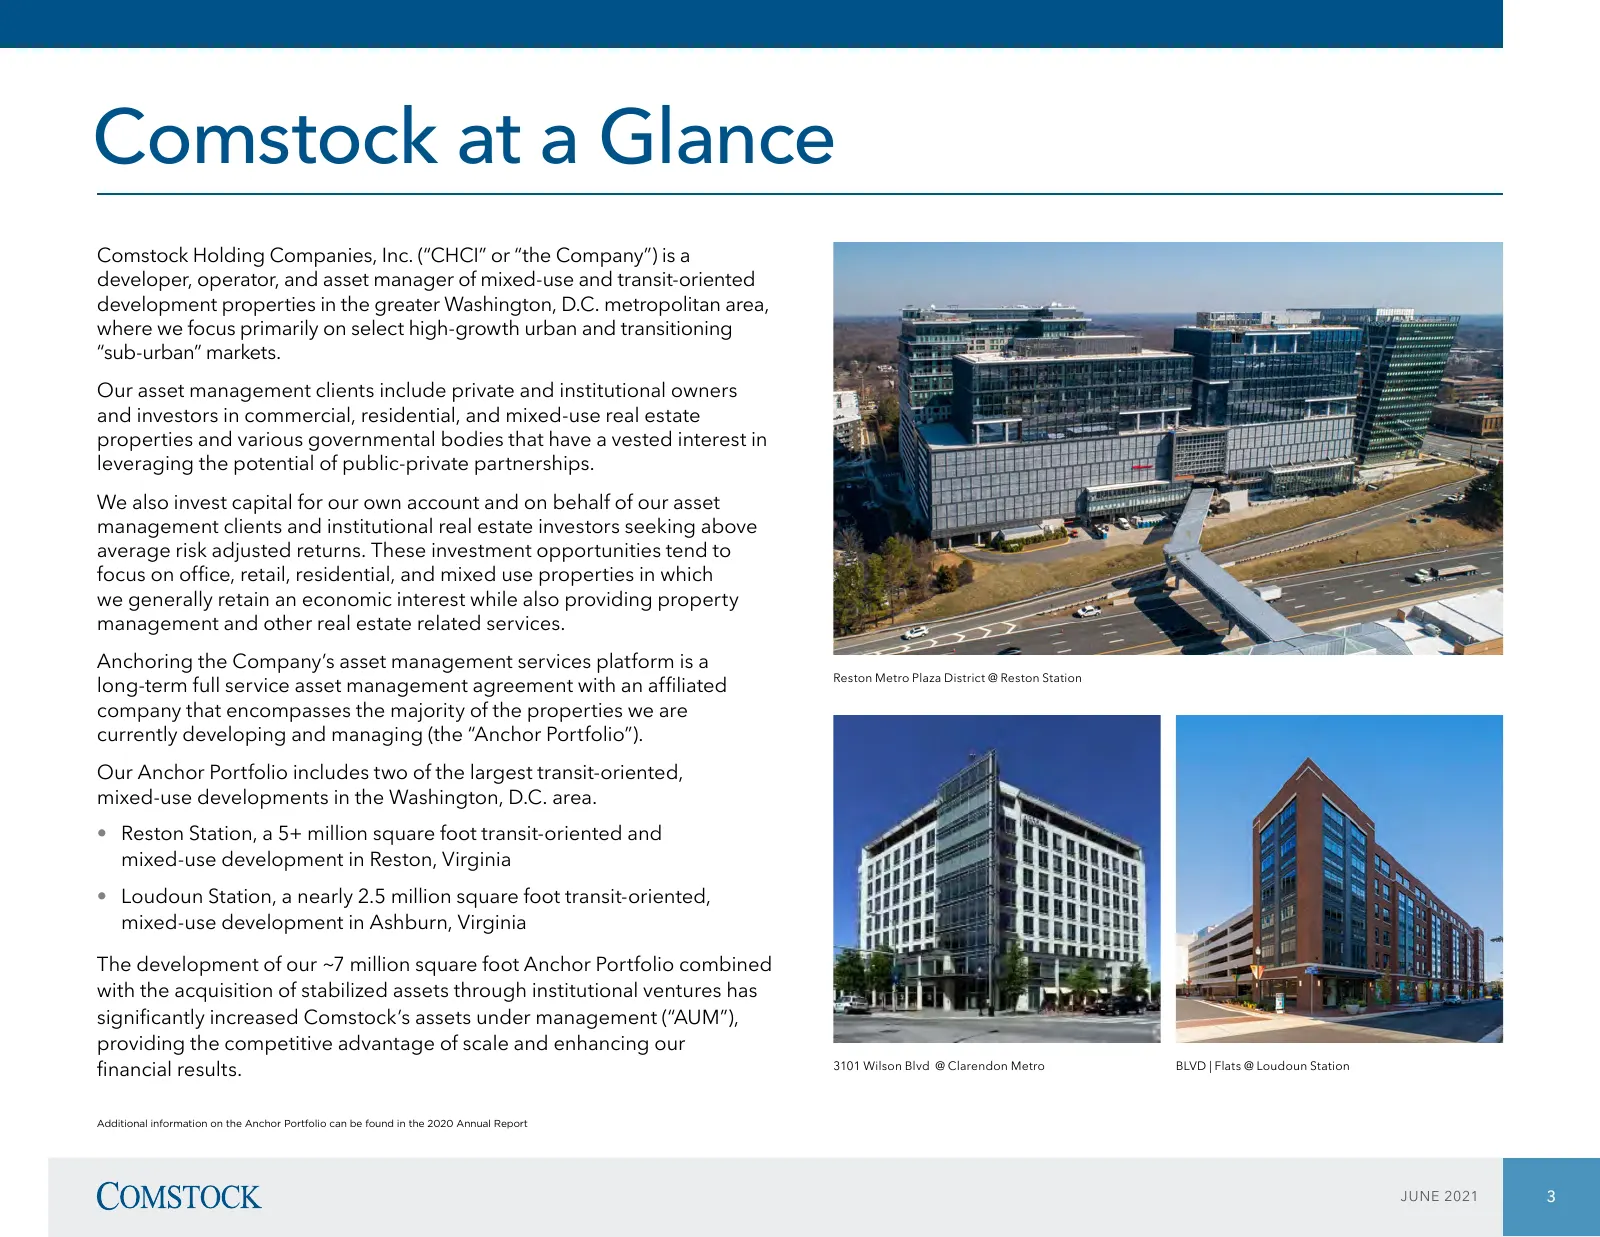
Slide 3: Comstock at a Glance
Comstock at a Glance Comstock Holding Companies, Inc. (“CHCI” or “the Company”) is a developer, operator, and asset manager of mixed-use and transit-oriented development properties in the greater Washington, D.C. metropolitan area, where we focus primarily on select high-growth urban and transitioni
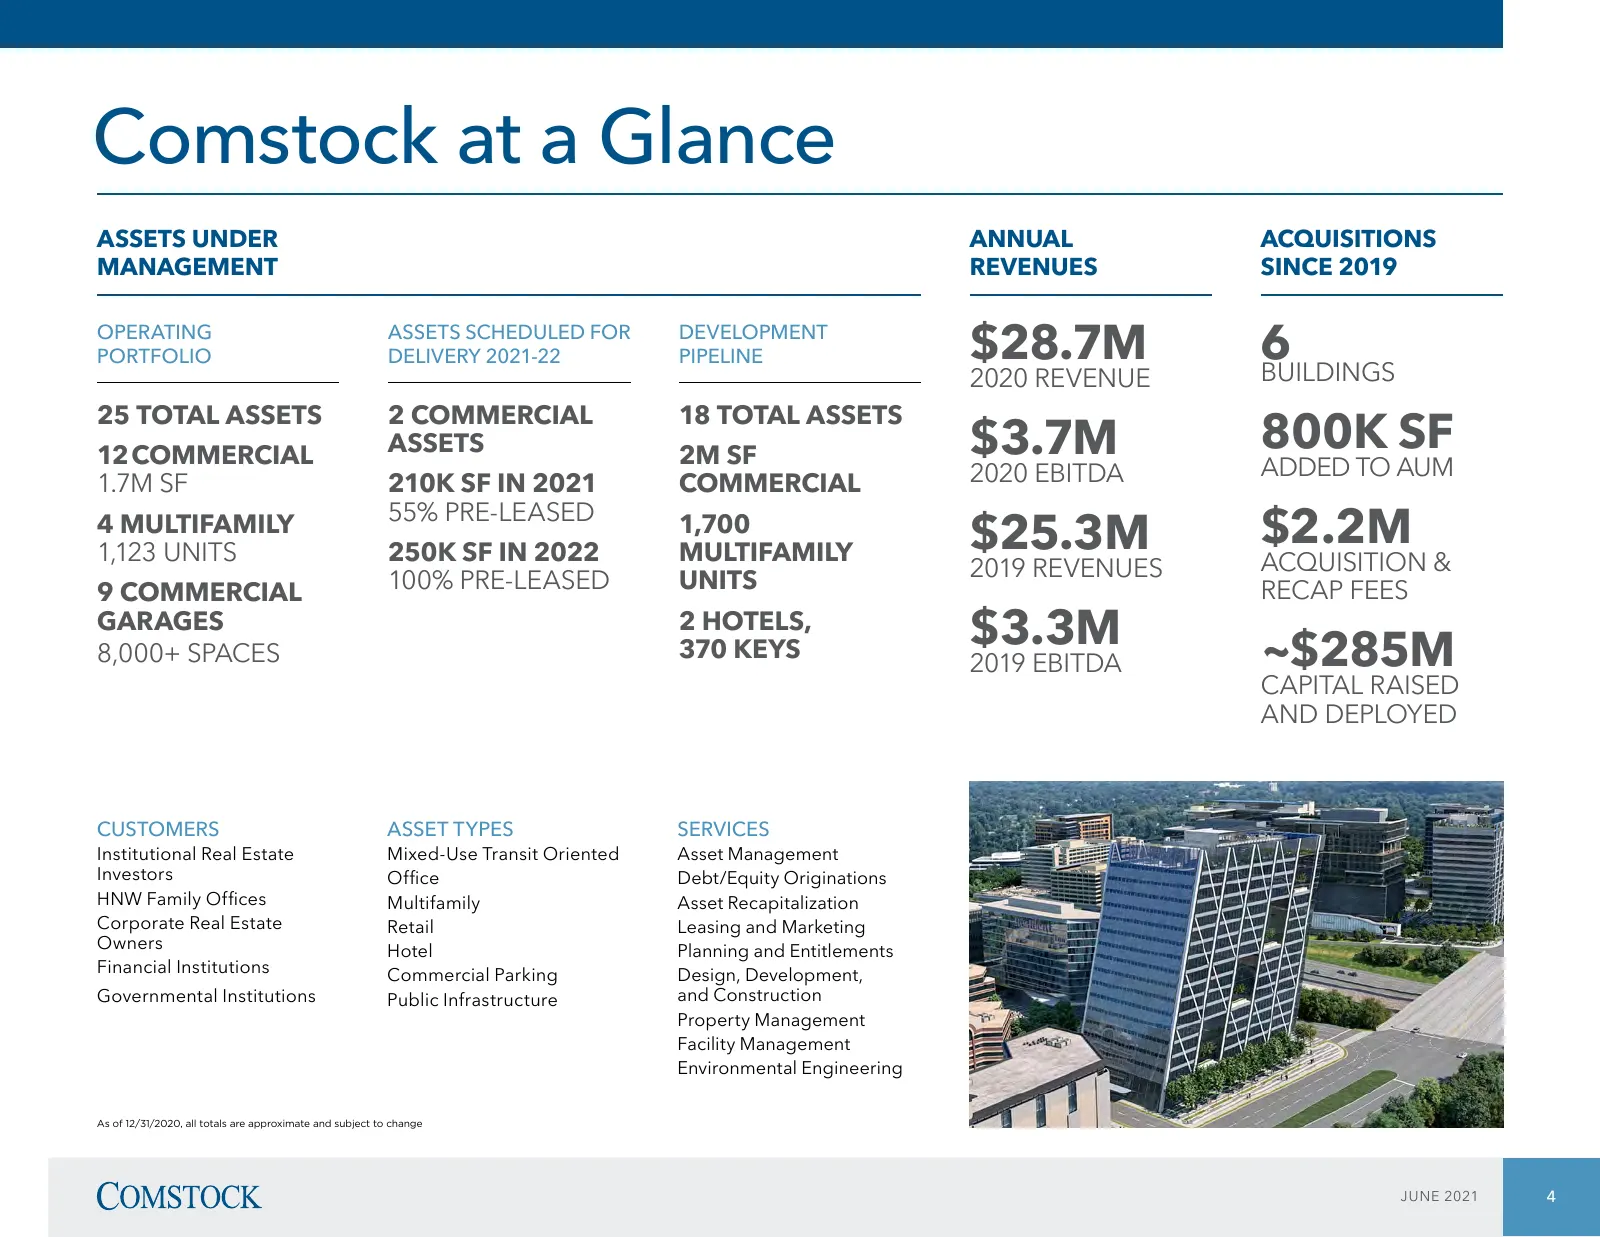
Slide 4: Comstock at a Glance
Comstock at a Glance ASSETS UNDER ANNUAL ACQUISITIONS MANAGEMENT REVENUES SINCE 2019 OPERATING PORTFOLIO ASSETS SCHEDULED FOR DELIVERY 2021-22 DEVELOPMENT PIPELINE $28.7M 6 BUILDINGS 2020 REVENUE 800K SF 25 TOTAL ASSETS 2 COMMERCIAL 18 TOTAL ASSETS 12 COMMERCIAL ASSETS 2M SF $3.7M ADDED TO AUM 1.7M
Slide 5: The Evolution of Reston Station
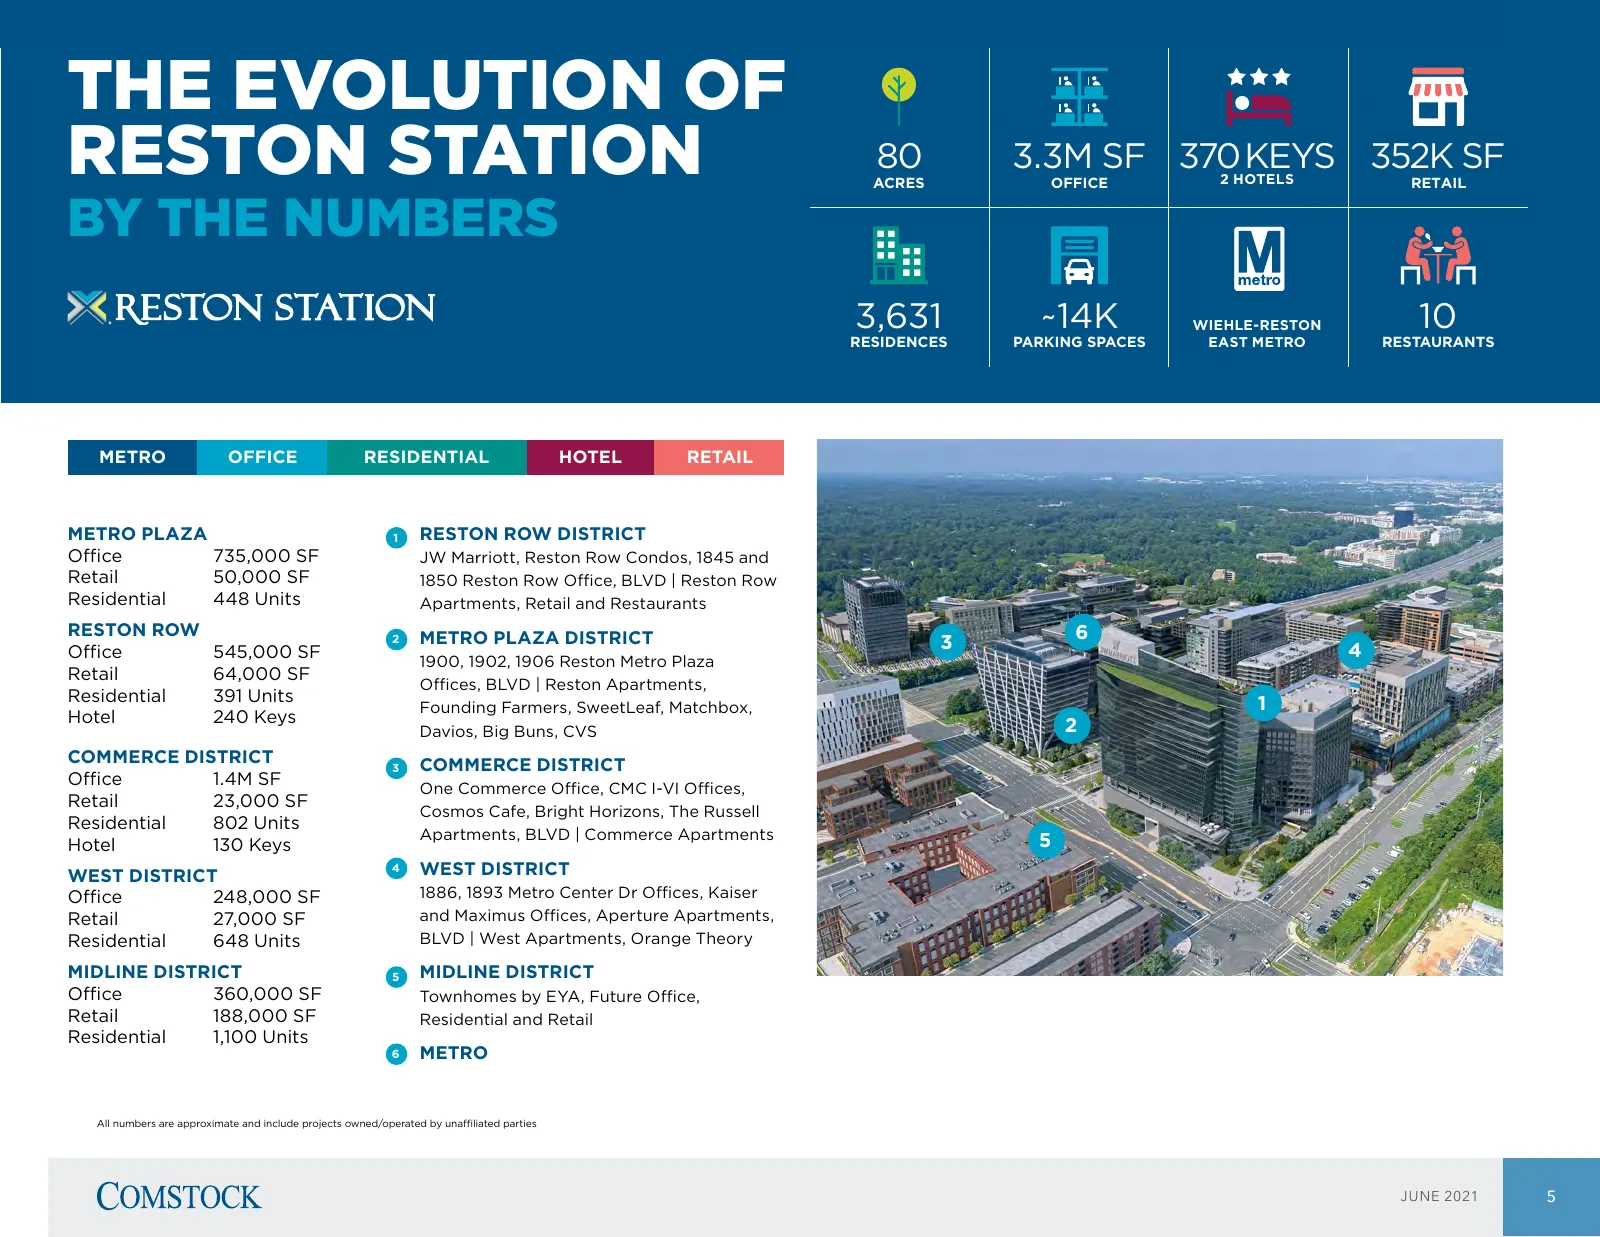
THE EVOLUTION OF RESTON STATION 80 ACRES 3.3M SF 370 OFFICE KEYS 352K SF 2 HOTELS RETAIL BY THE NUMBERS 3,631 ~14K WIEHLE-RESTON 10 RESIDENCES PARKING SPACES EAST METRO RESTAURANTS METRO OFFICE RESIDENTIAL HOTEL RETAIL METRO PLAZA 1 RESTON ROW DISTRICT Office 735,000 SF JW Marriott, Reston Row Condo
Slide 6: The Evolution of Loudoun Station
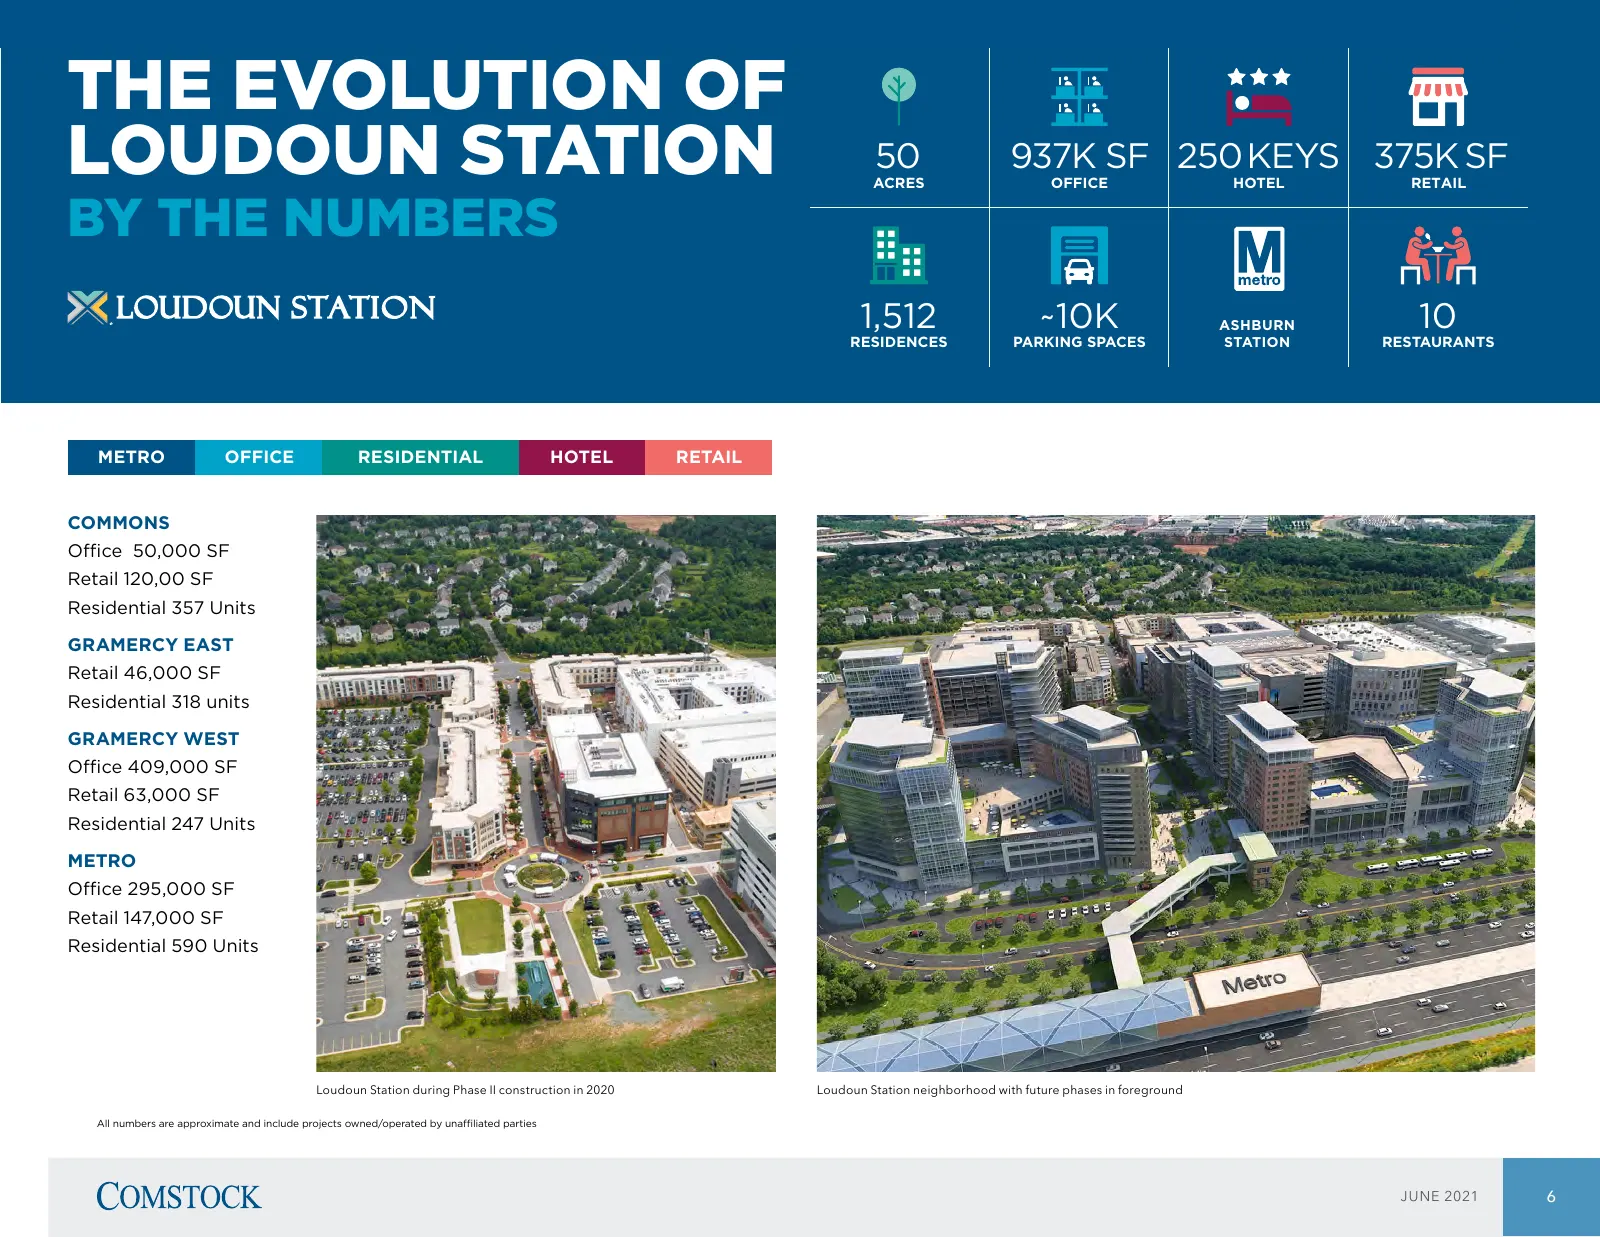
THE EVOLUTION OF LOUDOUN STATION 50 ACRES 937K SF 250 KEYS 375K SF OFFICE HOTEL RETAIL BY THE NUMBERS 1,512 ~10K ASHBURN 10 RESIDENCES PARKING SPACES STATION RESTAURANTS METRO OFFICE RESIDENTIAL HOTEL RETAIL COMMONS Office 50,000 SF Retail 120,00 SF Residential 357 Units GRAMERCY EAST Retail 46,000
Slide 7: Strategic Focus
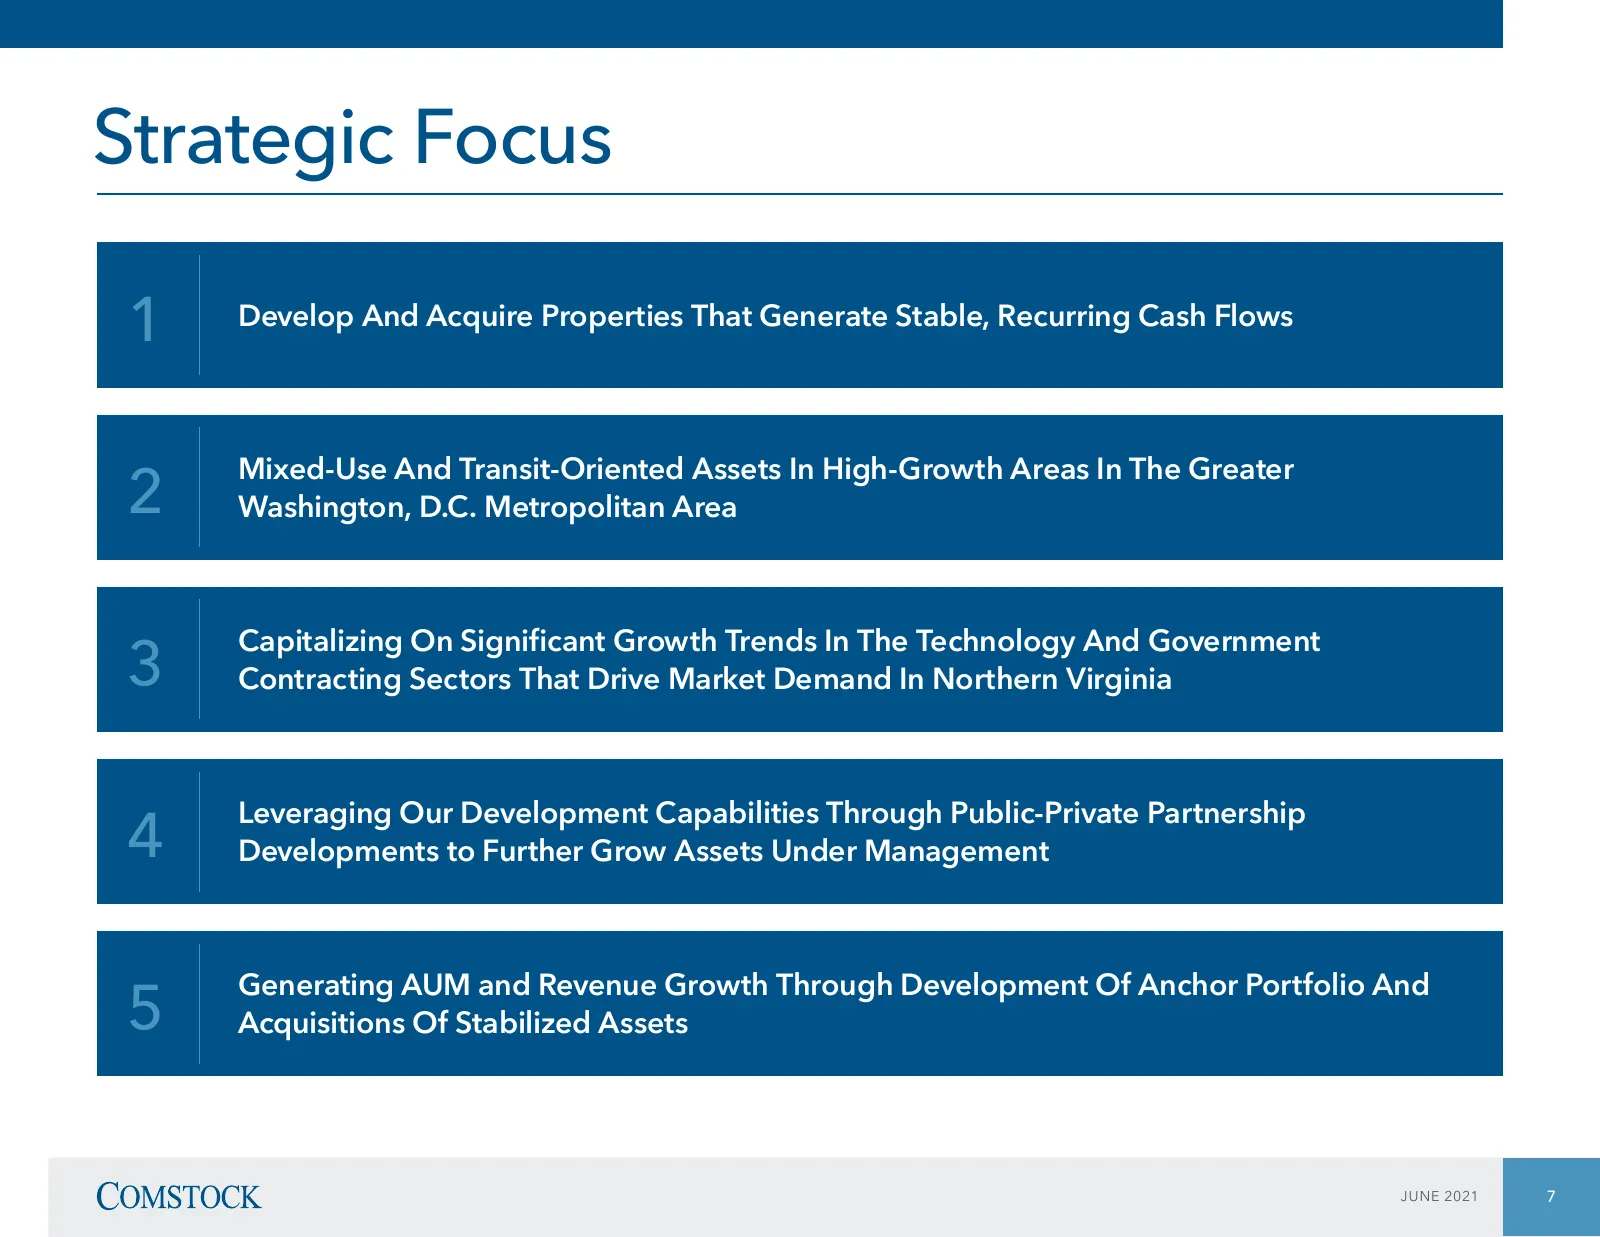
Strategic Focus 1 Develop And Acquire Properties That Generate Stable, Recurring Cash Flows 2 Mixed-Use And Transit-Oriented Assets In High-Growth Areas In The Greater Washington, D.C. Metropolitan Area 3 Capitalizing On Significant Growth Trends In The Technology And Government Contracting Sectors
Slide 8: Strategic Focus
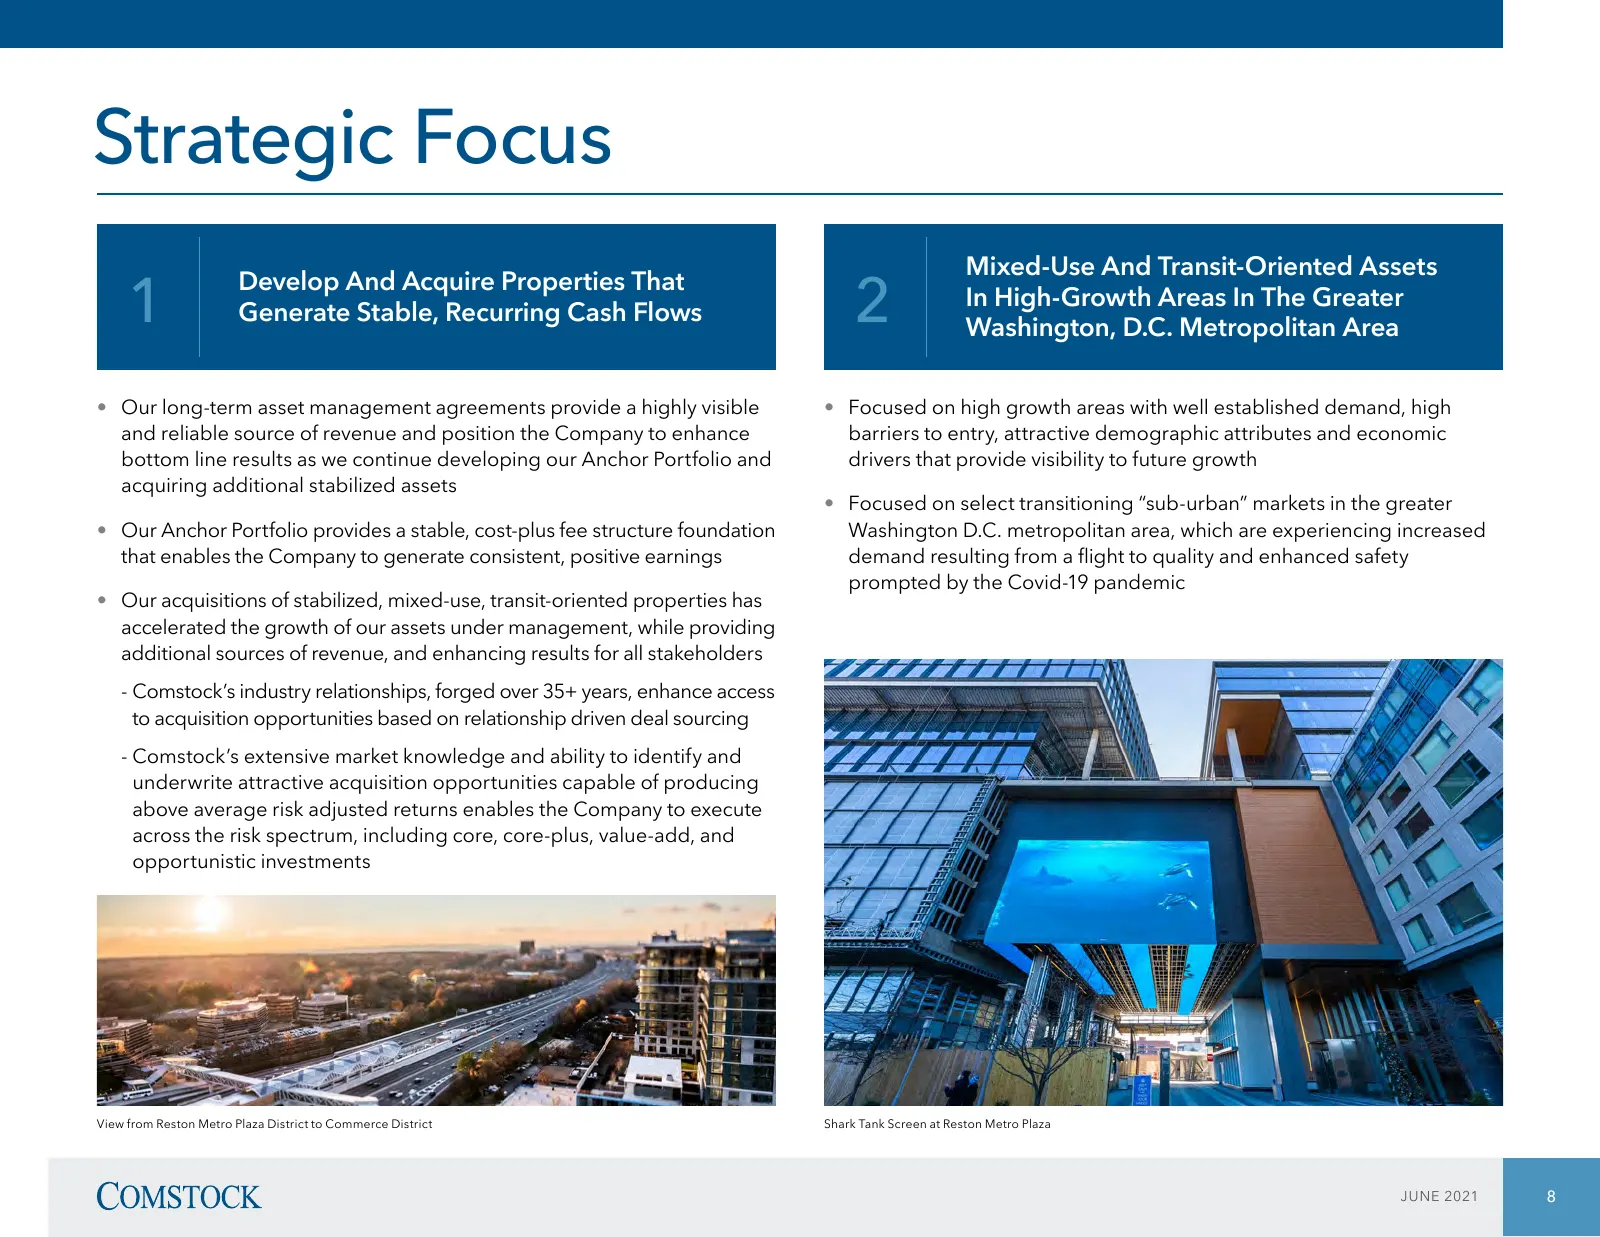
Strategic Focus Mixed-Use And Transit-Oriented Assets 1 2 Develop And Acquire Properties That In High-Growth Areas In The Greater Generate Stable, Recurring Cash Flows Washington, D.C. Metropolitan Area • Our long-term asset management agreements provide a highly visible • Focused on high growth are
Slide 9: Strategic Focus
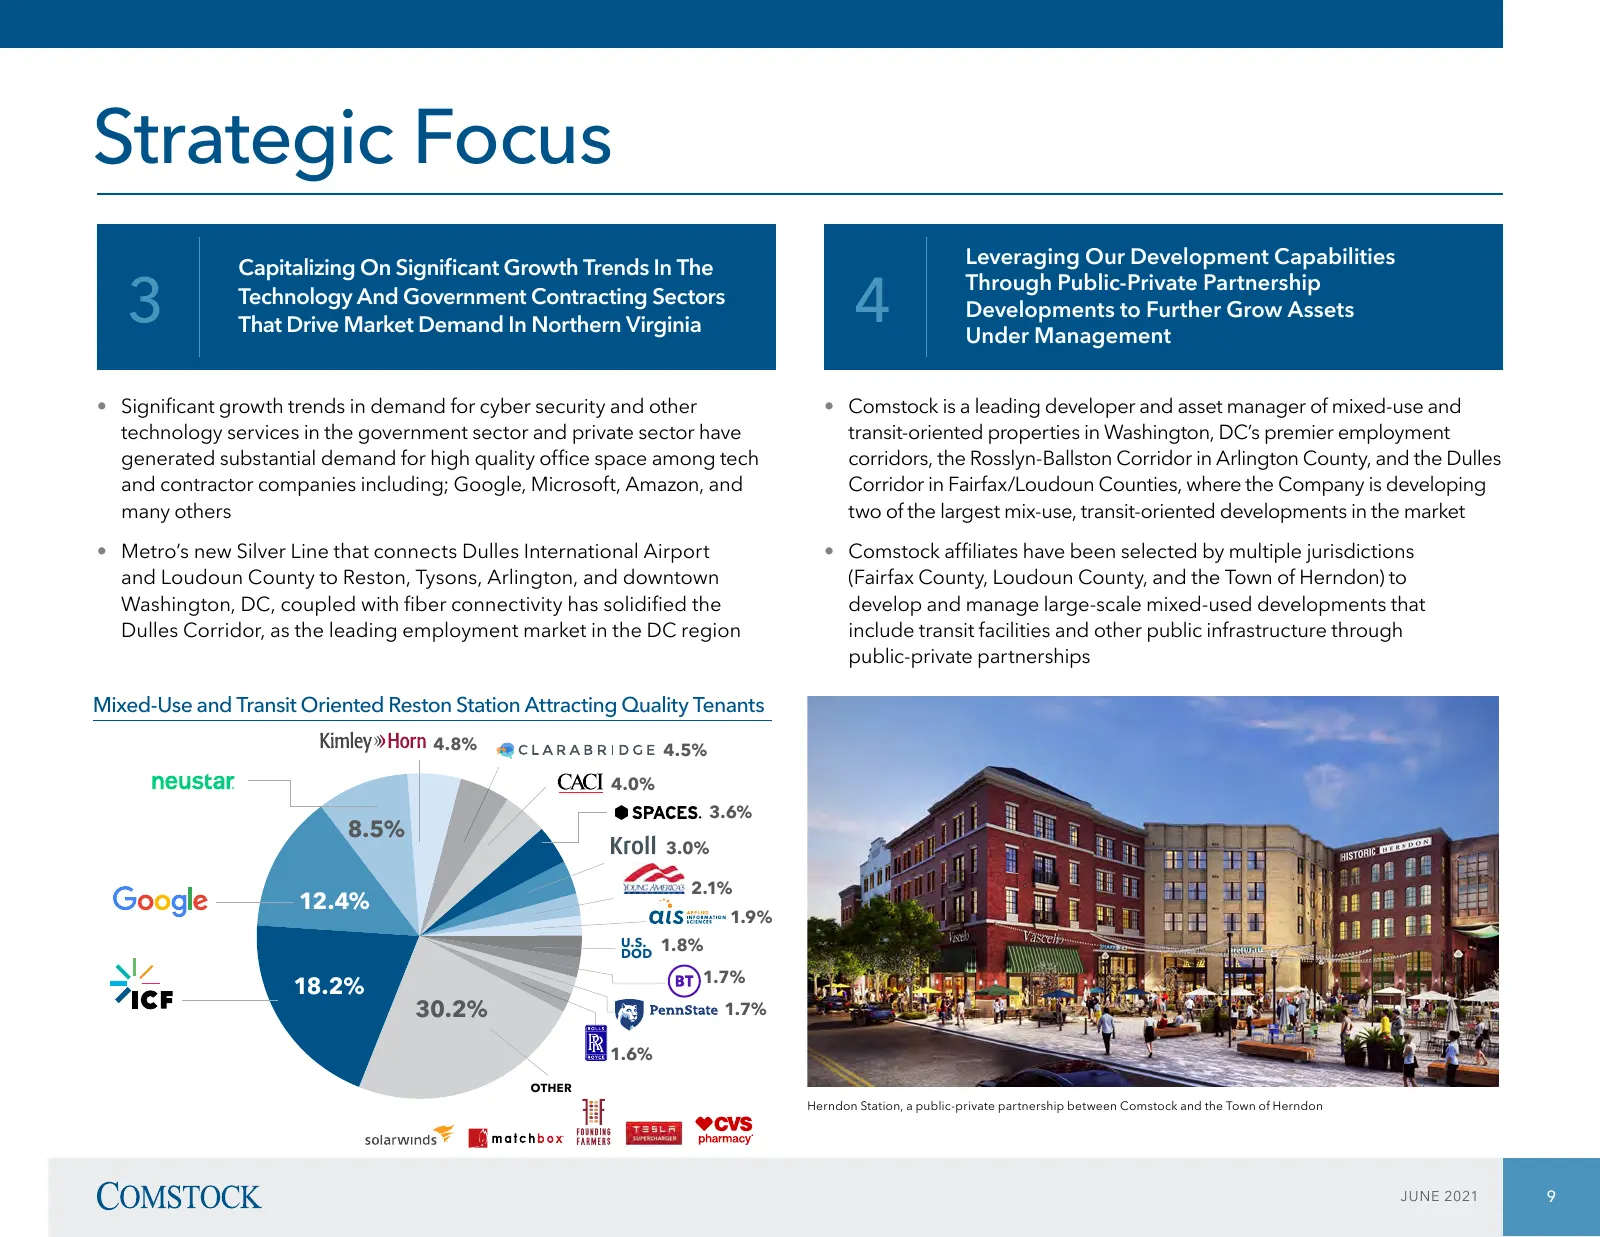
Strategic Focus Leveraging Our Development Capabilities 3 4 Capitalizing On Significant Growth Trends In The Through Public-Private Partnership Technology And Government Contracting Sectors Developments to Further Grow Assets That Drive Market Demand In Northern Virginia Under Management • Significa
Slide 10: Strategic Focus: AUM Growth Targets
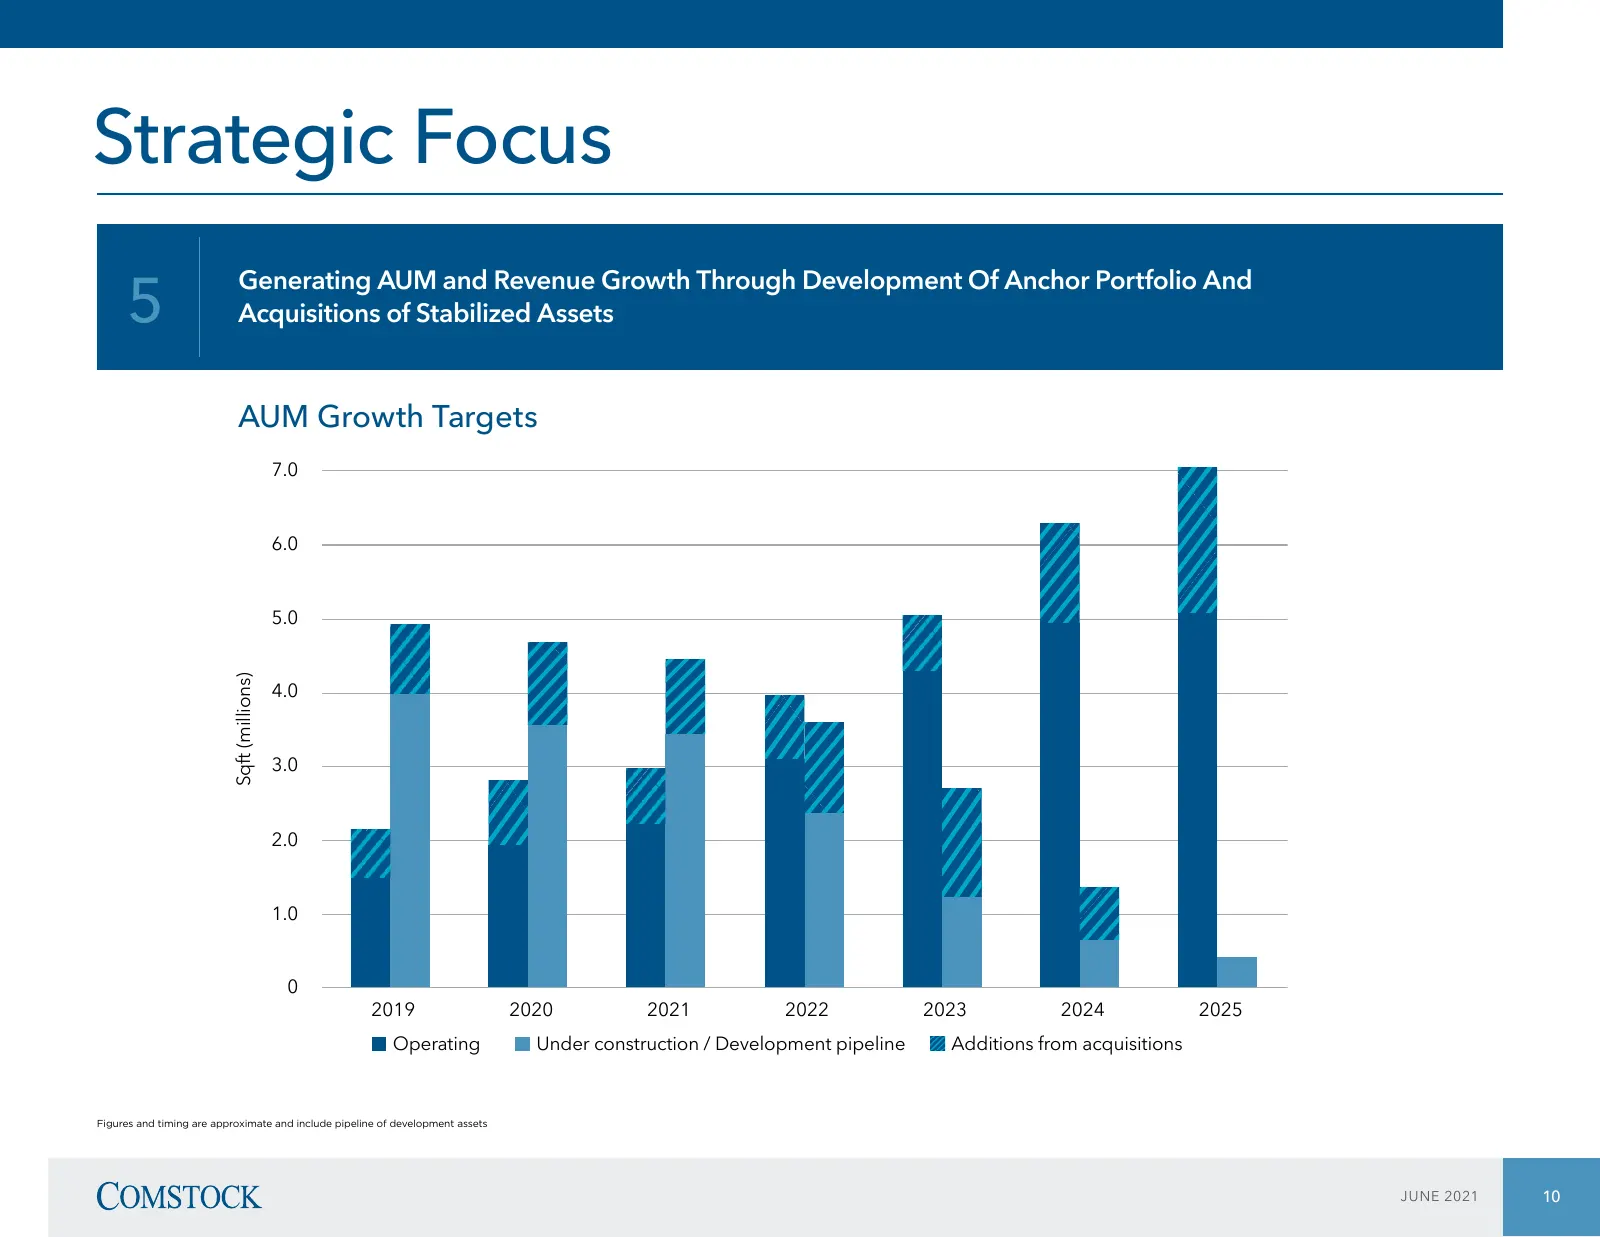
Strategic Focus 5 Generating AUM and Revenue Growth Through Development Of Anchor Portfolio And Acquisitions of Stabilized Assets AUM Growth Targets 7.0 6.0 5.0 Sqft (millions) 4.0 3.0 2.0 1.0 0 2019 2020 2021 2022 2023 2024 2025 Operating Under construction / Development pipeline Additions from acq
Slide 11: How Comstock Generates Revenues
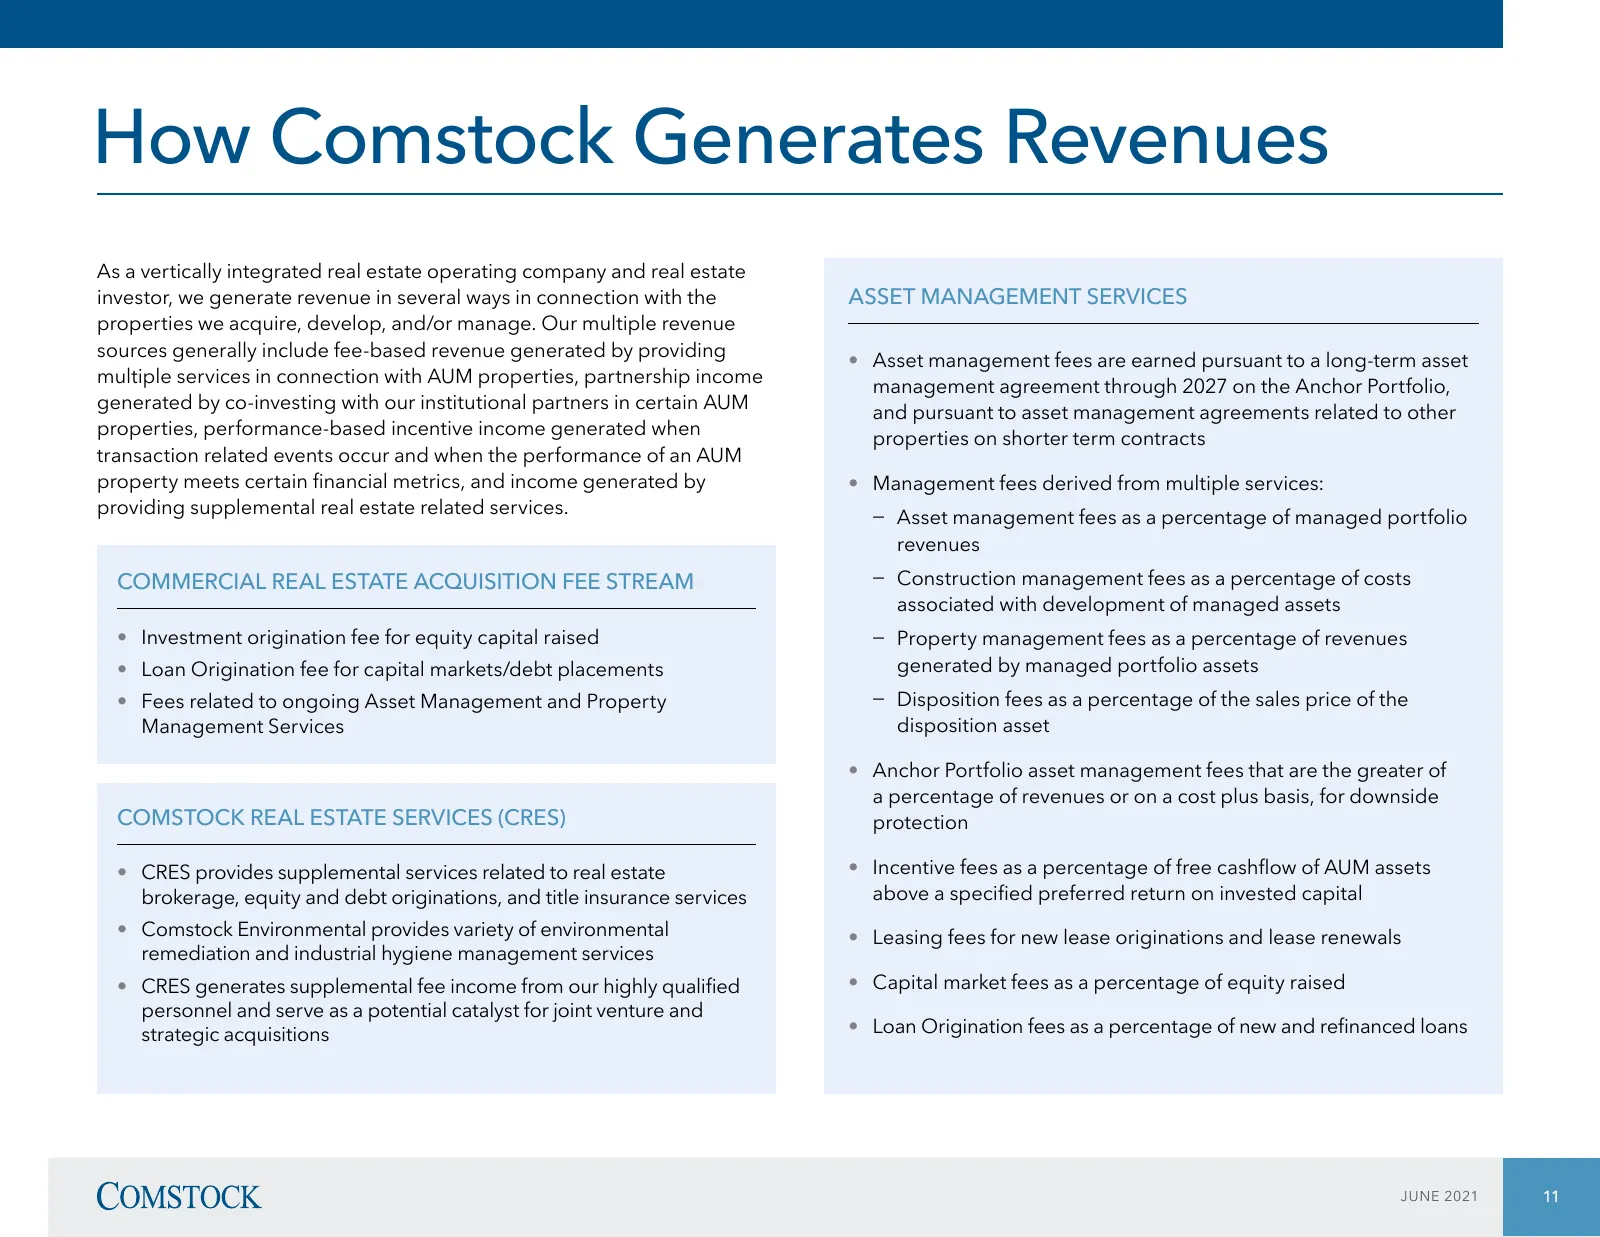
How Comstock Generates Revenues As a vertically integrated real estate operating company and real estate investor, we generate revenue in several ways in connection with the ASSET MANAGEMENT SERVICES properties we acquire, develop, and/or manage. Our multiple revenue sources generally include fee-ba
Slide 12: Generating Reliable Positive Quarterly Operating Income
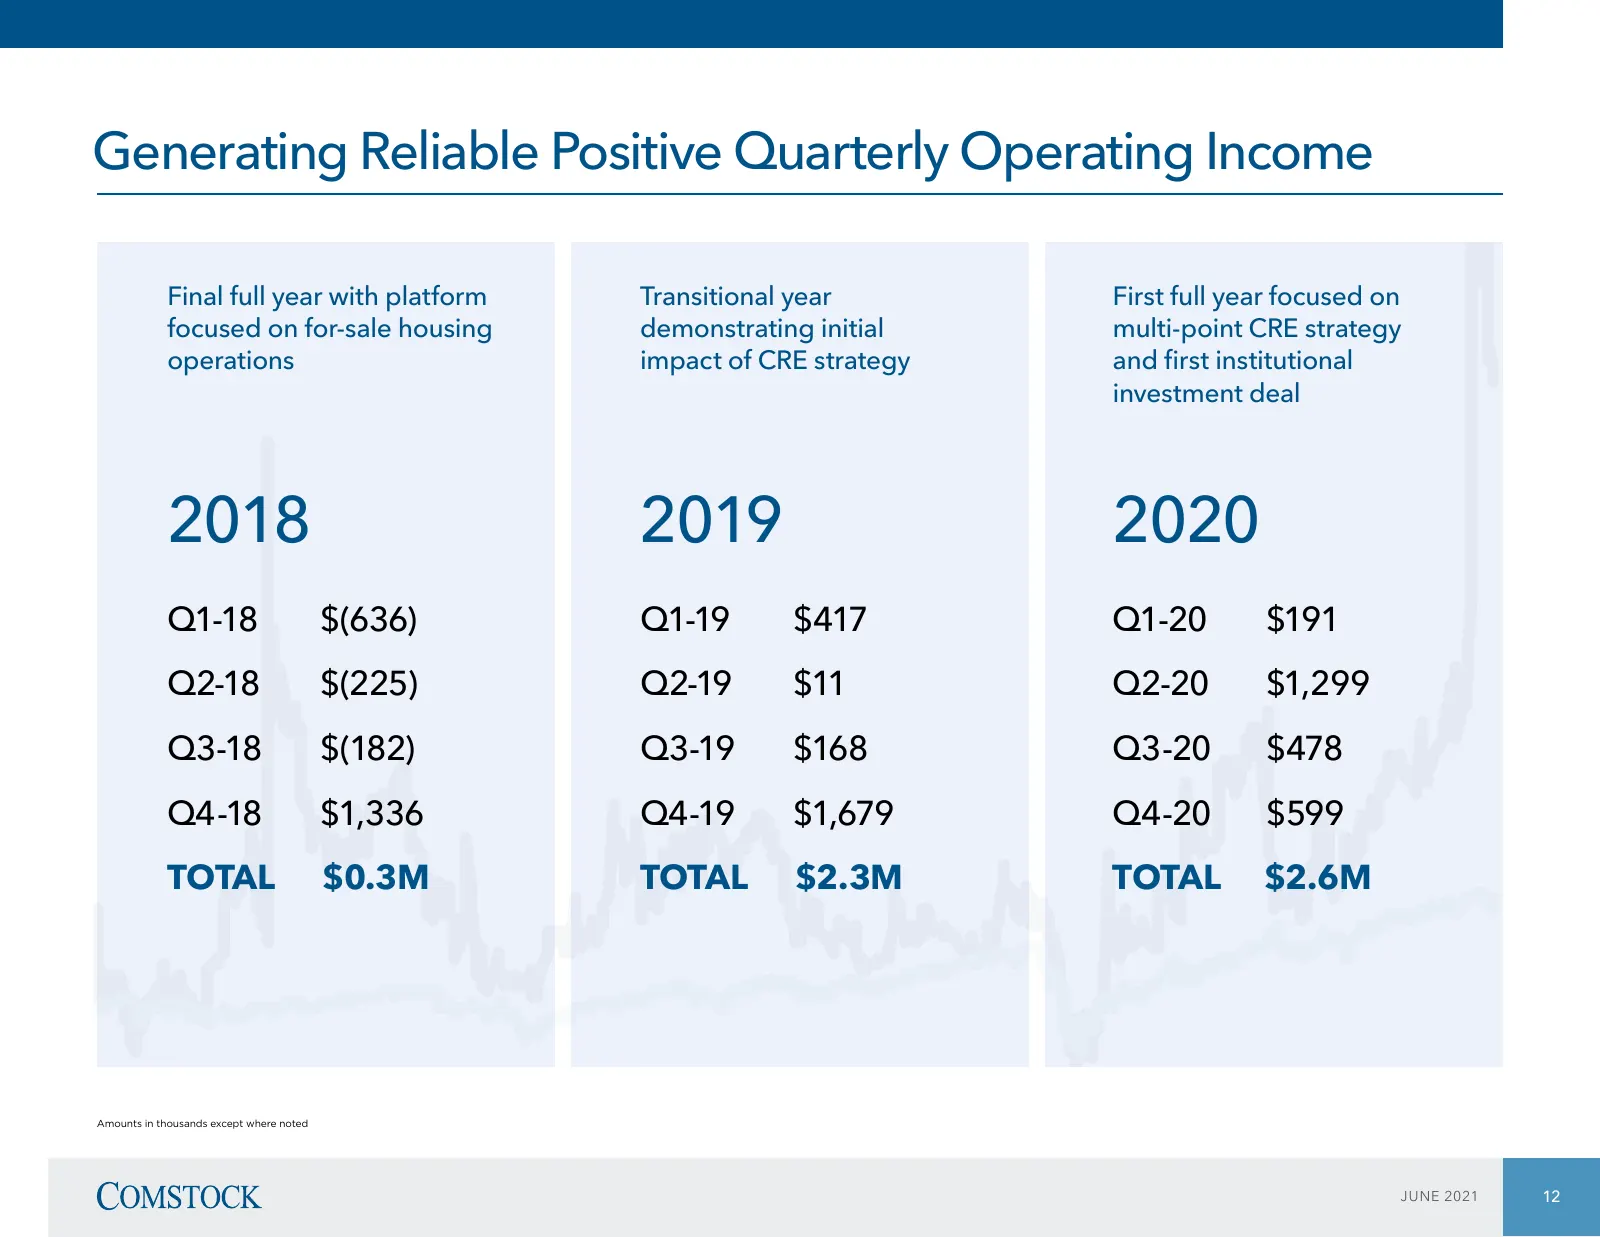
00 Generating Reliable Positive Quarterly Operating Income 00 Final full year with platform Transitional year First full year focused on focused on for-sale housing demonstrating initial multi-point CRE strategy operations impact of CRE strategy and first institutional investment deal 00 2018 2019 2
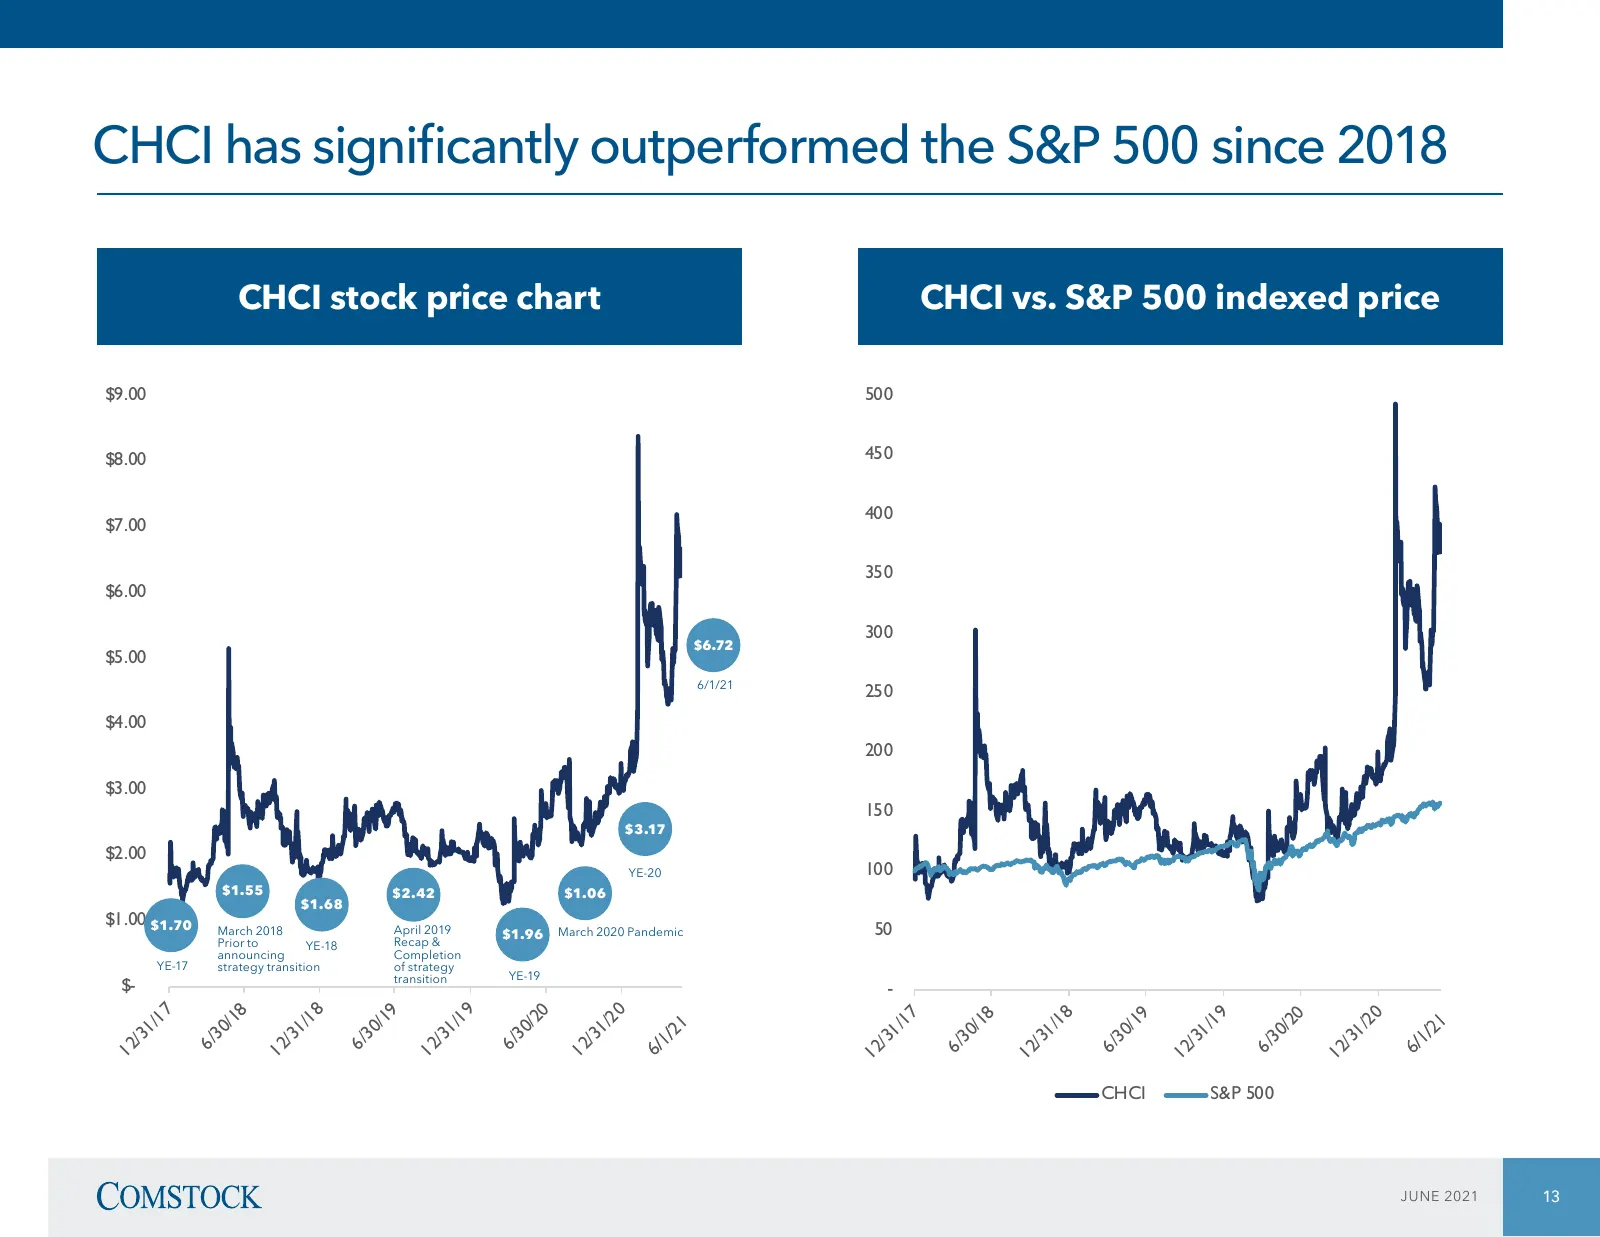
Slide 13: CHCI has significantly outperformed the S&P 500 since 2018
CHCI CHCI CHCIhas significantly hashas significantly outperformed significantly outperformedthe outperformed S&P the the 500 since 2018 S&P500 S&P500 since since 2018 2018 CHCI stock price chart CHCI vs. S&P 500 indexed price CHCICHCI stockstock price price chartchart CHCICHCI vs. S&P vs.500 S&Pinde
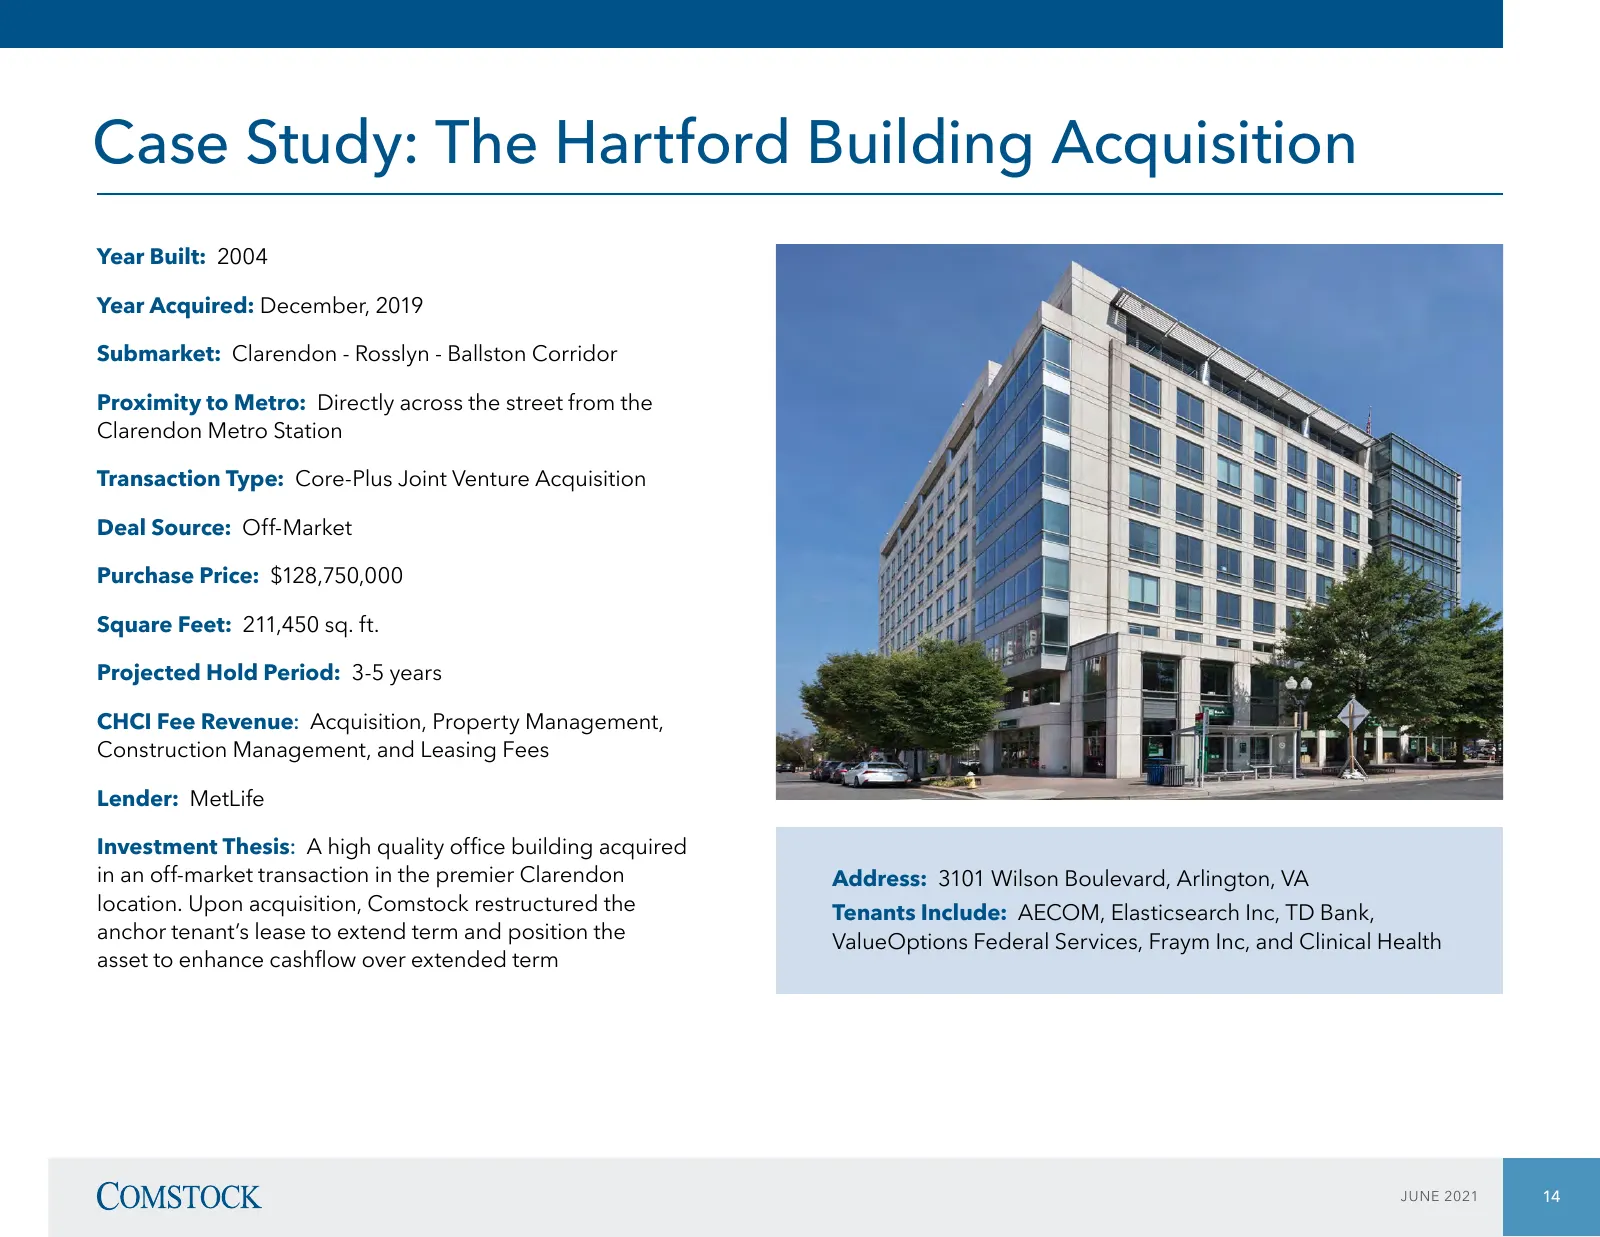
Slide 14: Case Study: The Hartford Building Acquisition
Case Study: The Hartford Building Acquisition Year Built: 2004 Year Acquired: December, 2019 Submarket: Clarendon - Rosslyn - Ballston Corridor Proximity to Metro: Directly across the street from the Clarendon Metro Station Transaction Type: Core-Plus Joint Venture Acquisition Deal Source: Off-Marke
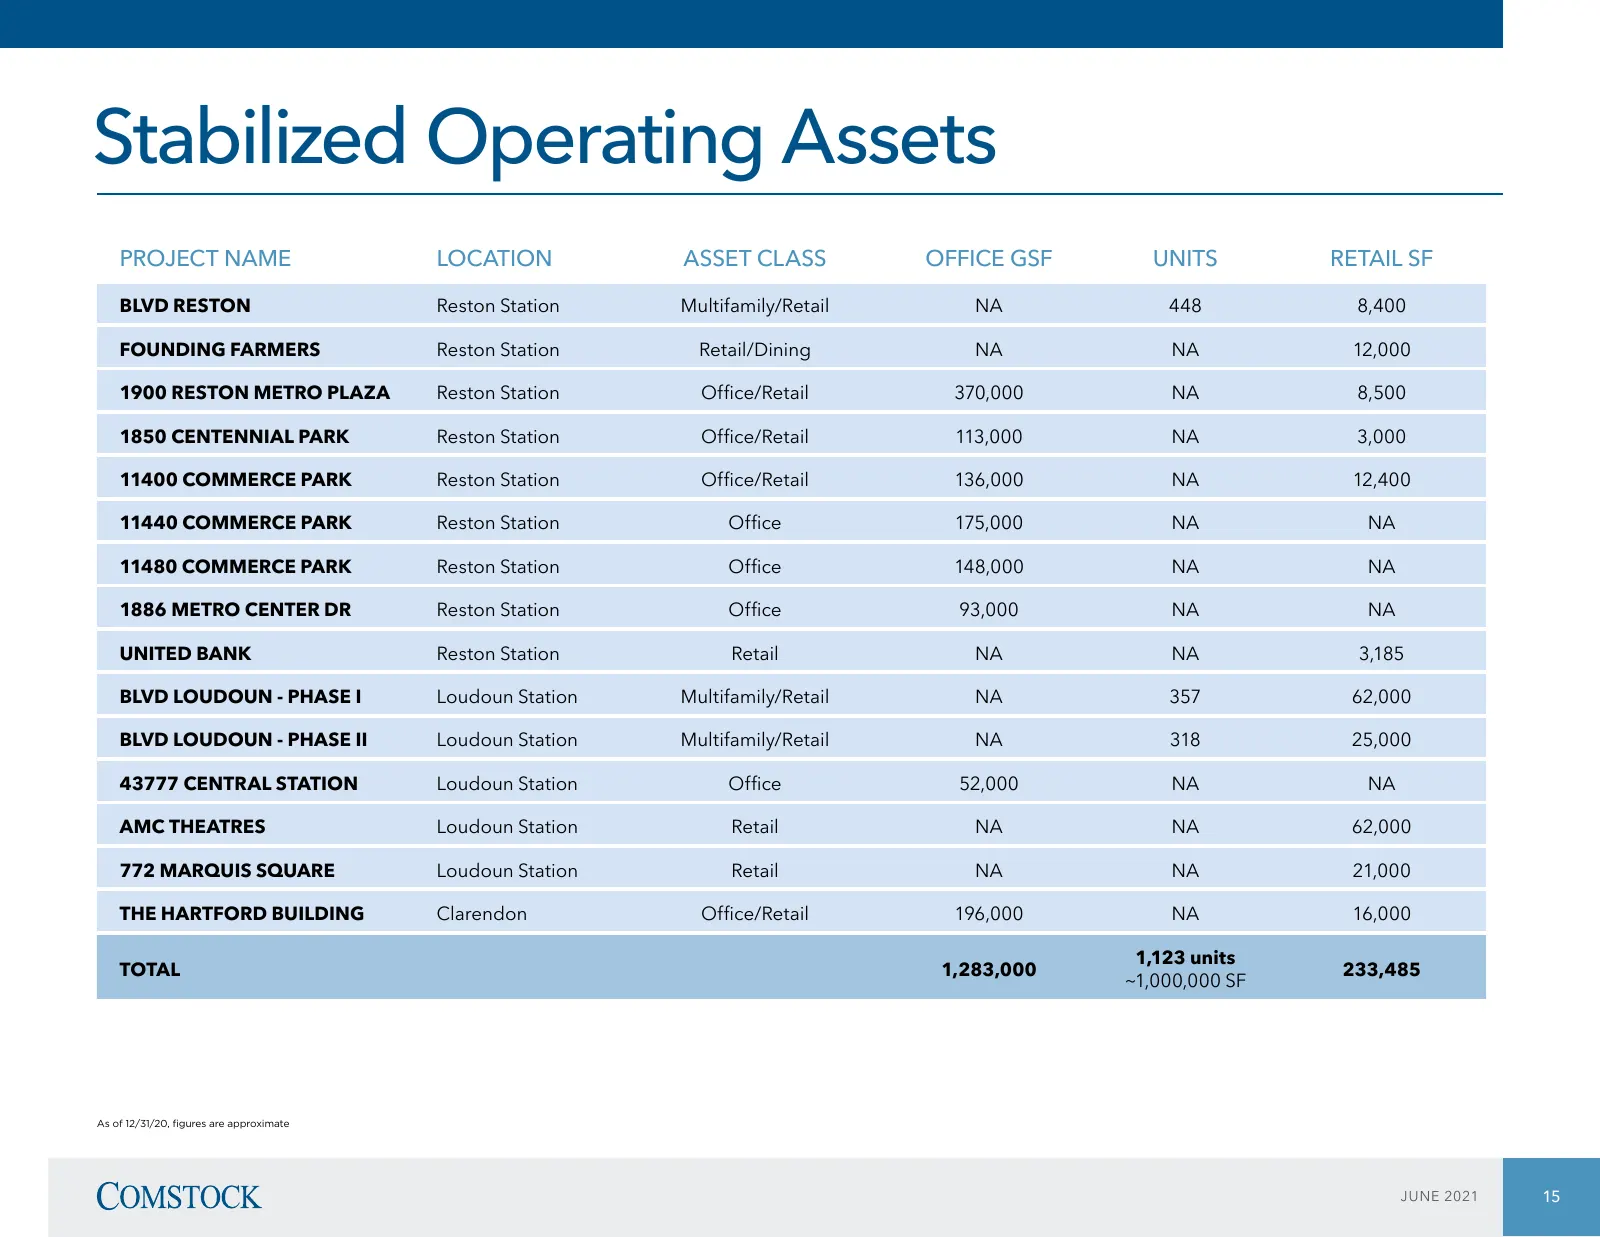
Slide 15: Stabilized Operating Assets
Stabilized Operating Assets PROJECT NAME LOCATION ASSET CLASS OFFICE GSF UNITS RETAIL SF BLVD RESTON Reston Station Multifamily/Retail NA 448 8,400 FOUNDING FARMERS Reston Station Retail/Dining NA NA 12,000 1900 RESTON METRO PLAZA Reston Station Office/Retail 370,000 NA 8,500 1850 CENTENNIAL PARK Re
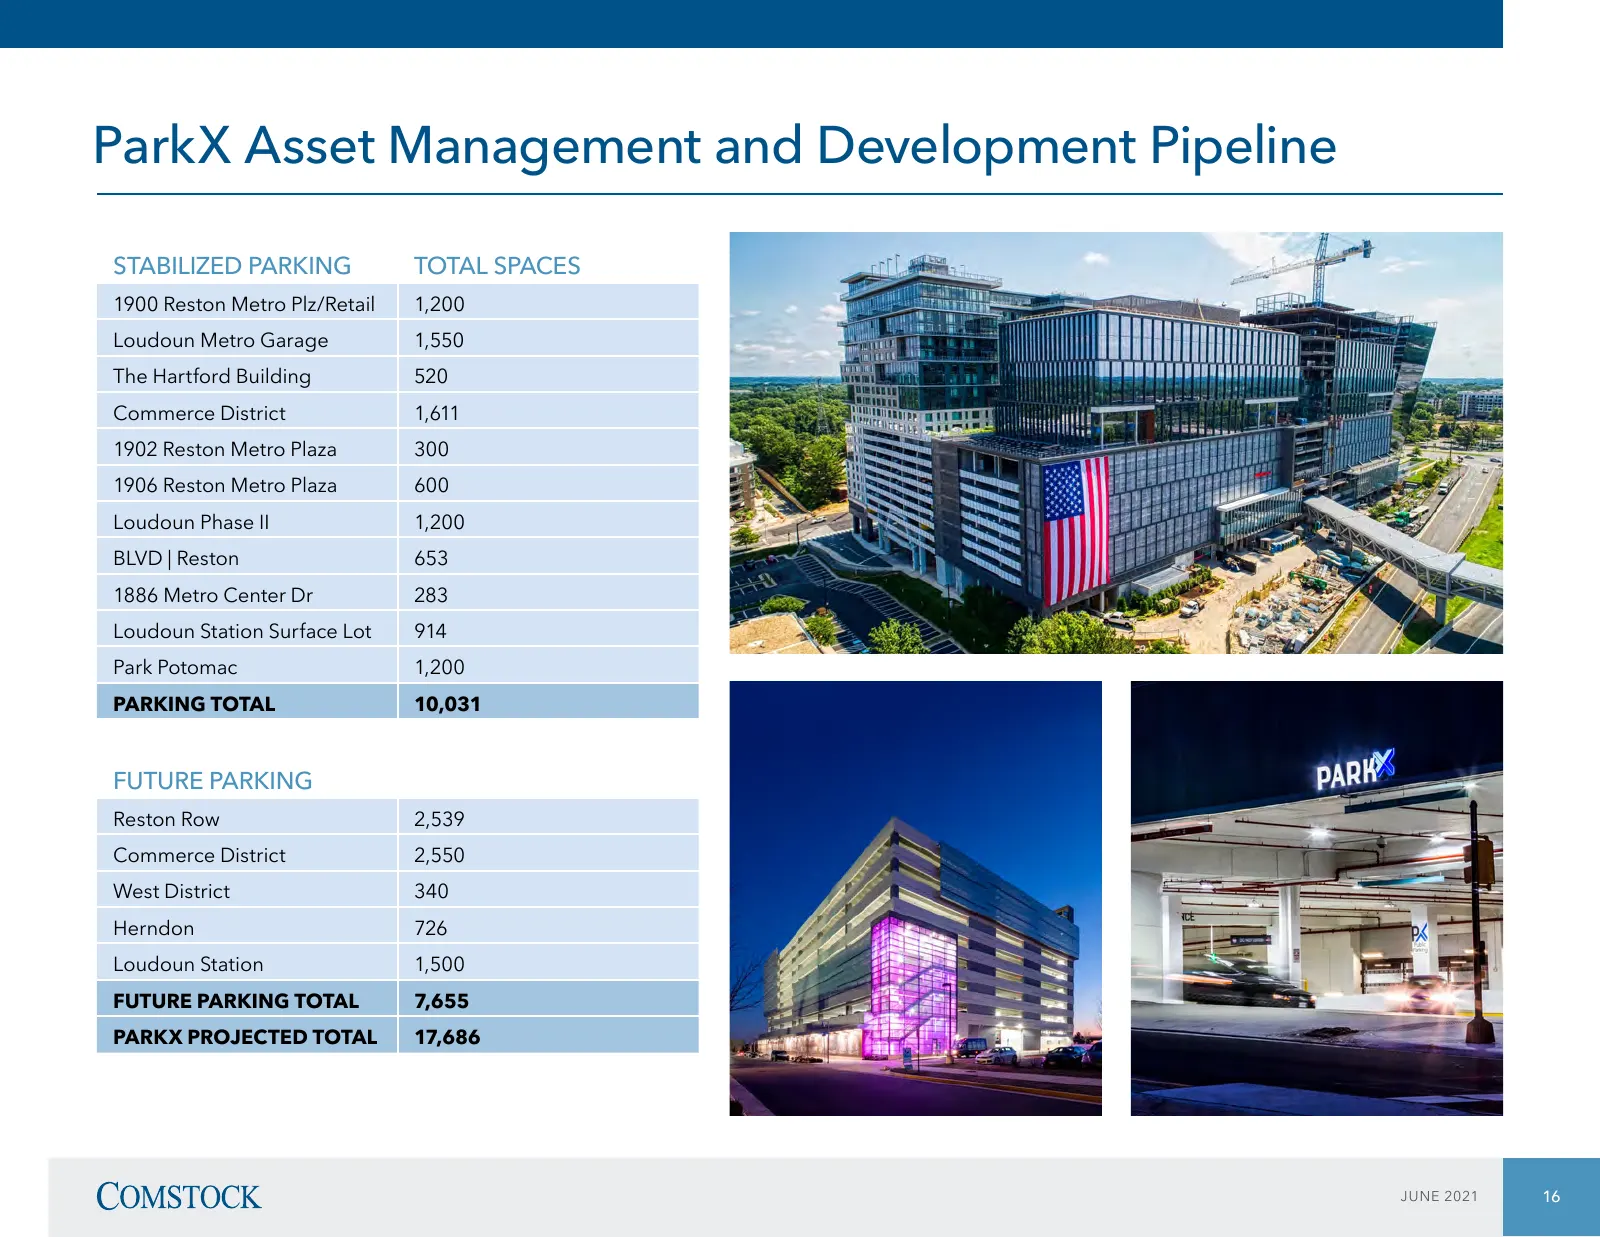
Slide 16: ParkX Asset Management and Development Pipeline
ParkX Asset Management and Development Pipeline STABILIZED PARKING TOTAL SPACES 1900 Reston Metro Plz/Retail 1,200 Loudoun Metro Garage 1,550 The Hartford Building 520 Commerce District 1,611 1902 Reston Metro Plaza 300 1906 Reston Metro Plaza 600 Loudoun Phase II 1,200 BLVD | Reston 653 1886 Metro
Slide 17: Active Development Pipeline
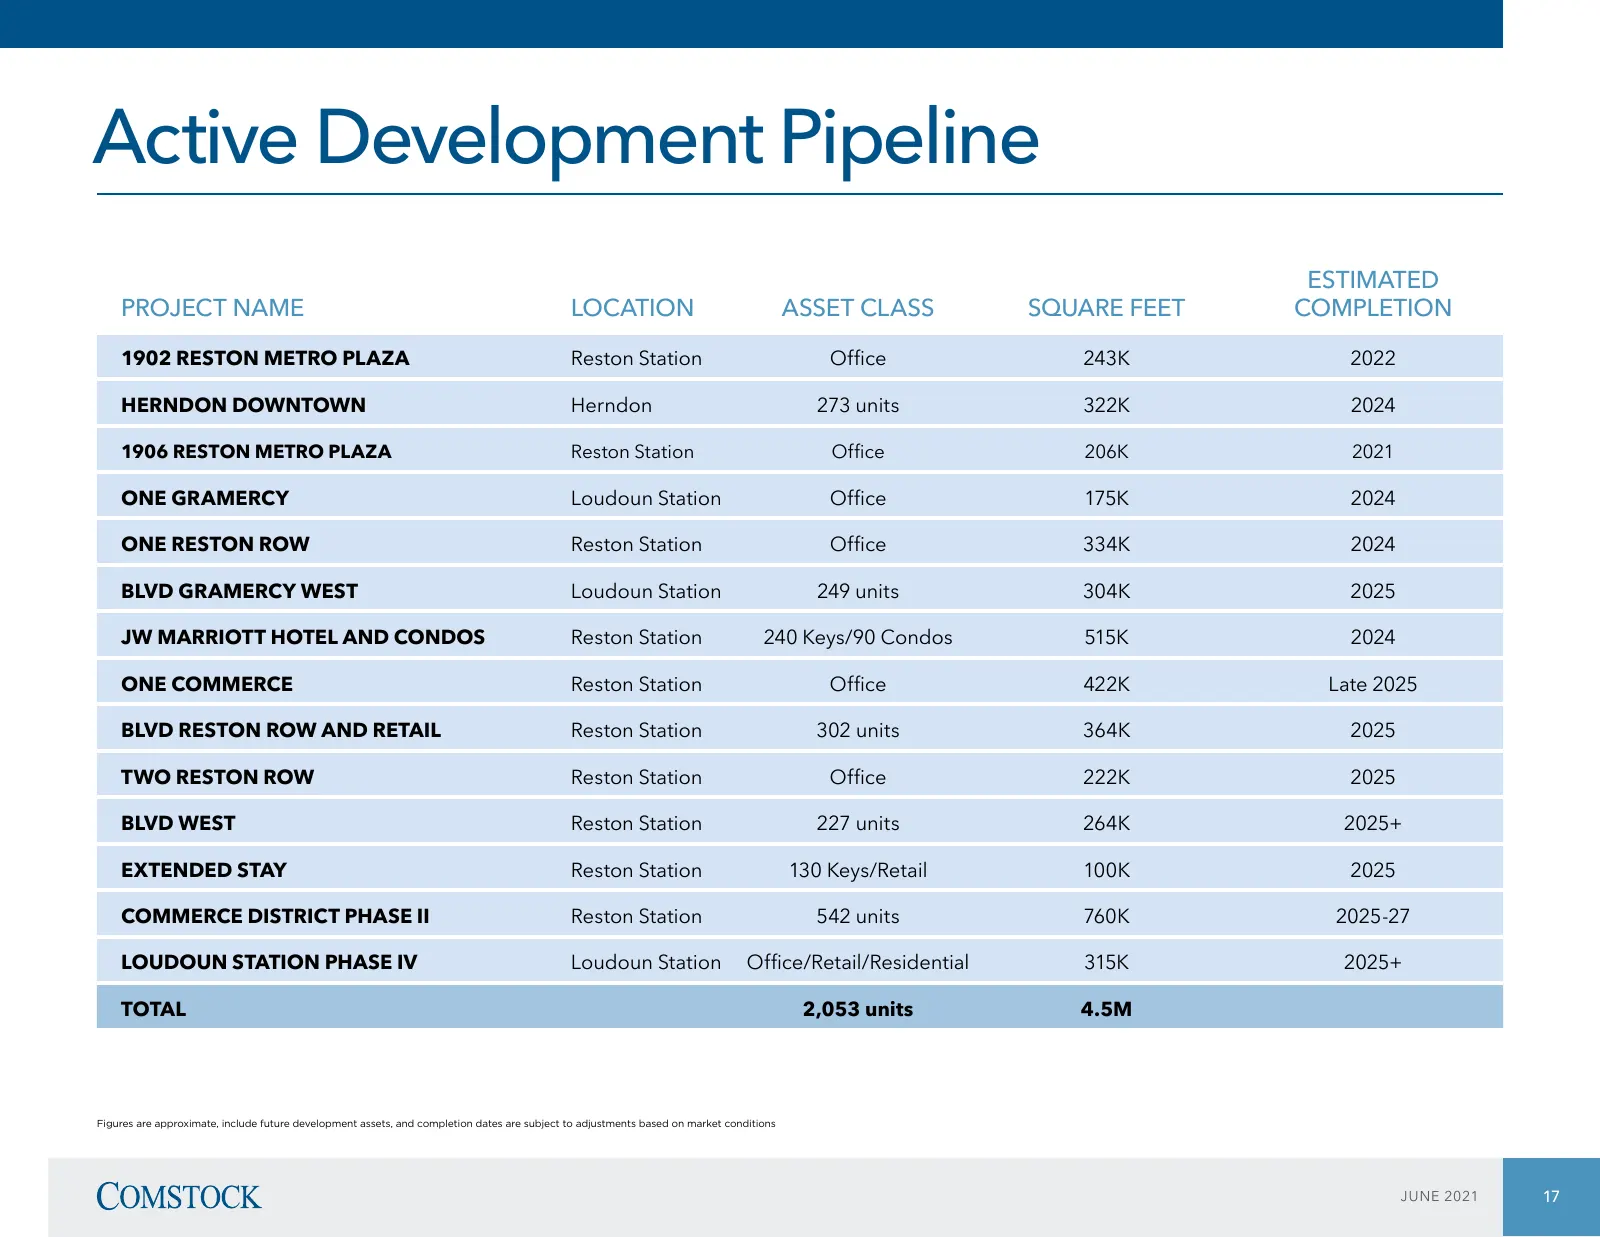
Active Development Pipeline ESTIMATED PROJECT NAME LOCATION ASSET CLASS SQUARE FEET COMPLETION 1902 RESTON METRO PLAZA Reston Station Office 243K 2022 HERNDON DOWNTOWN Herndon 273 units 322K 2024 1906 RESTON METRO PLAZA Reston Station Office 206K 2021 ONE GRAMERCY Loudoun Station Office 175K 2024 ON
Slide 18: Resilient, Diversified Economy In The Dulles Technology Corridor
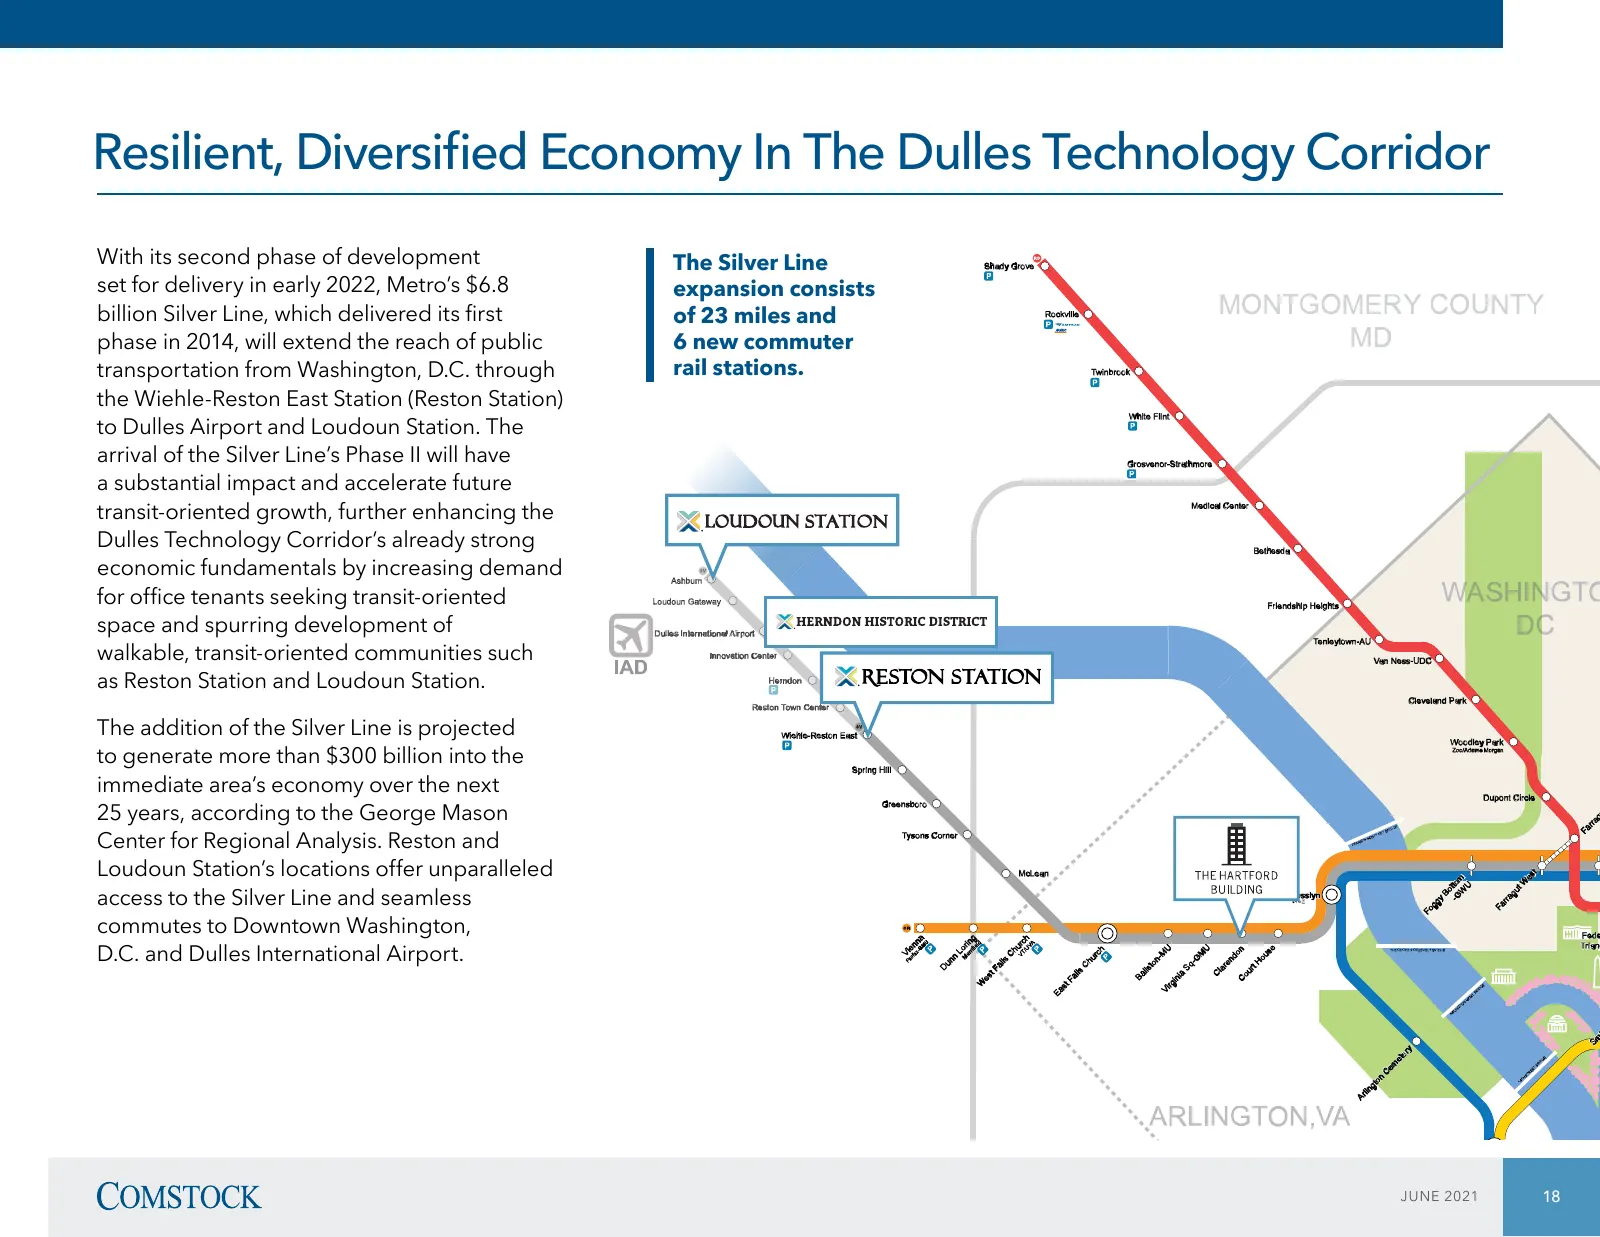
Resilient, Diversified Economy In The Dulles Technology Corridor With its second phase of development The Silver Line set for delivery in early 2022, Metro’s $6.8 expansion consists billion Silver Line, which delivered its first of 23 miles and phase in 2014, will extend the reach of public 6 new co
Slide 19: Northern Virginia Market
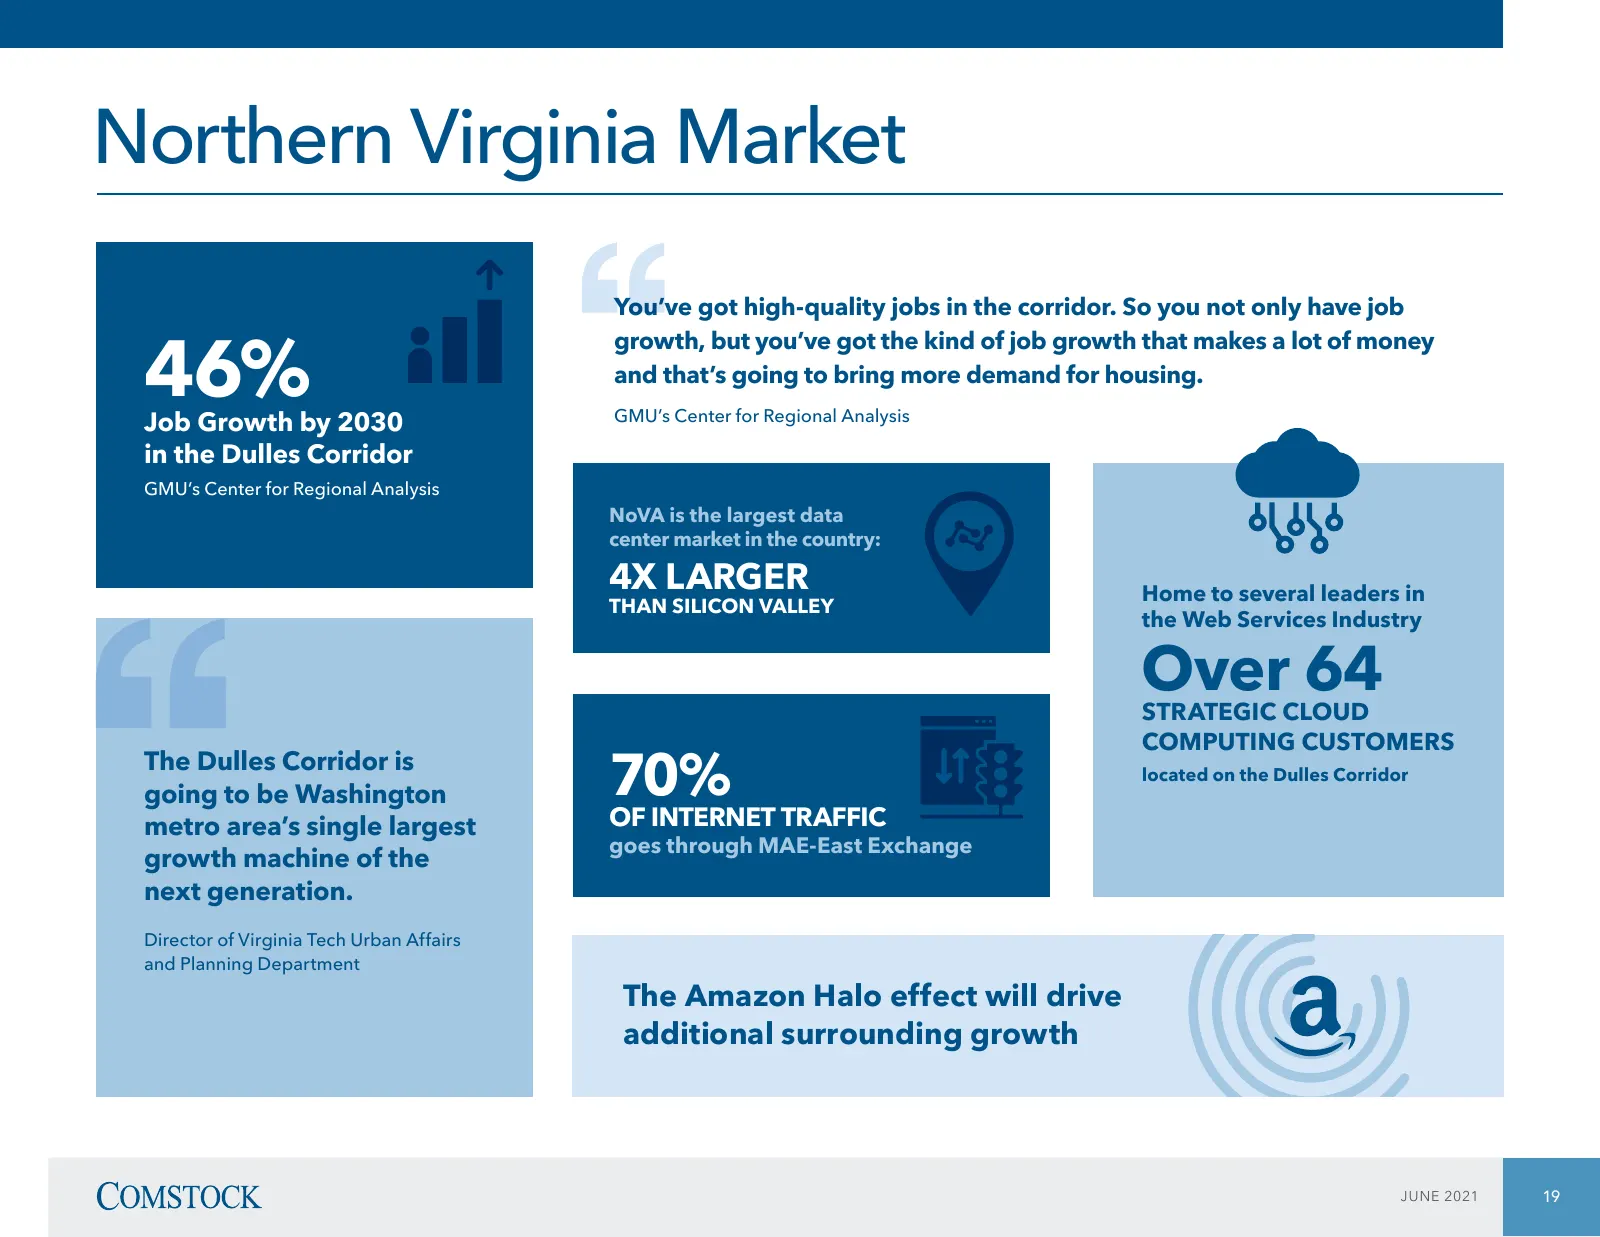
Northern Virginia Market You’ve got high-quality jobs in the corridor. So you not only have job 46% growth, but you’ve got the kind of job growth that makes a lot of money and that’s going to bring more demand for housing. Job Growth by 2030 GMU’s Center for Regional Analysis in the Dulles Corridor
Slide 20: ESG Initiatives
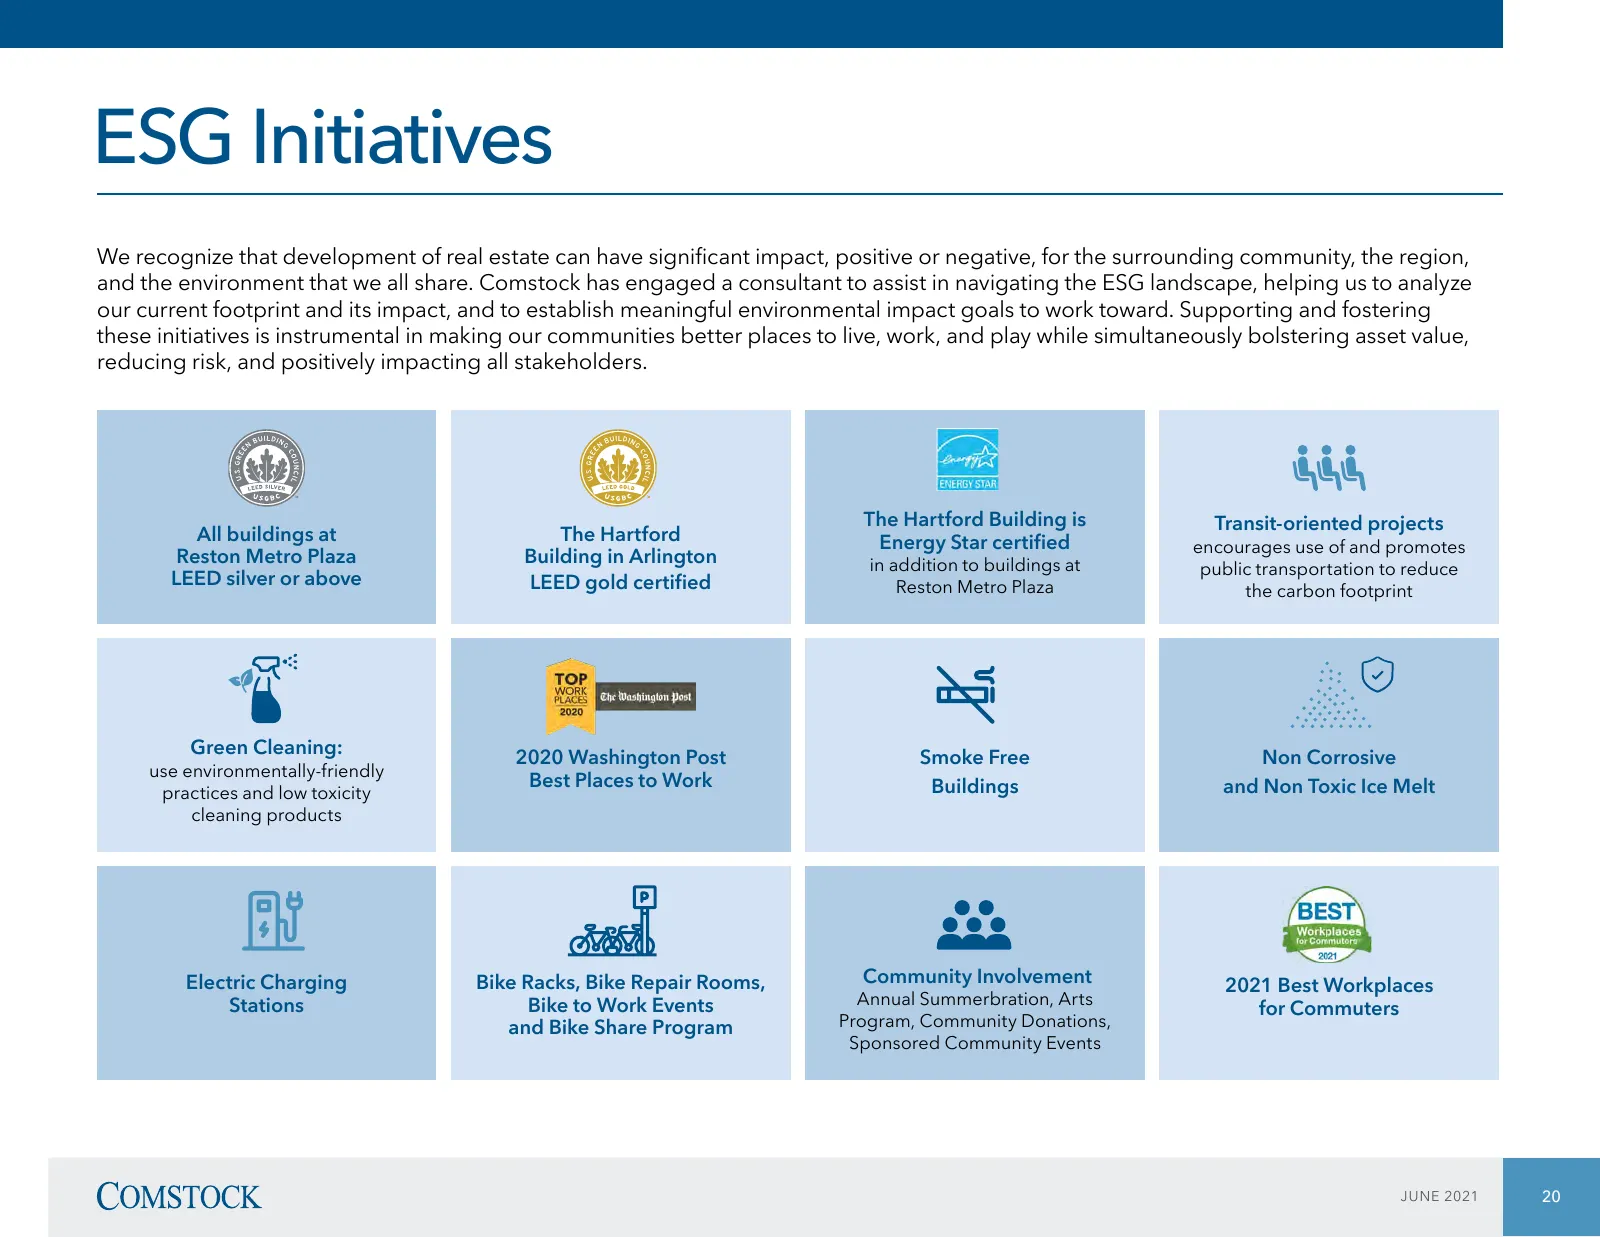
ESG Initiatives We recognize that development of real estate can have significant impact, positive or negative, for the surrounding community, the region, and the environment that we all share. Comstock has engaged a consultant to assist in navigating the ESG landscape, helping us to analyze our cur
Slide 21: Comstock Leadership and Principal
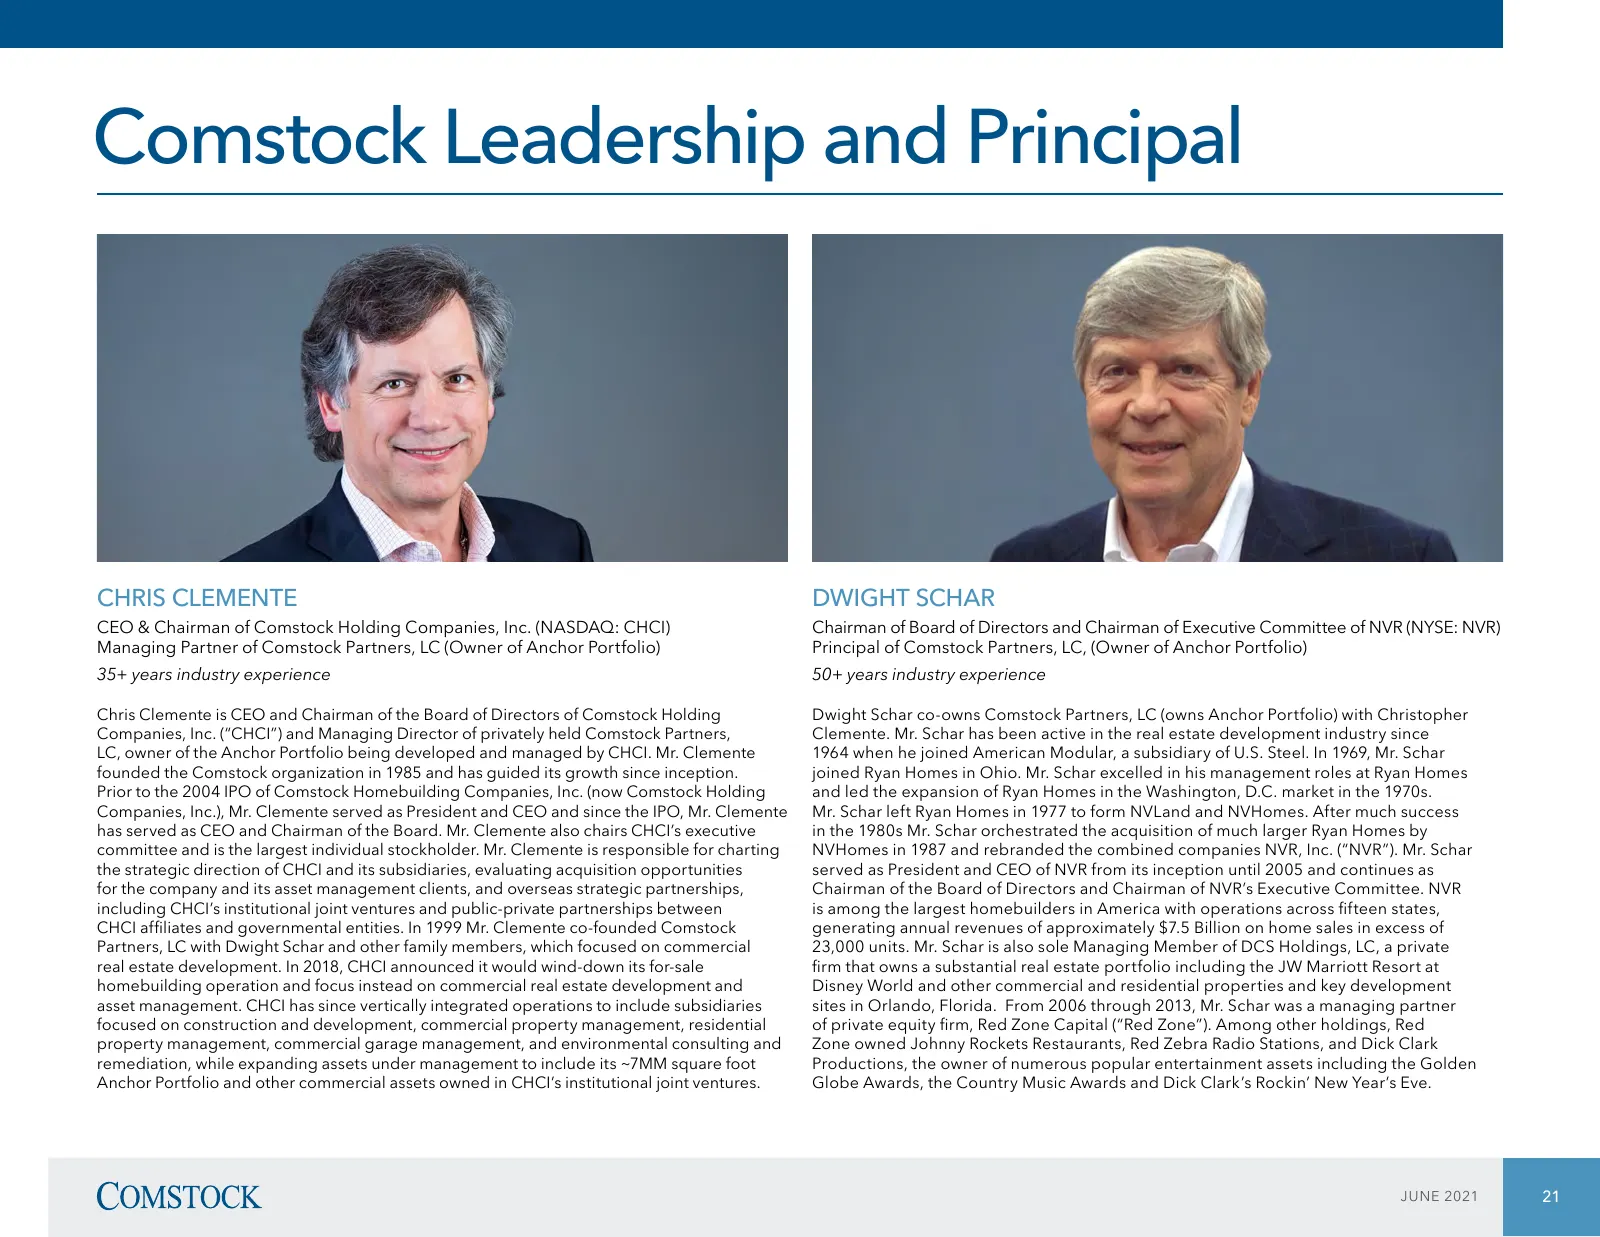
Comstock Leadership and Principal CHRIS CLEMENTE DWIGHT SCHAR CEO & Chairman of Comstock Holding Companies, Inc. (NASDAQ: CHCI) Chairman of Board of Directors and Chairman of Executive Committee of NVR (NYSE: NVR) Managing Partner of Comstock Partners, LC (Owner of Anchor Portfolio) Principal of Com
Slide 22: Management Team Combines Local Expertise with Institutional Asset Management Experience
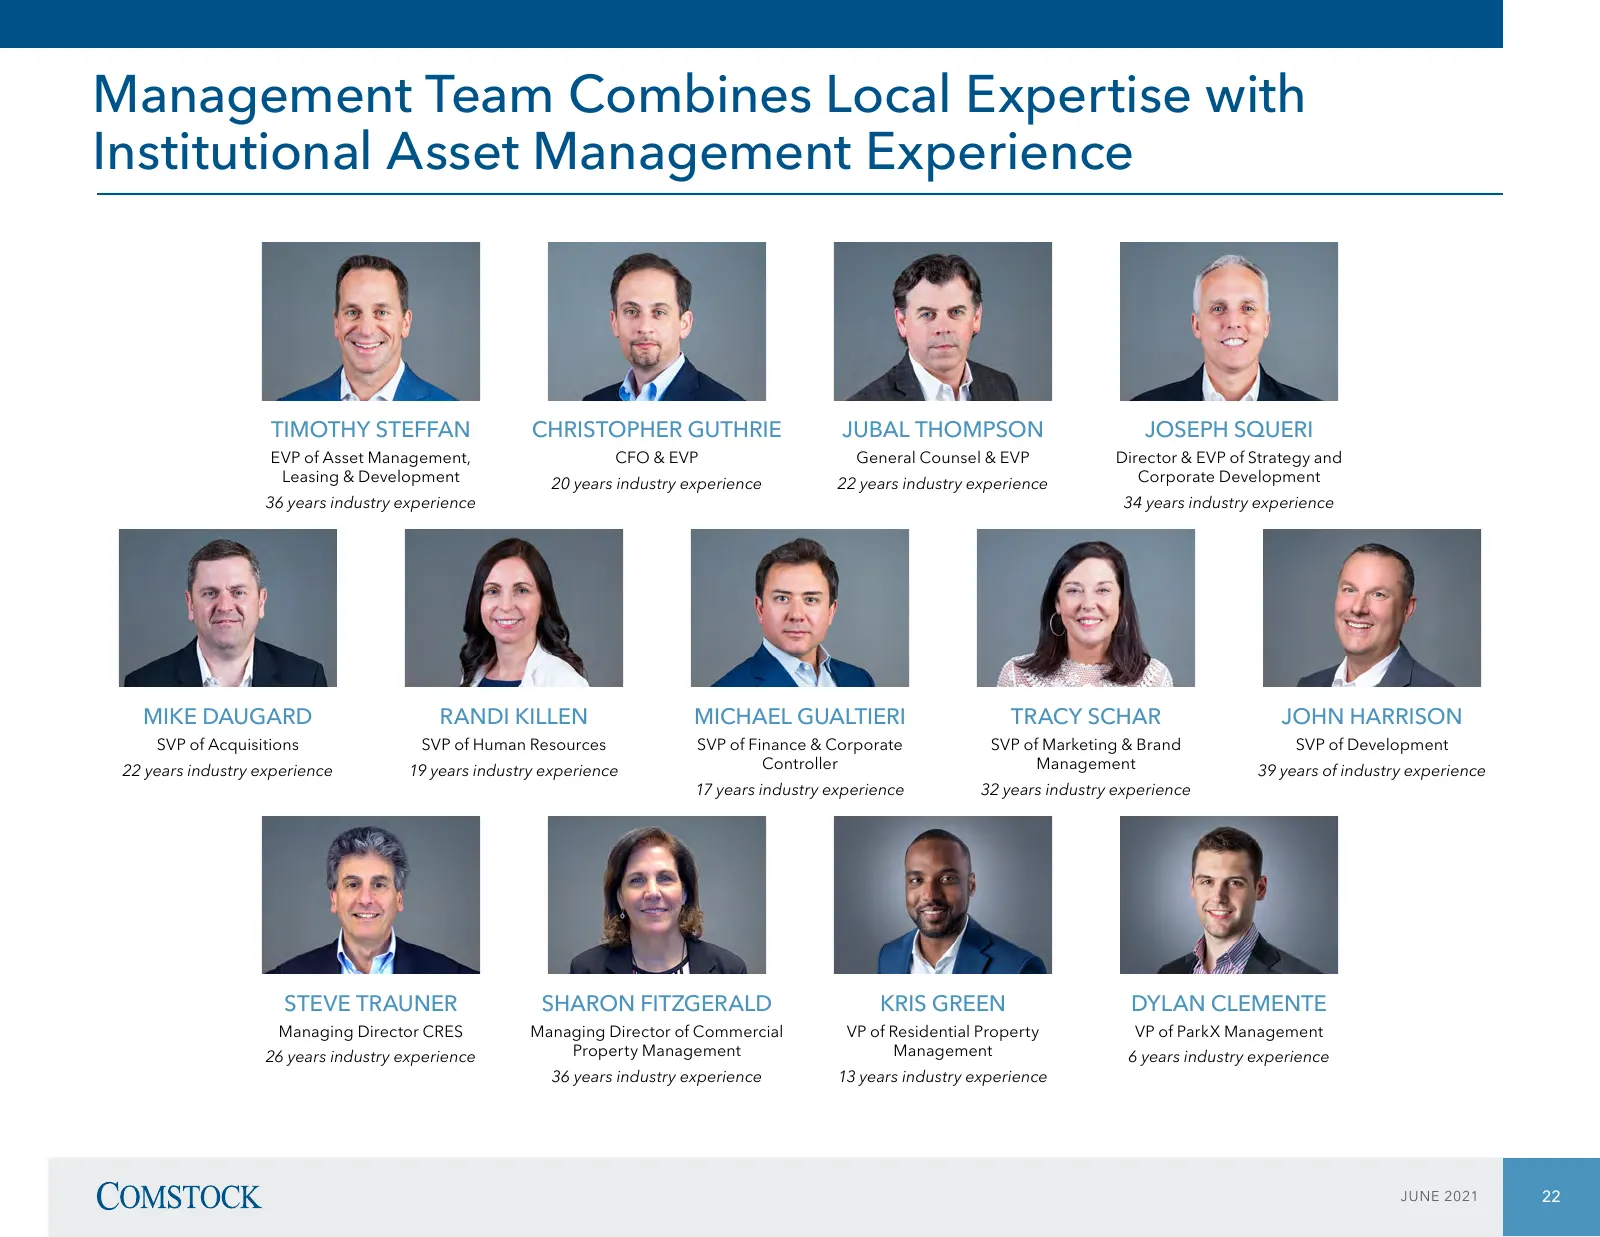
Management Team Combines Local Expertise with Institutional Asset Management Experience TIMOTHY STEFFAN CHRISTOPHER GUTHRIE JUBAL THOMPSON JOSEPH SQUERI EVP of Asset Management, CFO & EVP General Counsel & EVP Director & EVP of Strategy and Leasing & Development 20 years industry experience 22 years
Slide 23: Appendix
Appendix
Slide 24: Reconciliation of Non-GAAP financial measures (unaudited)
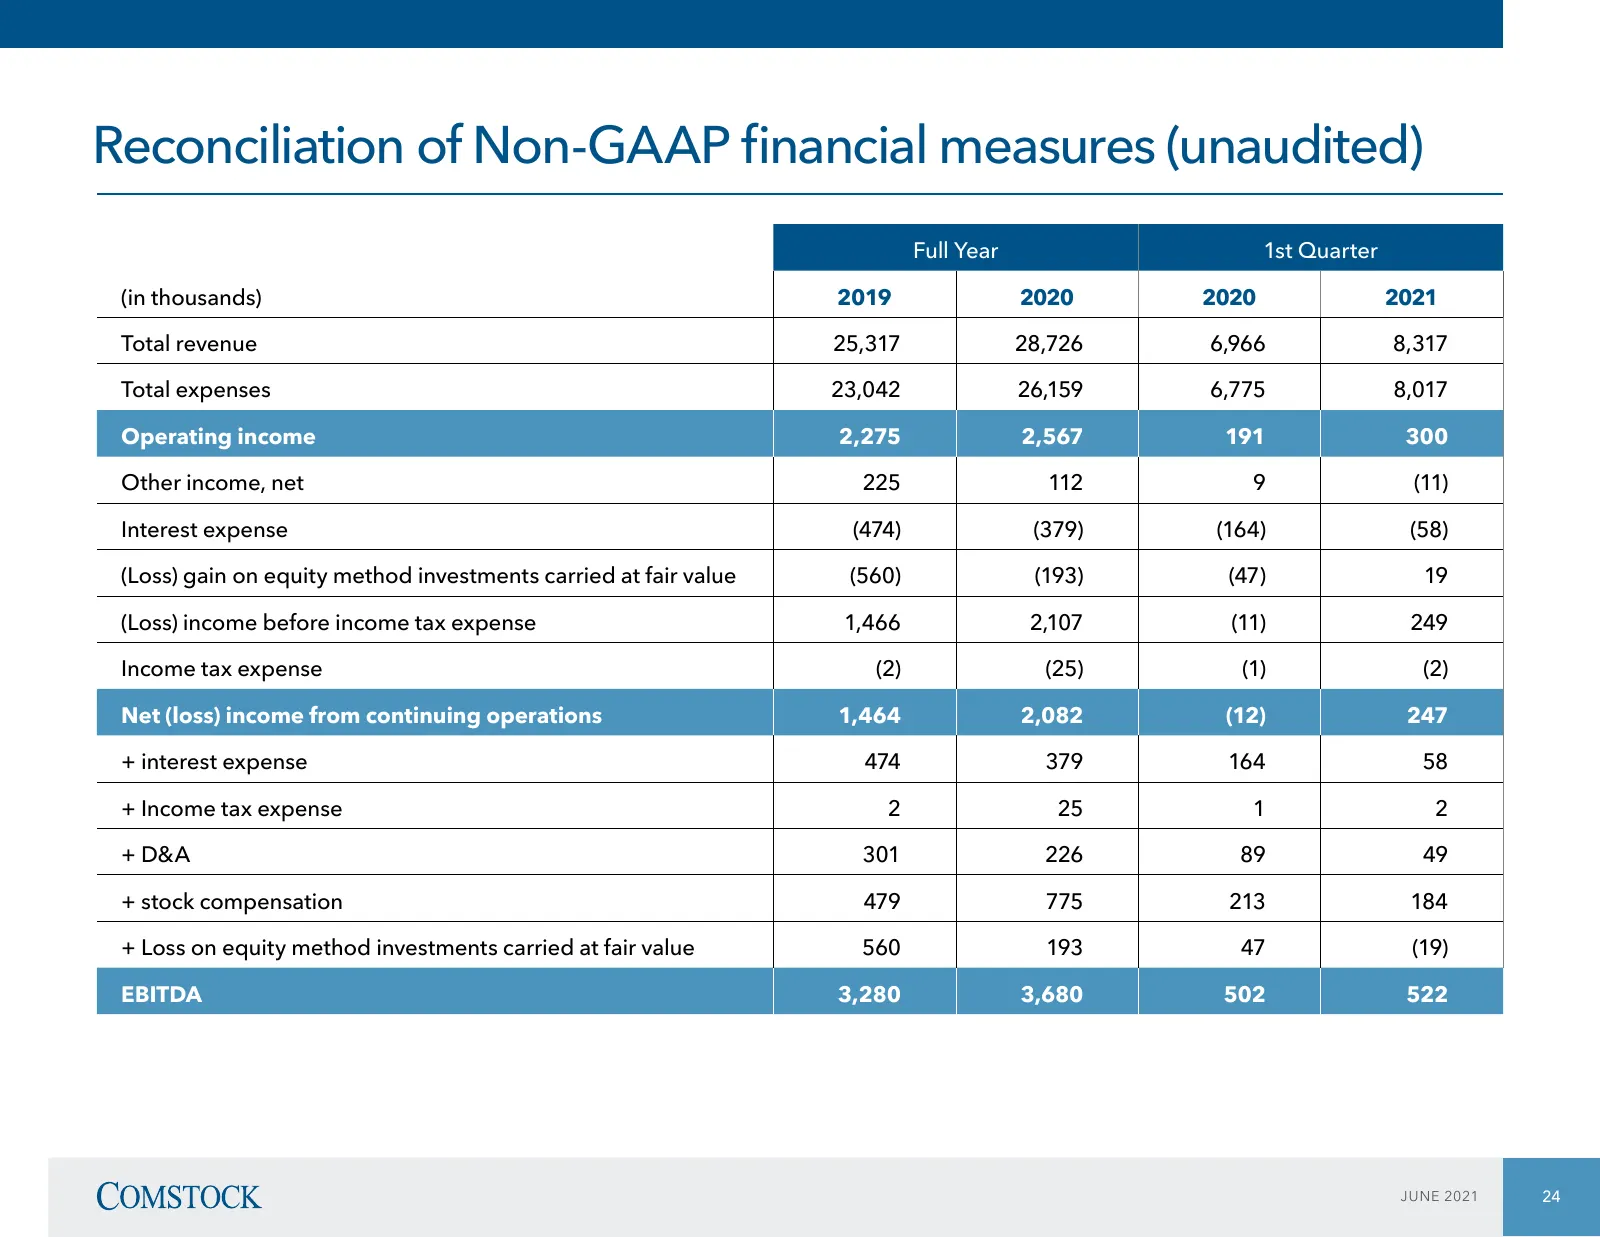
Reconciliation of Non-GAAP financial measures (unaudited) Full Year 1st Quarter (in thousands) 2019 2020 2020 2021 Total revenue 25,317 28,726 6,966 8,317 Total expenses 23,042 26,159 6,775 8,017 Operating income 2,275 2,567 191 300 Other income, net 225 112 9 (11) Interest expense (474) (379) (164)

Slide 25: Christopher Guthrie
CHRISTOPHER GUTHRIE Chief Financial Officer 703.230.1146 [email protected]
Source: company website
More decks from Comstock Holding Companies, Inc.
 Q2 2026 Earnings Presentation27 slides · Aug 13, 2026
 Q1 2026 Earnings Presentation27 slides · May 14, 2026
 Q4 2025 Earnings Presentation26 slides · Mar 17, 2026
 Q2 2026 Earnings Presentation27 slides · 2026
 Investor Presentation (November 2025)24 slides · November 2025
 Investor Presentation (June 2024)24 slides · June 2024