Buckeye Partners L.P — Wells Fargo Kick the Tires (June 2014)
20 slides from Buckeye Partners L.P's conference presentation, Jun 2, 2014
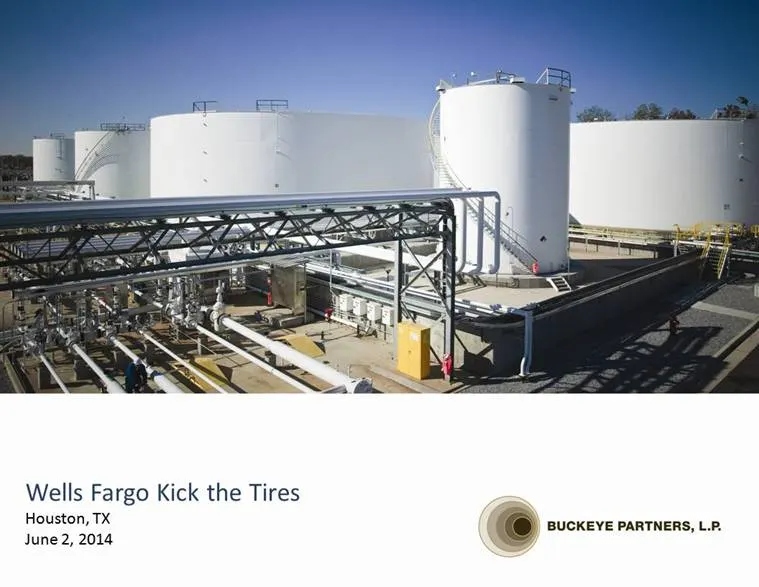
Slide 1: Wells Fargo Kick the Tires, Houston, TX, June 2, 2014
Wells Fargo Kick the Tires Houston, TX June 2, 2014
Slide 2: Forward-Looking Statements
FORWARD-LOOKING STATEMENTS This presentation contains “forward-looking statements” that we believe to be reasonable as of the date of this presentation. These statements, which include any statement that does not relate strictly to historical facts, use terms such as “anticipate,” “assume,” “believe
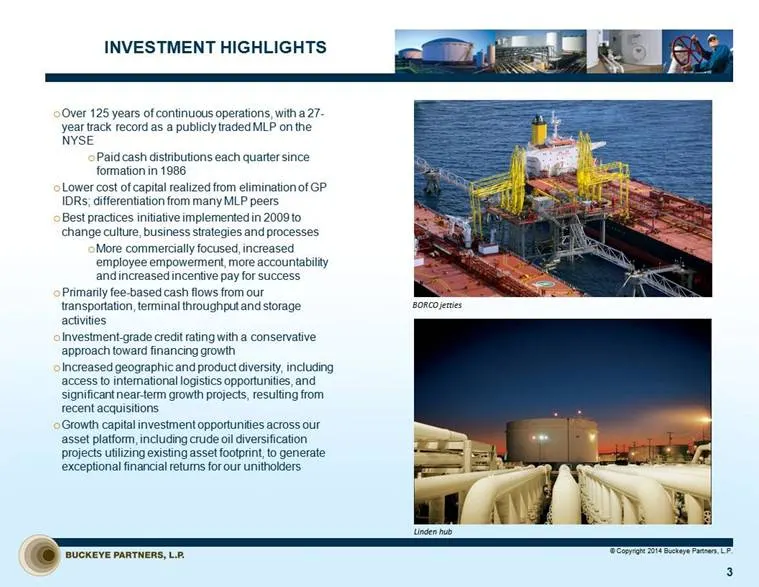
Slide 3: Investment Highlights
INVESTMENT HIGHLIGHTS Over 125 years of continuous operations, with a 27-year track record as a publicly traded MLP on the NYSE Paid cash distributions each quarter since formation in 1986 Lower cost of capital realized from elimination of GP IDRs; differentiation from many MLP peers Best practices
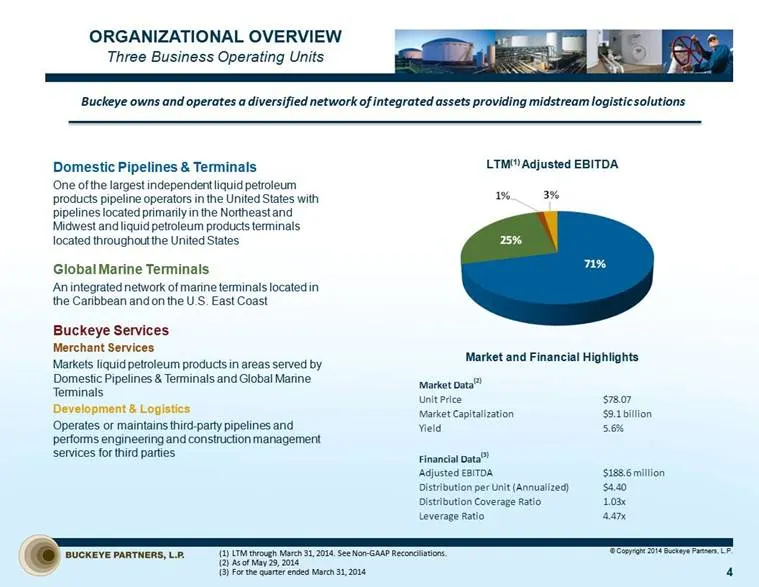
Slide 4: Organizational Overview
ORGANIZATIONAL OVERVIEW Three Business Operating Units Domestic Pipelines & Terminals One of the largest independent liquid petroleum products pipeline operators in the United States with pipelines located primarily in the Northeast and Midwest and liquid petroleum products terminals located through
Slide 5: Pipeline and Terminal System Map
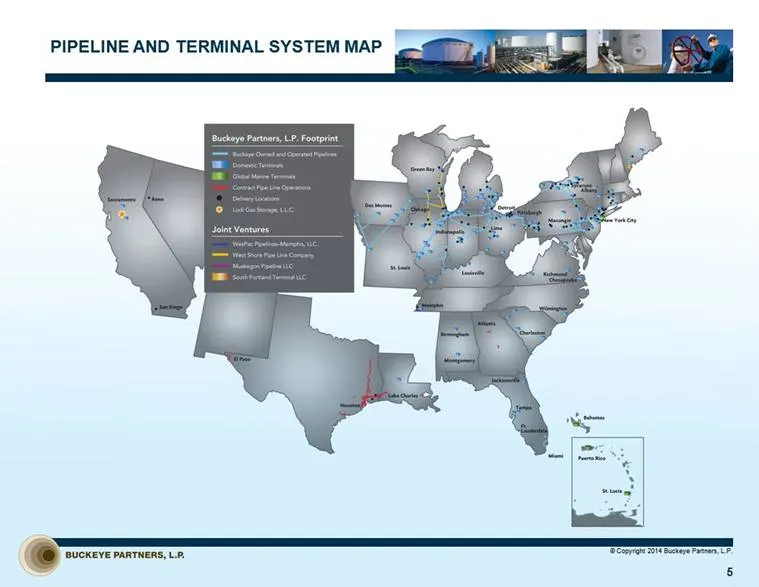
PIPELINE AND TERMINAL SYSTEM MAP © Copyright 2014 Buckeye Partners, L.P. 5
Slide 6: Domestic Pipelines & Terminals Overview
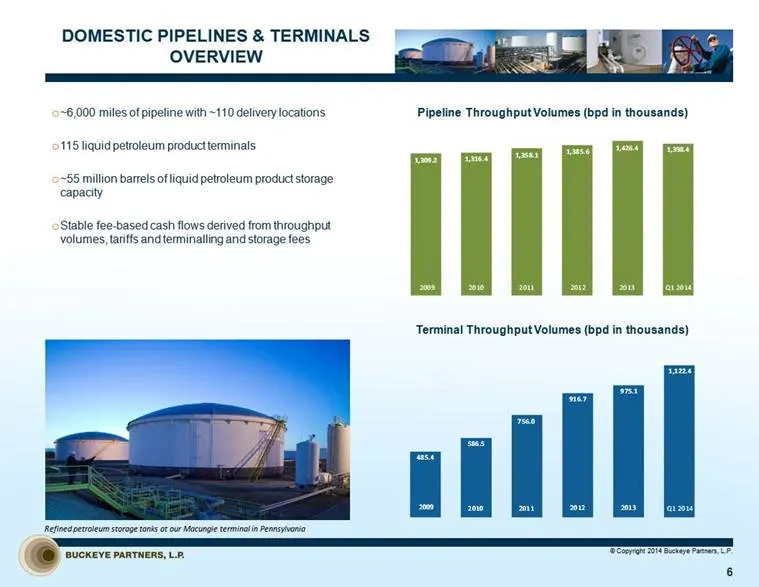
DOMESTIC PIPELINES & TERMINALS OVERVIEW ~6,000 miles of pipeline with ~110 delivery locations 115 liquid petroleum product terminals ~55 million barrels of liquid petroleum product storage capacity Stable fee-based cash flows derived from throughput volumes, tariffs and terminalling and storage fees
Slide 7: Global Marine Terminals Overview
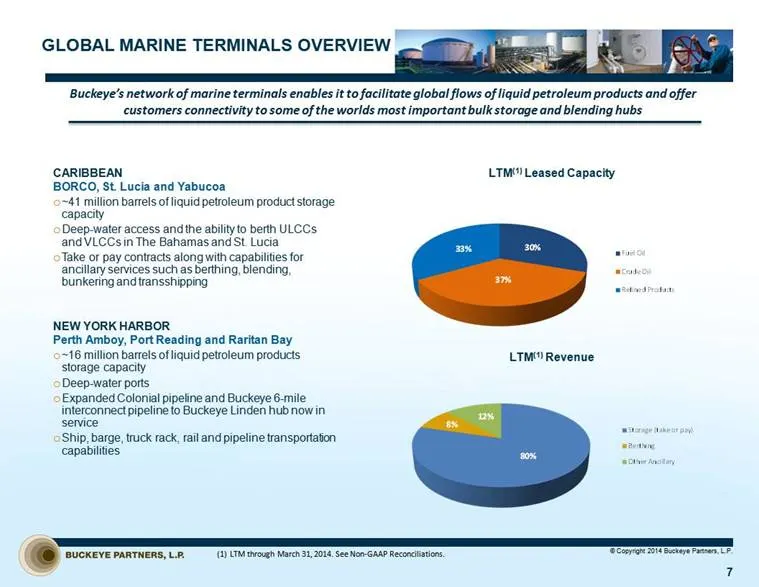
GLOBAL MARINE TERMINALS OVERVIEW CARIBBEAN BORCO, St. Lucia and Yabucoa ~41 million barrels of liquid petroleum product storage capacity Deep-water access and the ability to berth ULCCs and VLCCs in The Bahamas and St. Lucia Take or pay contracts along with capabilities for ancillary services such a
Slide 8: Buckeye Services Overview
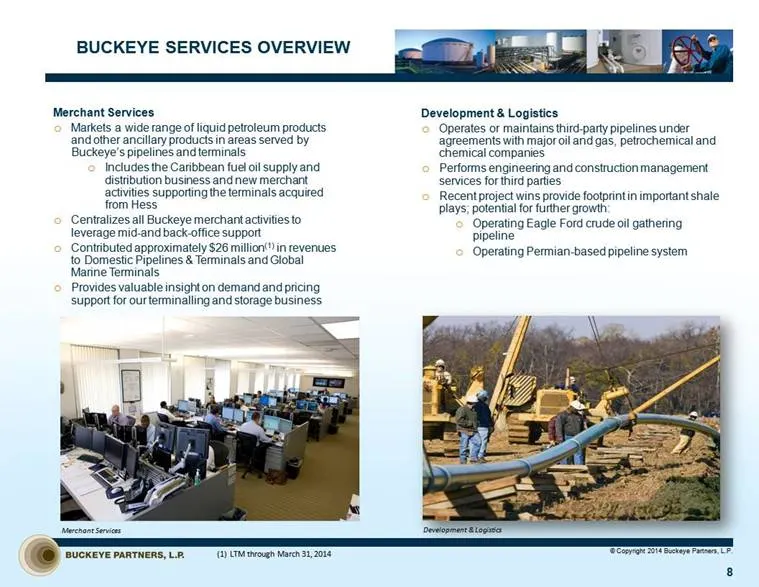
BUCKEYE SERVICES OVERVIEW Merchant Services Markets a wide range of liquid petroleum products and other ancillary products in areas served by Buckeye’s pipelines and terminals Includes the Caribbean fuel oil supply and distribution business and new merchant activities supporting the terminals acquir
Slide 9: Crude Oil Diversification
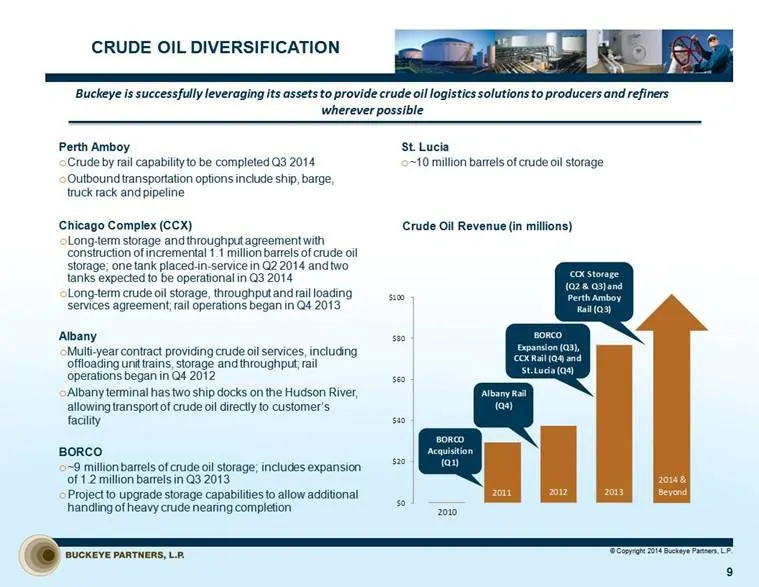
CRUDE OIL DIVERSIFICATION Perth Amboy Crude by rail capability to be completed Q3 2014 Outbound transportation options include ship, barge, truck rack and pipeline Chicago Complex (CCX) Long-term storage and throughput agreement with construction of incremental 1.1 million barrels of crude oil stora
Slide 10: Growth Capital Investments
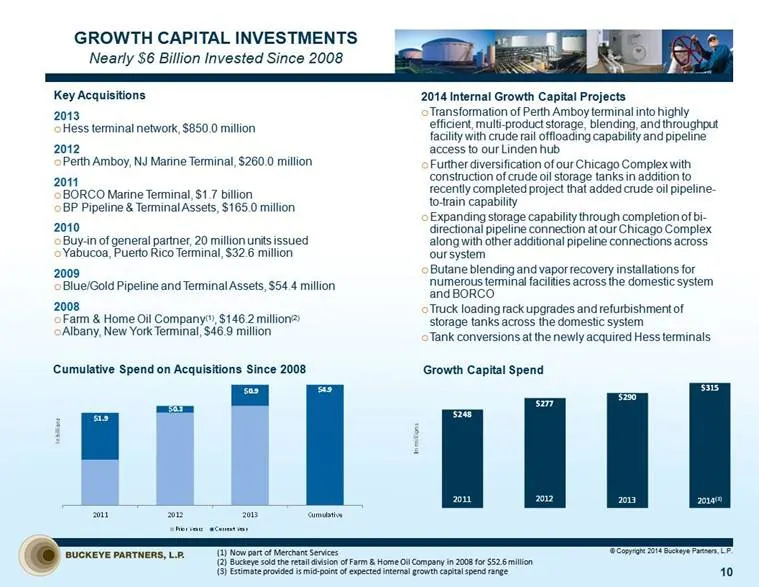
Cumulative Spend on Acquisitions Since 2008 GROWTH CAPITAL INVESTMENTS Nearly $6 Billion Invested Since 2008 Key Acquisitions 2013 Hess terminal network, $850.0 million 2012 Perth Amboy, NJ Marine Terminal, $260.0 million 2011 BORCO Marine Terminal, $1.7 billion BP Pipeline & Terminal Assets, $165.0
Slide 11: Hess Terminals Acquisition
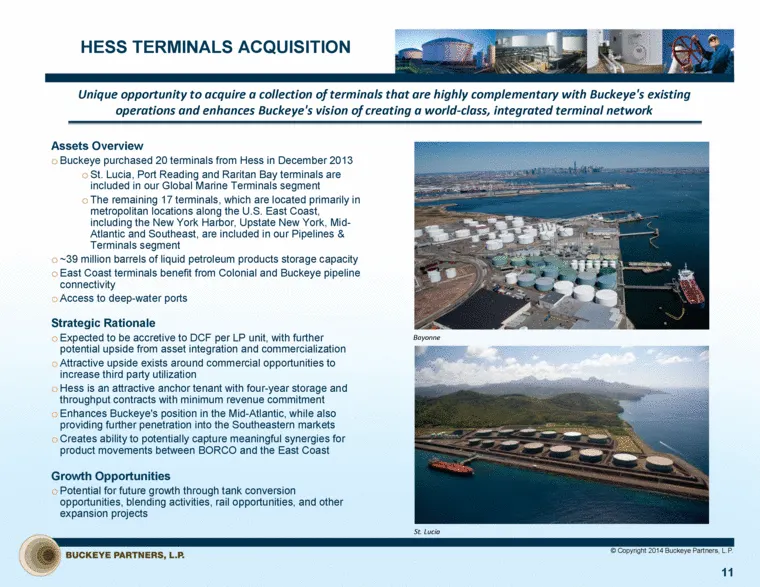
HESS TERMINALS ACQUISITION Assets Overview Buckeye purchased 20 terminals from Hess in December 2013 St. Lucia, Port Reading and Raritan Bay terminals are included in our Global Marine Terminals segment The remaining 17 terminals, which are located primarily in metropolitan locations along the U.S.
Slide 12: Growth Capital Projects: Domestic Pipelines & Terminals
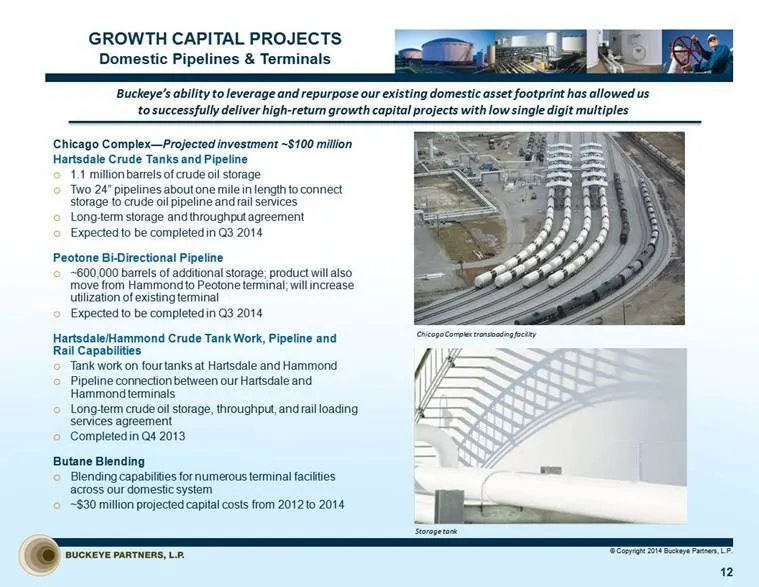
GROWTH CAPITAL PROJECTS Domestic Pipelines & Terminals Chicago Complex—Projected investment ~$100 million Hartsdale Crude Tanks and Pipeline 1.1 million barrels of crude oil storage Two 24” pipelines about one mile in length to connect storage to crude oil pipeline and rail services Long-term storag
Slide 13: Growth Capital Projects: Global Marine Terminals
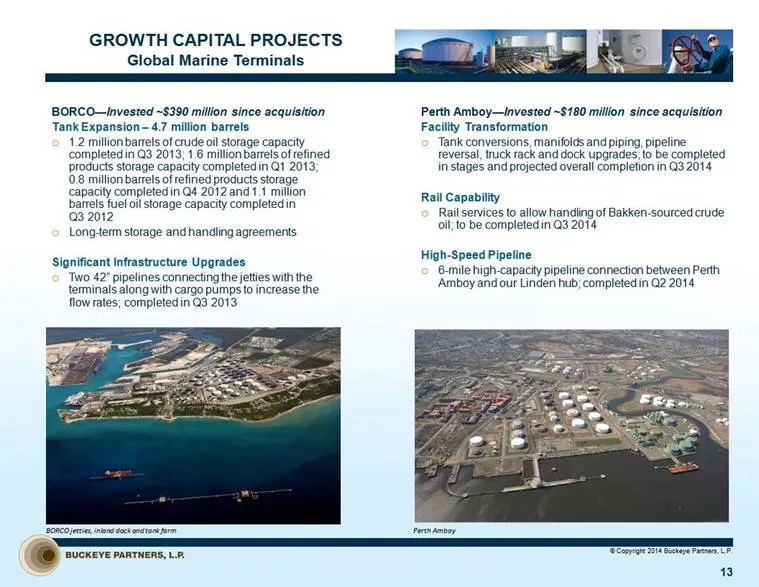
GROWTH CAPITAL PROJECTS Global Marine Terminals BORCO—Invested ~$390 million since acquisition Tank Expansion – 4.7 million barrels 1.2 million barrels of crude oil storage capacity completed in Q3 2013; 1.6 million barrels of refined products storage capacity completed in Q1 2013; 0.8 million barre
Slide 14: Financial Overview
EW FINANCIAL OVERVI é BUCKEYE PARTNERS, L.P.
Slide 15: Financial Performance
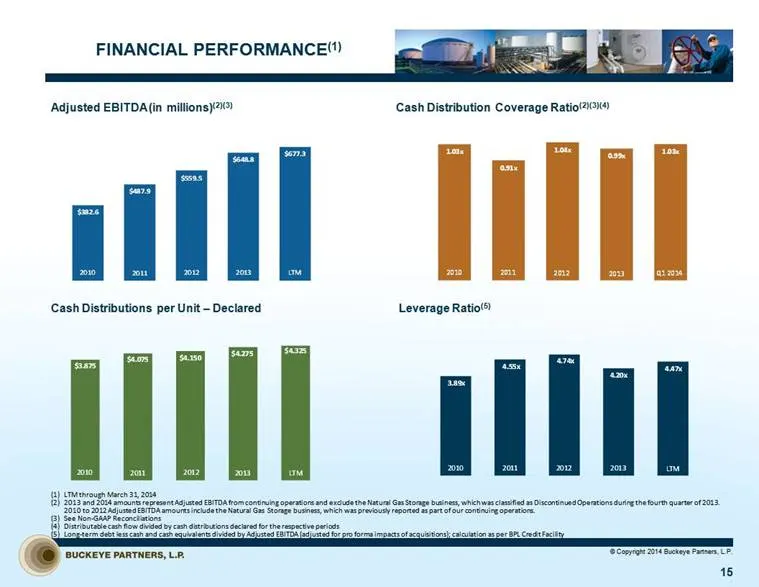
FINANCIAL PERFORMANCE(1) 15 Adjusted EBITDA (in millions)(2)(3) Cash Distributions per Unit – Declared Cash Distribution Coverage Ratio(2)(3)(4) LTM through March 31, 2014 2013 and 2014 amounts represent Adjusted EBITDA from continuing operations and exclude the Natural Gas Storage business, which w
Slide 16: Outstanding Indebtedness
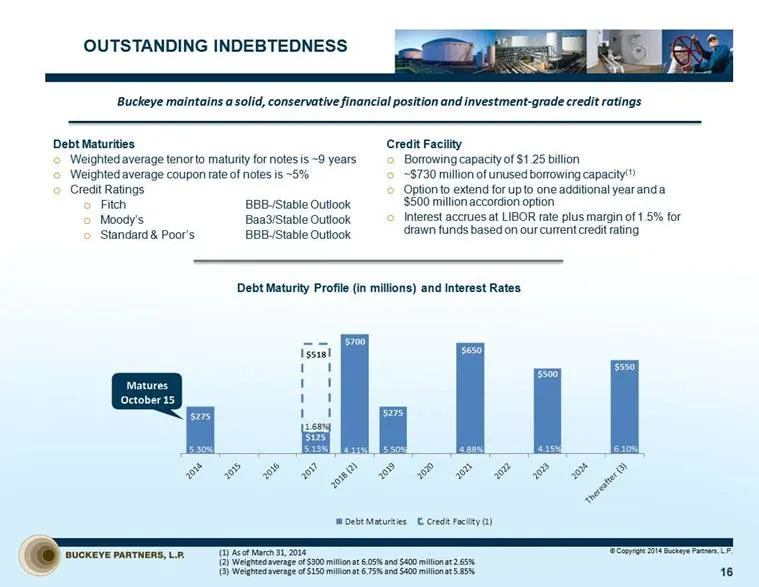
OUTSTANDING INDEBTEDNESS Debt Maturities Weighted average tenor to maturity for notes is ~9 years Weighted average coupon rate of notes is ~5% Credit Ratings Fitch BBB-/Stable Outlook Moody’s Baa3/Stable Outlook Standard & Poor’s BBB-/Stable Outlook © Copyright 2014 Buckeye Partners, L.P. 16 Buckeye
Slide 17: Investment Summary
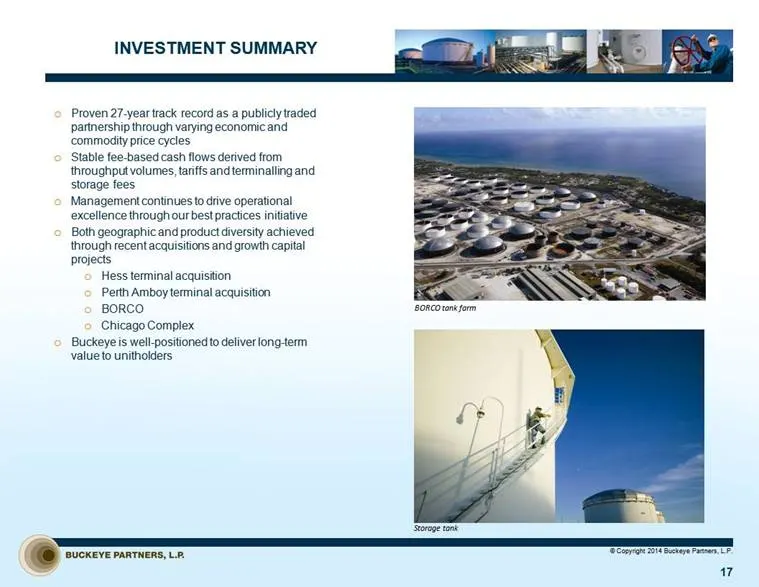
INVESTMENT SUMMARY Proven 27-year track record as a publicly traded partnership through varying economic and commodity price cycles Stable fee-based cash flows derived from throughput volumes, tariffs and terminalling and storage fees Management continues to drive operational excellence through our
Slide 18: Non-GAAP Reconciliations
NON-GAAP RECONCILIATIONS é BUCKEYE PARTNERS, L.P.
Slide 19: Non-GAAP Financial Measures
NON-GAAP FINANCIAL MEASURES Adjusted EBITDA and distributable cash flow are measures not defined by GAAP. Adjusted EBITDA is the primary measure used by our senior management, including our Chief Executive Officer, to (i) evaluate our consolidated operating performance and the operating performance
Slide 20: Non-GAAP Reconciliations
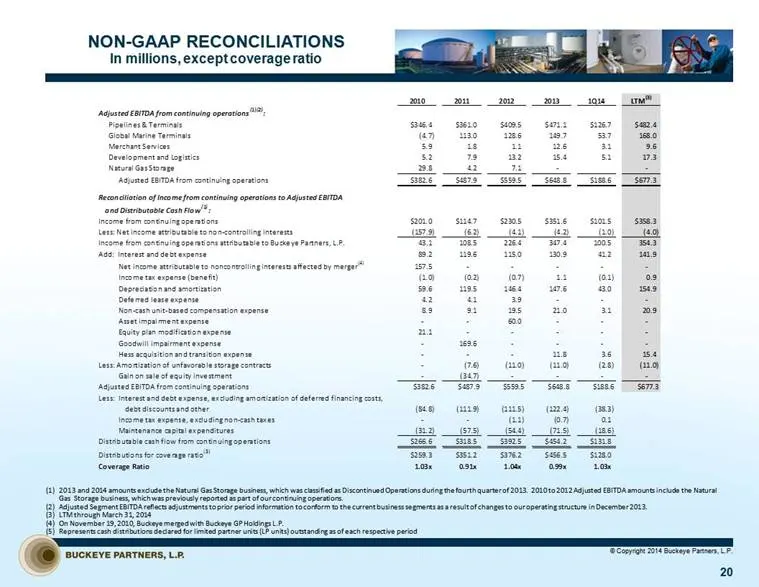
NON-GAAP RECONCILIATIONS In millions, except coverage ratio © Copyright 2014 Buckeye Partners, L.P. 20 2013 and 2014 amounts exclude the Natural Gas Storage business, which was classified as Discontinued Operations during the fourth quarter of 2013. 2010 to 2012 Adjusted EBITDA amounts include the N
Source: SEC EDGAR · 8-K filed Jun 2, 2014
More decks from Buckeye Partners L.P
 Shareholder Meeting (June 2019)16 slides · Jun 4, 2019
 Investor Presentation (April 2019)15 slides · Apr 9, 2019
 Citi Cracker Fracker Bus Tour (February 2019)15 slides · Feb 27, 2019
 UBS Midstream, MLP & Utilities One-on-One Conference 201915 slides · Jan 15, 2019
 Investor Presentation (November 2018)15 slides · Nov 29, 2018
 Investor Presentation (June 2018)20 slides · Jun 5, 2018