The Empire District Electric Company
The Empire District Electric — Empire District Electric — Q1 2015 Earnings Presentation
44 slides from The Empire District Electric's earnings presentation, May 11, 2015
Slide 1: 1st Quarter Analyst Presentation
1st Quarter Analyst Presentation 05/08/2015 The Empire District Electric Company SERVICES YOU COUNT ON Asbury Generating Station

Slide 2: (This page intentionally left blank)
(This page intentionally left blank)
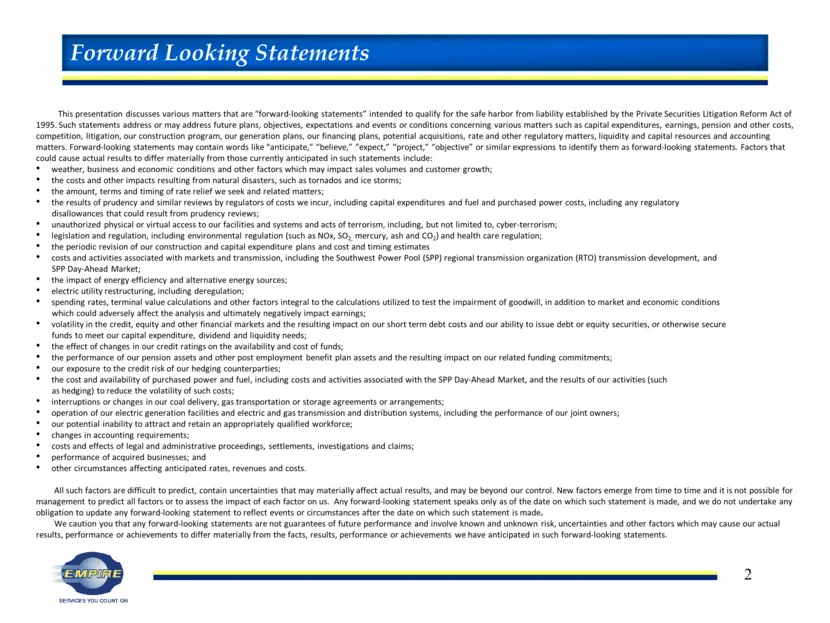
Slide 3: Forward-looking statements
This presentation discusses various matters that are “forward-looking statements” intended to qualify for the safe harbor from liability established by the Private Securities Litigation Reform Act of 1995. Such statements address or may address future plans, objectives, expectations and events or co

Slide 4: (This page intentionally left blank)
(This page intentionally left blank)
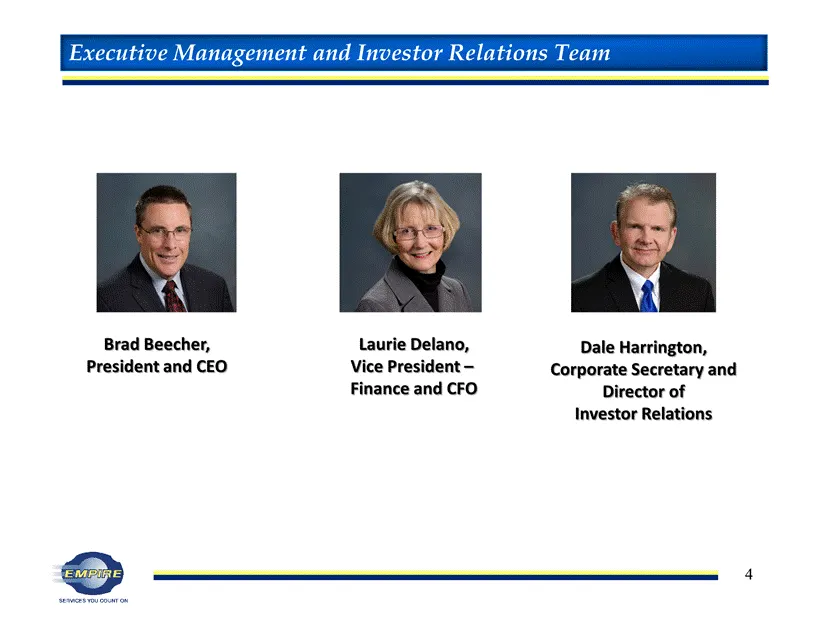
Slide 5: Executive Management and Investor Relations Team
Brad Beecher, President and CEO Laurie Delano, Vice President – Finance and CFO Dale Harrington, Corporate Secretary and Director of Investor Relations Executive Management and Investor Relations Team
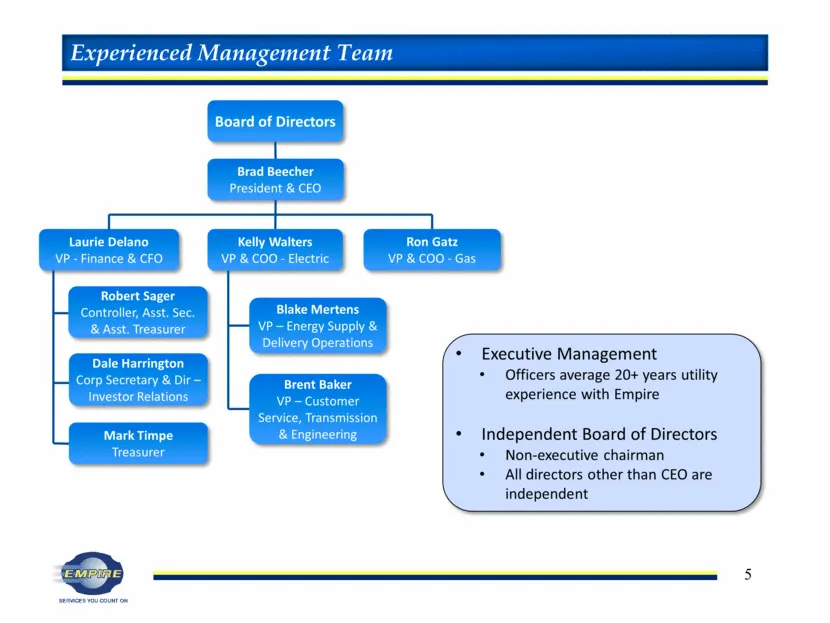
Slide 6: Experienced Management Team
Experienced Management Team Board of Directors Brad Beecher President & CEO Laurie Delano VP - Finance & CFO Kelly Walters VP & COO - Electric Ron Gatz VP & COO - Gas Brent Baker VP – Customer Service, Transmission & Engineering Blake Mertens VP – Energy Supply & Delivery Operations Executive Manage
Slide 7: Who We Are
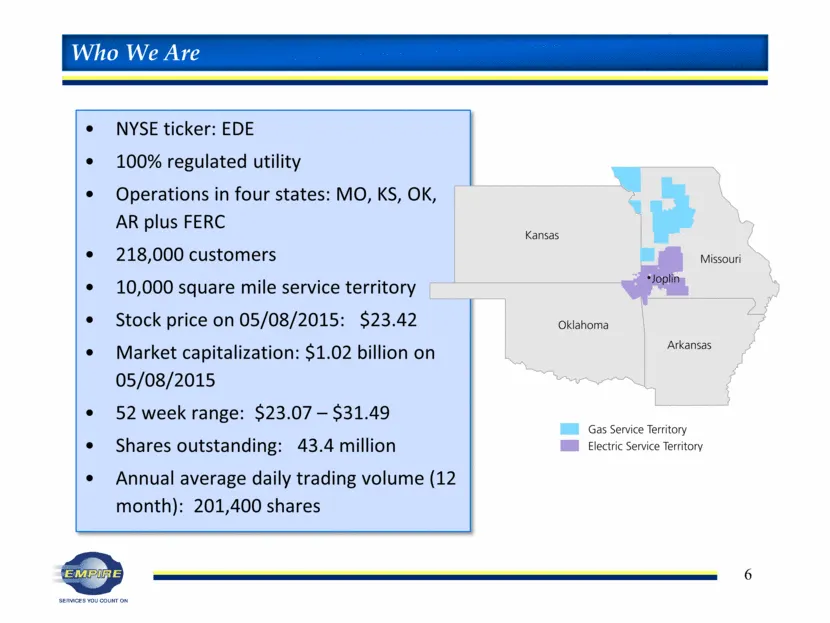
NYSE ticker: EDE 100% regulated utility Operations in four states: MO, KS, OK, AR plus FERC 218,000 customers 10,000 square mile service territory Stock price on 05/08/2015: $23.42 Market capitalization: $1.02 billion on 05/08/2015 52 week range: $23.07 – $31.49 Shares outstanding: 43.4 million Annu
Slide 8: Strategy and investment case
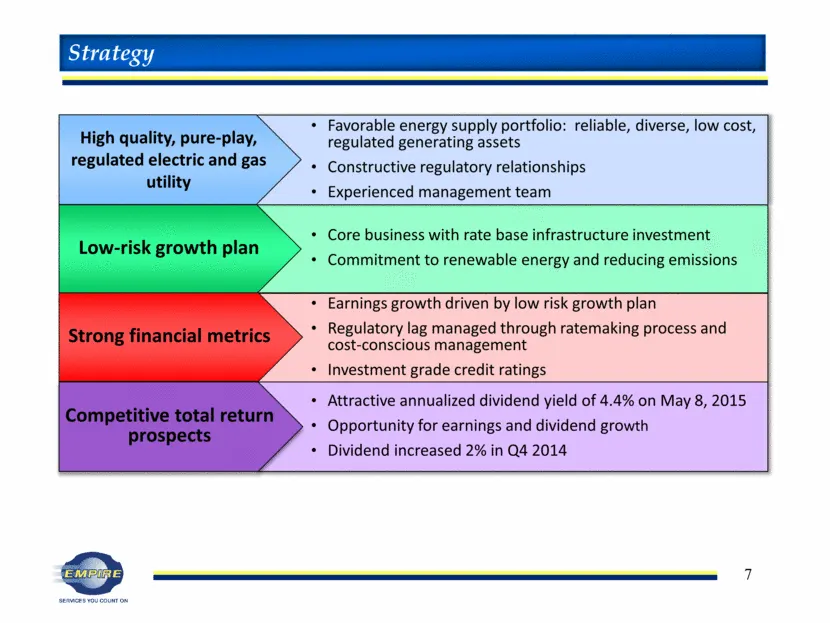
Core business with rate base infrastructure investment Commitment to renewable energy and reducing emissions Favorable energy supply portfolio: reliable, diverse, low cost, regulated generating assets Constructive regulatory relationships Experienced management team High quality, pure-play, regulate
Slide 9: Most Recent Quarter
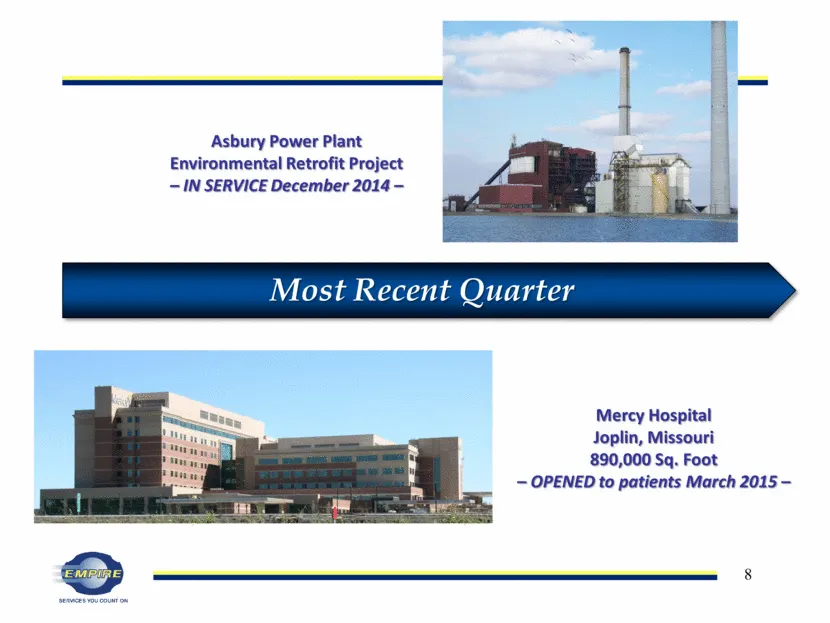
Most Recent Quarter Mercy Hospital Joplin, Missouri 890,000 Sq. Foot – OPENED to patients March 2015 – Asbury Power Plant Environmental Retrofit Project – IN SERVICE December 2014 –
Slide 10: First Quarter and Twelve Month Ended Highlights
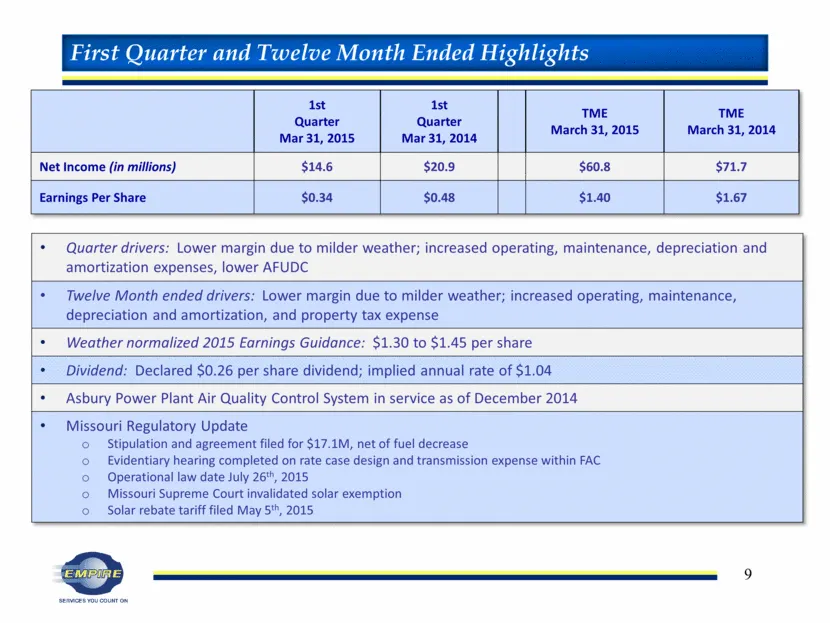
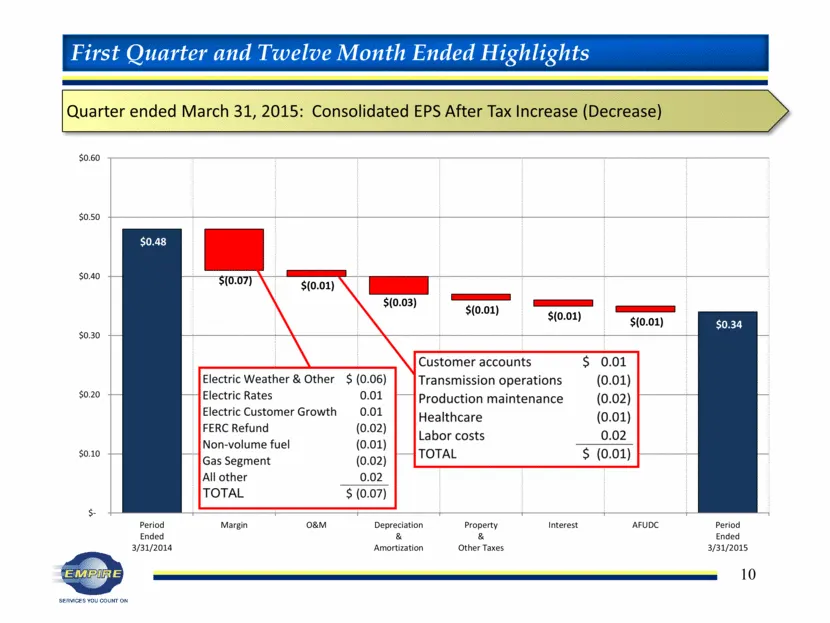
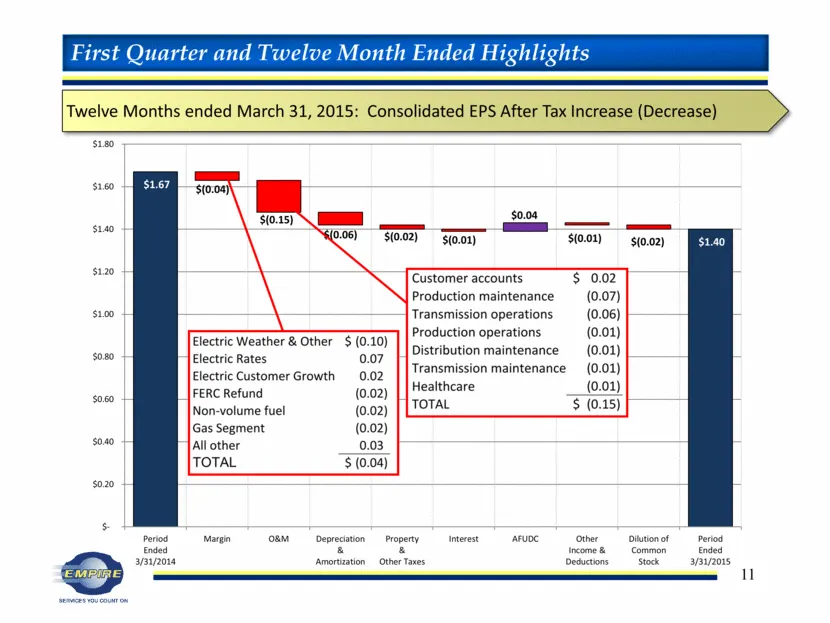
First Quarter and Twelve Month Ended Highlights 1st Quarter Mar 31, 2015 1st Quarter Mar 31, 2014 TME March 31, 2015 TME March 31, 2014 Net Income (in millions) $14.6 $20.9 $60.8 $71.7 Earnings Per Share $0.34 $0.48 $1.40 $1.67 Quarter drivers: Lower margin due to milder weather; increased operating
Slide 11: Quarter ended March 31, 2015: Consolidated EPS
Quarter ended March 31, 2015: Consolidated EPS After Tax Increase (Decrease) First Quarter and Twelve Month Ended Highlights $(0.07) $(0.01) $(0.03) $(0.01) $(0.01) $(0.01) $0.48 $0.34 $- $0.10 $0.20 $0.30 $0.40 $0.50 $0.60 Period Ended 3/31/2014 Margin O&M Depreciation & Amortization Property & Oth
Slide 12: Twelve Months ended March 31, 2015: Consolidated EPS
Twelve Months ended March 31, 2015: Consolidated EPS After Tax Increase (Decrease) First Quarter and Twelve Month Ended Highlights $0.04 $(0.04) $(0.15) $(0.06) $(0.02) $(0.01) $(0.01) $(0.02) $1.67 $1.40 $- $0.20 $0.40 $0.60 $0.80 $1.00 $1.20 $1.40 $1.60 $1.80 Period Ended 3/31/2014 Margin O&M Depr
Slide 13: 2015 Earnings Guidance
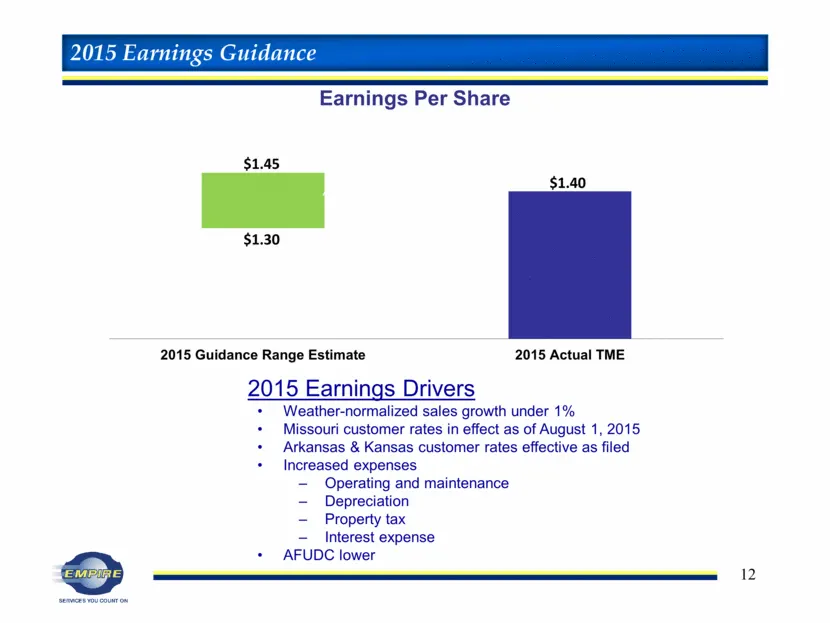
Earnings Per Share 2015 Earnings Guidance $1.45 $1.30 $1.40 2015 Earnings Drivers Weather-normalized sales growth under 1% Missouri customer rates in effect as of August 1, 2015 Arkansas & Kansas customer rates effective as filed Increased expenses Operating and maintenance Depreciation Property tax
Slide 14: Pure-Play Regulated Electric and Gas Utility
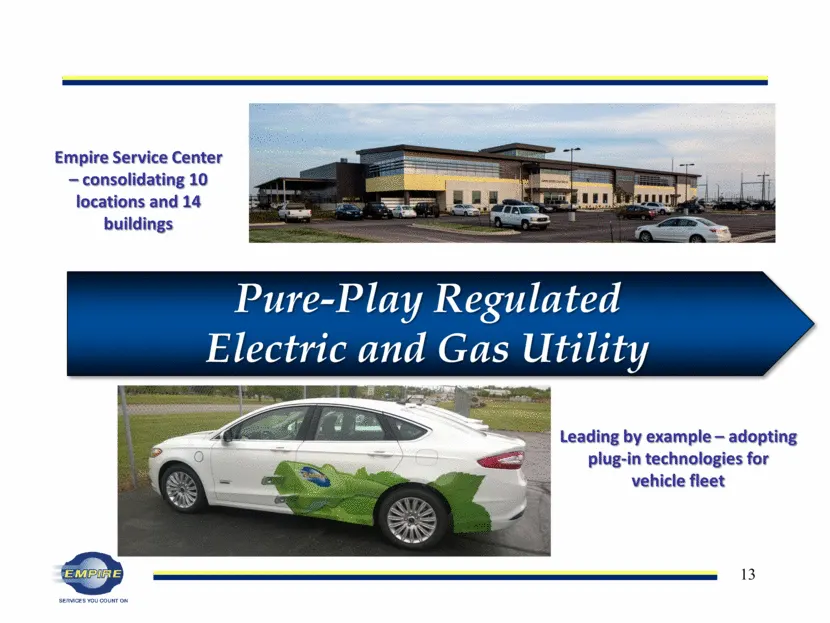
Pure-Play Regulated Electric and Gas Utility Leading by example – adopting plug-in technologies for vehicle fleet Empire Service Center – consolidating 10 locations and 14 buildings
Slide 15: Favorable Energy Supply Portfolio
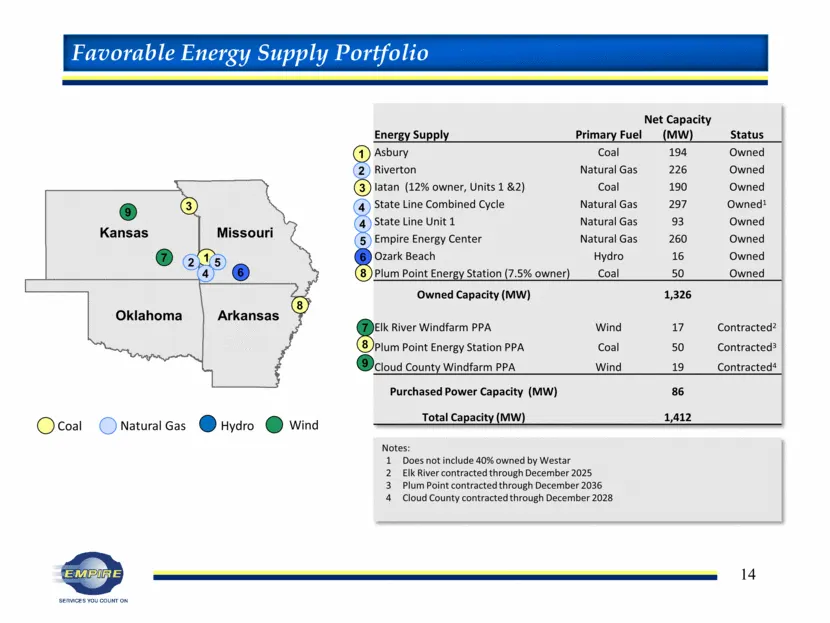
Energy Supply Primary Fuel Net Capacity (MW) Status Asbury Coal 194 Owned Riverton Natural Gas 226 Owned Iatan (12% owner, Units 1 &2) Coal 190 Owned State Line Combined Cycle Natural Gas 297 Owned1 State Line Unit 1 Natural Gas 93 Owned Empire Energy Center Natural Gas 260 Owned Ozark Beach Hydro 1
Slide 16: Favorable Energy Supply Portfolio: MW Capacity
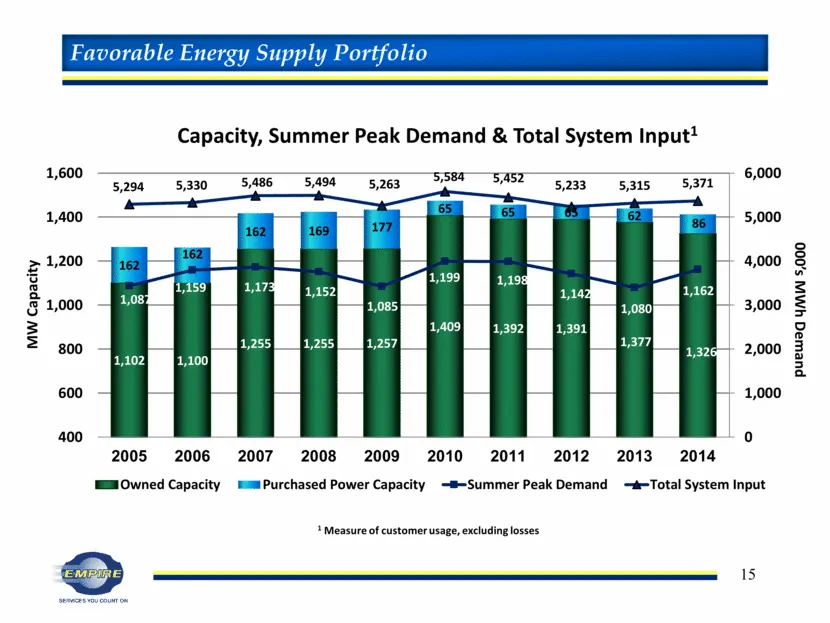
Favorable Energy Supply Portfolio MW Capacity 1 Measure of customer usage, excluding losses 1,102 1,100 1,255 1,255 1,257 1,409 1,392 1,391 1,377 1,326 162 162 162 169 177 65 65 65 62 86 1,087 1,159 1,173 1,152 1,085 1,199 1,198 1,142 1,080 1,162 5,294 5,330 5,486 5,494 5,263 5,584 5,452 5,233 5,315
Slide 17: Environmental Compliance
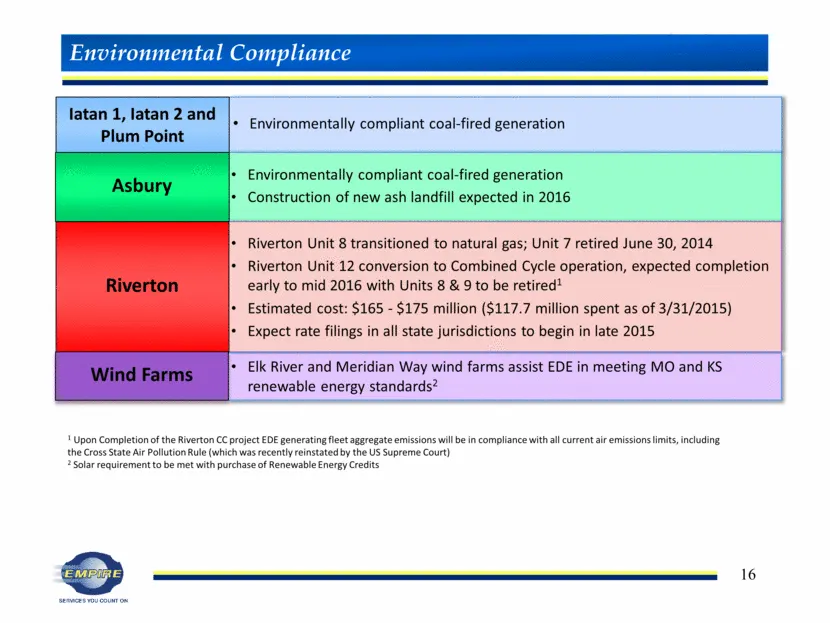
Environmentally compliant coal-fired generation Elk River and Meridian Way wind farms assist EDE in meeting MO and KS renewable energy standards2 Environmentally compliant coal-fired generation Construction of new ash landfill expected in 2016 Environmental Compliance Iatan 1, Iatan 2 and Plum Point
Slide 18: Constructive Regulatory Relationships
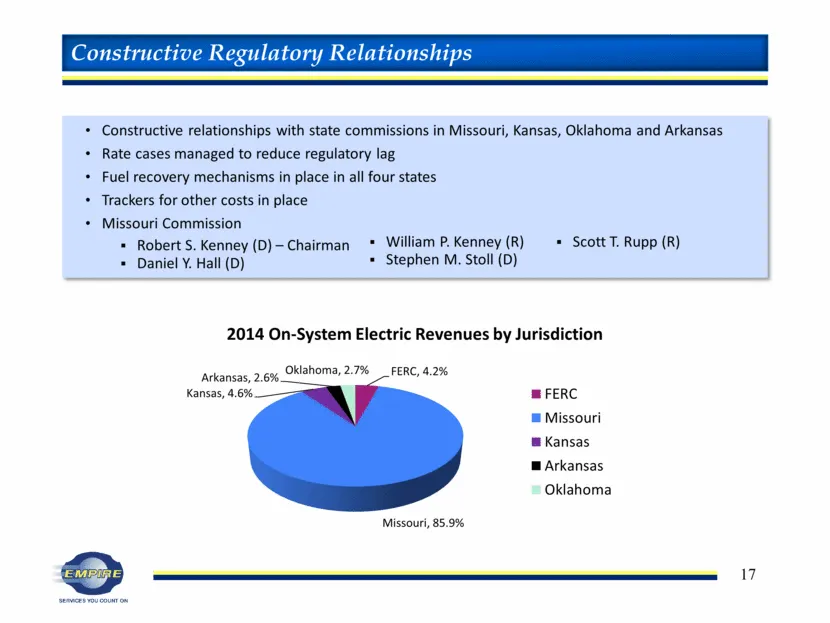
Constructive Regulatory Relationships Constructive relationships with state commissions in Missouri, Kansas, Oklahoma and Arkansas Rate cases managed to reduce regulatory lag Fuel recovery mechanisms in place in all four states Trackers for other costs in place Missouri Commission Robert S. Kenney (
Slide 19: Missouri Rate Case Highlights
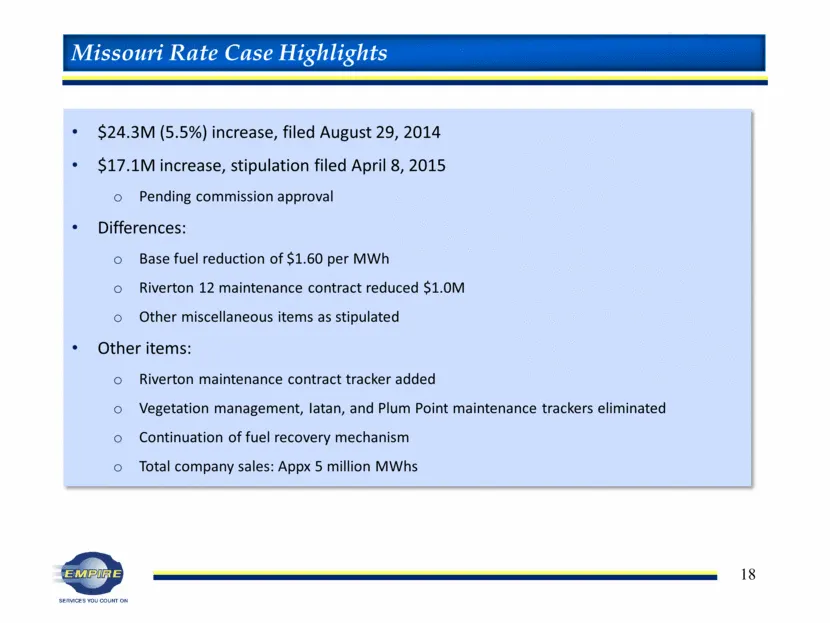
Missouri Rate Case Highlights $24.3M (5.5%) increase, filed August 29, 2014 $17.1M increase, stipulation filed April 8, 2015 Pending commission approval Differences: Base fuel reduction of $1.60 per MWh Riverton 12 maintenance contract reduced $1.0M Other miscellaneous items as stipulated Other item

Slide 20: (This page intentionally left blank)
(This page intentionally left blank)
Slide 21: Low-Risk Growth Plan: Riverton Combined Cycle
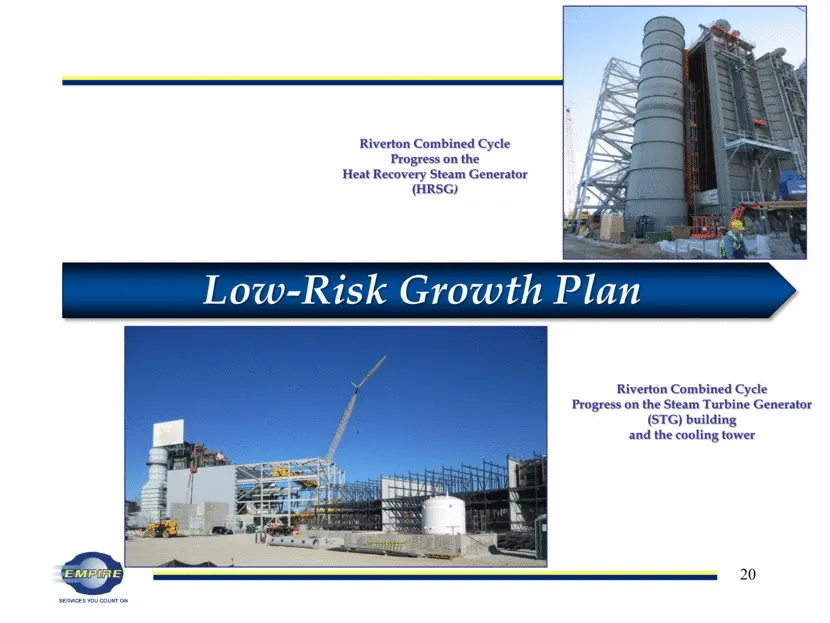
Low-Risk Growth Plan Riverton Combined Cycle Progress on the Heat Recovery Steam Generator (HRSG) Riverton Combined Cycle Progress on the Steam Turbine Generator (STG) building and the cooling tower
Slide 22: Building Core Business with Rate Base Infrastructure
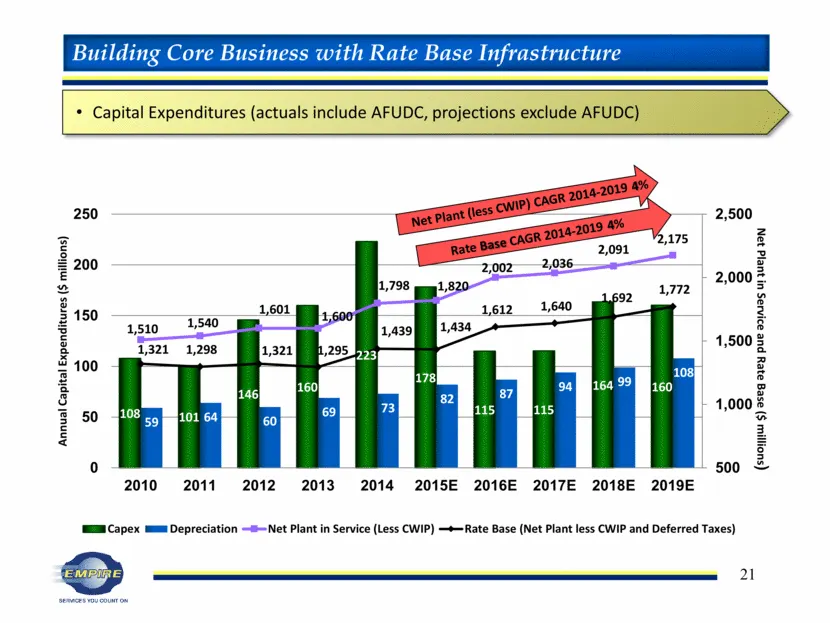
Building Core Business with Rate Base Infrastructure Capital Expenditures (actuals include AFUDC, projections exclude AFUDC) Rate Base CAGR 2014-2019 4% 108 101 146 160 223 178 115 115 164 160 59 64 60 69 73 82 87 94 99 108 1,510 1,540 1,601 1,600 1,798 1,820 2,002 2,036 2,091 2,175 1,321 1,298 1,32
Slide 23: Electric Customer Growth
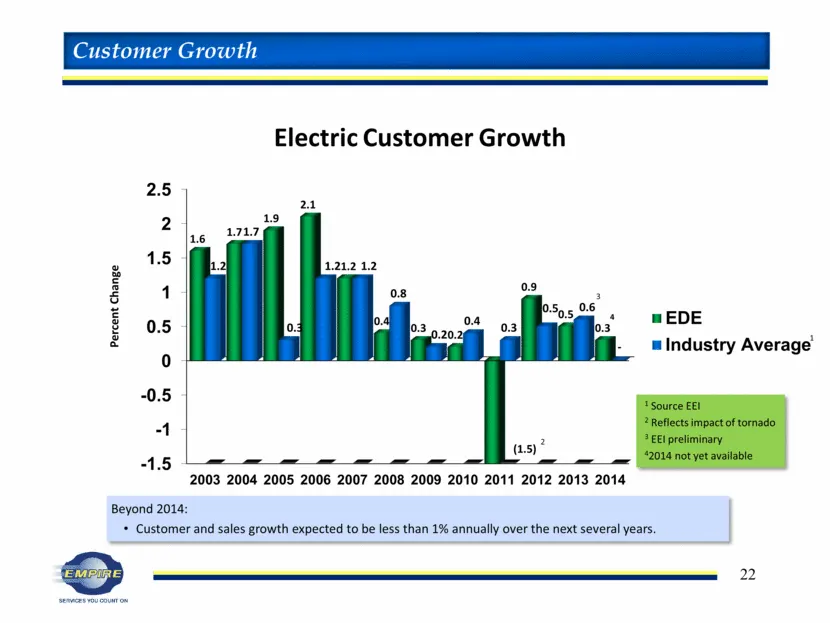
Electric Customer Growth Beyond 2014: Customer and sales growth expected to be less than 1% annually over the next several years. Customer Growth 4 -1.5 -1 -0.5 0 0.5 1 1.5 2 2.5 2003 2004 2005 2006 2007 2008 2009 2010 2011 2012 2013 2014 1.6 1.7 1.9 2.1 1.2 0.4 0.3 0.2 (1.5) 0.9 0.5 0.3 1.2 1.7 0.3

Slide 24: (This page intentionally left blank)
(This page intentionally left blank)
Slide 25: Strong Financial Metrics
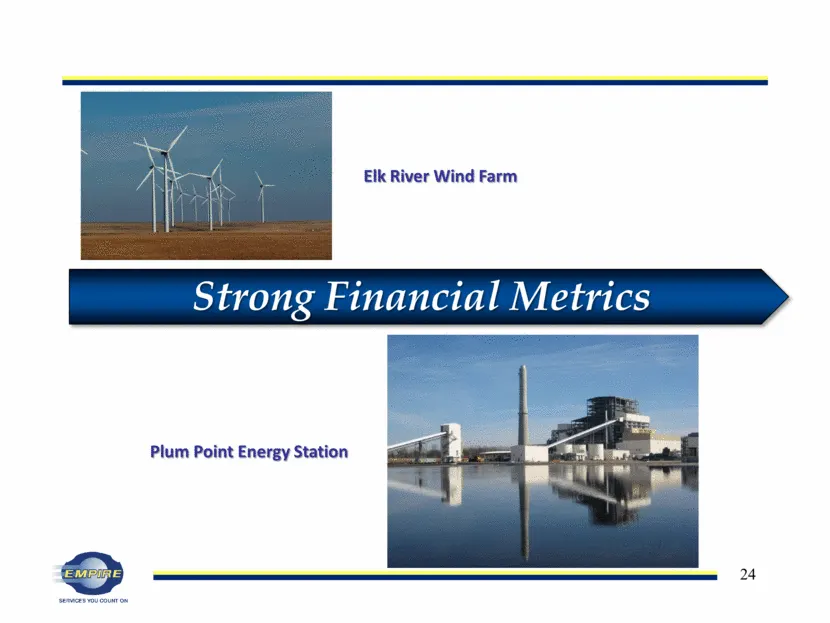
Strong Financial Metrics Plum Point Energy Station Elk River Wind Farm
Slide 26: Earnings and Dividends Per Share
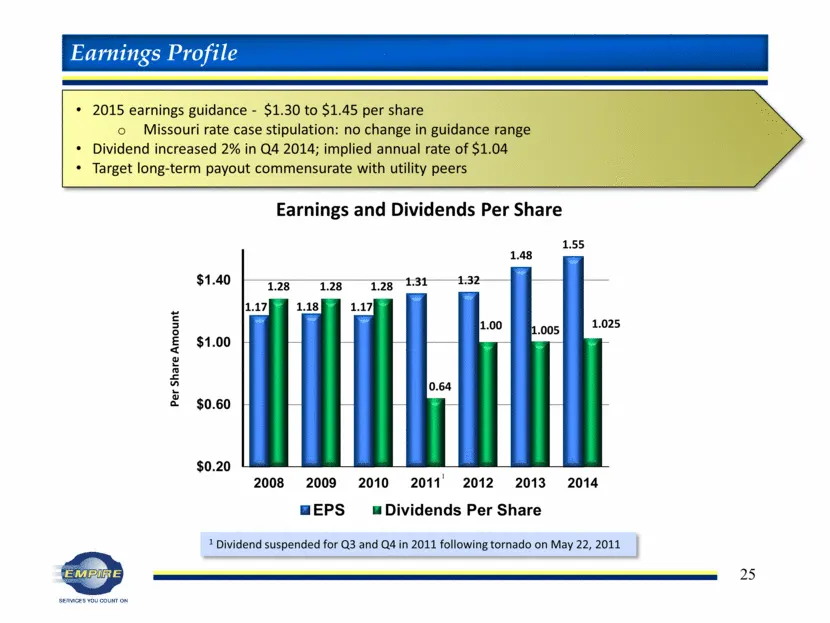
1 Dividend suspended for Q3 and Q4 in 2011 following tornado on May 22, 2011 Earnings Profile 2015 earnings guidance - $1.30 to $1.45 per share Missouri rate case stipulation: no change in guidance range Dividend increased 2% in Q4 2014; implied annual rate of $1.04 Target long-term payout commensur
Slide 27: Return on Equity
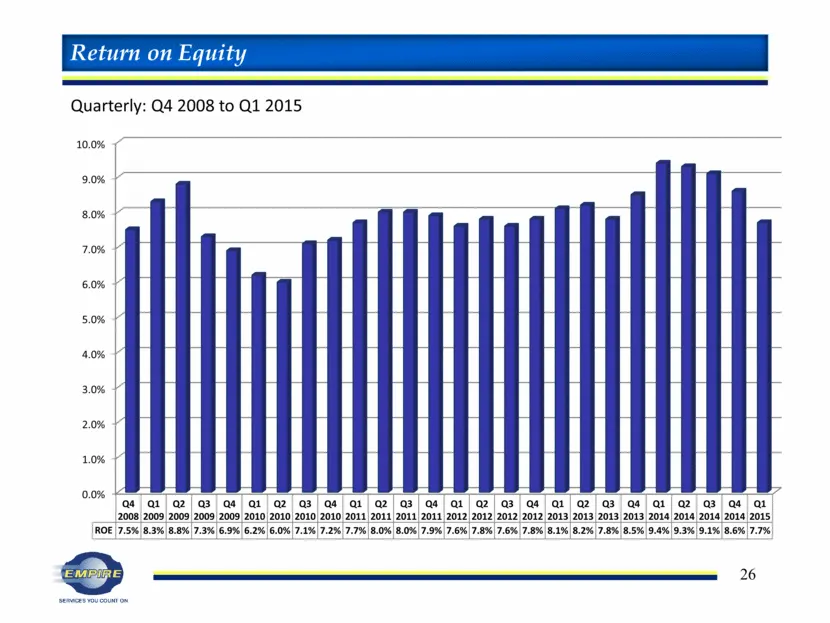
Return on Equity Quarterly: Q4 2008 to Q1 2015
Slide 28: Financial summary
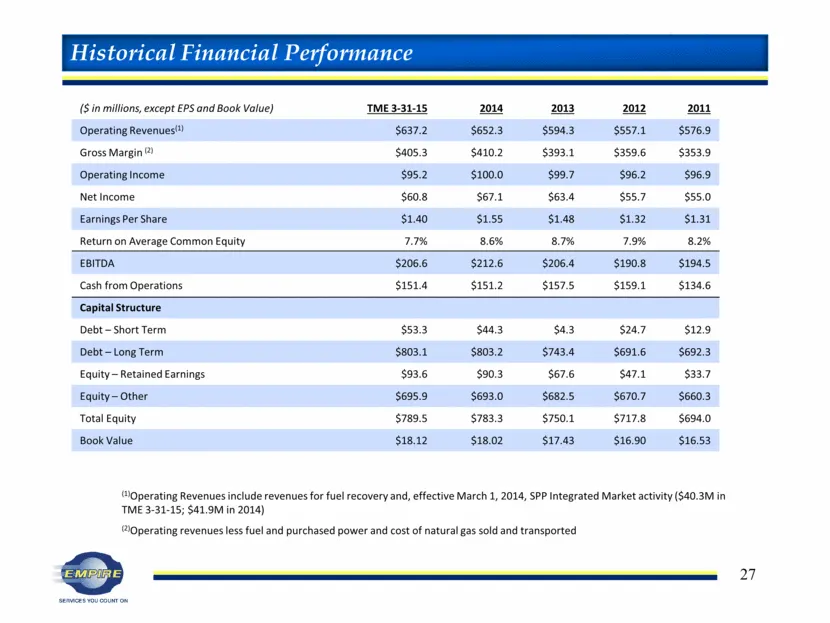
(1)Operating Revenues include revenues for fuel recovery and, effective March 1, 2014, SPP Integrated Market activity ($40.3M in TME 3-31-15; $41.9M in 2014) (2)Operating revenues less fuel and purchased power and cost of natural gas sold and transported ($ in millions, except EPS and Book Value) TM
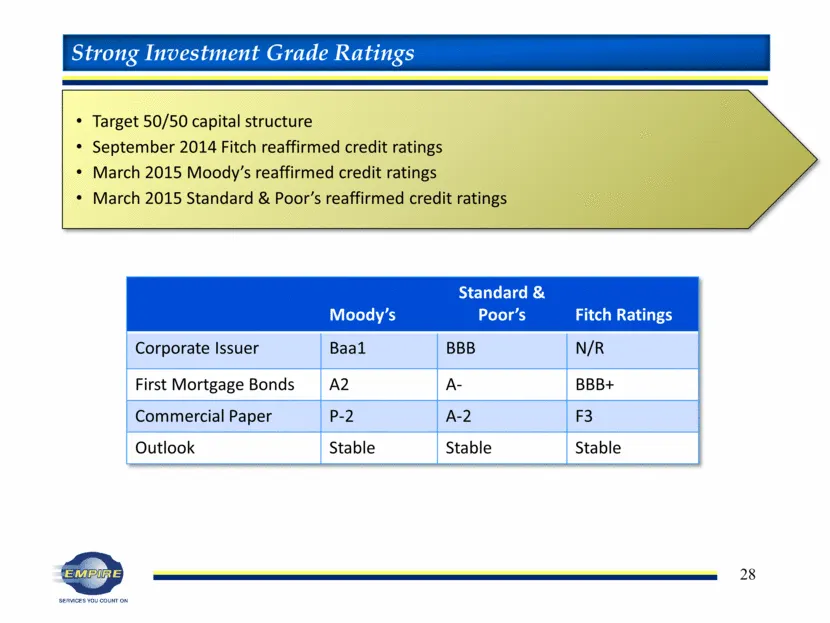
Slide 29: Strong Investment Grade Ratings
Moody’s Standard & Poor’s Fitch Ratings Corporate Issuer Baa1 BBB N/R First Mortgage Bonds A2 A- BBB+ Commercial Paper P-2 A-2 F3 Outlook Stable Stable Stable Strong Investment Grade Ratings Target 50/50 capital structure September 2014 Fitch reaffirmed credit ratings March 2015 Moody’s reaffirmed c
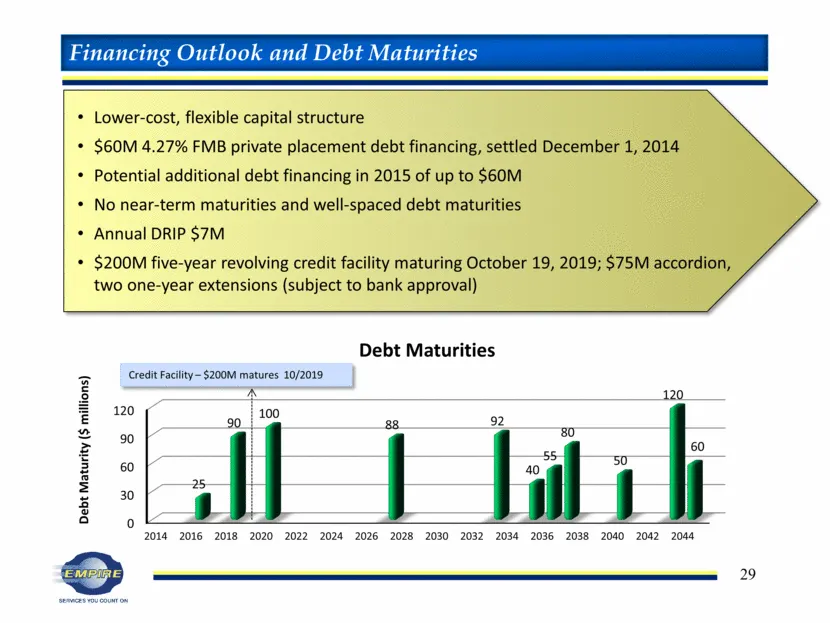
Slide 30: Financing Outlook and Debt Maturities
Financing Outlook and Debt Maturities Lower-cost, flexible capital structure $60M 4.27% FMB private placement debt financing, settled December 1, 2014 Potential additional debt financing in 2015 of up to $60M No near-term maturities and well-spaced debt maturities Annual DRIP $7M $200M five-year rev

Slide 31: (This page intentionally left blank)
(This page intentionally left blank)
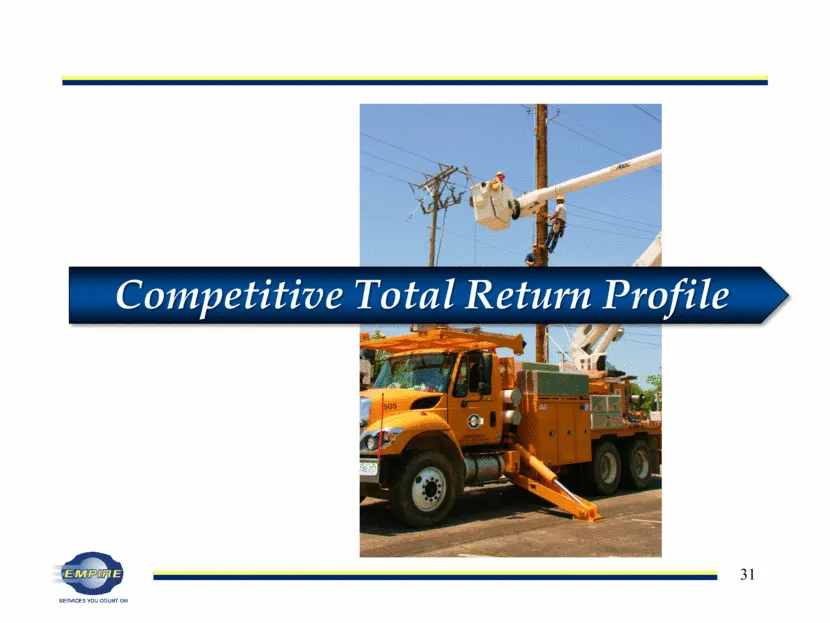
Slide 32: Competitive Total Return Profile
Competitive Total Return Profile
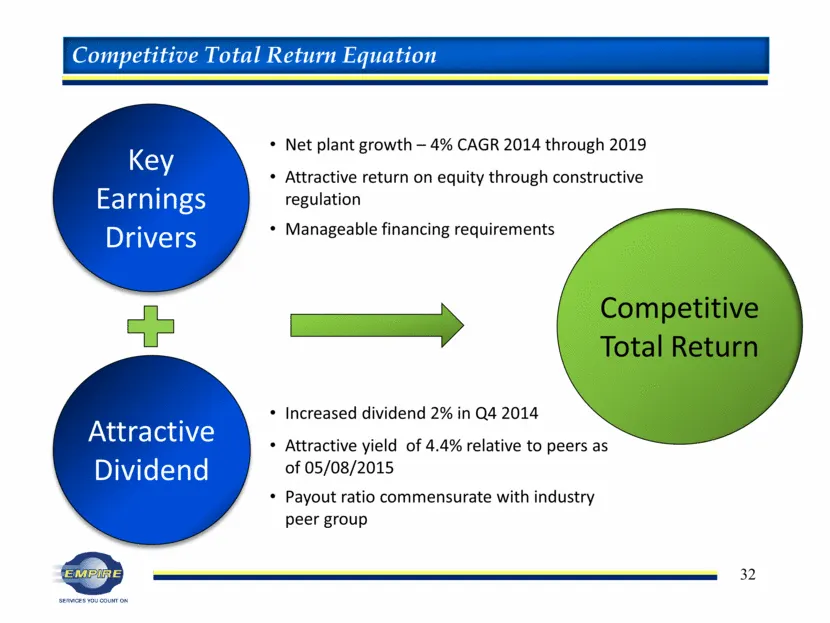
Slide 33: Competitive Total Return Equation
Key Earnings Drivers Attractive Dividend CompetitiveTotal Return Net plant growth – 4% CAGR 2014 through 2019 Attractive return on equity through constructive regulation Manageable financing requirements Increased dividend 2% in Q4 2014 Attractive yield of 4.4% relative to peers as of 05/08/2015 Pay
Slide 34: Total Return Performance
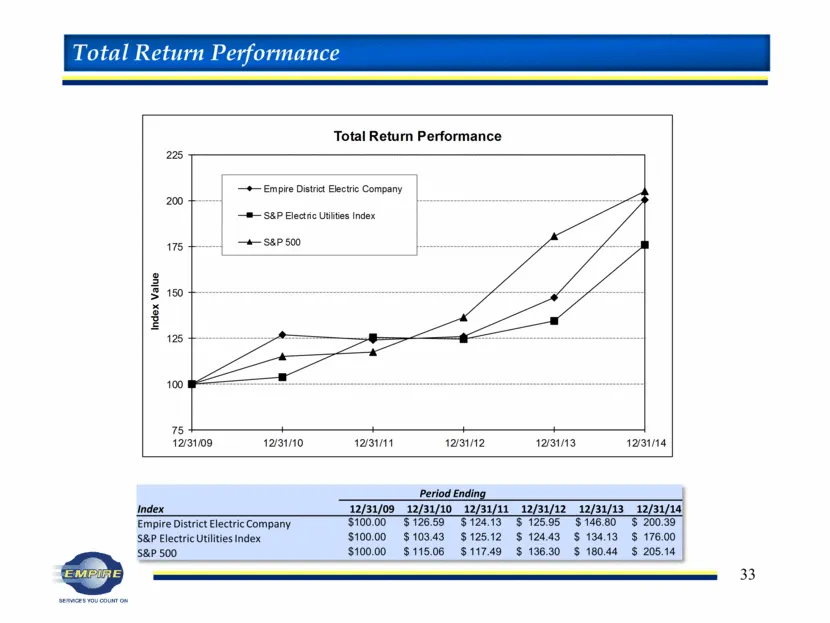
Period Ending Index 12/31/09 12/31/10 12/31/11 12/31/12 12/31/13 12/31/14 Empire District Electric Company $100.00 $ 126.59 $ 124.13 $ 125.95 $ 146.80 $ 200.39 S&P Electric Utilities Index $100.00 $ 103.43 $ 125.12 $ 124.43 $ 134.13 $ 176.00 S&P 500 $100.00 $ 115.06 $ 117.49 $ 136.30 $ 180.44 $ 205.
Slide 35: Compelling Investment Platform
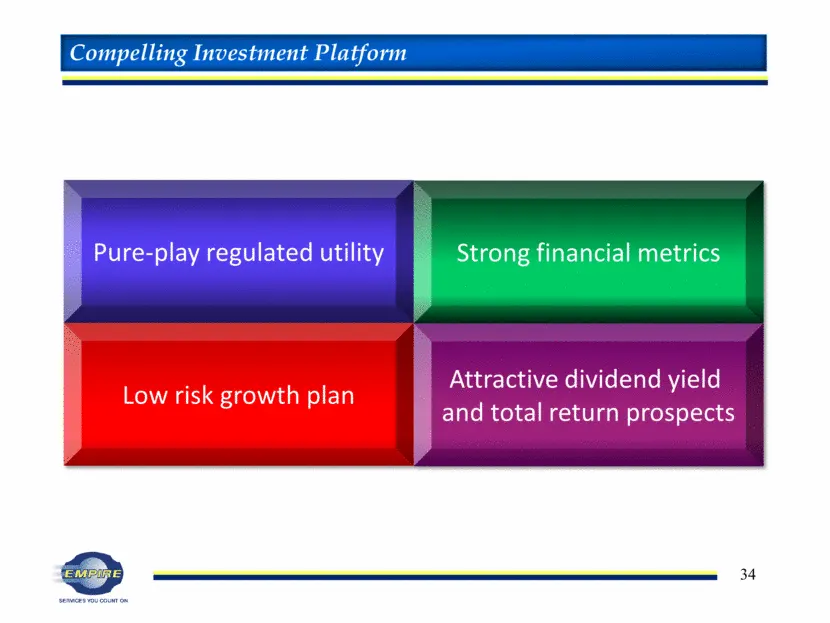
Pure-play regulated utility Low risk growth plan Strong financial metrics Attractive dividend yield and total return prospects Compelling Investment Platform
Slide 36: Regulated Electric and Gas Utility Data
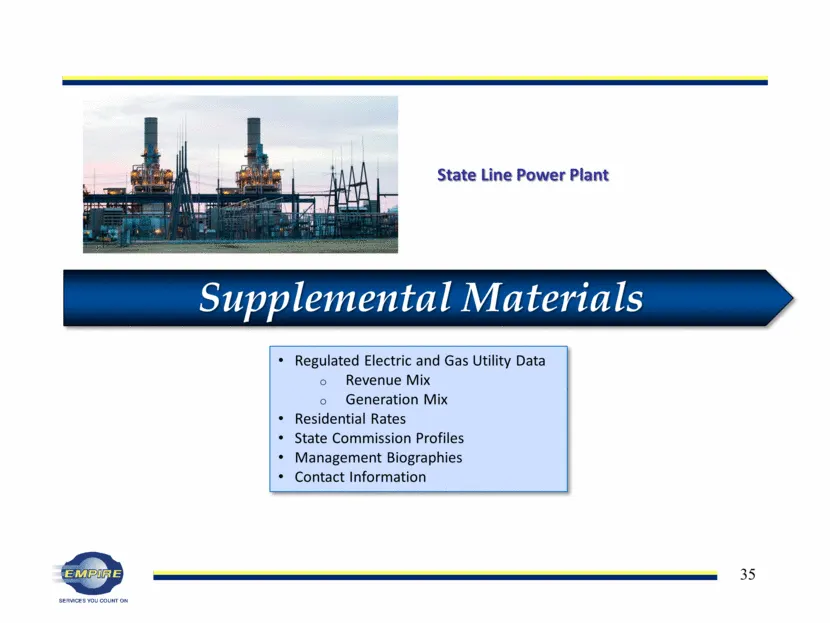
Regulated Electric and Gas Utility Data Revenue Mix Generation Mix Residential Rates State Commission Profiles Management Biographies Contact Information Supplemental Materials State Line Power Plant
Slide 37: Regulated Electric and Gas Utility: Revenue Mix
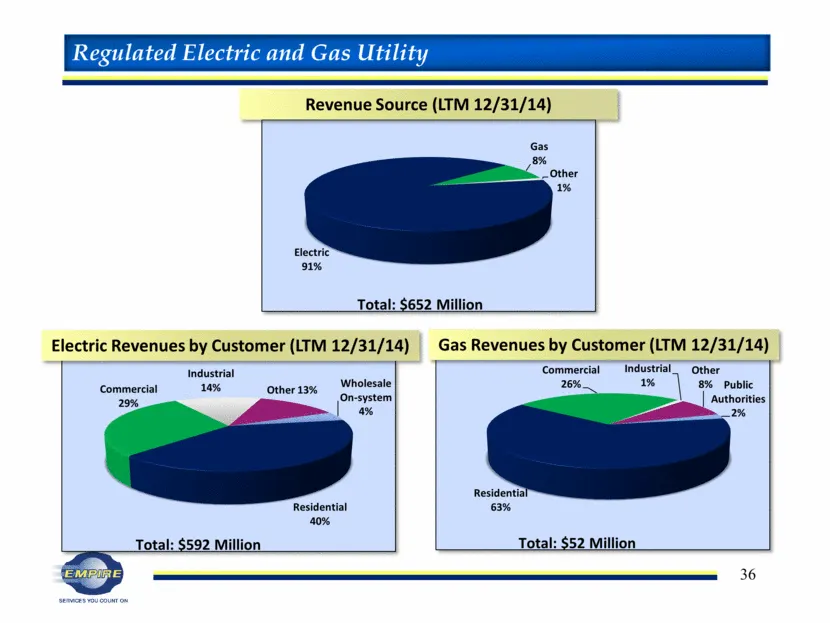
Revenue Source (LTM 12/31/14) Electric Revenues by Customer (LTM 12/31/14) Gas Revenues by Customer (LTM 12/31/14) Regulated Electric and Gas Utility Electric 91% Gas 8% Other 1% Total: $652 Million Residential 40% Commercial 29% Industrial 14% Other 13% Wholesale On - system 4% Total: $592 Million
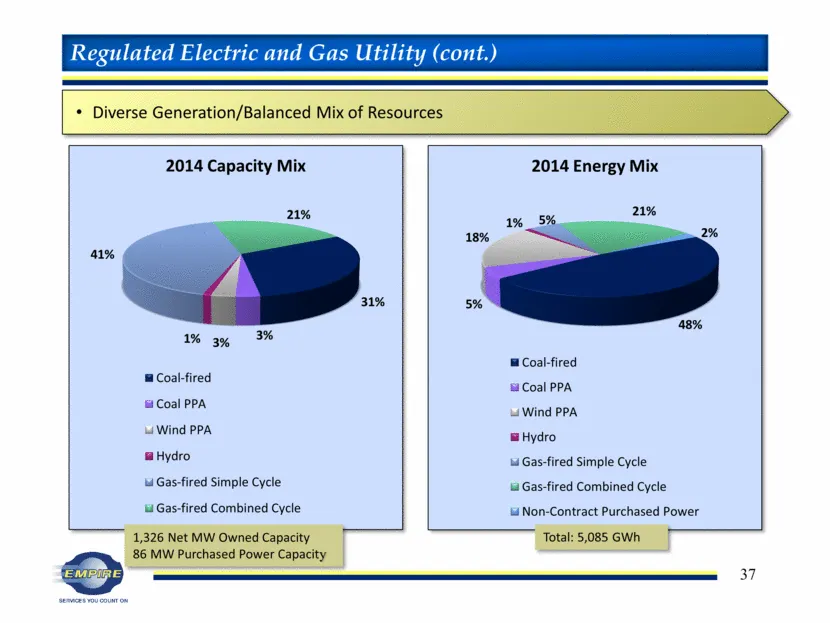
Slide 38: Diverse Generation/Balanced Mix of Resources
Diverse Generation/Balanced Mix of Resources Regulated Electric and Gas Utility (cont.) 1,326 Net MW Owned Capacity 86 MW Purchased Power Capacity Total: 5,085 GWh 31% 3% 3% 1% 41% 21% 2014 Capacity Mix Coal-fired Coal PPA Wind PPA Hydro Gas-fired Simple Cycle Gas-fired Combined Cycle 48% 5% 18% 1%
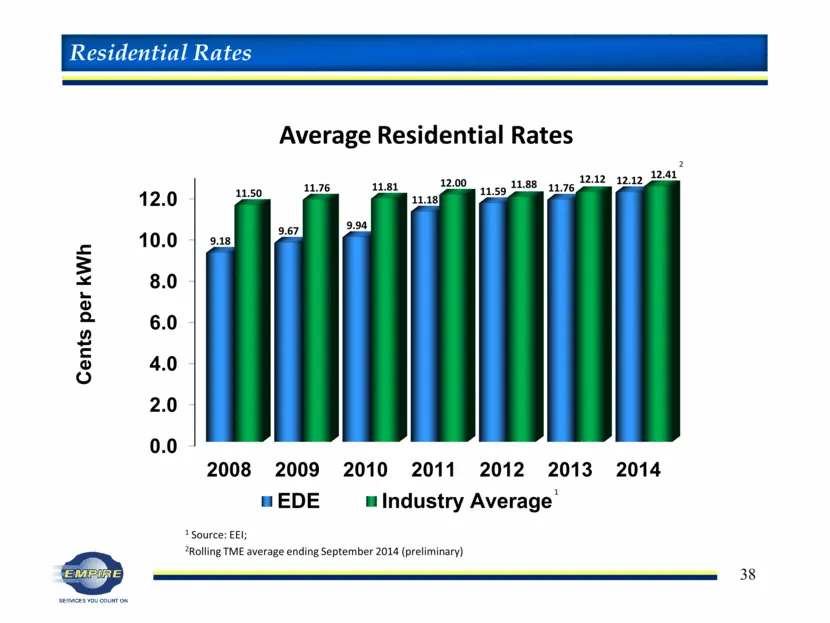
Slide 39: Average Residential Rates
Average Residential Rates 1 Source: EEI; 2Rolling TME average ending September 2014 (preliminary) 1 Residential Rates 12.12 2 0.0 2.0 4.0 6.0 8.0 10.0 12.0 2008 2009 2010 2011 2012 2013 2014 9.18 9.67 9.94 11.18 11.59 11.76 12.12 11.50 11.76 11.81 12.00 11.88 12.41 Cents per kWh EDE Industry Average
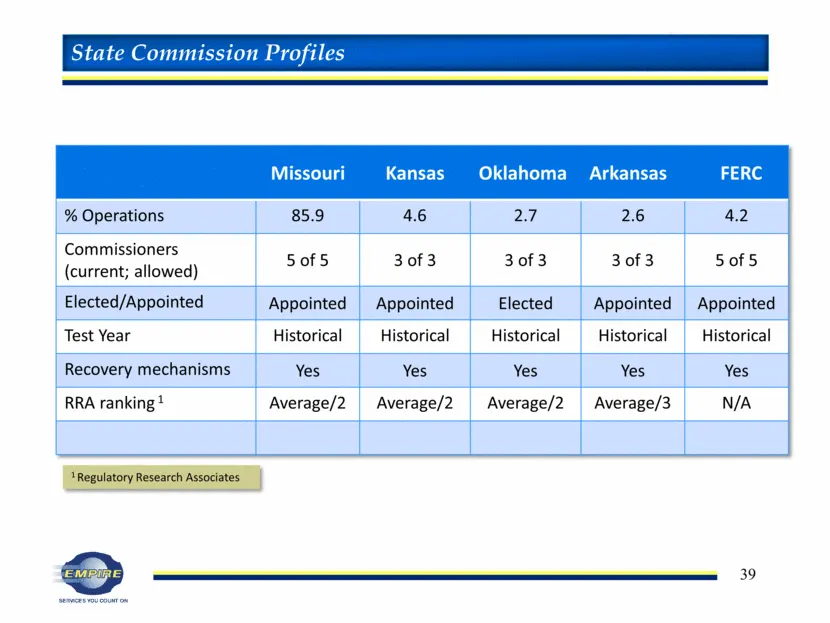
Slide 40: State Commission Profiles
Missouri Kansas Oklahoma Arkansas FERC % Operations 85.9 4.6 2.7 2.6 4.2 Commissioners (current; allowed) 5 of 5 3 of 3 3 of 3 3 of 3 5 of 5 Elected/Appointed Appointed Appointed Elected Appointed Appointed Test Year Historical Historical Historical Historical Historical Recovery mechanisms Yes Yes
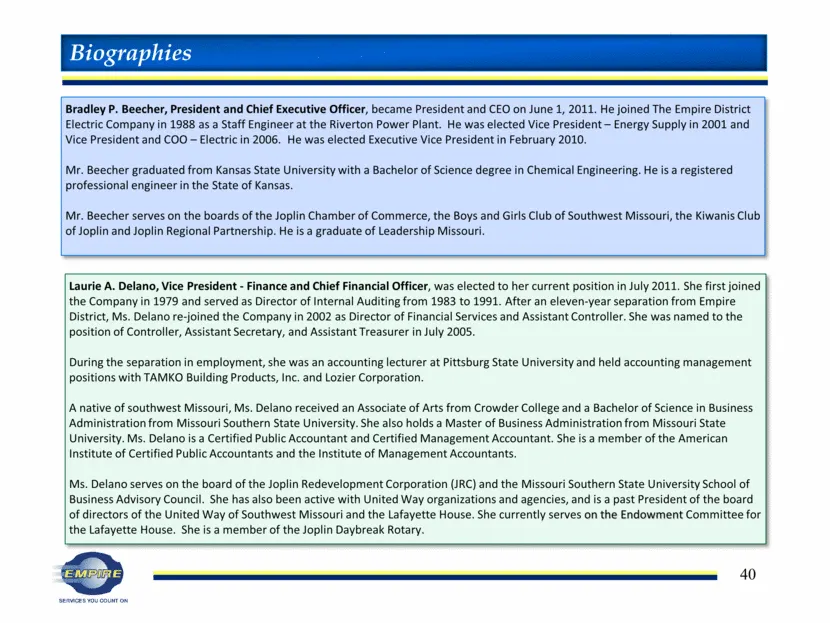
Slide 41: Management Biographies
Bradley P. Beecher, President and Chief Executive Officer, became President and CEO on June 1, 2011. He joined The Empire District Electric Company in 1988 as a Staff Engineer at the Riverton Power Plant. He was elected Vice President – Energy Supply in 2001 and Vice President and COO – Electric in
Slide 42: Management Biographies (continued)
Dale W. Harrington, Corporate Secretary and Director of Investor Relations, was elected Secretary on February 5, 2015, effective May 1, 2015. He was named Director of Investor Relations in August 2014 and elected Assistant Secretary in October 2014. He joined The Empire District Electric Company in
Slide 43: Contact Us
The Empire District Electric Company 602 S. Joplin Avenue Joplin, MO 64801 www.empiredistrict.com Dale Harrington Office: 417-625-4222 Mobile: 417-825-8281 [email protected] Laurie Delano Office: 417-625-5127 Mobile: 417-291-4397 [email protected] Contact Us
Slide 44: Services You Count On
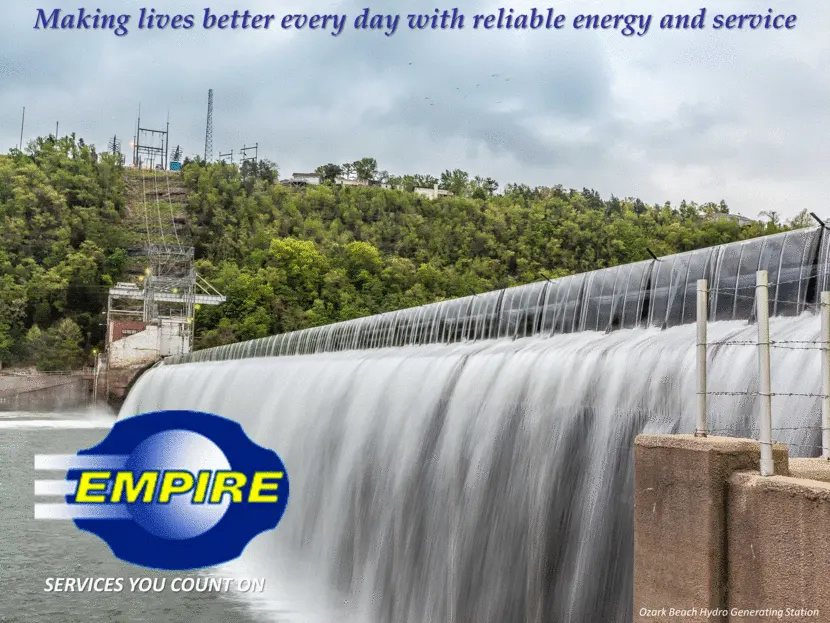
Making lives better every day with reliable energy and service SERVICES YOU COUNT ON Ozark Beach Hydro Generating Station
Source: SEC EDGAR · 8-K filed May 11, 2015
More decks from The Empire District Electric Company
 Q3 2016 Earnings Presentation32 slides · Nov 7, 2016
 Investor Presentation (September 2016)33 slides · Sep 19, 2016
 Merger or Acquisition (May 2016)35 slides · May 18, 2016
 Q1 2016 Earnings Presentation32 slides · May 6, 2016
 Merger or Acquisition (April 2016)8 slides · Apr 12, 2016
 Merger or Acquisition (March 2016)28 slides · Mar 29, 2016