Columbia Pipeline Partners LP — Investor Presentation (January 2017)
56 slides from Columbia Pipeline Partners LP's investor presentation, Jan 9, 2017
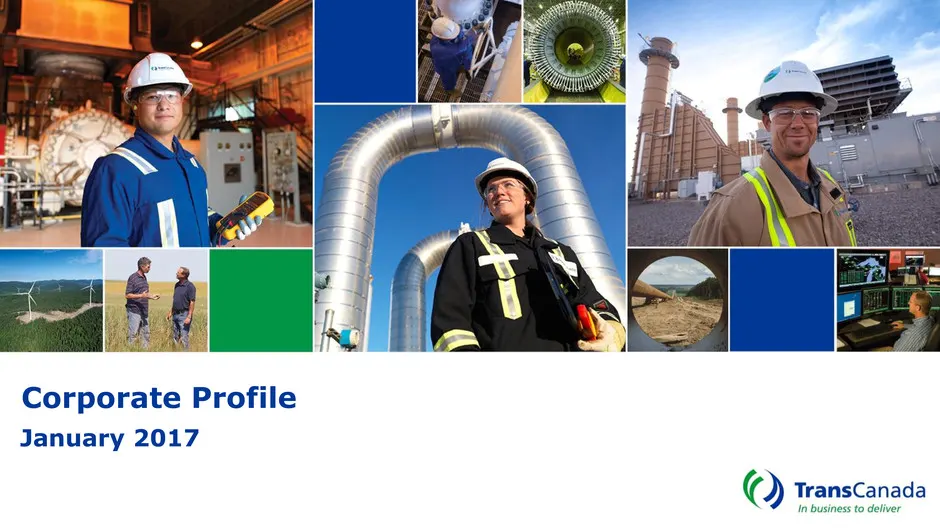
Slide 1: Corporate Profile January 2017
Corporate Profile January 2017
Slide 2: Forward Looking Information and Non-GAAP Measures
Forward Looking Information and Non-GAAP Measures This presentation includes certain forward looking information, including future oriented financial information or financial outlook, which is intended to help current and potential investors understand management’s assessment of our future plans and
Slide 3: Additional Information
Additional Information Additional Information and Where to Find it: In connection with the proposed acquisition of the outstanding common units of Columbia Pipeline Partners LP (CPPL), CPPL has filed with the SEC a proxy statement with respect to a special meeting of its unitholders to be convened t
Slide 4: Key Themes
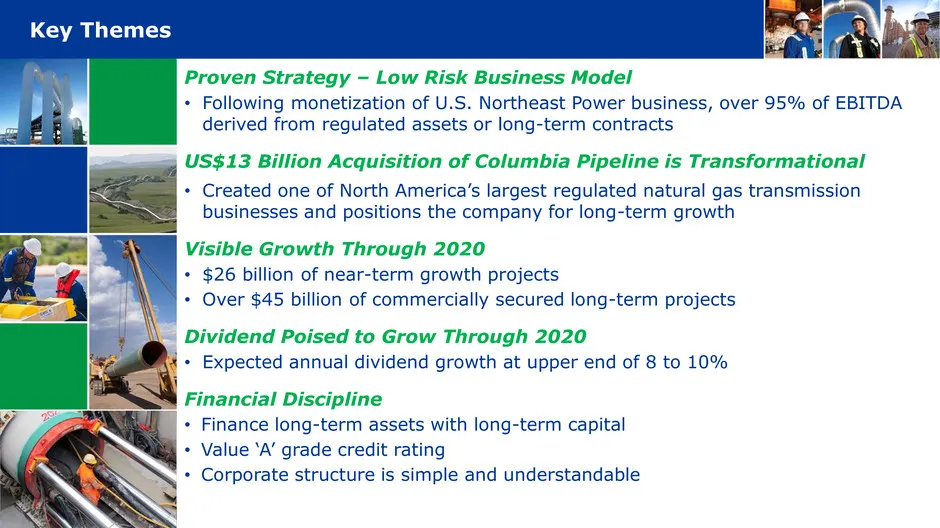
Key Themes Proven Strategy – Low Risk Business Model • Following monetization of U.S. Northeast Power business, over 95% of EBITDA derived from regulated assets or long-term contracts US$13 Billion Acquisition of Columbia Pipeline is Transformational • Created one of North America’s largest regulate
Slide 5: TransCanada Today
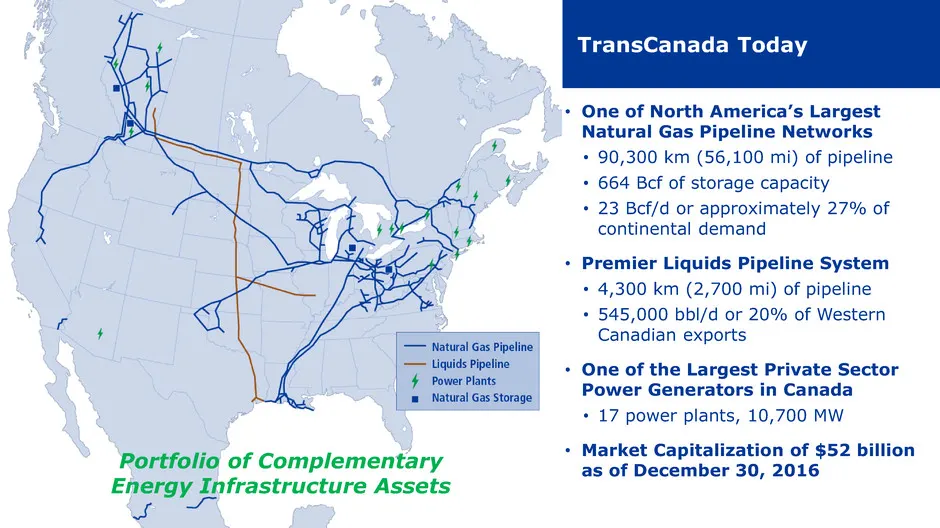
TransCanada Today • One of North America’s Largest Natural Gas Pipeline Networks • 90,300 km (56,100 mi) of pipeline • 664 Bcf of storage capacity • 23 Bcf/d or approximately 27% of continental demand • Premier Liquids Pipeline System • 4,300 km (2,700 mi) of pipeline • 545,000 bbl/d or 20% of Weste
Slide 6: Risks are Known and Contained
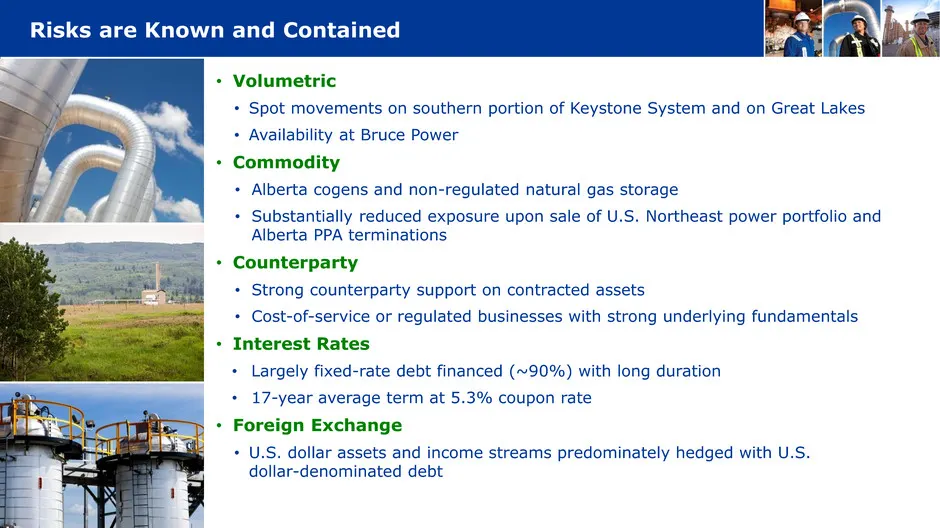
Risks are Known and Contained • Volumetric • Spot movements on southern portion of Keystone System and on Great Lakes • Availability at Bruce Power • Commodity • Alberta cogens and non-regulated natural gas storage • Substantially reduced exposure upon sale of U.S. Northeast power portfolio and Albe
Slide 7: $26 Billion Visible Near-Term Capital Program
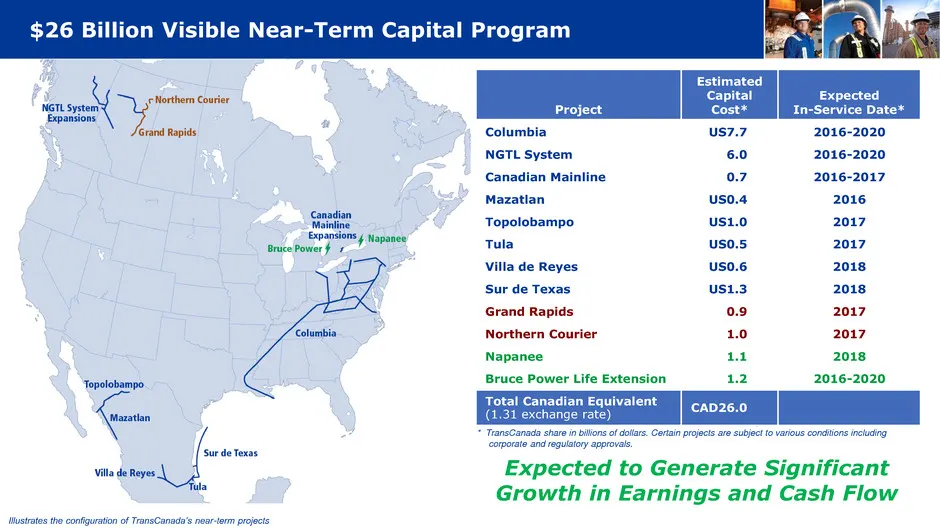
$26 Billion Visible Near-Term Capital Program Illustrates the configuration of TransCanada’s near-term projects Project Estimated Capital Cost* Expected In-Service Date* Columbia US7.7 2016-2020 NGTL System 6.0 2016-2020 Canadian Mainline 0.7 2016-2017 Mazatlan US0.4 2016 Topolobampo US1.0 2017 Tula
Slide 8: Dividend Growth Outlook Through 2020
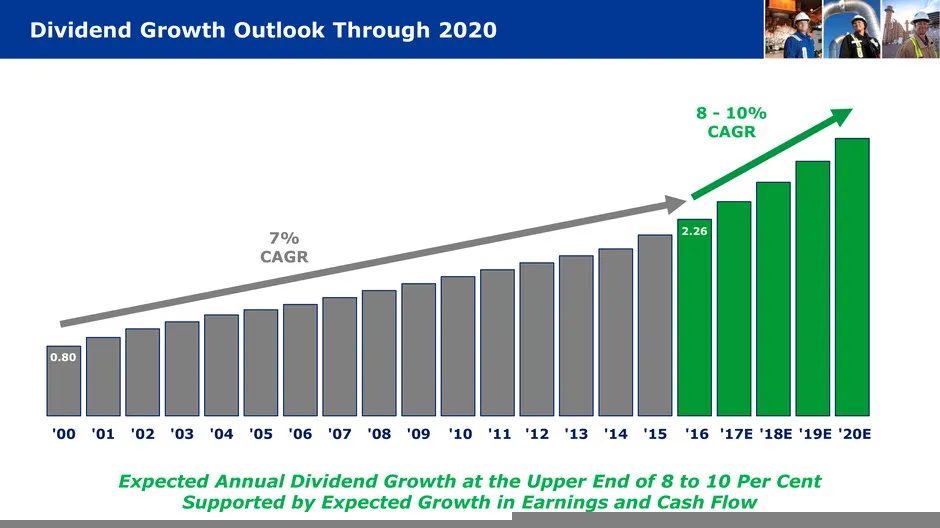
'00 '01 '02 '03 '04 '05 '06 '07 '08 '09 '10 '11 '12 '13 '14 '15 '16 '17E '18E '19E '20E Dividend Growth Outlook Through 2020 8 - 10% CAGR 7% CAGR Expected Annual Dividend Growth at the Upper End of 8 to 10 Per Cent Supported by Expected Growth in Earnings and Cash Flow 0.80 2.26
Slide 9: Columbia Pipeline Acquisition
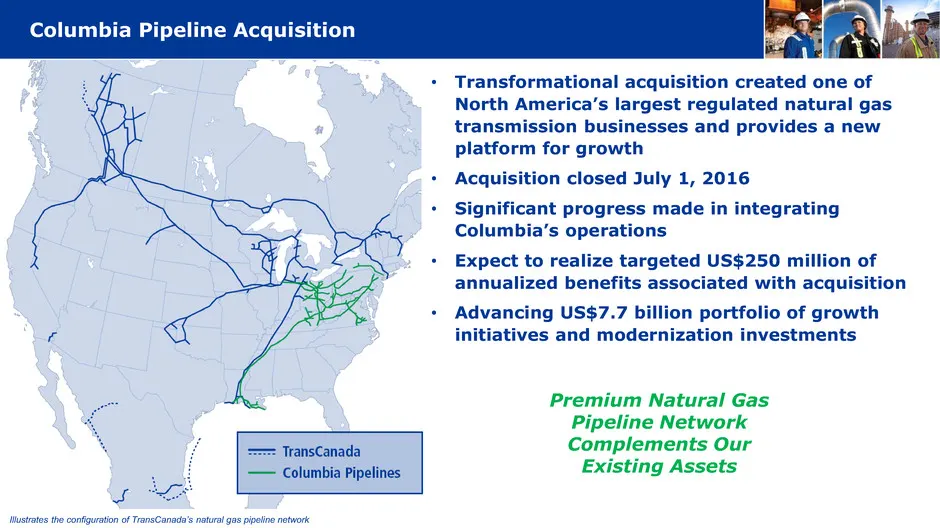
Columbia Pipeline Acquisition • Transformational acquisition created one of North America’s largest regulated natural gas transmission businesses and provides a new platform for growth • Acquisition closed July 1, 2016 • Significant progress made in integrating Columbia’s operations • Expect to real
Slide 10: North American Natural Gas Supply/Demand Balance
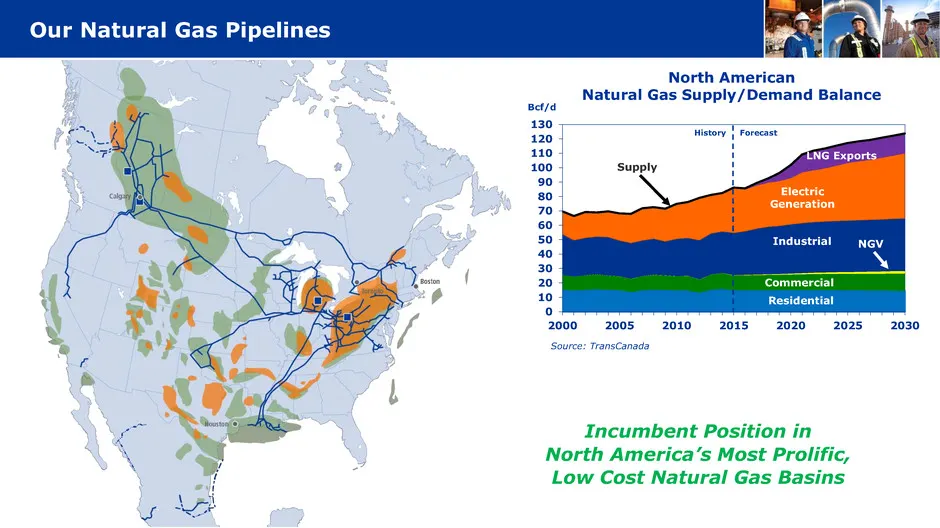
North American Natural Gas Supply/Demand Balance Source: TransCanada 0 10 20 30 40 50 60 70 80 90 100 110 120 130 2000 2005 2010 2015 2020 2025 2030 Supply LNG Exports Forecast History Electric Generation Industrial Commercial Residential NGV Our Natural Gas Pipelines Bcf/d Incumbent Position in Nor
Slide 11: Columbia Pipeline Capital Program
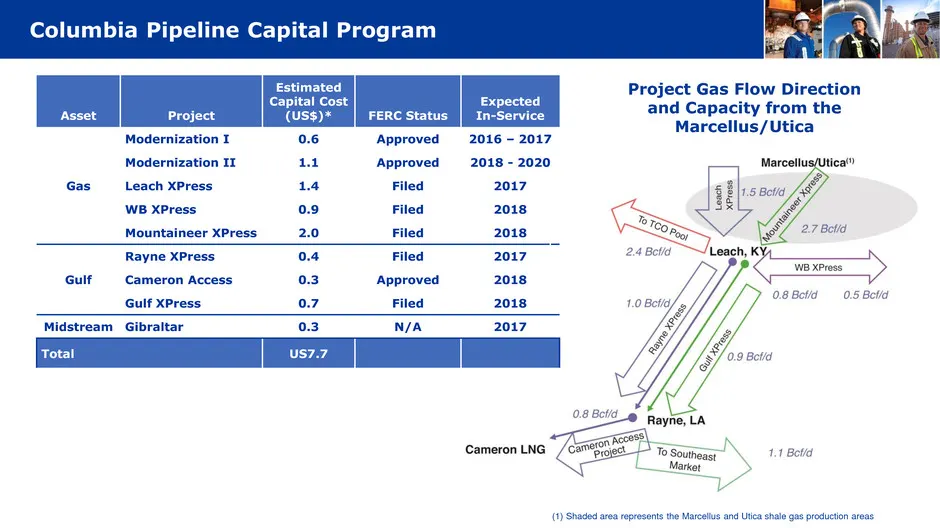
Columbia Pipeline Capital Program * Columbia share in billions of U.S. dollars. Certain projects are subject to various conditions including regulatory approvals. Asset Project Estimated Capital Cost (US$)* FERC Status Expected In-Service Gas Modernization I 0.6 Approved 2016 – 2017 Modernization II
Slide 12: NGTL System's Unparalleled Position
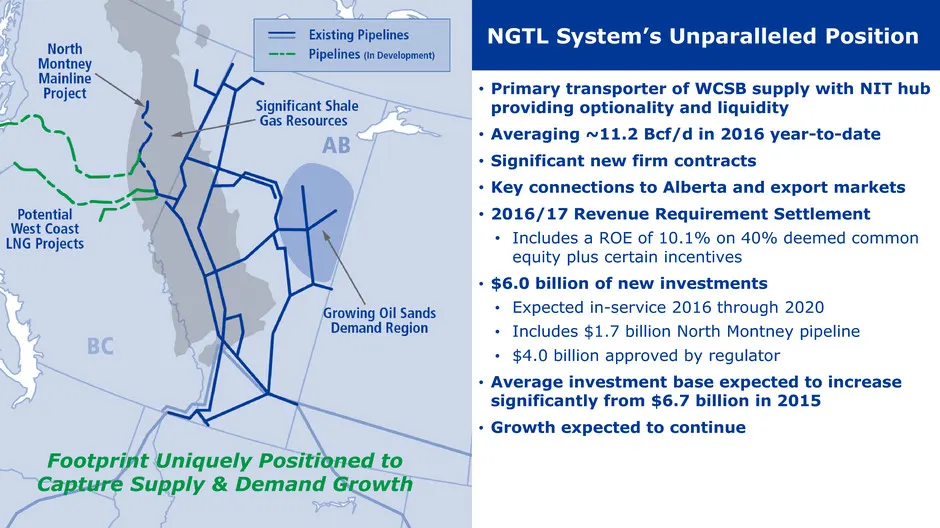
NGTL System’s Unparalleled Position • Primary transporter of WCSB supply with NIT hub providing optionality and liquidity • Averaging ~11.2 Bcf/d in 2016 year-to-date • Significant new firm contracts • Key connections to Alberta and export markets • 2016/17 Revenue Requirement Settlement • Includes
Slide 13: Mexico – Solid Position and Growing
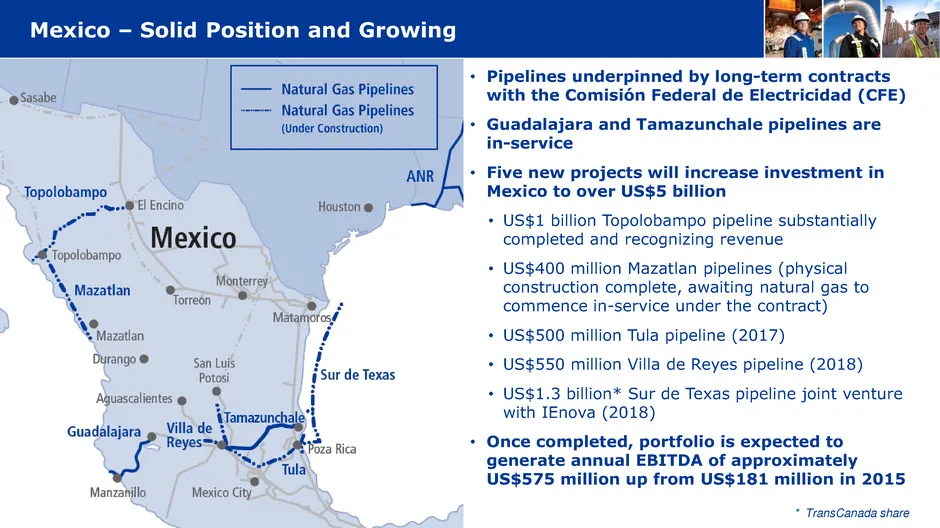
Mexico – Solid Position and Growing • Pipelines underpinned by long-term contracts with the Comisión Federal de Electricidad (CFE) • Guadalajara and Tamazunchale pipelines are in-service • Five new projects will increase investment in Mexico to over US$5 billion • US$1 billion Topolobampo pipeline s
Slide 14: Keystone - A Premier Crude Oil Pipeline System
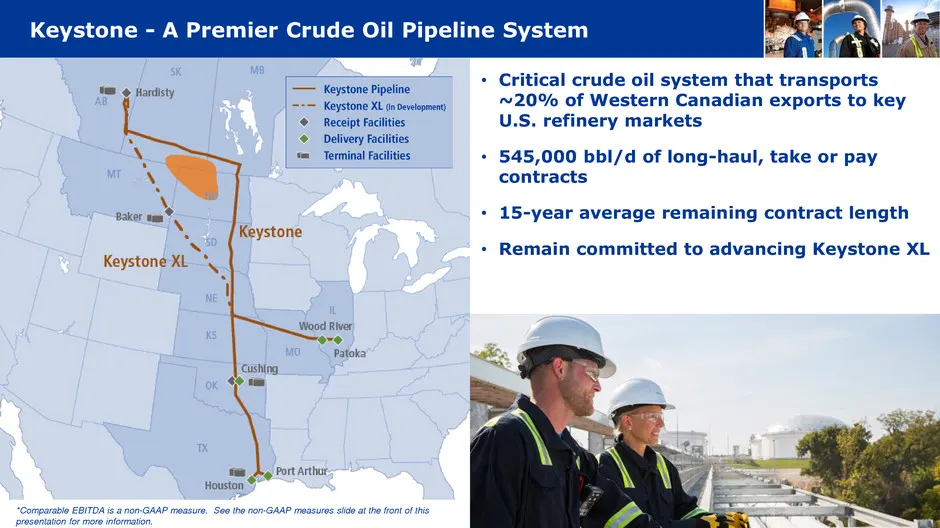
Keystone - A Premier Crude Oil Pipeline System • Critical crude oil system that transports ~20% of Western Canadian exports to key U.S. refinery markets • 545,000 bbl/d of long-haul, take or pay contracts • 15-year average remaining contract length • Remain committed to advancing Keystone XL *Compar
Slide 15: Northern Courier and Grand Rapids
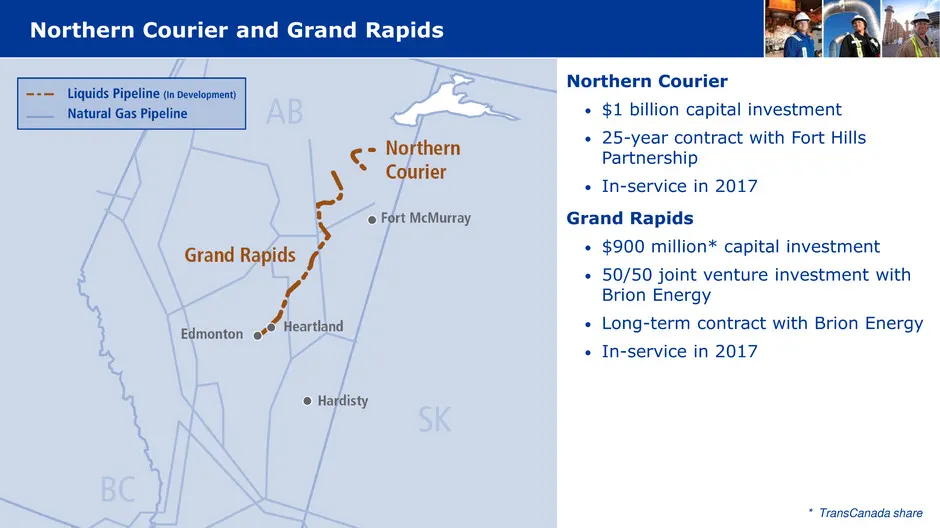
Northern Courier • $1 billion capital investment • 25-year contract with Fort Hills Partnership • In-service in 2017 Grand Rapids • $900 million* capital investment • 50/50 joint venture investment with Brion Energy • Long-term contract with Brion Energy • In-service in 2017 Northern Courier and Gra
Slide 16: Energy Footprint Following Sale of U.S. Northeast Power
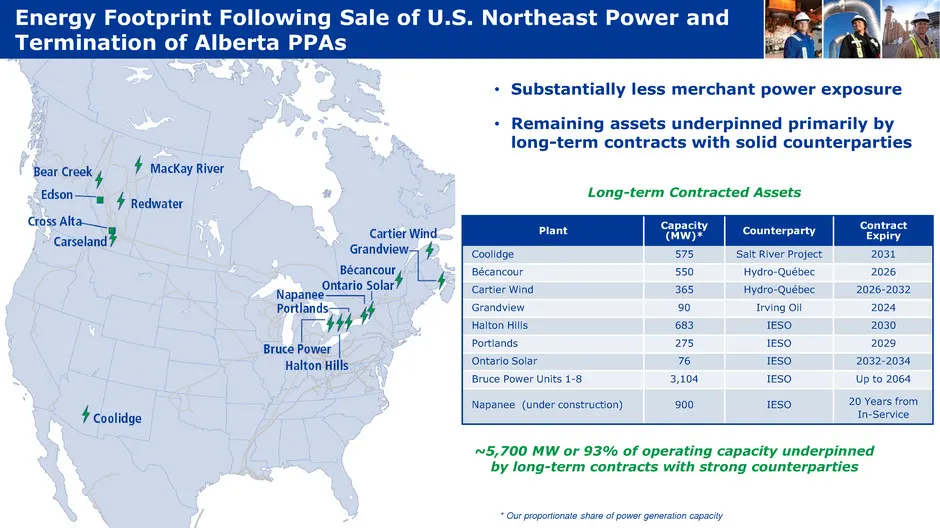
• Substantially less merchant power exposure • Remaining assets underpinned primarily by long-term contracts with solid counterparties Energy Footprint Following Sale of U.S. Northeast Power and Termination of Alberta PPAs * Our proportionate share of power generation capacity ~5,700 MW or 93% of op
Slide 17: Bruce Power
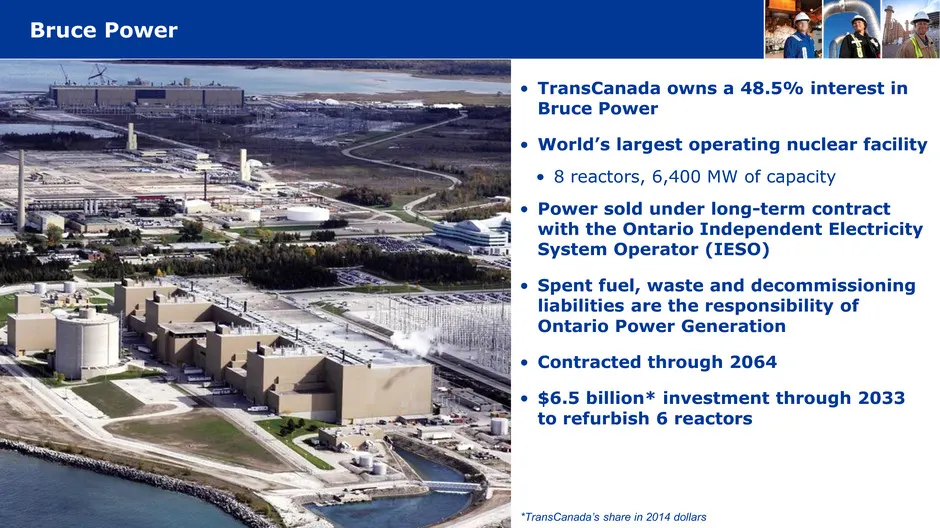
Bruce Power • TransCanada owns a 48.5% interest in Bruce Power • World’s largest operating nuclear facility • 8 reactors, 6,400 MW of capacity • Power sold under long-term contract with the Ontario Independent Electricity System Operator (IESO) • Spent fuel, waste and decommissioning liabilities are
Slide 18: Numerous Levers Available to Fund Near-Term Capital Program
Numerous Levers Available to Fund Near-Term Capital Program • Strong and growing internally generated cash flow • Access to capital markets including: • Senior debt • Preferred shares and hybrid securities • Raised $1 billion of preferred shares at an initial rate of 4.90 per cent per annum in Novem
Slide 19: $45 Billion+ of Commercially Secured Long-Term Projects
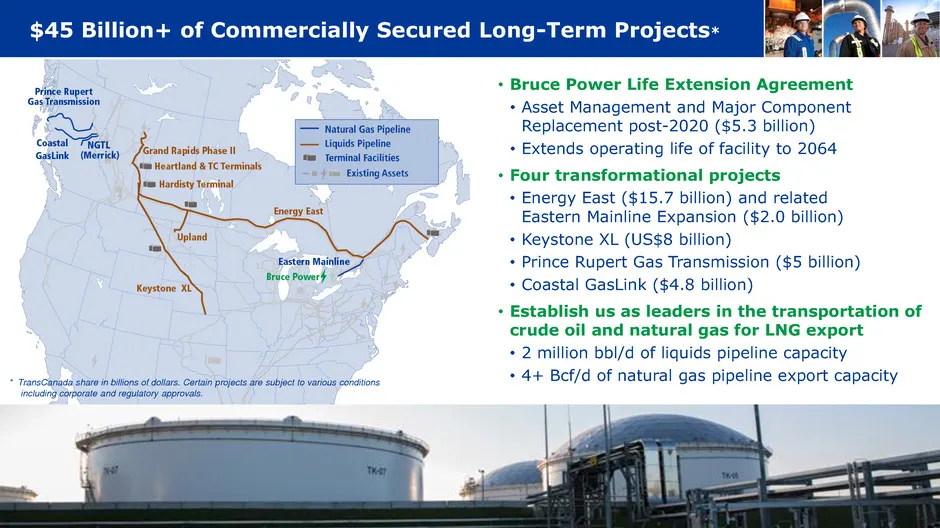
$45 Billion+ of Commercially Secured Long-Term Projects* * TransCanada share in billions of dollars. Certain projects are subject to various conditions including corporate and regulatory approvals. • Bruce Power Life Extension Agreement • Asset Management and Major Component Replacement post-2020 ($
Slide 20: Key Takeaways
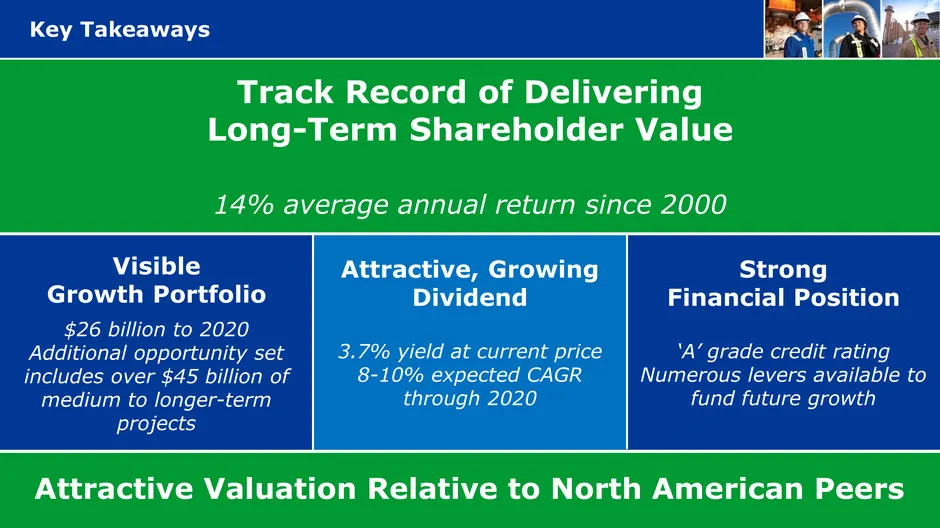
Strong Financial Position ‘A’ grade credit rating Numerous levers available to fund future growth Track Record of Delivering Long-Term Shareholder Value 14% average annual return since 2000 Visible Growth Portfolio $26 billion to 2020 Additional opportunity set includes over $45 billion of medium to
Slide 21: Corporate Profile January 2017
Corporate Profile January 2017
Slide 22: Natural Gas Pipelines
Natural Gas Pipelines () Teanscanada
Slide 23: NGTL Near-Term Growth
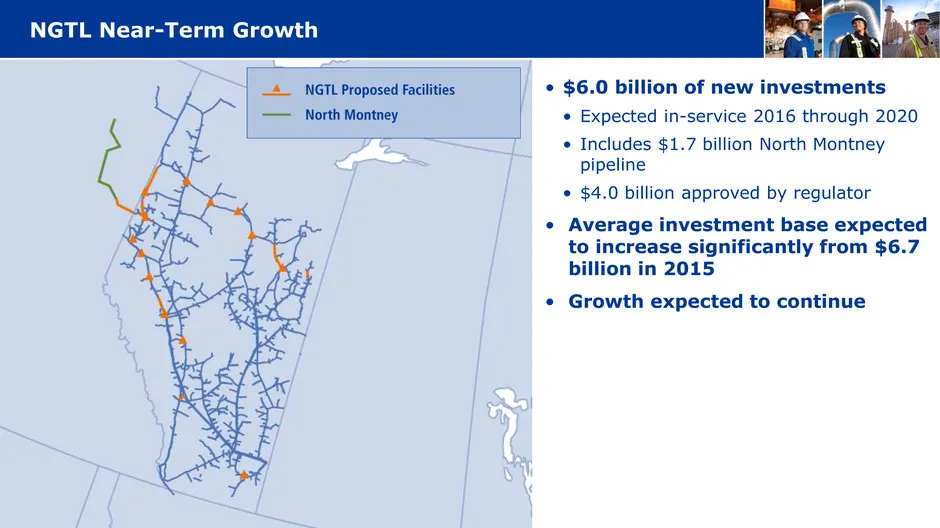
NGTL Near-Term Growth • $6.0 billion of new investments • Expected in-service 2016 through 2020 • Includes $1.7 billion North Montney pipeline • $4.0 billion approved by regulator • Average investment base expected to increase significantly from $6.7 billion in 2015 • Growth expected to continue
Slide 24: Canadian Mainline – Critically Important Infrastructure
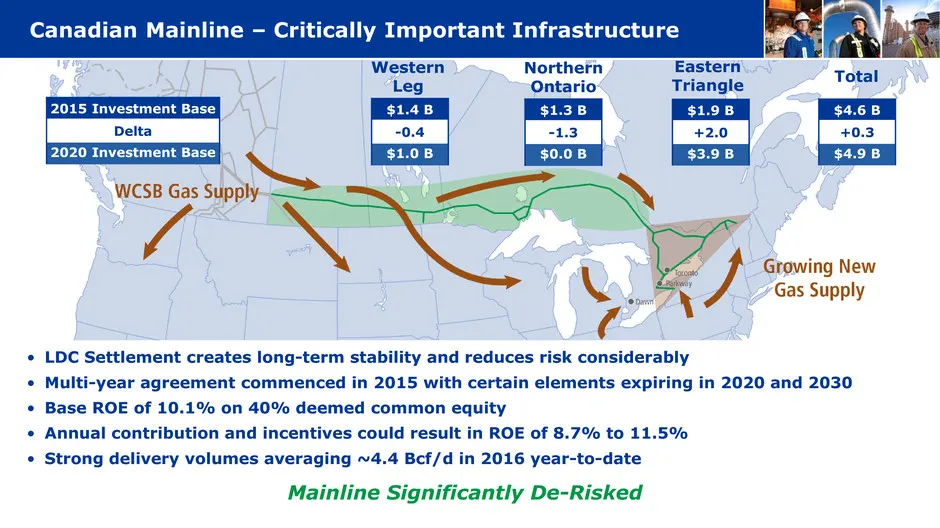
Canadian Mainline – Critically Important Infrastructure $1.4 B -0.4 $1.0 B $1.9 B +2.0 $3.9 B $4.6 B +0.3 $4.9 B 2015 Investment Base Delta 2020 Investment Base Western Leg Eastern Triangle Northern Ontario Total $1.3 B -1.3 $0.0 B • LDC Settlement creates long-term stability and reduces risk consid
Slide 25: Mainline Growth through Expansion within Eastern Triangle
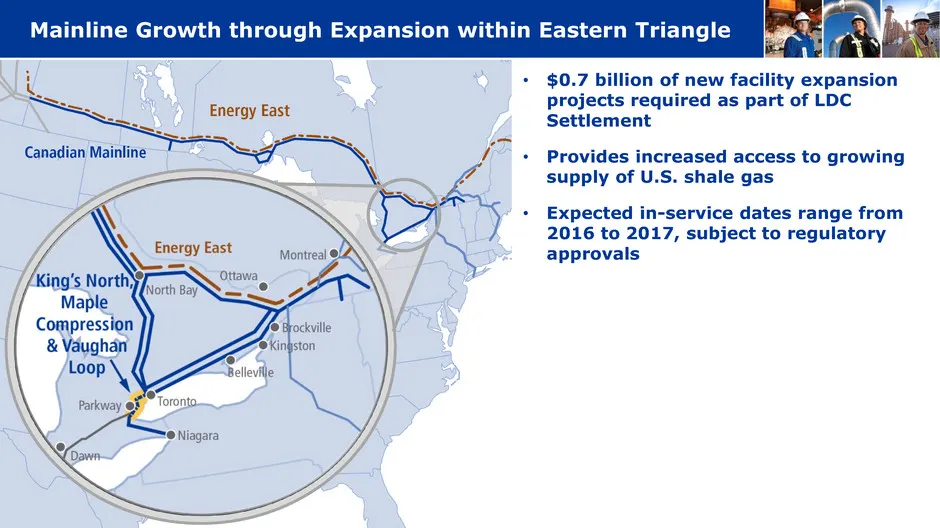
Mainline Growth through Expansion within Eastern Triangle • $0.7 billion of new facility expansion projects required as part of LDC Settlement • Provides increased access to growing supply of U.S. shale gas • Expected in-service dates range from 2016 to 2017, subject to regulatory approvals
Slide 26: Growing the U.S. Gas Pipelines Network
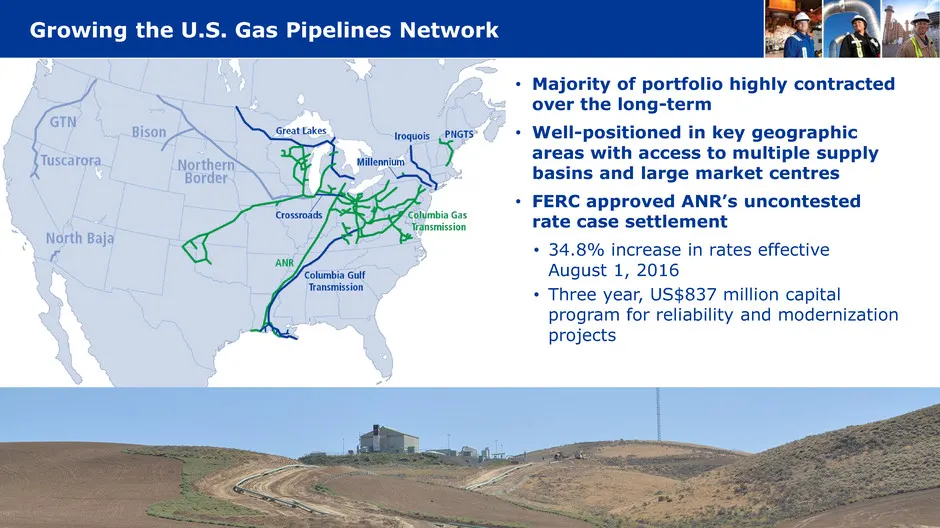
Growing the U.S. Gas Pipelines Network • Majority of portfolio highly contracted over the long-term • Well-positioned in key geographic areas with access to multiple supply basins and large market centres • FERC approved ANR’s uncontested rate case settlement • 34.8% increase in rates effective Augu
Slide 27: Columbia Pipeline Group Asset Overview
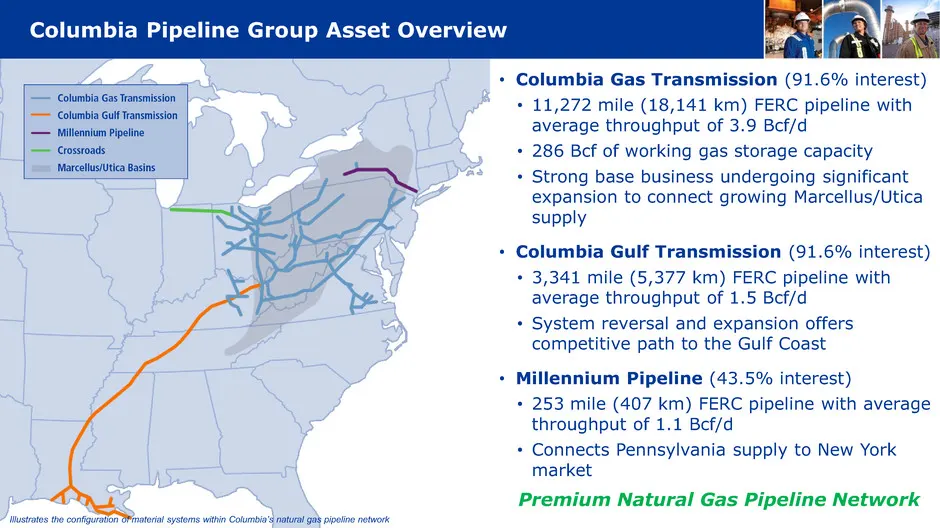
Columbia Pipeline Group Asset Overview • Columbia Gas Transmission (91.6% interest) • 11,272 mile (18,141 km) FERC pipeline with average throughput of 3.9 Bcf/d • 286 Bcf of working gas storage capacity • Strong base business undergoing significant expansion to connect growing Marcellus/Utica supply
Slide 28: Positioned to Capture Growing Marcellus and Utica Production
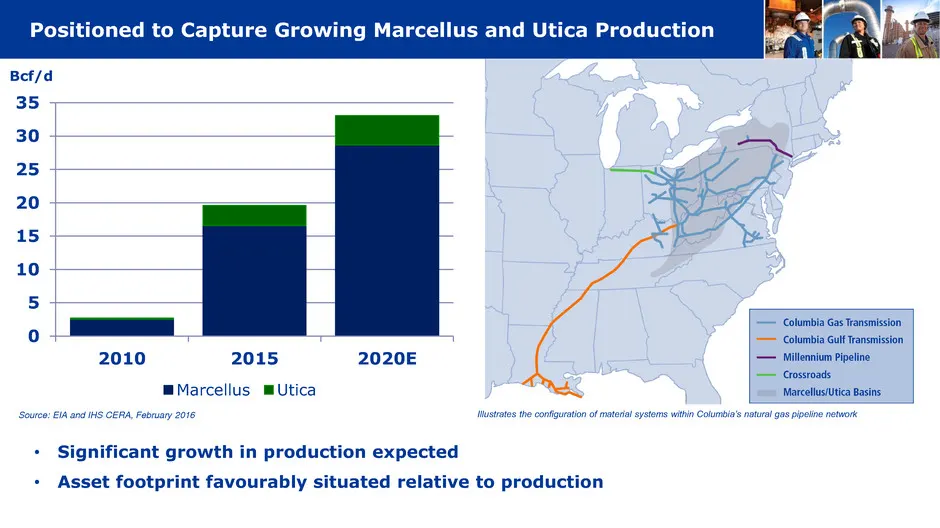
0 5 10 15 20 25 30 35 2010 2015 2020E Marcellus Utica Positioned to Capture Growing Marcellus and Utica Production • Significant growth in production expected • Asset footprint favourably situated relative to production Source: EIA and IHS CERA, February 2016 Bcf/d Illustrates the configuration of m
Slide 29: Master Limited Partnership Strategic Review
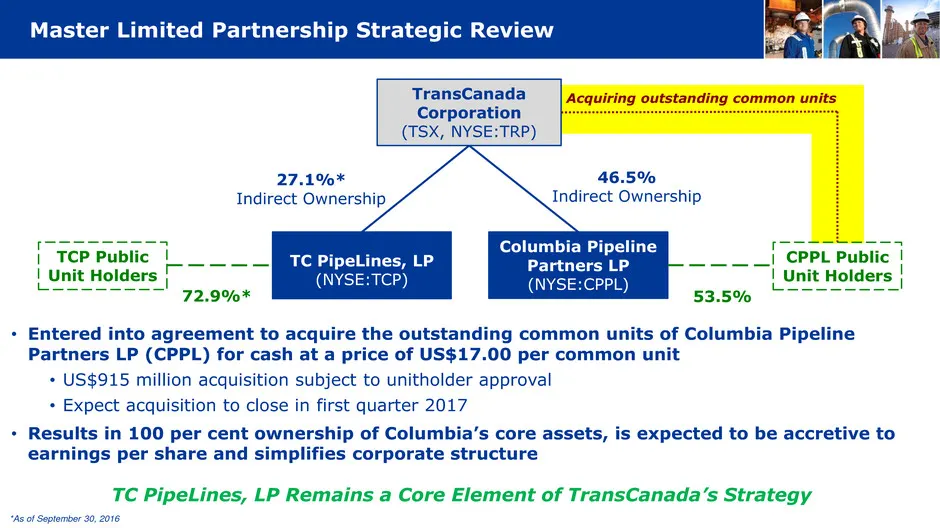
Master Limited Partnership Strategic Review • Entered into agreement to acquire the outstanding common units of Columbia Pipeline Partners LP (CPPL) for cash at a price of US$17.00 per common unit • US$915 million acquisition subject to unitholder approval • Expect acquisition to close in first quar
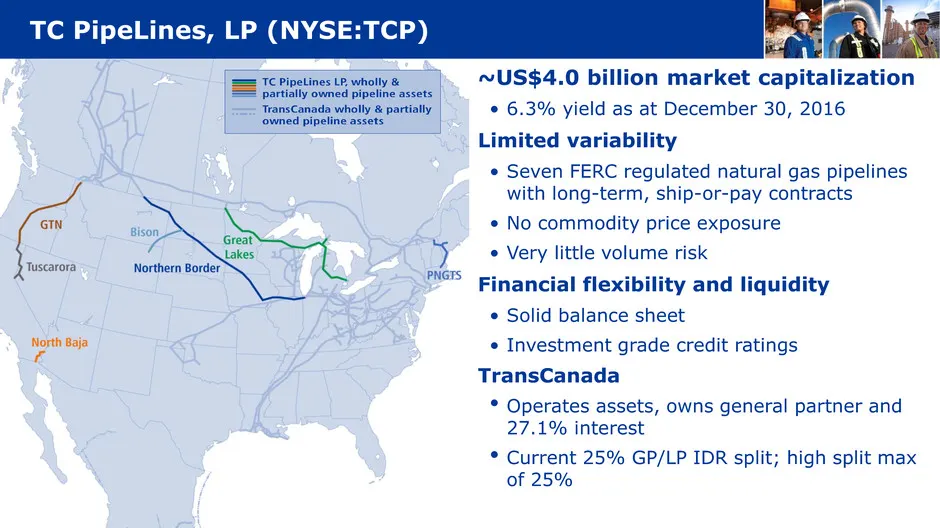
Slide 30: TC PipeLines, LP
~US$4.0 billion market capitalization • 6.3% yield as at December 30, 2016 Limited variability • Seven FERC regulated natural gas pipelines with long-term, ship-or-pay contracts • No commodity price exposure • Very little volume risk Financial flexibility and liquidity • Solid balance sheet • Invest
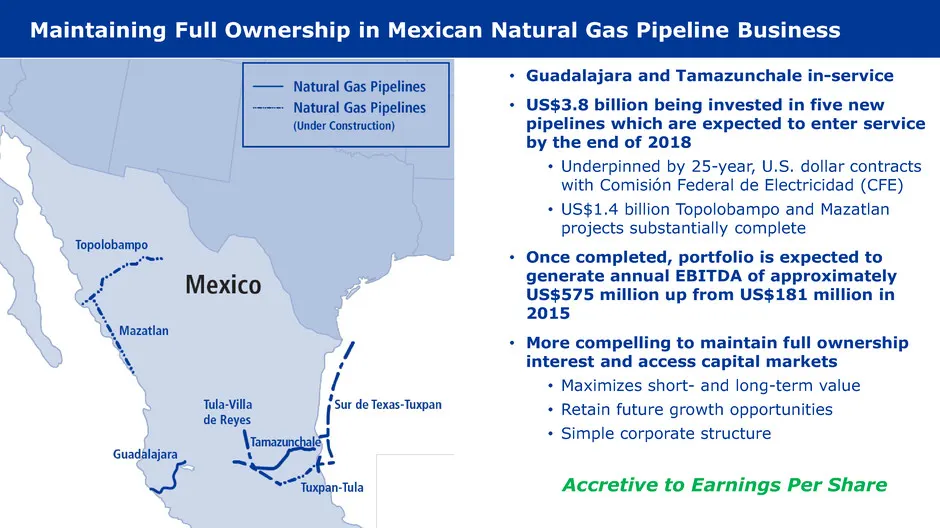
Slide 31: Maintaining Full Ownership in Mexican Natural Gas Pipeline Business
Maintaining Full Ownership in Mexican Natural Gas Pipeline Business • Guadalajara and Tamazunchale in-service • US$3.8 billion being invested in five new pipelines which are expected to enter service by the end of 2018 • Underpinned by 25-year, U.S. dollar contracts with Comisión Federal de Electric
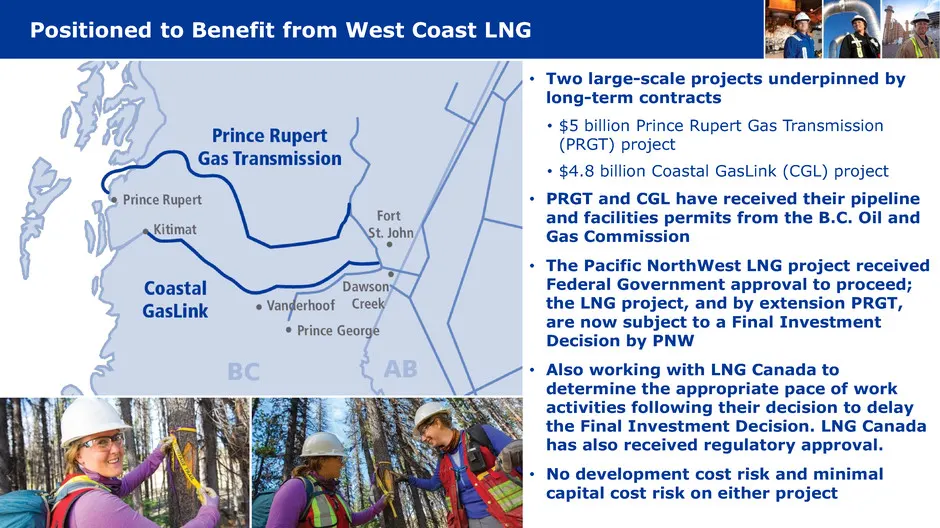
Slide 32: Positioned to Benefit from West Coast LNG
Positioned to Benefit from West Coast LNG • Two large-scale projects underpinned by long-term contracts • $5 billion Prince Rupert Gas Transmission (PRGT) project • $4.8 billion Coastal GasLink (CGL) project • PRGT and CGL have received their pipeline and facilities permits from the B.C. Oil and Gas
Slide 33: Liquids Pipelines
Liquids Pipelines () Teanscanada
Slide 34: Our Liquids Pipelines Strategy
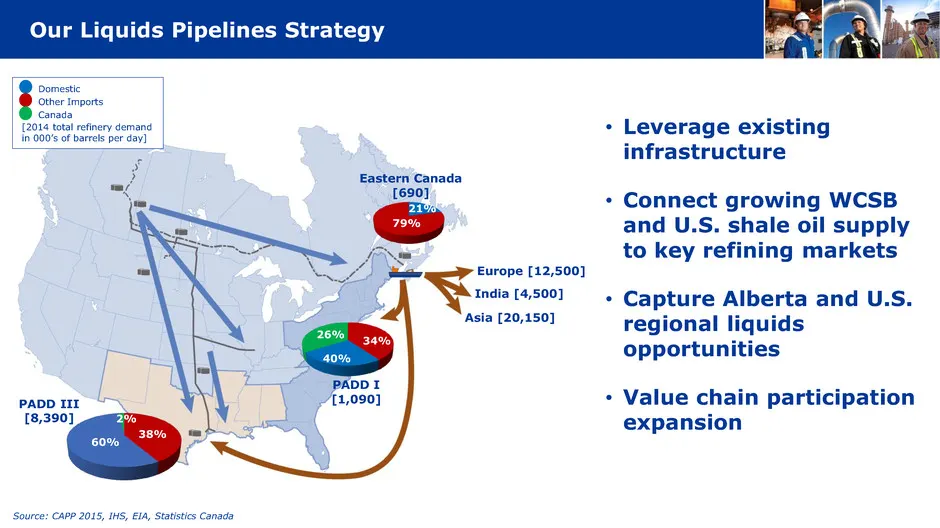
Our Liquids Pipelines Strategy Source: CAPP 2015, IHS, EIA, Statistics Canada PADD I [1,090] Eastern Canada [690] Domestic Other Imports Canada [2014 total refinery demand in 000’s of barrels per day] 60% 38% 2% 40% 34% 26% 79% 21% Asia [20,150] India [4,500] Europe [12,500] PADD III [8,390] • Lever
Slide 35: Extending Keystone System's U.S. Gulf Coast Market Reach
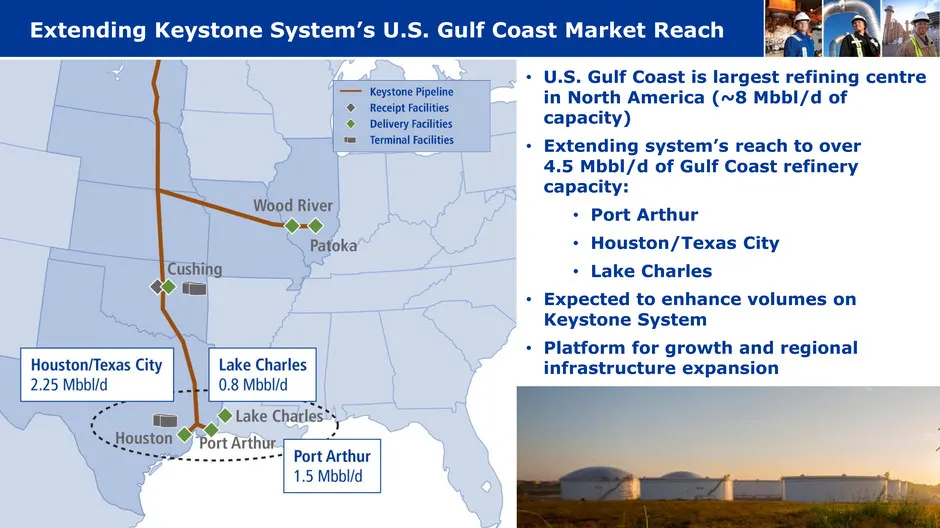
Extending Keystone System’s U.S. Gulf Coast Market Reach • U.S. Gulf Coast is largest refining centre in North America (~8 Mbbl/d of capacity) • Extending system’s reach to over 4.5 Mbbl/d of Gulf Coast refinery capacity: • Port Arthur • Houston/Texas City • Lake Charles • Expected to enhance volume
Slide 36: Keystone XL – Maintaining a Valuable Option
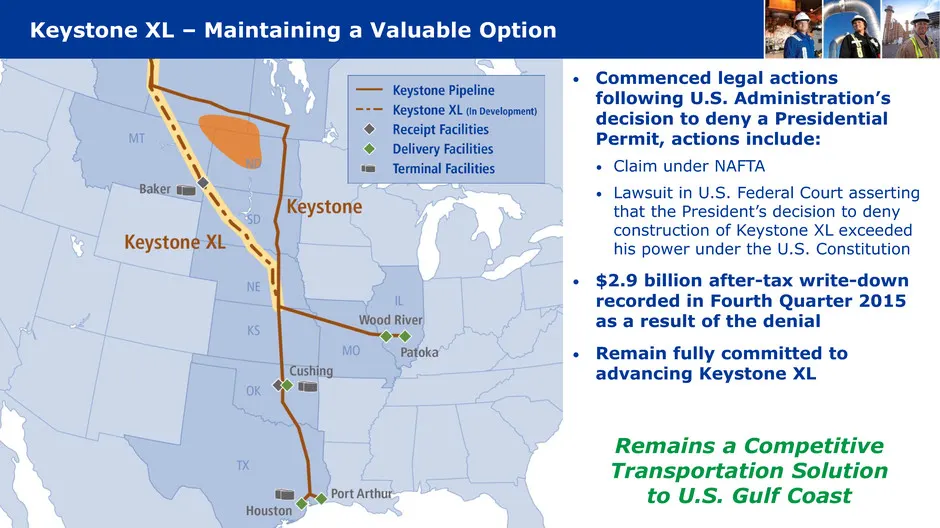
• Commenced legal actions following U.S. Administration’s decision to deny a Presidential Permit, actions include: • Claim under NAFTA • Lawsuit in U.S. Federal Court asserting that the President’s decision to deny construction of Keystone XL exceeded his power under the U.S. Constitution • $2.9 bil
Slide 37: Northern Courier - Visible Liquids Pipeline Growth
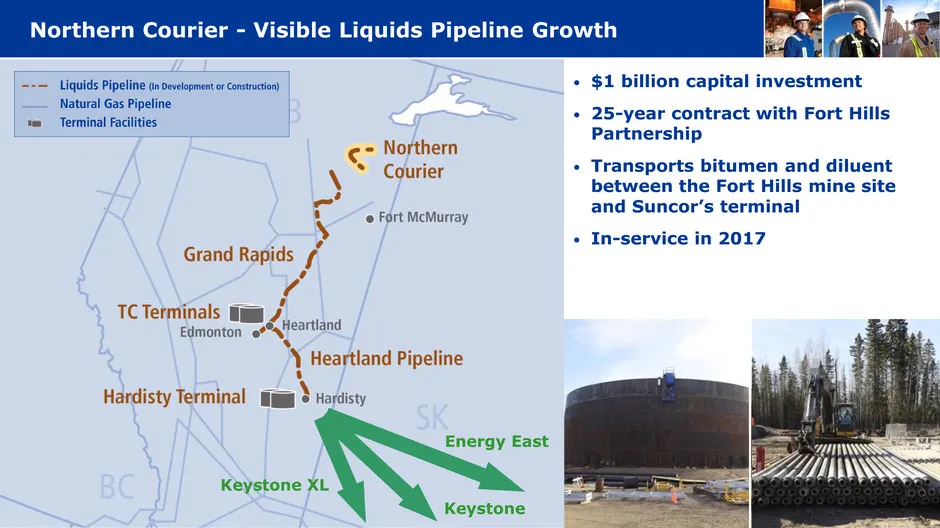
• $1 billion capital investment • 25-year contract with Fort Hills Partnership • Transports bitumen and diluent between the Fort Hills mine site and Suncor’s terminal • In-service in 2017 Northern Courier - Visible Liquids Pipeline Growth Keystone XL Energy East Keystone
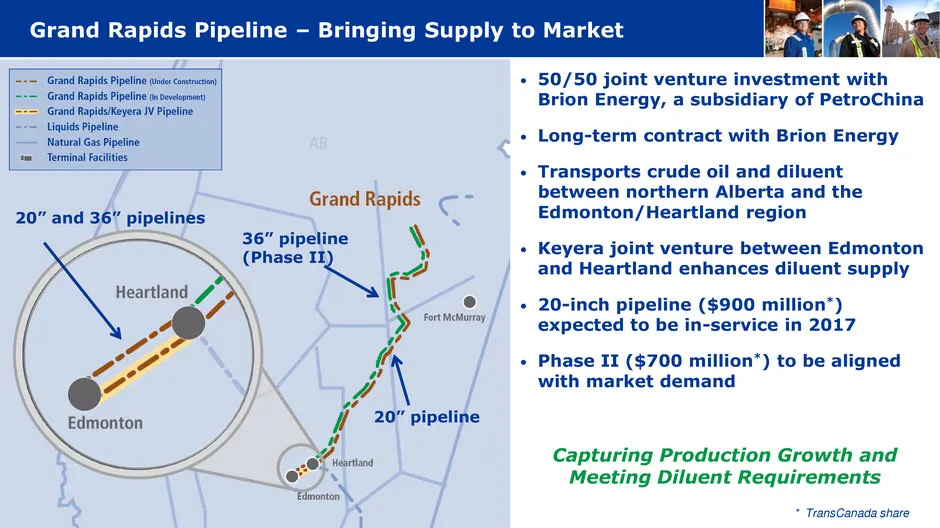
Slide 38: Grand Rapids Pipeline – Bringing Supply to Market
20” and 36” pipelines 20” pipeline 36” pipeline (Phase II) • 50/50 joint venture investment with Brion Energy, a subsidiary of PetroChina • Long-term contract with Brion Energy • Transports crude oil and diluent between northern Alberta and the Edmonton/Heartland region • Keyera joint venture betwee
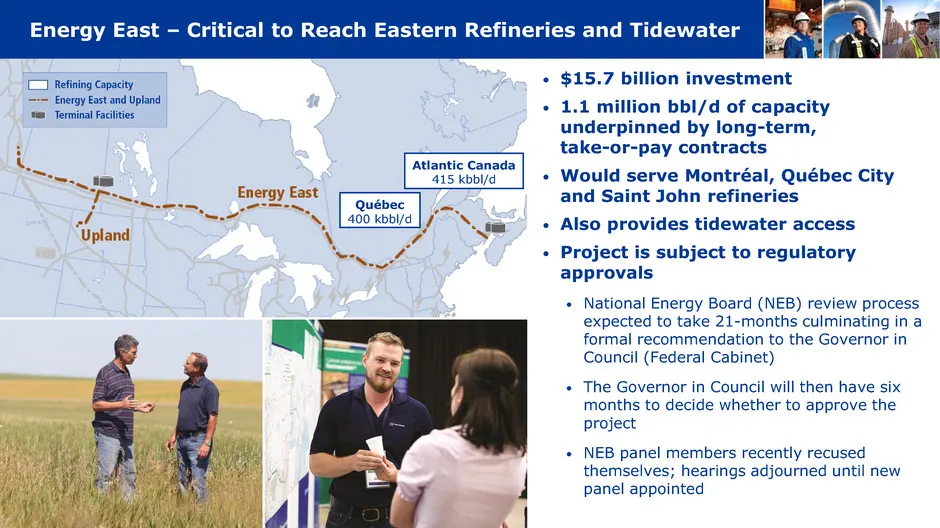
Slide 39: Energy East – Critical to Reach Eastern Refineries and Tidewater
Energy East – Critical to Reach Eastern Refineries and Tidewater • $15.7 billion investment • 1.1 million bbl/d of capacity underpinned by long-term, take-or-pay contracts • Would serve Montréal, Québec City and Saint John refineries • Also provides tidewater access • Project is subject to regulator
Slide 40: Energy
Energy () Teanscanada
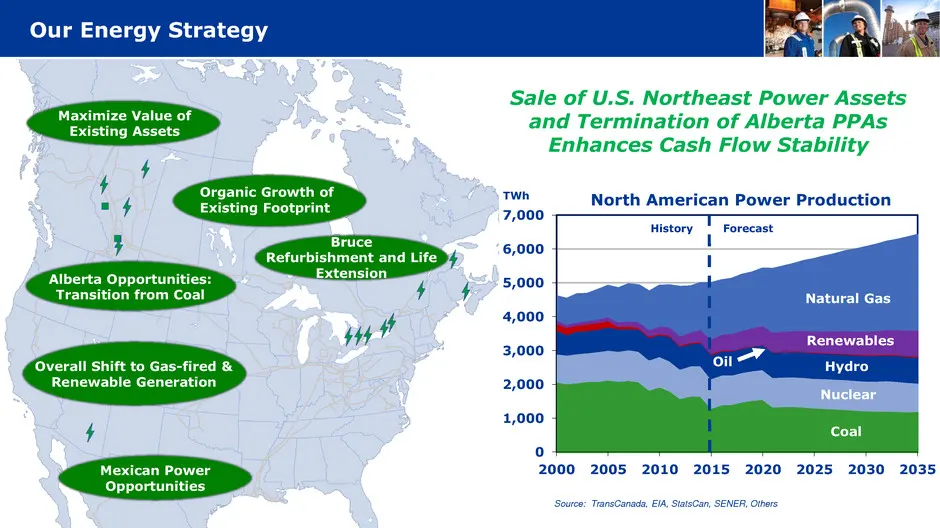
Slide 41: Our Energy Strategy
Our Energy Strategy 0 1,000 2,000 3,000 4,000 5,000 6,000 7,000 2000 2005 2010 2015 2020 2025 2030 2035 Natural Gas Renewables Hydro Nuclear Coal Oil North American Power Production TWh History Forecast Sale of U.S. Northeast Power Assets and Termination of Alberta PPAs Enhances Cash Flow Stability
Slide 42: Bruce Power Life Extension Agreement
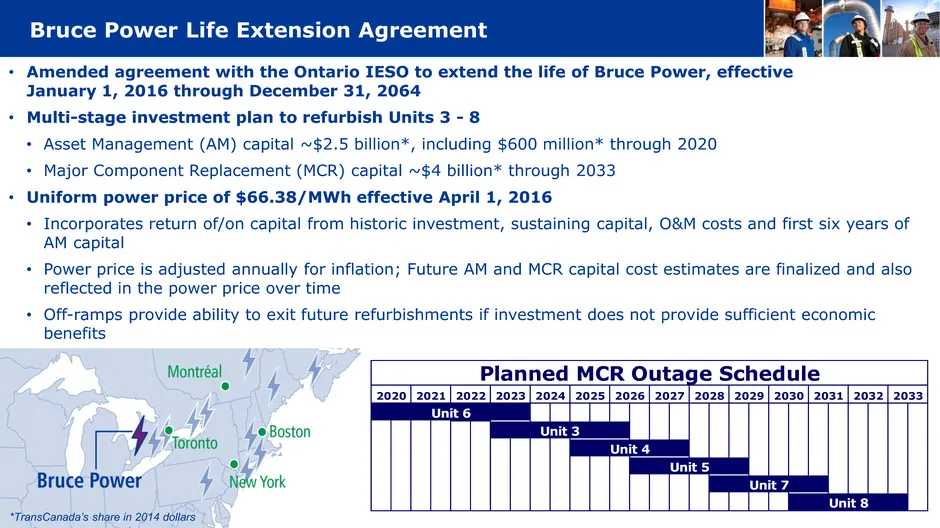
Bruce Power Life Extension Agreement • Amended agreement with the Ontario IESO to extend the life of Bruce Power, effective January 1, 2016 through December 31, 2064 • Multi-stage investment plan to refurbish Units 3 - 8 • Asset Management (AM) capital ~$2.5 billion*, including $600 million* through
Slide 43: Napanee Generating Station
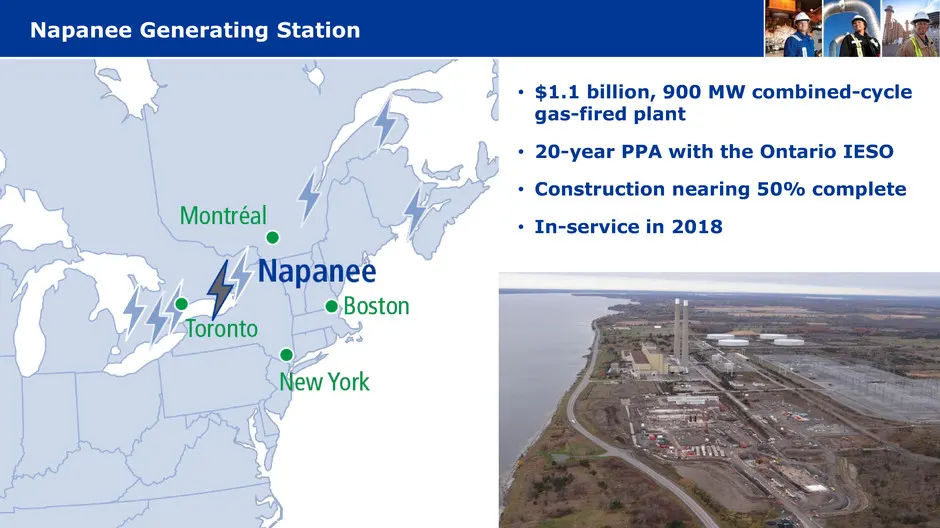
Napanee Generating Station • $1.1 billion, 900 MW combined-cycle gas-fired plant • 20-year PPA with the Ontario IESO • Construction nearing 50% complete • In-service in 2018
Slide 44: Monetization of U.S. Northeast Power Business
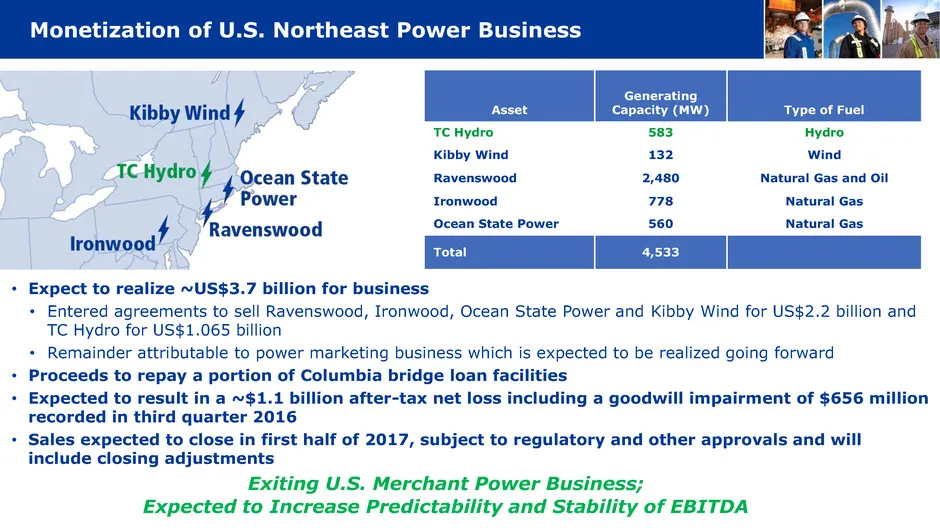
Monetization of U.S. Northeast Power Business • Expect to realize ~US$3.7 billion for business • Entered agreements to sell Ravenswood, Ironwood, Ocean State Power and Kibby Wind for US$2.2 billion and TC Hydro for US$1.065 billion • Remainder attributable to power marketing business which is expect
Slide 45: Termination of Alberta Power Purchase Arrangements
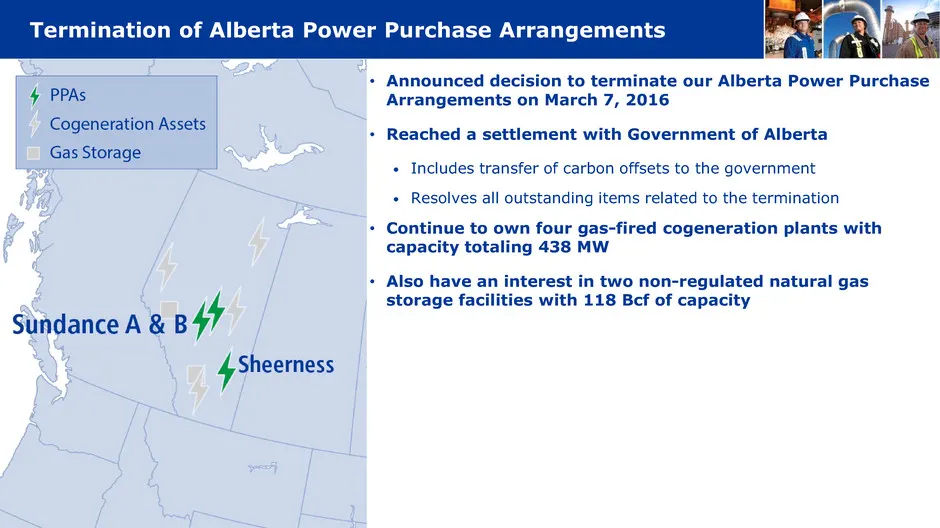
Termination of Alberta Power Purchase Arrangements • Announced decision to terminate our Alberta Power Purchase Arrangements on March 7, 2016 • Reached a settlement with Government of Alberta • Includes transfer of carbon offsets to the government • Resolves all outstanding items related to the term
Slide 46: Finance
Finance () Teanscanada
Slide 47: Financial Strategy
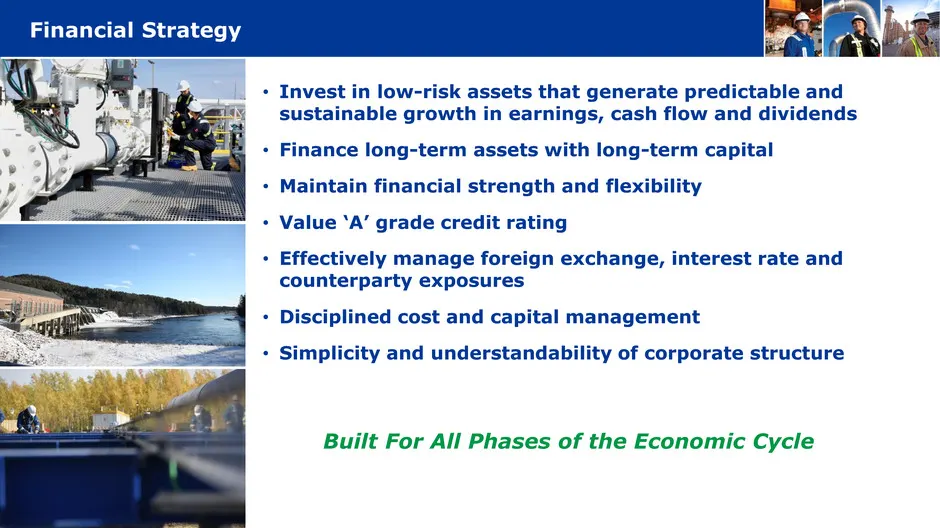
Financial Strategy • Invest in low-risk assets that generate predictable and sustainable growth in earnings, cash flow and dividends • Finance long-term assets with long-term capital • Maintain financial strength and flexibility • Value ‘A’ grade credit rating • Effectively manage foreign exchange,
Slide 48: Financial Position Remains Strong
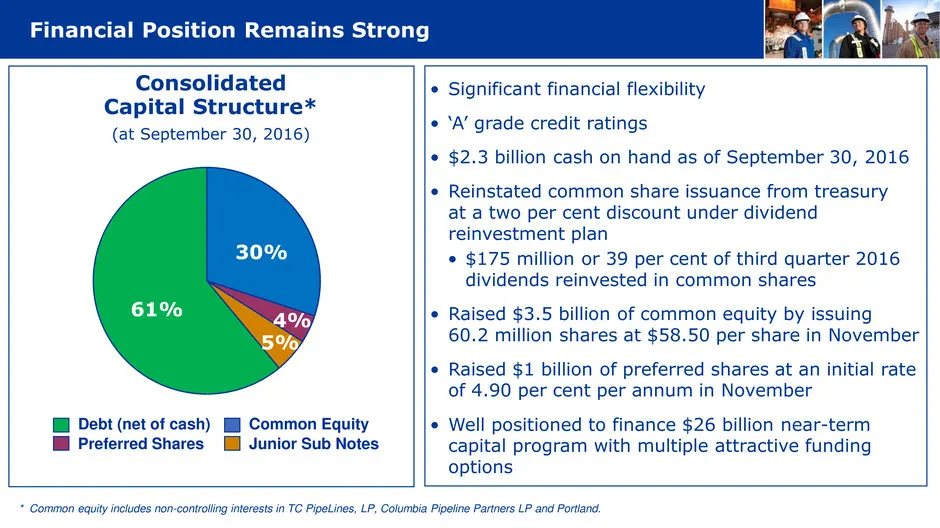
30% 4% 5% 61% Financial Position Remains Strong • Significant financial flexibility • ‘A’ grade credit ratings • $2.3 billion cash on hand as of September 30, 2016 • Reinstated common share issuance from treasury at a two per cent discount under dividend reinvestment plan • $175 million or 39 per ce
Slide 49: Financial Highlights – Nine Months ended September (Non-GAAP)
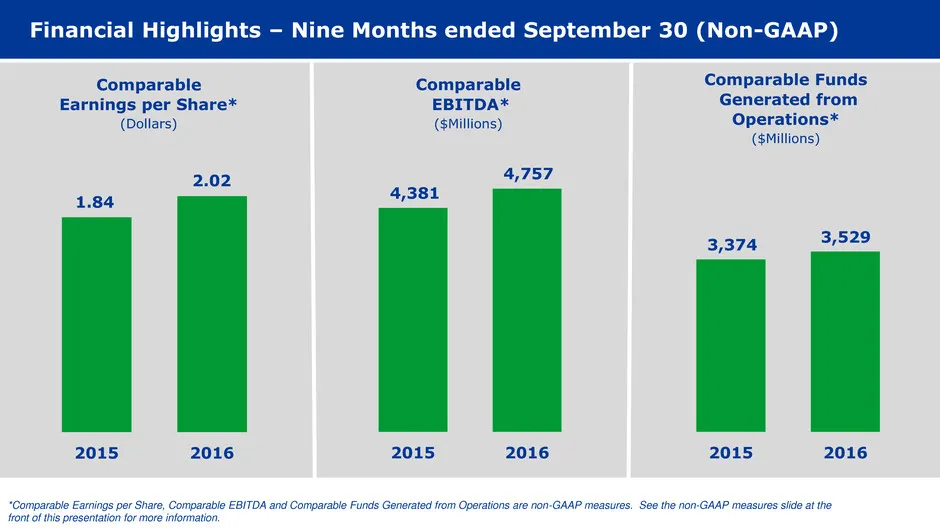
Financial Highlights – Nine Months ended September 30 (Non-GAAP) 2015 20162015 20162015 2016 1.84 2.02 4,381 4,757 Comparable Earnings per Share* (Dollars) Comparable EBITDA* ($Millions) *Comparable Earnings per Share, Comparable EBITDA and Comparable Funds Generated from Operations are non-GAAP mea
Slide 50: Predictability and Stability of EBITDA
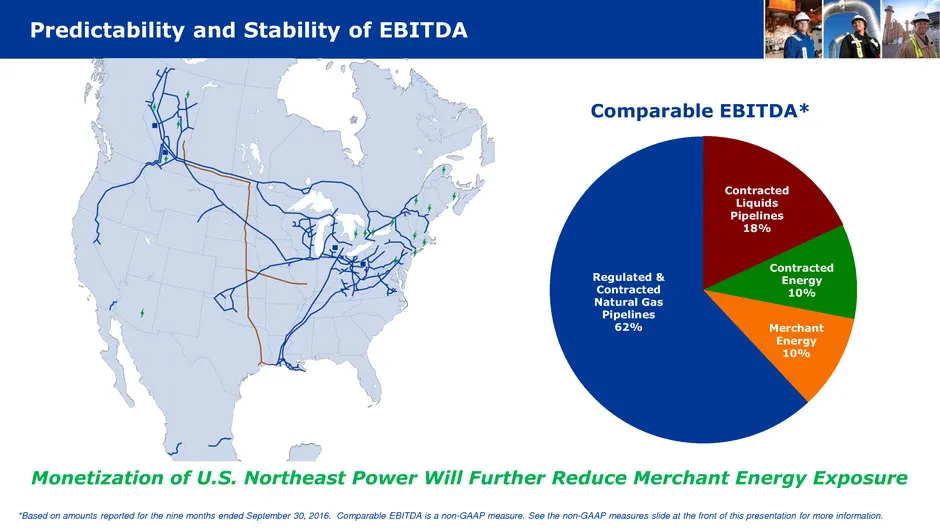
Predictability and Stability of EBITDA *Based on amounts reported for the nine months ended September 30, 2016. Comparable EBITDA is a non-GAAP measure. See the non-GAAP measures slide at the front of this presentation for more information. Comparable EBITDA* Regulated & Contracted Natural Gas Pipel
Slide 51: Strong Historical Financial Performance
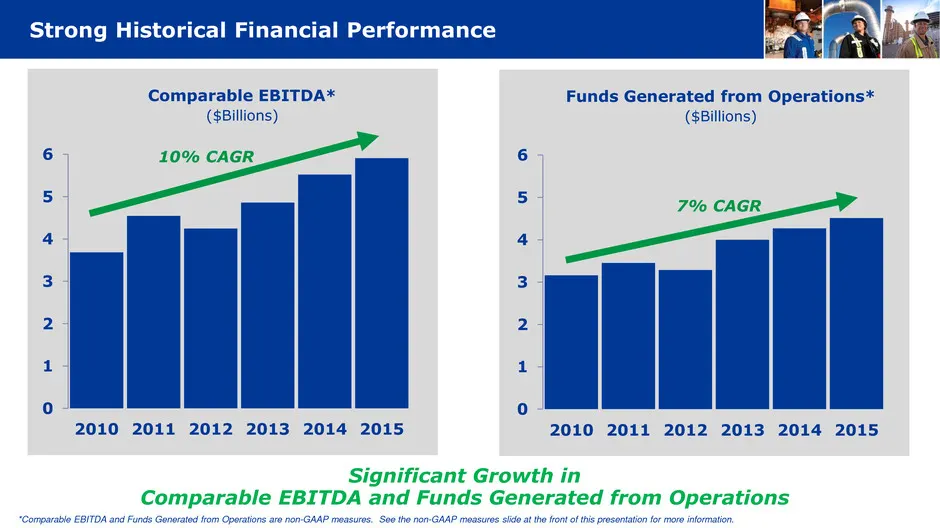
Strong Historical Financial Performance 0 1 2 3 4 5 6 2010 2011 2012 2013 2014 2015 Comparable EBITDA* ($Billions) Significant Growth in Comparable EBITDA and Funds Generated from Operations 0 1 2 3 4 5 6 2010 2011 2012 2013 2014 2015 Funds Generated from Operations* ($Billions) 10% CAGR 7% CAGR *Co
Slide 52: Long Track Record of Dividend Growth
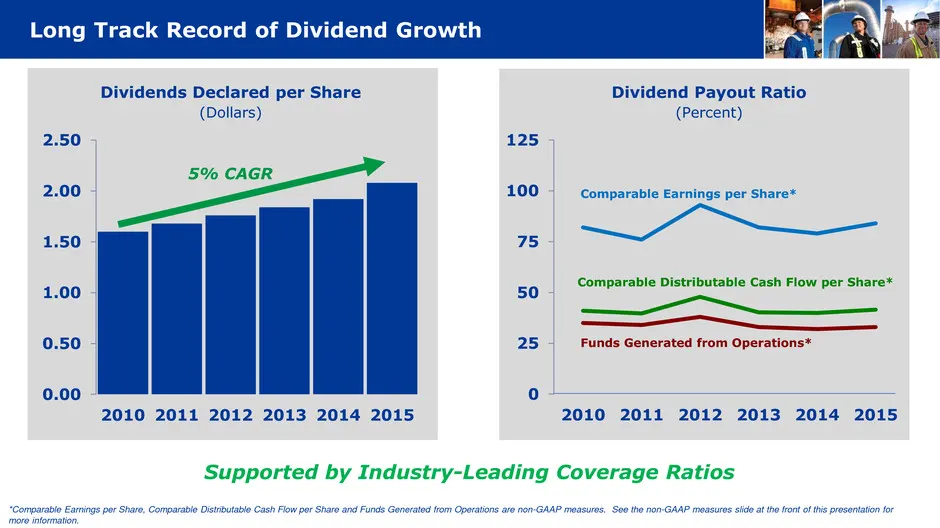
0 25 50 75 100 125 2010 2011 2012 2013 2014 2015 Comparable Earnings per Share* Funds Generated from Operations* Comparable Distributable Cash Flow per Share* Long Track Record of Dividend Growth 0.00 0.50 1.00 1.50 2.00 2.50 2010 2011 2012 2013 2014 2015 Dividends Declared per Share (Dollars) Suppo
Slide 53: Appendix – Reconciliation of Non-GAAP Measures
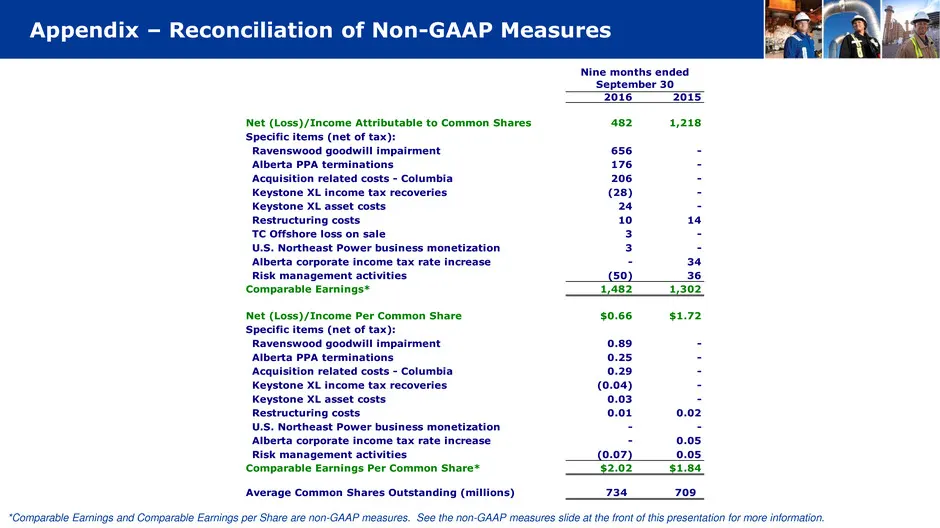
Appendix – Reconciliation of Non-GAAP Measures *Comparable Earnings and Comparable Earnings per Share are non-GAAP measures. See the non-GAAP measures slide at the front of this presentation for more information. 2016 2015 Net (Loss)/Income Attributable to Common Shares 482 1,218 Specific items (net
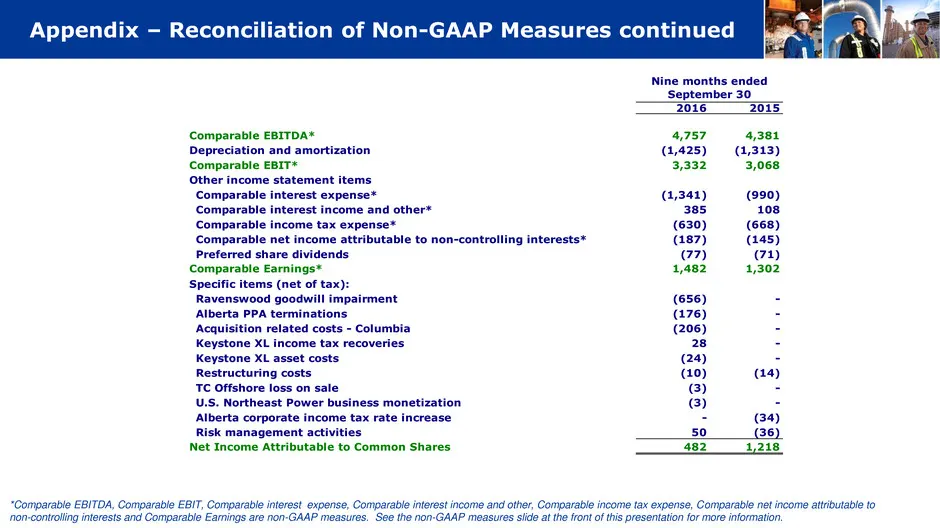
Slide 54: Appendix – Reconciliation of Non-GAAP Measures continued
Appendix – Reconciliation of Non-GAAP Measures continued *Comparable EBITDA, Comparable EBIT, Comparable interest expense, Comparable interest income and other, Comparable income tax expense, Comparable net income attributable to non-controlling interests and Comparable Earnings are non-GAAP measure
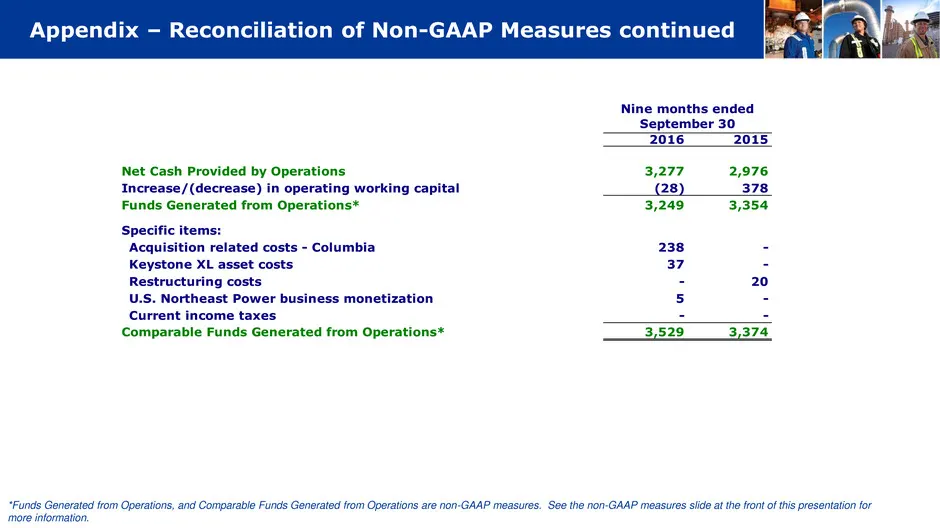
Slide 55: Appendix – Reconciliation of Non-GAAP Measures continued
Appendix – Reconciliation of Non-GAAP Measures continued *Funds Generated from Operations, and Comparable Funds Generated from Operations are non-GAAP measures. See the non-GAAP measures slide at the front of this presentation for more information. 2016 2015 Net Cash Provided by Operations 3,277 2,9
Slide 56: Corporate Profile January 2017
Corporate Profile January 2017
Source: SEC EDGAR · DFAN14A filed Jan 9, 2017