Advanced Digital Information Corp
Advanced Digital Information — Merger or Acquisition (February 2001)
9 slides from Advanced Digital Information's merger presentation, Feb 6, 2001
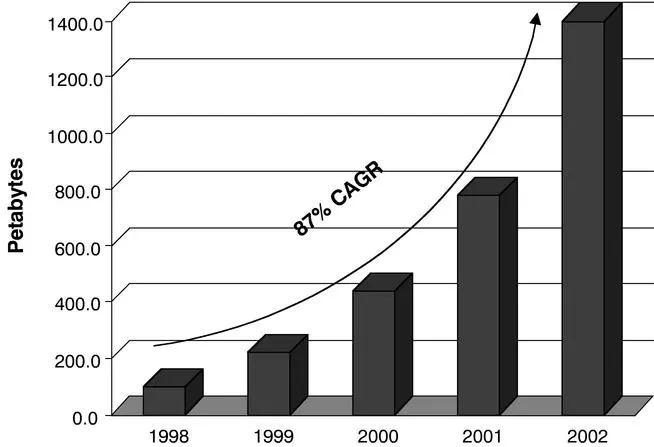
Slide 1: Disk storage capacity sold annually (IDC estimate)
(1) Represents disk storage capacity sold annually as estimated by International Data Corporation.
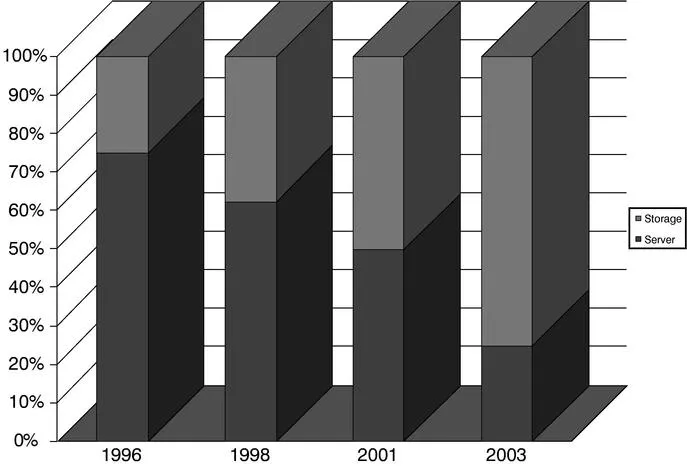
Slide 2: Source: IDC
Source: IDC
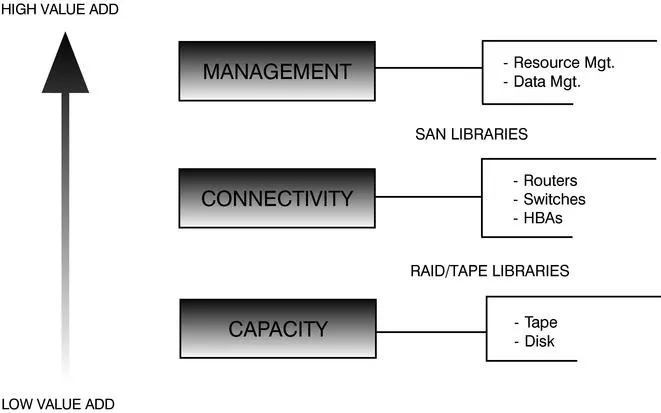
Slide 3: High value add vs. low value add storage segments
HIGH VALUE ADD. LOW VALUE ADD - Resource Mgt. - Data Mgt. SAN LIBRARIES. - Routers - Switches - HBAs RAID/TAPE LIBRARIES - Tape - Disk
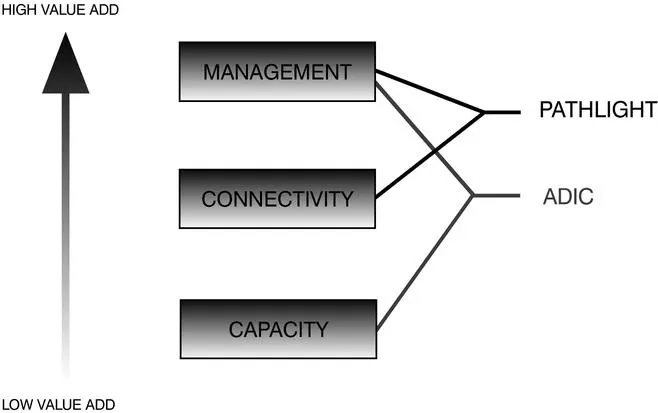
Slide 4: High value add: Pathlight and ADIC
HIGH VALUE ADD PATHLIGHT ADIC LOW VALUE ADD.
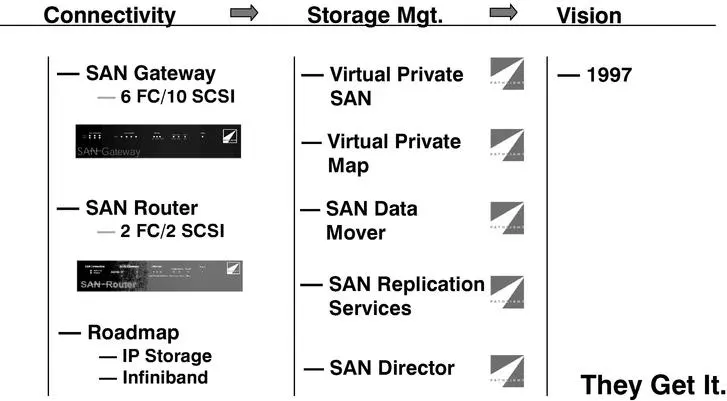
Slide 5: Storage Mgt. = Vision
= Storage Mgt. = Vision — SAN Gateway — Virtual Private Ld | — 1997 6 FC/10 SCSI SAN — virtual Private Map — SAN Router — SAN Data if | 2 FC/2 SCSI Mover Ee — SAN Replication i | Services — Roadmap — IP Storage ' — Infiniband —SAN Director PPG They Get It.
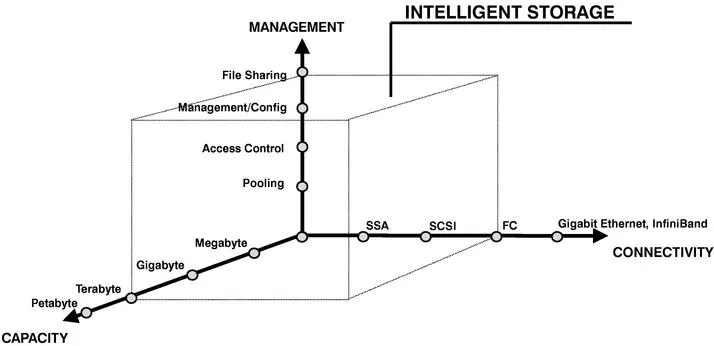
Slide 6: Management: intelligent storage and connectivity
MANAGEMENT q INTELLIGENT STORAGE File Sharing - _-Maiiagement/Config ‘Access Control Pooling Megabyte Gigabyte SSA Gigabit Ethernet, InfiniBand FC CONNECTIVITY Terabyte Peta oe SAPACITY
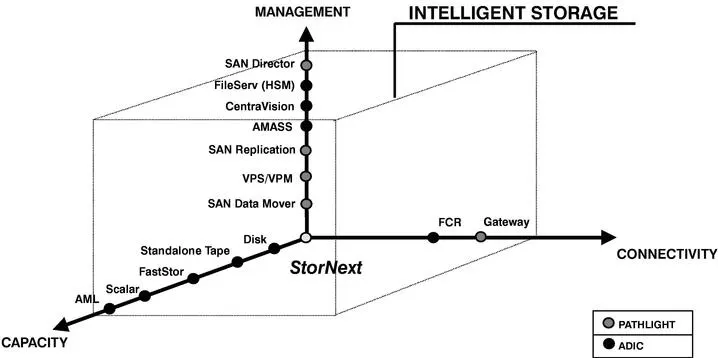
Slide 7: SAN Director and storage product portfolio
‘SAN Director ¢ FileServ (HSM) Contravision AMASS ‘SAN Replication vPsiveM ‘SAN Data Mover Disk Standalone Tape FastStor StorNext CONNECTIVITY aM CAPACITY Teanc |
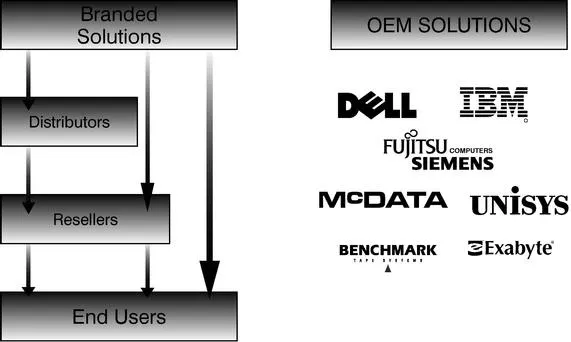
Slide 8: 1000's of Sales Professionals, 1000's of Systems Engineers
1000's of Sales Professionals • 1000's of Systems Engineers
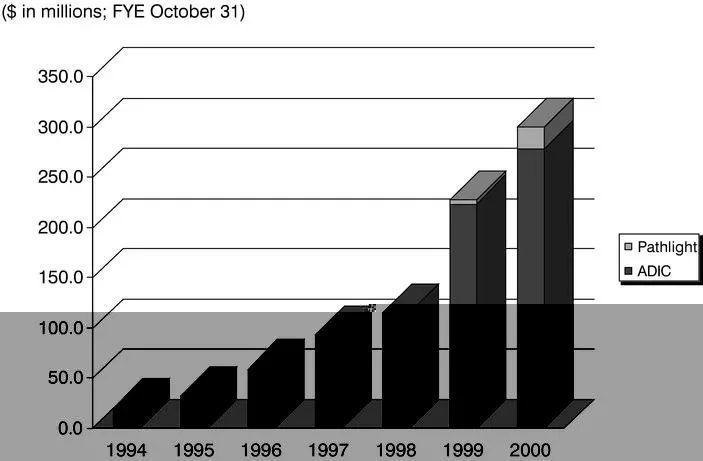
Slide 9: Revenue by fiscal year ($ in millions; FYE October 31)
($ in millions; FYE October 31) 350.0 300.0 250.0 200.0 150.0 100.04 50.07 1994 1995 1996 1997 1998 1999 2000
Source: SEC EDGAR · 425 filed Feb 6, 2001
More decks from Advanced Digital Information Corp
 Advanced Digital Information — Merger or Acquisition (June 2006)42 slides · Jun 5, 2006
 Advanced Digital Information — Merger or Acquisition (May 2006)36 slides · May 11, 2006
 Advanced Digital Information — Merger or Acquisition (May 2006)23 slides · May 3, 2006
 Advanced Digital Information — Merger or Acquisition (May 2006)18 slides · May 3, 2006